Institute for Research on Poverty Discussion Paper no. 1366-09
Does Debt Discourage Employment and Payment of Child Support? Evidence from a Natural Experiment
Maria Cancian Carolyn Heinrich
Yiyoon Chung
Institute for Research on Poverty University of Wisconsin–Madison
July 2009 The authors thank the Institute for Research on Poverty (IRP) for support of this project, IRP programming staff, especially Lynn Wimer, for assistance with data construction, Steven Cook for advice on data analysis, and Dawn Duren for assistance in preparing the manuscript. Helpful discussions with our colleagues at IRP, the Wisconsin Bureau of Child Support, and especially Judi Bartfeld, Dan Meyer, Kisun Nam, David Pate, Ingrid Rothe, Vicki Turetsky, and Jan VanVleck, are gratefully acknowledged. We also thank participants in the 2006 Association for Public Policy Analysis and Management Annual Research Conference session “Examining the Impacts of Child Support on Parental Behavior” and participants in the John Hopkins University Institute for Policy Studies seminar on March 5, 2009, particularly Burt Barnow, for valuable feedback and suggestions. IRP Publications (discussion papers, special reports, Fast Focus, and the newsletter Focus) are available on the Internet. The IRP Web site can be accessed at the following address: http://www.irp.wisc.edu.
Abstract
Despite substantial technological improvements to the child support enforcement program, many
single parents do not receive child support. Particularly for families whose incomes are below the poverty
level, child support is frequently a vital financial resource. The federal government’s primary motivation
for establishing the federal Child Support Enforcement (CSE) program was to recover the costs associated
with public assistance payments to poor single-parent families by collecting payments from the
noncustodial parents. In this study, we use variation in the birthing costs over time and across counties in
Wisconsin to identify the effect of child support debt on nonresident fathers’ child support payments and
formal earnings. Our results suggest that higher arrears, in themselves, substantially reduce both child
support payments and formal earnings for the fathers and families that already likely struggle in securing
steady employment and coping with economic disadvantage, a serious unintended consequence of child
support policy.
Does Debt Discourage Employment and Payment of Child Support? Evidence from a Natural Experiment
INTRODUCTION
In Fiscal Year (FY) 2007, more than 60,000 full-time equivalent staff worked in child support
programs in the United States to collect child support and related debt owed from approximately 15.8
million cases (U.S. Department of Health and Human Services, Administration for Children and Families,
2008). Despite substantial enhancements and technological improvements to the child support
enforcement program, and improved outcomes across many indicators, many single parents do not
receive child support, or receive only partial and irregular payments. Over $105 billion in back child
support was reported owed for prior years, and $6.9 billion of this debt was collected and distributed in
FY 2007. Although current support collections were up slightly from FY 2006, total child support debt
continues to grow nationwide, having increased by more than 250 percent in real terms over the last
decade.
Unpaid child support and high levels of child support debt contribute to hardship and disruption
for both custodial parents (CPs) and noncustodial parents (NCPs) and for their children. Particularly for
families whose incomes are below the poverty level, child support is frequently a vital financial resource,
contributing to almost one-third of income among families who receive current support payments
(Sorensen and Oliver, 2002). A recent study of Wisconsin child support cases showed that 20 percent of
families relied on child support for more than half of their income, although only 51 percent of poor
families received some support in at least 10 months of the year (Cancian and Meyer, 2005). The absence
of or deficiencies in child support payments have also been shown to increase conflict between parents
and to reduce NCPs’ contact with their children (Ovwigho et al., 2005; Bartfeld, 2003).
Concerns about these burdens on families, however, were secondary to the federal government’s
primary motivation for establishing the federal Child Support Enforcement (CSE) program—to recover
the costs associated with public assistance payments to poor single-parent families by collecting payments

2
from the noncustodial parents. States collect support payments from NCPs with the assistance of the
federal government in covering administrative costs. Families in the child support system who are
receiving public assistance have been required to assign their rights to child support collections to the
state. The set of CSE tools available to states to enforce collections and impose penalties on delinquent
parents has expanded over time and now includes wage withholding and work requirements; tax
intercepts; the revocation of driver’s, professional, recreational, and occupational licenses and passports;
the imposition of liens on property; asset seizure; and incarceration.
Some apparently unintended consequences of the interactions of the welfare and child support
systems have been a greater likelihood that low-income, never-married NCPs will accumulate a
disproportionate amount of child support debt and face more child support enforcement actions. Poor job
skills and lack of employment opportunities frequently contribute to their inability to pay child support,
and ability to pay is highly correlated with compliance with support orders (Pate, 2002; Bartfeld and
Meyer, 2003; Ha et al., 2006).1
The limited cooperation of parents with the child support collection system raises not only child
support debt but also the level of state resources that are expended on collection efforts (U.S. Department
of Health and Human Services, Administration for Children and Families, 2008). In addition, states bear
There is also some evidence that low-income parents facing substantial
debts and wage withholding are more likely to become discouraged and leave formal employment. In
addition, other policies governing support obligations, such as high interest rate charges on unpaid child
support (12 percent in Wisconsin), have contributed to rapidly growing debt balances (Sorensen et al.,
2007). This problem is aggravated by parents’ poor understanding of policies and procedures for
adjusting child support orders and the subsequent failure to make adjustments to orders in the face of
unemployment, disability, or incarceration (Pate, 2002).
1Note, however, that while higher orders may reduce compliance (often measured as the proportion of ordered support paid), at typical levels, higher orders are not associated with lower absolute payments (Ha et al., 2006).
3
the major burden of other health and social service costs associated with assisting these families.
Recently, many analysts have argued for increased efforts to secure child support, citing the need for non-
welfare income sources for low-income families given the elimination of Aid to Families with Dependent
Children (AFDC) and the subsequent absence of an entitlement to cash assistance (Cancian and Meyer,
2006; Sousa and Sorensen, 2006). However, others have argued that some CSE actions have become
counter-productive, exacerbating a problematic cycle in which parents with large arrears balances are less
willing and able to cooperate with the formal child support system and subsequent payments are reduced
(Bartfeld, 2005; Waller and Plotnick, 2001). Understanding the impact of CSE and growing child support
arrears on child support payment patterns is critical to resolving this debate.
In this paper, we aim to make both a substantive and methodological contribution to the literature
by using a natural experiment to investigate the relationship between child support arrears and child
support case outcomes (including current support payments and formal employment among NCPs).
Disentangling the causal effects of debt is challenging, because high child support arrears may be both a
cause and a consequence of low compliance with child support orders. We take advantage of the fact that
birthing costs, which are charged to the father when an unmarried mother’s childbirth costs are covered
by Medicaid, vary substantially by county and over time and yet have historically been unrelated to other
characteristics of the case. In effect, some fathers with newly established paternity may begin their
relationship with the CSE system with a large debt (due to the birthing cost assessment), while other
fathers with similar case characteristics or backgrounds may not have to bear these early and high debt
burdens. It is this exogenous source of variation that we use to identify the impact of child support arrears
on child support case outcomes.
In the following sections we review previous literature in this area, describe the policy context
that affords our natural experiment, and discuss the data and methods used to derive our results. We then
report findings, which suggest that higher arrears are generally associated with lower child support
payments and lower earnings for fathers, although the patterns of effects vary with fathers’ age and their
4
degree of labor market attachment. We discuss the implications of these results for the causal
interpretation of the relationships described in prior research, as well as for recent policy debates, in the
concluding section.
LITERATURE REVIEW
To identify the true effects of child support arrears and enforcement on child support case
outcomes, one would ideally conduct an experiment in which both debt and current support orders (of
varying amounts) were randomly assigned to noncustodial parents at the onset. One could then study
whether parents facing higher debt burdens and/or support obligations were more likely to fail to pay (and
to encounter additional CSE actions) and the subsequent consequences of these failures for future support
payments, employment activities, and other case outcomes. Although this type of experiment would not
be feasible for legal and ethical reasons, alternative sources of variation in the establishment of payment
expectations (for current support and arrears) might be used to nonexperimentally investigate these
relationships. The successful identification of causal relationships using nonexperimental methods is
frequently challenging, however, and typically relies on one’s ability to make a strong case that one or
more of the sources of variation being used is exogenous (i.e., operates to randomly influence the causal
variable of interest). In this research, we argue that a sizeable component of the initial debt amount
assigned to NCPs (who are assessed birthing costs) varies randomly by county and is uncorrelated with
unobserved characteristics of NCPs that influence compliance or child support case outcomes.
Our study adds to a growing literature that has attempted to understand and estimate the effects of
child support enforcement policy on case outcomes. Researchers have investigated the effects of child
support enforcement on noncustodial parents’ paternity establishment, divorce and remarriage, contact
with their children, employment and earnings, compliance with ongoing child support obligations, and
other outcomes using a variety of methods and data (Aizer and McLanahan, 2006; Bartfeld, 2005; Holzer
et al., 2005; Huang et al., 2005; Carlson et al., 2004; Plotnick et al., 2004; Bartfeld and Meyer, 2003;
5
Argys and Peters, 2001; Bloom et al., 1998; Freeman and Waldfogel, 1998, 2001; Seltzer et al., 1998).
For example, a number of studies have taken advantage of variation in CSE policies across states and over
time (using state and year fixed effects) to identify the effects of stricter child support enforcement on
outcomes such as sexual behavior and fertility (Garfinkel et al., 2003; Plotnick et al., 2004); employment
and labor force participation (Holzer et al., 2005; Freeman and Waldfogel, 1998); and child support
compliance rates (Huang et al., 2005).
In addition, to address concerns about possible unobserved, time-varying heterogeneity across (or
within) states that might be correlated with child support policy and case outcomes, a few of these studies
have also employed a differences-in-differences strategy (using a comparison group) to estimate
outcomes. Holzer et al. (2005) used samples of young black men and comparable white men from the
Current Population Survey to estimate the effects of child support policy on the employment rates of
blacks versus whites (in models that also included state and time dummy variables).2
Other studies, including that of Bartfeld (2005), who used Wisconsin data comparable to ours,
employ an instrumental variables (IV) approach to address the endogeneity problem of unobserved
factors influencing both compliance/arrears and child support case outcomes. Drawing on a cross-
sectional sample of families from the National Survey of Families and Households, Seltzer et al. (1998:
And Freeman and
Waldfogel compared custodial and noncustodial fathers in the same states using data from the Survey of
Income and Program Participation, with the expectation that if unobserved factors were not driving the
results, they would only find effects of CSE policies on noncustodial fathers. Similarly, Aizer and
McLanahan (2006) drew from the Fragile Families and Child Wellbeing Study data to compare the
effects of stricter child support enforcement on the fertility and child investment decisions of single
women relative to married women living in the same state.
2Holzer et al. explain that they attribute the observed effect of child support enforcement policy (an index variable) on whites to unobserved heterogeneity and infer its effects on blacks only from any additional effect that this variable has on that group.
6
173) used as instruments state practice and statute variables—state effectiveness in child support
collections, state CSE expenditures, and information on state statutes governing the collection and
distribution of child support payments—to “purge the child support coefficients of unobserved
characteristics of fathers and families” that might influence parental involvement (their outcome of
interest). The performance of their instruments was weak in some models, and thus, they offered a limited
interpretation of the results in these cases. In her study of the relationship of child support arrears owed to
the state and compliance with ongoing support obligations, Bartfeld (2005) used as an instrument a
dummy variable indicating if the child support order had been in effect for more than one year at the time
a mother entered welfare, which she suggested would be related to arrears but not to current compliance.
Although Bartfeld did not report on the performance of the instrument, the results from her estimation
using actual arrears differed from those of the IV estimation, the latter of which showed that there was no
relationship between child support arrears and compliance with current support orders.
Bartfeld’s (2005) analysis is of particular interest for our study, as she also investigated the
relationship of birthing cost assessments to subsequent compliance with current support orders. In
addition, she distinguished between discretionary obligors and nondiscretionary obligors in her analysis,
where nondiscretionary obligors are those who have consistent formal sector employment, and thus, may
have little control over their support payments (which may be withheld or intercepted automatically).
Although she was not able to find a suitable instrument to use in modeling the impact of birthing costs on
compliance, Bartfeld’s multivariate analysis with a rich set of control variables showed that discretionary
obligors with birthing cost assessments had significantly lower compliance rates in the first 2 years (after
the mother entered welfare). And while this analysis was not able to fully address the standard concerns
about endogeneity, it does suggest that these relationships might merit further exploration with improved
data and methods.
In general, the substantive results of the above studies suggest that there likely are significant
relationships (with important consequences) among child support enforcement activities, the build-up of
7
debt, and subsequent compliance with current support orders and related family outcomes. CSE actions
and expenditures have been shown to be positively related to child support collections (Holzer et al.,
2005; Freeman and Waldfogel, 2001), negatively related to out-of-wedlock births (Aizer and McLanahan,
2006), and to have some modest effects on parental involvement and employment outcomes. In the
analysis that follows, we aim to advance our understanding of these relationships.
CONCEPTUAL FRAMEWORK AND APPROACH TO ANALYSIS
Child support agencies in some states charge the fathers in nonmarital births for medical costs
(including prenatal and perinatal expenses) that are paid for by Medicaid. These assessments (or
“birthing” costs) may result in large additions to the state child support debt of fathers, with no expected
benefits for the custodial parents or their children. Wisconsin is among the few states that routinely
charge birthing costs, with the amounts varying by county and over time.3 As discussed below, there is no
systematic information collected about birthing cost charges over time and across counties. Interviews
with individuals familiar with the system suggest that the level of birthing costs assessed vary with a wide
range of idiosyncratic factors. Correlation analyses do not show any significant relationship between
birthing cost charges and common measures of the strength of child support enforcement.4
3We know of no systematic source of information on the jurisdictions that typically charge Medicaid birthing costs to nonresident fathers. New York and Wisconsin are among the only states known to routinely assess birthing costs. (Personal communication with Vicki Turetsky, March 2009.)
Thus, we make
the assumption that this randomly varying assignment of birthing costs, for child support cases in which
the arrears are primarily or entirely composed of birthing costs, will result in child support debt burdens
that are unrelated to fathers’ income or ability to pay child support, or to the exposure to child support
enforcement efforts.
4For example, using measures for a point in time (in 1998), we found no significant correlation between birthing costs typically assigned in a county and the percent of IV-D cases with paternity established, with a court order, or with collections.

8
Theoretically, we adopt the perspective that orders to make payments on current child support
obligations and payments on arrears may be viewed as a proportional tax on earnings. Child support
orders in Wisconsin are typically assessed at 17 percent of income for the first child. In addition, if
birthing costs constitute more than half (52 percent) of the required current child support order amount,
the assessment of birthing charges will mechanically trigger actions to recover the arrears, including the
establishment of an arrears payment plan and county enforcement actions.5 In a regression analysis using
Wisconsin child support cases with current support orders, we confirmed that the amount of the monthly
child support order is a very strong, statistically significant and positive predictor of the dollar amount of
any monthly arrears payment order.6
Basic principles of taxation theory suggest that the imposition of a proportional tax on earnings is
likely to induce one or both of two contrasting effects on an individual’s work behavior. The first of these
possible behavioral responses is a substitution effect, in which the individual reduces work effort given
that the costs of enjoying more leisure are relatively lower following the assessment of the tax.
Alternatively, the child support and arrears payment burdens may induce individuals to work more hours
in order to attain the same level of net earnings (or take-home pay) after the payment amounts (analogous
Thus, similar to obligations to pay current support orders, we expect
requirements to make payments on arrears balances to function like a proportional tax on the income (or
earnings) of noncustodial parents.
5See http://dcf.wisconsin.gov/publications/dwsc_864_p.htm for additional details on income withholding and other child support payment guidelines.
6The dependent variable in the regression was the dollar amount that a custodial parent was ordered to pay monthly toward arrears for a given case. The predictor variables included the fixed monthly dollar amount of the current child support order due, the amount of the arrears debt balance at the time the order to pay on arrears was established, the current support debt balance, the total number of child support subaccounts for which the noncustodial parent was ordered to pay current support, an indicator for paternity cases, the number of children involved in the case, an indicator for African American and an indicator for never-married parents. In addition to the fixed monthly dollar amount of the current child support order due, the amount of the arrears debt balance at the time the order to pay on arrears was established was also a strong, positive, and precise predictor of the arrears payment order amount. The complete results are available from the authors upon request.
9
to taxes) are deducted. The econometric evidence on the implications of proportional taxation is by and
large inconclusive, in part because the two effects in combination may cancel each other out.
We hypothesize that we may observe differential effects of arrears payment burdens for
noncustodial parents with differing histories of labor force attachment and earnings. If a NCP’s options
for increasing his work hours are limited or difficult to realize, the substitution effect may dominate,
leading the NCP to reduce labor force participation. If instead the NCP has stable employment, he may
not only be able to increase work hours, but he may also be able to take advantage of income exclusions
and deductions that allow him to protect some of his income from taxation and moderate the change in the
relative costs of leisure and work effort (see Feldstein, 1999). For NCPs who work but not continuously
with a stable employer, either effect might dominate.
Recent research has also shown, however, that child support orders are not always updated with
changes in income; in fact, Ha, Meyer, and Cancian (2006) show that it is unusual for orders to change in
ways that are consistent with earnings changes, including the major increases or declines (such as a move
to unemployment). On the other hand, Rich, Garfinkel, and Gao (2006: 4) report that updating of child
support obligations is “more common than not” for families receiving public assistance, and they thus
suggest the effect of child support and debt burdens on NCPs should be to discourage work. If the
updating of orders happens infrequently or does not closely correspond to earnings, one might
alternatively argue that the effect of these burdens will operate more like a lump-sum tax. For those
working in the formal economy, a lump-sum tax, although it has no distortionary effect, is expected to
induce an increase in labor (i.e., an income effect) to offset the lower income (Fullerton, 1991).7
7Because income in the informal economy is not directly subject to CSE, a lump-sum tax creates an incentive to substitute informal for formal employment.
Clearly,
this is an unresolved issue for which bringing more empirical analysis to bear is essential to better
understand the impact of debt burdens on NCP employment and earnings outcomes.

10
As detailed below, we develop a measure of the typical birthing costs charged for Medicaid births
by county and month. This measure is highly correlated with child support arrears but is uncorrelated with
observed (and we assume unobserved) characteristics of birth parents that affect child support payments
and other outcomes of interest (e.g., earnings). In other words, birthing costs satisfy two basic conditions
of instrumental variables (Heckman, 1997): they determine arrears (the “treatment” of interest in this
study) but are mean-independent of the error terms in our outcome equations. Exploiting this instrument,
we estimate the relationship between child support arrears and subsequent child support payments. We
also estimate the relationship between arrears and nonresident fathers’ formal earnings, and we
investigate how this relationship might differ for fathers’ with stable employment histories versus those
with more limited labor force attachment or no recent earnings.
DATA AND METHODS
We use state administrative records for paternities established in Wisconsin between November
of 1997 and December of 2003. All cases meet the following selection criteria: the mother is the custodial
parent, the father is assessed birthing costs in one of the 23 counties for which we have developed
information on typical birthing charges, and the child is the first born to the father (enabling us to match
the birthing charges to a particular child). We also restrict our sample to those for whom we observe
father and child’s date of birth, date of paternity establishment, and father’s Social Security number (to
allow matching with earnings records). A full explanation of the sample selection criteria is included in
Appendix A. Our final sample for analysis includes 12,631 fathers.
We also developed our measure of typical birthing costs from these administrative data. Because
we know of no documentation of historical birthing costs by county, we used the administrative data to
determine the modal birthing cost in each county and month. We included in our analysis the 23 counties
(of a total of 72) for which we had sufficient numbers of observations and sufficiently regular cost
amounts, so that we could measure a typical birthing cost amount that was unrelated to the characteristics
11
of the individual cases in that county and month.8 It is also important to note that these 23 counties
included 80 percent of the total number of Wisconsin child support cases with paternity established. For a
few counties and periods, when it appears that a new birthing charge was phased in over time, we allow
there to be two “typical” birthing costs in a given county and month.9
For the 12,631 cases in our sample, the simple correlation between actual birthing costs charged
to the father and the typical county/month costs is 0.75. Across all the county/months included in this
analysis, the median proportion of cases in which the actual birthing cost charge matched the typical cost
was 81 percent. Typical birthing charges are also highly correlated with total arrears—0.60 at the
beginning of year 1, and 0.27 at the beginning of year 2. As anticipated, these simple statistics suggest
that county/month variation in birthing costs will serve as an effective instrument—generally invariant to
fathers’ individual characteristics but highly correlated with arrears.
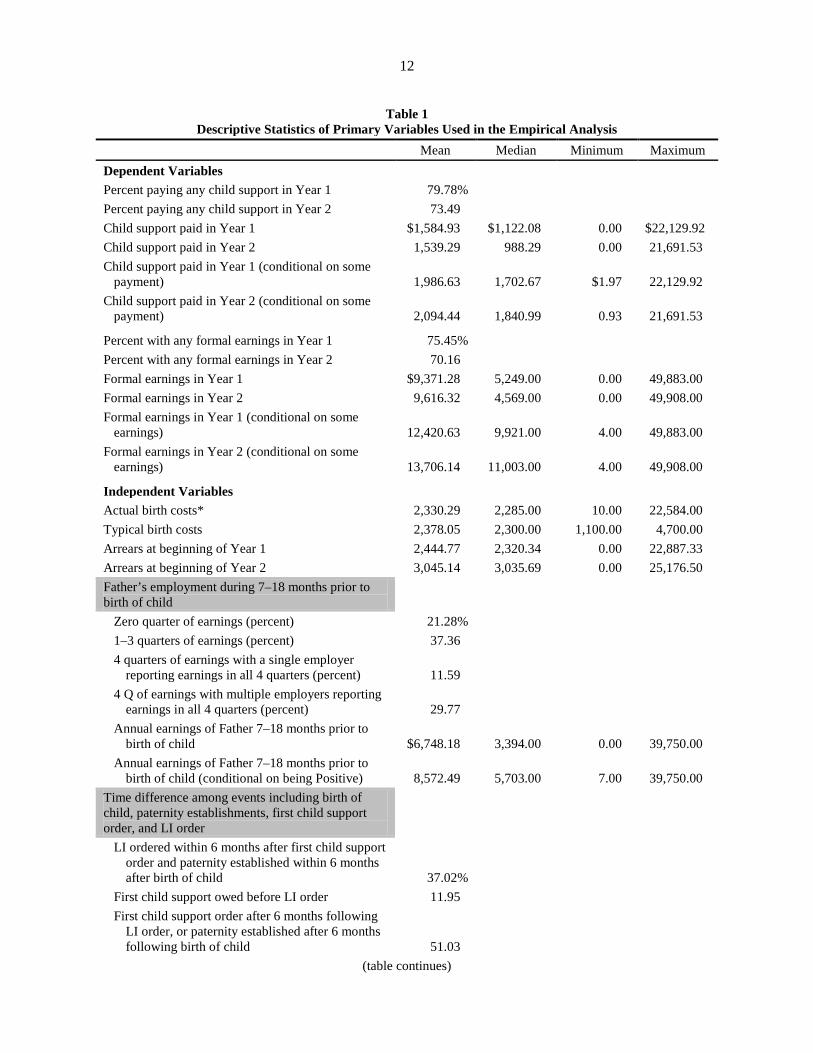
Table 1 shows the means of the primary variables used in our analysis, including actual and
typical birthing costs. Actual birthing costs charged to fathers ranged from $10 to $22,584, with a mean of
$2,330. Our measure of typical birthing costs in a county/month ranged from $1,100 to $4,700, with a
mean of $2,378. Seventy-nine percent of fathers had pre-birth annual earnings, which averaged $8,572
per year for those with any earnings. Low earnings are expected given a relatively young sample who had
fathered children outside of marriage (over 40 percent of the fathers were under 21 at the time the child
was born, and thus even younger when pre-birth earnings were measured), and who had a low-income
partner eligible for Medicaid. The top panel of Table 1 shows our dependent variables. Eighty percent of
fathers paid some child support in the first year, and 73 percent paid in the second year. Among those
8We include 23 counties for 6 years and 3 months, for a total of 1725 county/months. Of these we exclude 40 individual county/months because of insufficient sample sizes and/or inconsistent patterns of birthing costs, for a total of 1,685 county/months. See Appendix B for details regarding the determination of typical birthing costs.
9We assign to each case the most frequent birthing cost (first typical cost) for the relevant county and month if the absolute difference between observed birthing cost for that case and the first typical cost is less than $150, or otherwise the closest of the two typical charges. Details of the procedures followed in determining typical birthing costs are provided in Appendix B.
12
Table 1 Descriptive Statistics of Primary Variables Used in the Empirical Analysis
Mean Median Minimum Maximum Dependent Variables
Percent paying any child support in Year 1 79.78% Percent paying any child support in Year 2 73.49 Child support paid in Year 1 $1,584.93 $1,122.08 0.00 $22,129.92
Child support paid in Year 2 1,539.29 988.29 0.00 21,691.53 Child support paid in Year 1 (conditional on some
payment) 1,986.63 1,702.67 $1.97 22,129.92 Child support paid in Year 2 (conditional on some
payment) 2,094.44 1,840.99 0.93 21,691.53 Percent with any formal earnings in Year 1 75.45%
Percent with any formal earnings in Year 2 70.16 Formal earnings in Year 1 $9,371.28 5,249.00 0.00 49,883.00
Formal earnings in Year 2 9,616.32 4,569.00 0.00 49,908.00 Formal earnings in Year 1 (conditional on some
earnings) 12,420.63 9,921.00 4.00 49,883.00 Formal earnings in Year 2 (conditional on some
earnings) 13,706.14 11,003.00 4.00 49,908.00 Independent Variables
Actual birth costs* 2,330.29 2,285.00 10.00 22,584.00 Typical birth costs 2,378.05 2,300.00 1,100.00 4,700.00 Arrears at beginning of Year 1 2,444.77 2,320.34 0.00 22,887.33 Arrears at beginning of Year 2 3,045.14 3,035.69 0.00 25,176.50 Father’s employment during 7–18 months prior to birth of child
Zero quarter of earnings (percent) 21.28% 1–3 quarters of earnings (percent) 37.36 4 quarters of earnings with a single employer
reporting earnings in all 4 quarters (percent) 11.59 4 Q of earnings with multiple employers reporting
earnings in all 4 quarters (percent) 29.77 Annual earnings of Father 7–18 months prior to
birth of child $6,748.18 3,394.00 0.00 39,750.00 Annual earnings of Father 7–18 months prior to
birth of child (conditional on being Positive) 8,572.49 5,703.00 7.00 39,750.00 Time difference among events including birth of child, paternity establishments, first child support order, and LI order
LI ordered within 6 months after first child support order and paternity established within 6 months after birth of child 37.02%
First child support owed before LI order 11.95 First child support order after 6 months following
LI order, or paternity established after 6 months following birth of child 51.03
(table continues)
13
Table 1, continued Mean Median Minimum Maximum Whether father has additional legal obligations for a child in the post baseline periods.
No more child within a year (percent) 74.05% Fathers who have additional legal obligations for a
child of the same partner within a year (percent) 8.96 Fathers who have additional legal obligations for a
child of another mother within a year (percent) 16.99 No more child within two years (percent) 68.78 Fathers who have additional legal obligations for a
child of the same partner within two years (percent) 11.25
Fathers who have additional legal obligations for a child of another mother within two years (percent) 19.97
Age of Father at Birth of Child 17–20 41.35 21–24 32.61 25–28 13.29 29+ 12.75 Race of Father White 41.64 Black 38.59 Others 10.31 Missing 9.46 County of Child Support Order Milwaukee 40.45 Racine 7.07 Dane 6.67 Brown 4.93 Kenosha 4.25 Other 18 Counties included 36.63 Year of child’s birth 1998 22.59 1999 19.44 2000 18.38 2001 18.07 2002 15.54 2003 5.98 *Actual birthing costs are not included in the models and are shown here for reference only. Cases in which the
year of child’s birth is 1998 include 3.26 percent (n=412) cases in which child was born in November or December of 1997. N=12,631.
14
paying some support, median amounts were $1,703 and $1,841 in the first and second year, respectively.
This is a substantial portion of earnings for many fathers; among the 75 percent of fathers with formal
earnings in the first year following the birthing costs order, median earnings were just below $10,000.10
In estimating the relationship between child support arrears and nonresident fathers’ subsequent
child support payments and formal earnings, we employ two basic approaches. In the first set of models,
we simply include typical birthing costs in an ordinary least squares (OLS) regression with other control
variables to assess their effects on child support paid and father’s formal earnings. As indicated above,
typical birthing costs vary by county and over time and are highly correlated with total arrears.
11 In the
second (IV) specification, we estimate a two-stage model. In the first stage, we predict total arrears with
our typical birthing cost measure (varying by county and over time) as the focal instrumental variable,
and we also include other county-level measures of baseline12
In both of the above approaches to identification, we include interactions of the birthing cost
measures with measures of fathers’ employment histories (prior to the birth of their first child) in the
outcome models. Specifically, we constructed four measures of fathers’ employment histories: an
labor market conditions (average earnings
by industry and industry employment shares) that we expect may influence arrears but are unrelated to
fathers’ characteristics that affect child support payments and earnings. This first stage model also
includes measures of fathers’ labor market histories, baseline demographic characteristics (e.g., age, race,
family composition), and county dummies. Predicted arrears from this first-stage estimation were then
entered into the second stage outcome models to assess the relationship between arrears and the outcomes
of interest.
10Note that the Wisconsin child support guidelines generally call for a father of one child to pay 17 percent of income in support.
11We use our measure of typical birthing costs, which are unrelated to father’s individual characteristics, rather than actual birthing costs assessed for the individual case. Estimates using actual birthing costs are qualitatively similar.
12Our baseline is defined as the first full quarter after we observe both positive child support owed and an order to pay birthing costs.
15
indicator for fathers who worked 1–3 quarters during the 7–18 months prior to the birth of their first
child; an indicator for fathers who worked all four quarters of the 7–18 months before the birth of their
first child for a single (the same) employer; an indicator for fathers who worked for all four quarters and
had more than one employer in the 7–18 months before the birth of their first child; and an indicator for
fathers who had no (zero) earnings reported during the 7–18 months prior to the birth of their first child.
The three measures for fathers with at least some employment prior to the birth of their first child were
entered into the outcome model and also interacted with typical birthing costs (or with predicted arrears)
in the estimation of these models. The objective of estimating these models is to test the differing
predictions of theory discussed above, for which the current base of empirical evidence provides mixed
support or limited insight into the relationship of fathers’ labor market attachment to the added burden of
debt.
RESULTS
We first consider whether child support debt discourages payment of child support. Birthing
costs, assessed at the beginning of a father’s child support payment experience and varying randomly
across county and month (that is, independently of fathers’ own characteristics), provide an opportunity to
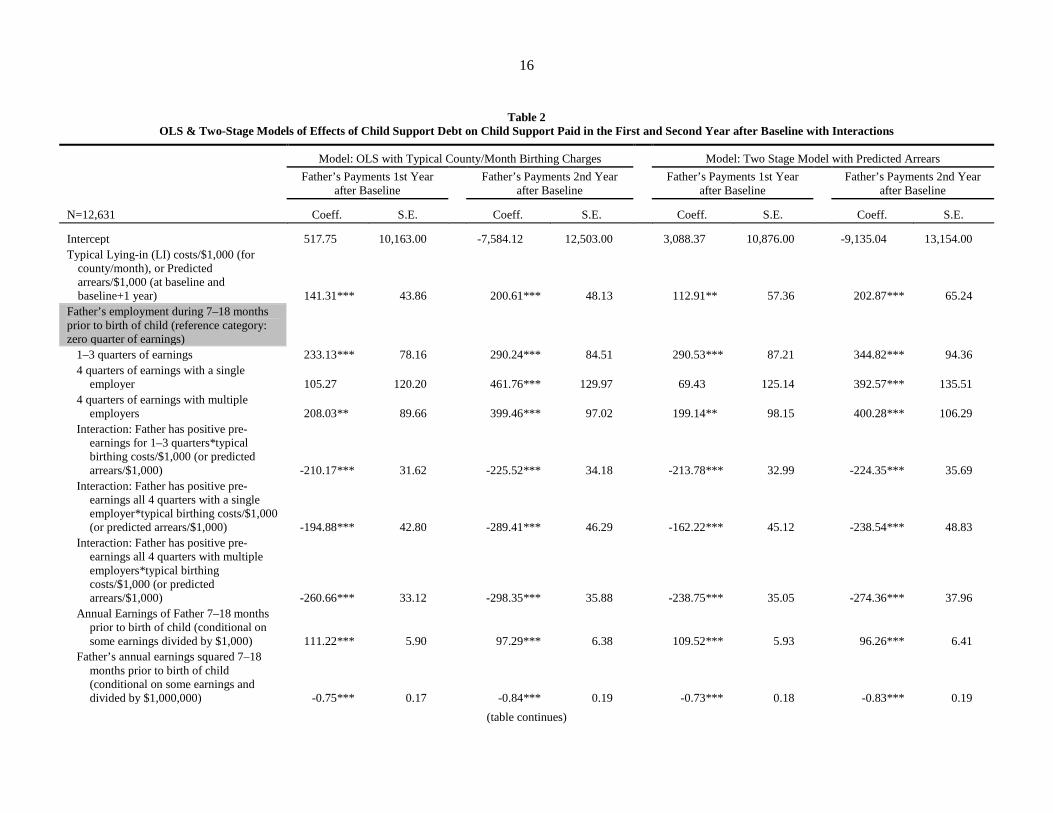
identify the effects of child support debt on child support payments. Table 2 shows two sets of estimates
from the two model specifications with the interactions described above. The first set is based on our
simple estimation of the effects of typical birthing costs using OLS regression. The second set of
estimates are from the two-stage IV model, with typical birthing costs and other exogenous factors used
in the first stage model to predict total arrears, and predicted arrears included in the second stage model to
estimate child support paid. The results of the first-stage estimation are reported in Appendix C, and
decisively confirm the validity of our focal instrument, typical birthing costs, as a strong statistically
significant predictor of total arrears. Other instruments such as the (logged value of) total employment in
a given county and year and employment shares in industry sectors (e.g., construction) are also strong
16
Table 2 OLS & Two-Stage Models of Effects of Child Support Debt on Child Support Paid in the First and Second Year after Baseline with Interactions
N=12,631
Model: OLS with Typical County/Month Birthing Charges
Model: Two Stage Model with Predicted Arrears Father’s Payments 1st Year
after Baseline
Father’s Payments 2nd Year after Baseline
Father’s Payments 1st Year after Baseline
Father’s Payments 2nd Year after Baseline
Coeff. S.E. Coeff. S.E. Coeff. S.E. Coeff. S.E.
Intercept 517.75 10,163.00
-7,584.12 12,503.00
3,088.37 10,876.00
-9,135.04 13,154.00 Typical Lying-in (LI) costs/$1,000 (for
county/month), or Predicted arrears/$1,000 (at baseline and baseline+1 year) 141.31*** 43.86
200.61*** 48.13
112.91** 57.36
202.87*** 65.24
Father’s employment during 7–18 months prior to birth of child (reference category: zero quarter of earnings)
1–3 quarters of earnings 233.13*** 78.16
290.24*** 84.51
290.53*** 87.21
344.82*** 94.36 4 quarters of earnings with a single
employer 105.27 120.20
461.76*** 129.97
69.43 125.14
392.57*** 135.51 4 quarters of earnings with multiple
employers 208.03** 89.66
399.46*** 97.02
199.14** 98.15
400.28*** 106.29 Interaction: Father has positive pre-
earnings for 1–3 quarters*typical birthing costs/$1,000 (or predicted arrears/$1,000) -210.17*** 31.62
-225.52*** 34.18
-213.78*** 32.99
-224.35*** 35.69
Interaction: Father has positive pre-earnings all 4 quarters with a single employer*typical birthing costs/$1,000 (or predicted arrears/$1,000) -194.88*** 42.80
-289.41*** 46.29
-162.22*** 45.12
-238.54*** 48.83
Interaction: Father has positive pre-earnings all 4 quarters with multiple employers*typical birthing costs/$1,000 (or predicted arrears/$1,000) -260.66*** 33.12
-298.35*** 35.88
-238.75*** 35.05
-274.36*** 37.96
Annual Earnings of Father 7–18 months prior to birth of child (conditional on some earnings divided by $1,000) 111.22*** 5.90
97.29*** 6.38
109.52*** 5.93
96.26*** 6.41
Father’s annual earnings squared 7–18 months prior to birth of child (conditional on some earnings and divided by $1,000,000) -0.75*** 0.17
-0.84*** 0.19
-0.73*** 0.18
-0.83*** 0.19
(table continues)
17
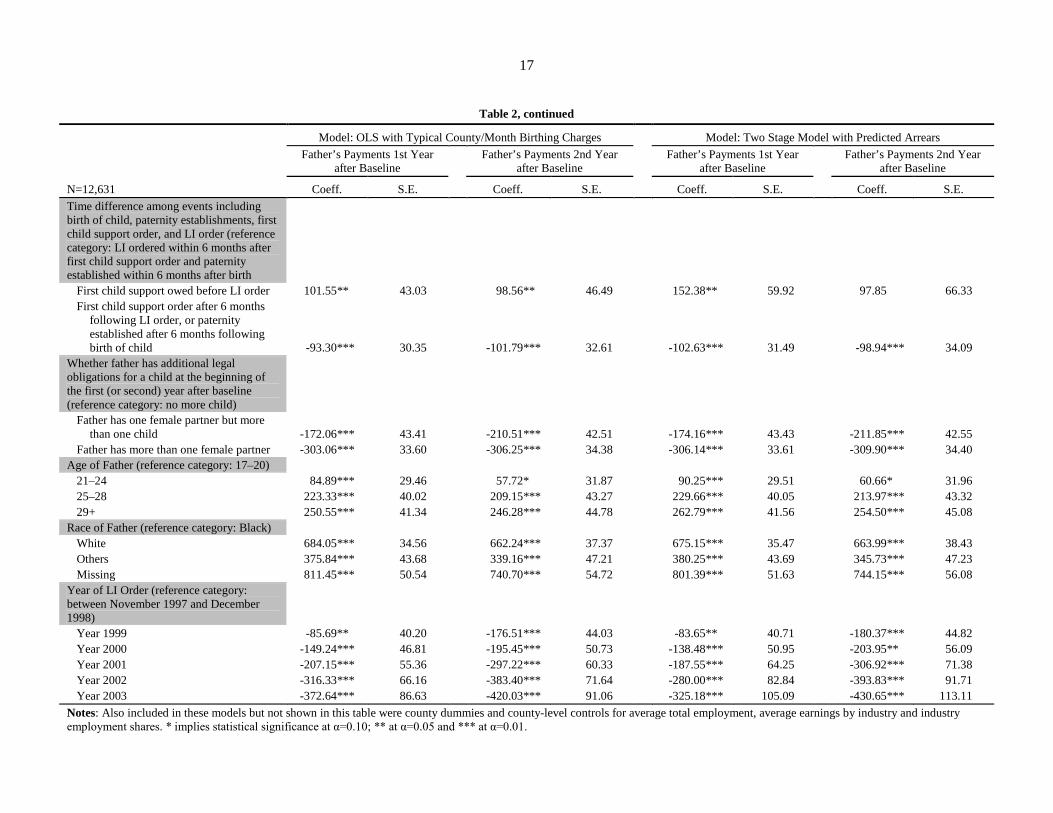
Table 2, continued
N=12,631
Model: OLS with Typical County/Month Birthing Charges
Model: Two Stage Model with Predicted Arrears Father’s Payments 1st Year
after Baseline
Father’s Payments 2nd Year after Baseline
Father’s Payments 1st Year after Baseline
Father’s Payments 2nd Year after Baseline
Coeff. S.E. Coeff. S.E. Coeff. S.E. Coeff. S.E. Time difference among events including birth of child, paternity establishments, first child support order, and LI order (reference category: LI ordered within 6 months after first child support order and paternity established within 6 months after birth
First child support owed before LI order 101.55** 43.03
98.56** 46.49
152.38** 59.92
97.85 66.33 First child support order after 6 months
following LI order, or paternity established after 6 months following birth of child -93.30*** 30.35
-101.79*** 32.61
-102.63*** 31.49
-98.94*** 34.09
Whether father has additional legal obligations for a child at the beginning of the first (or second) year after baseline (reference category: no more child)
Father has one female partner but more than one child -172.06*** 43.41
-210.51*** 42.51
-174.16*** 43.43
-211.85*** 42.55
Father has more than one female partner -303.06*** 33.60
-306.25*** 34.38
-306.14*** 33.61
-309.90*** 34.40 Age of Father (reference category: 17–20)
21–24 84.89*** 29.46
57.72* 31.87
90.25*** 29.51
60.66* 31.96 25–28 223.33*** 40.02
209.15*** 43.27
229.66*** 40.05
213.97*** 43.32
29+ 250.55*** 41.34
246.28*** 44.78
262.79*** 41.56
254.50*** 45.08 Race of Father (reference category: Black)
White 684.05*** 34.56
662.24*** 37.37
675.15*** 35.47
663.99*** 38.43 Others 375.84*** 43.68
339.16*** 47.21
380.25*** 43.69
345.73*** 47.23
Missing 811.45*** 50.54
740.70*** 54.72
801.39*** 51.63
744.15*** 56.08 Year of LI Order (reference category: between November 1997 and December 1998)
Year 1999 -85.69** 40.20
-176.51*** 44.03
-83.65** 40.71
-180.37*** 44.82 Year 2000 -149.24*** 46.81
-195.45*** 50.73
-138.48*** 50.95
-203.95** 56.09
Year 2001 -207.15*** 55.36
-297.22*** 60.33
-187.55*** 64.25
-306.92*** 71.38 Year 2002 -316.33*** 66.16
-383.40*** 71.64
-280.00*** 82.84
-393.83*** 91.71
Year 2003 -372.64*** 86.63
-420.03*** 91.06
-325.18*** 105.09
-430.65*** 113.11 Notes: Also included in these models but not shown in this table were county dummies and county-level controls for average total employment, average earnings by industry and industry employment shares. * implies statistical significance at α=0.10; ** at α=0.05 and *** at α=0.01.
18
predictors in the first-stage model. Since the equation is over-identified (i.e., there are more instruments
than problematic explanatory variables), we expect these strong instruments to yield coefficient estimates
with negligible bias and approximately normal standard errors, given our large sample size (Murray,
2006).
The parameter estimates in these models (in Table 2) are generally consistent with prior research.
Child support payments are higher for fathers with higher earnings, for older fathers, and for non-black
fathers. We also include measures of legal commitments to other mothers and the number of children
(measured at the beginning of the year). Both of these variables are associated with reduced child support
payments in both years. Fathers for whom there is a longer time lag between paternity establishment and
baseline—where the baseline is the first month after the full quarter with both birthing costs and positive
child support owed—pay less support in both years.
The OLS and two-stage models produce patterns of estimated effects of child support debt on
subsequent child support payments that are generally comparable. The OLS estimates suggest that an
additional $1,000 of typical birthing charges increases child support paid by an average of $141 (about 9
percent of average child support paid) in the first year, and $200 (13 percent) in the second year for
fathers with no employment in the 7–18 months prior to the birth of their first child; the comparable two-
stage model estimates suggest increases of $113 and $203, respectively, in child support paid by these
fathers for each $1,000 in predicted arrears. For fathers who were employed in the 7–18 months prior to
the birth of their first child, the estimated effects in both the OLS and two-stage models—taking into
account the statistically significant interactions between labor market attachment and birthing costs—are
all negative, implying reductions in child support paid.13,14
13Child support distribution hierarchies mean that most child support collected would be distributed for current support before going to pay birthing costs. Nonetheless, we also estimated a model in which we included payments towards birthing costs in our measure of payments—to verify that birthing costs were associated with lower total payments, rather than simply with lower payments towards current support. Our results were qualitatively similar, with birthing costs having a statistically significant negative effect on total payments in all four models.
For example, the OLS models show that
19
fathers employed 1–3 quarters prior to birthing charges paid $68.86 less in child support in year 1 and
$24.91 less in year 2 for each $1,000 in typical birthing costs; the two-stage models suggest these fathers
paid $100.87 less in child support in year 1 and $21.48 less in year 2 for each $1,000 in predicted arrears.
In addition, the negative effects are likewise substantial for fathers who worked all four quarters for a
single employer, and they are largest for those who had more than one employer (sequentially or
concurrently) in the 7–18 months before the birth of their first child. Focusing on the two-stage model and
fathers who worked four quarters for multiple employers, we find that fathers pay $126 less in child
support in year 1 and $71 less in year 2 for each $1,000 in predicted arrears. Although we pay a small
price in precision (slightly wider confidence intervals) using the predicted values of arrears, as is typical
for IV estimation, both sets of estimates of the moderating effects of child support debt on payments by
working fathers are statistically significant and suggest substantively important effects.
Automatic wage withholding has made child support payments increasingly nondiscretionary for
fathers working in the formal labor market. As discussed earlier, increased child support debt burdens
may induce some fathers to work more hours in order to attain the same level of take-home pay, while the
substitution effect may dominate for others with limited options for increasing work hours, leading them
to reduce labor force participation. Other low-income fathers facing large debts and substantial wage
withholding may simply become discouraged and leave formal employment. Table 3 shows estimates of
the effects of child support debt on nonresident fathers’ total earnings in the first and second years after
baseline from OLS and two-stage least squares models that parallel those in Table 2. In each of the
models, the effect of birthing costs assessments on earnings (for fathers with no employment in the 7–18
months before the birth of their first child) is positive, although statistically significant only in year 2; a
$1,000 increase in birthing charges is associated with an increase in formal earnings of $430 in the first
post-baseline year and $597 in the second year in the OLS models, and $500 and $947, respectively, in
14In an alternative specification, we excluded cases with zero child support paid. The estimated effects were larger but followed similar patterns.
20
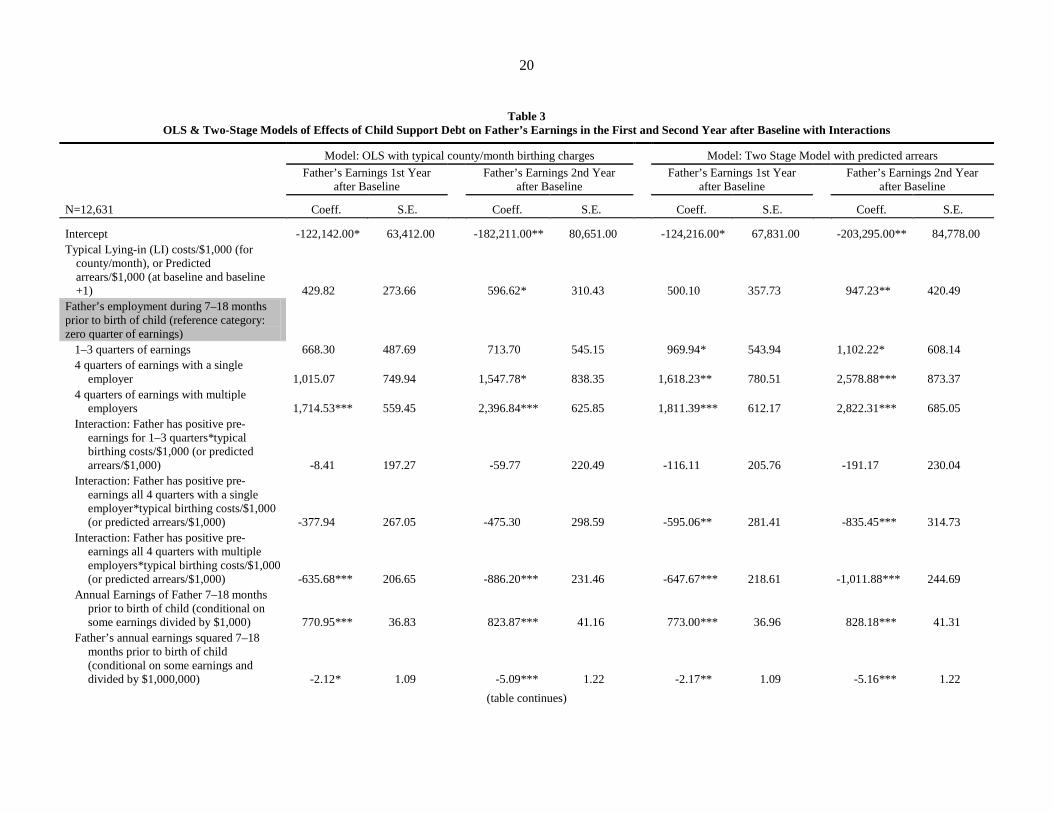
Table 3 OLS & Two-Stage Models of Effects of Child Support Debt on Father’s Earnings in the First and Second Year after Baseline with Interactions
N=12,631
Model: OLS with typical county/month birthing charges
Model: Two Stage Model with predicted arrears Father’s Earnings 1st Year
after Baseline
Father’s Earnings 2nd Year after Baseline
Father’s Earnings 1st Year after Baseline
Father’s Earnings 2nd Year after Baseline
Coeff. S.E. Coeff. S.E. Coeff. S.E. Coeff. S.E.
Intercept -122,142.00* 63,412.00 -182,211.00** 80,651.00 -124,216.00* 67,831.00 -203,295.00** 84,778.00 Typical Lying-in (LI) costs/$1,000 (for
county/month), or Predicted arrears/$1,000 (at baseline and baseline +1) 429.82 273.66 596.62* 310.43 500.10 357.73 947.23** 420.49
Father’s employment during 7–18 months prior to birth of child (reference category: zero quarter of earnings)
1–3 quarters of earnings 668.30 487.69 713.70 545.15 969.94* 543.94 1,102.22* 608.14 4 quarters of earnings with a single
employer 1,015.07 749.94 1,547.78* 838.35 1,618.23** 780.51 2,578.88*** 873.37 4 quarters of earnings with multiple
employers 1,714.53*** 559.45 2,396.84*** 625.85 1,811.39*** 612.17 2,822.31*** 685.05 Interaction: Father has positive pre-
earnings for 1–3 quarters*typical birthing costs/$1,000 (or predicted arrears/$1,000) -8.41 197.27 -59.77 220.49 -116.11 205.76 -191.17 230.04
Interaction: Father has positive pre-earnings all 4 quarters with a single employer*typical birthing costs/$1,000 (or predicted arrears/$1,000) -377.94 267.05 -475.30 298.59 -595.06** 281.41 -835.45*** 314.73
Interaction: Father has positive pre-earnings all 4 quarters with multiple employers*typical birthing costs/$1,000 (or predicted arrears/$1,000) -635.68*** 206.65 -886.20*** 231.46 -647.67*** 218.61 -1,011.88*** 244.69
Annual Earnings of Father 7–18 months prior to birth of child (conditional on some earnings divided by $1,000) 770.95*** 36.83 823.87*** 41.16 773.00*** 36.96 828.18*** 41.31
Father’s annual earnings squared 7–18 months prior to birth of child (conditional on some earnings and divided by $1,000,000) -2.12* 1.09 -5.09*** 1.22 -2.17** 1.09 -5.16*** 1.22
(table continues)

21
Table 3, continued
N=12,631
Model: OLS with typical county/month birthing charges
Model: Two Stage Model with predicted arrears Father’s Earnings 1st Year
after Baseline
Father’s Earnings 2nd Year after Baseline
Father’s Earnings 1st Year after Baseline
Father’s Earnings 2nd Year after Baseline
Coeff. S.E. Coeff. S.E. Coeff. S.E. Coeff. S.E. Time difference among events including birth of child, paternity establishments, first child support order, and LI order (reference category: LI ordered within 6 months after first child support order and paternity established within 6 months after birth
First child support owed before LI order -691.74*** 268.45 -1,214.69*** 299.90 -831.78** 373.71 -1,576.51*** 427.53 First child support order after 6 months
following LI order, or paternity established after 6 months following birth of child -665.25*** 189.34 -757.64*** 210.35 -630.34*** 196.39 -675.57*** 219.73
Whether father has additional legal obligations for a child at the beginning of the first (or second) year after baseline (reference category: no more child)
Father has one female partner but more than one child -311.63 270.86 -284.03 274.23 -311.91 270.89 -281.02 274.22
Father has more than one female partner -982.81*** 209.63 -1,141.33*** 221.79 -985.47*** 209.62 -1,145.10*** 221.73 Age of Father (reference category: 17–20)
21–24 -268.96 183.82 -492.36** 205.55 -271.04 184.08 -505.55** 205.96 25–28 -272.68 249.69 -741.19*** 279.10 -288.16 249.80 -771.43*** 279.19 29+ -887.27*** 257.94 -1,426.86*** 288.84 -900.57*** 259.24 -1,472.22*** 290.57
Race of Father (reference category: Black) White 2,923.41*** 215.65 3,124.58*** 241.05 2,951.71*** 221.25 3,189.44*** 247.69
Others 2,230.64*** 272.50 2,139.72*** 304.53 2,237.53*** 272.48 2,145.29*** 304.41 Missing 3,964.06*** 315.32 4,655.02*** 352.95 3,998.36*** 322.01 4,743.94*** 361.43
Year of LI Order (reference category: between November 1997 and December 1998)
Year 1999 -854.93*** 250.80 -1,175.89*** 284.00 -859.95*** 253.91 -1,228.88*** 288.89 Year 2000 -1,783.01*** 292.08 -1,893.07*** 327.24 -1,818.60*** 317.80 -2,048.25*** 361.50 Year 2001 -2,304.16*** 345.38 -2,328.67*** 389.16 -2,343.81*** 400.74 -2,554.66*** 460.05 Year 2002 -2,968.63*** 412.78 -2,708.84*** 462.11 -3,027.22*** 516.71 -3,038.98*** 591.08 Year 2003 -3,127.70*** 540.54 -2,862.28*** 587.37 -3,209.35*** 655.44 -3,256.54*** 729.00
Notes: Also included in these models but not shown in this table were county dummies and county-level controls for average total employment, average earnings by industry and industry employment shares. * implies statistical significance at α=0.10; ** at α=0.05 and *** at α=0.01.
22
the two-stage models. For fathers employed 1–3 quarters prior to the birth of their first child—taking into
account the interaction between birthing cost charges and recent labor market attachment—the resulting
effect is also positive and larger in year 2 than year 1. In year 2, the OLS model shows that these fathers
earn $537 more for each $1,000 in typical birthing costs, while the two-stage model suggests that they
earn $756 more in year 2 for each $1,000 in predicted arrears. And for fathers working for a single
employer all four quarters prior to the birth of their first child, the moderating effects of birthing cost
charges are again positive but considerably smaller for three of the models ($52 to $121), and in the two-
stage model predicting year 1 earnings, the net effect is negative (reducing earnings by $95).
Table 3 also shows, however, that for fathers working all four quarters in the 7–18 months before
the birth of their first child with more than one employer (sequentially or concurrently), the moderating
effects of additional debt are negative. The OLS models show that these fathers earn $206 less in year 1
and $290 less in year 2 for each $1,000 in typical birthing costs, and the two-stage models suggest
reductions in earnings of $148 and $65, respectively, in years 1 and 2.15
15In an alternative specification, we excluded cases with zero earnings. The estimated effects were larger but again followed similar patterns.
These reductions in formal
earnings are not only statistically significant but are also substantively important, representing up to 2.5
percent of average pre-baseline earnings (and 3 percent of median pre-baseline earnings) for each
additional $1,000 in debt. In general, the results in Table 3 suggest that fathers with less labor market
attachment in the pre-baseline year may have more opportunity for increasing their labor force
participation and earnings, and it appears that on net, they do this in response to the imposition of birthing
costs. For fathers working all four quarters in the pre-baseline year for a single employer, the moderating
effects of birthing costs charges are smaller, likely reflecting their limited ability to increase earnings in
the short term. And for fathers working for more than one employer in the pre-baseline period, we suggest
that the observed negative effect of birthing cost charges may reflect reductions in extra work effort
23
among these fathers in response to this new tax on their earnings; that is, the substitution effect appears to
dominate.16
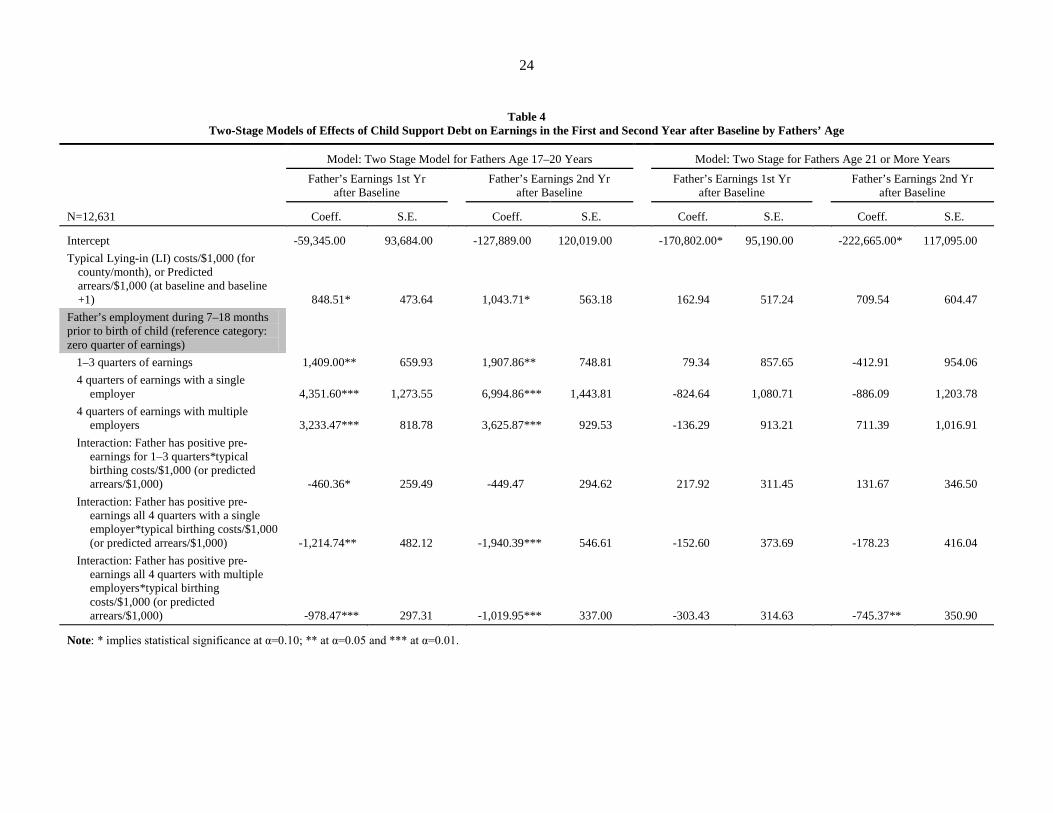
We also estimated the two-stage least squares models shown in Tables 2 and 3 separately for
fathers age 17–20 years and for those age 21 years and older at the birth of their first child. In Table 4, we
first present the key results for the interactions between pre-baseline employment categories and predicted
arrears, along with the main effects for these variables for the earnings outcomes (showing results for
fathers age 17–20 and those 21 years and older side-by-side). What is immediately apparent in this table
is that the moderating effects of birthing cost charges on earnings are experienced primarily by younger
fathers. In fact, while the coefficients on the interaction terms are all statistically significant for fathers
age 17–20 years, only one interaction term for older fathers is statistically significant (for those working
all four quarters for more than one employer in the second year). We generally find that although fathers
are earning more and paying more child support in the second year post-baseline than in the first year
after the imposition of birthing cost charges, the imposition of birthing cost charges has a “discouraging”
(negative) effect on work and child support payments in both years that is clearly stronger for younger
fathers who are first getting a “toehold” in the labor market. In addition, the negative moderating effect of
arrears is actually strongest for young fathers who were working for a single employer all four quarters in
the 7–18 months before the birth of their first child, with large reductions in earnings of $366 in year 1
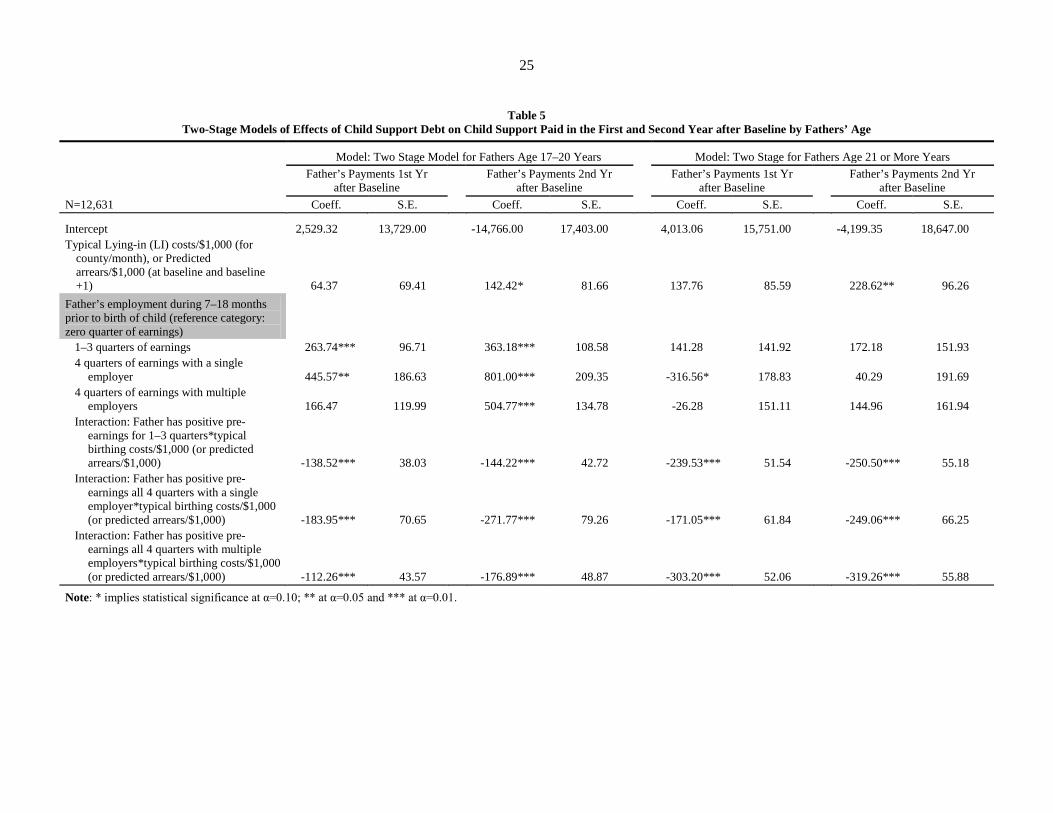
($849 – $1,215) and $896 ($,1044 – $1,940) in year 2. Alternatively, Table 5 shows that there is little
difference in the moderating effects of arrears on fathers’ child support payments for younger versus older
fathers; the interactions are negative, statistically significant and of fairly similar size for both groups of
fathers, and generally consistent with the findings presented in Table 2.
16Because child support debt might be expected to discourage all formal employment, as a sensitivity test, we also estimated probit models of any employment in the first or second year. The results again suggested a significant effect of debt on employment, in both years, whether estimated using OLS or a two-stage model with predicted arrears.
24
Table 4 Two-Stage Models of Effects of Child Support Debt on Earnings in the First and Second Year after Baseline by Fathers’ Age
N=12,631
Model: Two Stage Model for Fathers Age 17–20 Years Model: Two Stage for Fathers Age 21 or More Years Father’s Earnings 1st Yr
after Baseline
Father’s Earnings 2nd Yr after Baseline
Father’s Earnings 1st Yr after Baseline
Father’s Earnings 2nd Yr after Baseline
Coeff. S.E. Coeff. S.E. Coeff. S.E. Coeff. S.E.
Intercept -59,345.00 93,684.00
-127,889.00 120,019.00
-170,802.00* 95,190.00 -222,665.00* 117,095.00 Typical Lying-in (LI) costs/$1,000 (for
county/month), or Predicted arrears/$1,000 (at baseline and baseline +1) 848.51* 473.64
1,043.71* 563.18
162.94 517.24 709.54 604.47
Father’s employment during 7–18 months prior to birth of child (reference category: zero quarter of earnings)
1–3 quarters of earnings 1,409.00** 659.93
1,907.86** 748.81
79.34 857.65 -412.91 954.06 4 quarters of earnings with a single
employer 4,351.60*** 1,273.55
6,994.86*** 1,443.81
-824.64 1,080.71 -886.09 1,203.78 4 quarters of earnings with multiple
employers 3,233.47*** 818.78
3,625.87*** 929.53
-136.29 913.21 711.39 1,016.91 Interaction: Father has positive pre-
earnings for 1–3 quarters*typical birthing costs/$1,000 (or predicted arrears/$1,000) -460.36* 259.49
-449.47 294.62
217.92 311.45 131.67 346.50
Interaction: Father has positive pre-earnings all 4 quarters with a single employer*typical birthing costs/$1,000 (or predicted arrears/$1,000) -1,214.74** 482.12
-1,940.39*** 546.61
-152.60 373.69 -178.23 416.04
Interaction: Father has positive pre-earnings all 4 quarters with multiple employers*typical birthing costs/$1,000 (or predicted arrears/$1,000) -978.47*** 297.31
-1,019.95*** 337.00
-303.43 314.63 -745.37** 350.90
Note: * implies statistical significance at α=0.10; ** at α=0.05 and *** at α=0.01.
25
Table 5 Two-Stage Models of Effects of Child Support Debt on Child Support Paid in the First and Second Year after Baseline by Fathers’ Age
N=12,631
Model: Two Stage Model for Fathers Age 17–20 Years Model: Two Stage for Fathers Age 21 or More Years Father’s Payments 1st Yr
after Baseline
Father’s Payments 2nd Yr after Baseline
Father’s Payments 1st Yr after Baseline
Father’s Payments 2nd Yr after Baseline
Coeff. S.E. Coeff. S.E.
Coeff. S.E.
Coeff. S.E.
Intercept 2,529.32 13,729.00 -14,766.00 17,403.00 4,013.06 15,751.00 -4,199.35 18,647.00 Typical Lying-in (LI) costs/$1,000 (for
county/month), or Predicted arrears/$1,000 (at baseline and baseline +1) 64.37 69.41 142.42* 81.66 137.76 85.59 228.62** 96.26
Father’s employment during 7–18 months prior to birth of child (reference category: zero quarter of earnings)
1–3 quarters of earnings 263.74*** 96.71 363.18*** 108.58 141.28 141.92 172.18 151.93 4 quarters of earnings with a single
employer 445.57** 186.63 801.00*** 209.35 -316.56* 178.83 40.29 191.69 4 quarters of earnings with multiple
employers 166.47 119.99 504.77*** 134.78 -26.28 151.11 144.96 161.94 Interaction: Father has positive pre-
earnings for 1–3 quarters*typical birthing costs/$1,000 (or predicted arrears/$1,000) -138.52*** 38.03 -144.22*** 42.72 -239.53*** 51.54 -250.50*** 55.18
Interaction: Father has positive pre-earnings all 4 quarters with a single employer*typical birthing costs/$1,000 (or predicted arrears/$1,000) -183.95*** 70.65 -271.77*** 79.26 -171.05*** 61.84 -249.06*** 66.25
Interaction: Father has positive pre-earnings all 4 quarters with multiple employers*typical birthing costs/$1,000 (or predicted arrears/$1,000) -112.26*** 43.57 -176.89*** 48.87 -303.20*** 52.06 -319.26*** 55.88
Note: * implies statistical significance at α=0.10; ** at α=0.05 and *** at α=0.01.
26
Taken as a whole, the results of our analysis suggest that the effects of large additions to child
support debt burdens (through birthing costs charges) on nonresidential fathers’ future earnings and
payment of current support will depend importantly on their ability to meet or offset these new payment
obligations with increased labor force participation. Perhaps of paramount concern for policymakers is the
finding that younger fathers with stronger labor market attachment prior to birthing cost assessments are
likely to reduce their earnings and current child support payments the most in the face of higher debt
burdens. Clearly, many families may be negatively affected by these fathers’ responses to increasing child
support debt.
CONCLUSIONS
In this study, we use variation in the birthing costs over time and across counties in Wisconsin to
identify the effect of child support debt on nonresident fathers’ child support payments and formal
earnings. Because birthing costs are only assessed for mothers covered by Medicaid, our results apply to a
low-income sample. However, about 70 percent of all child support arrears are estimated to be owed by
fathers with no formal earnings or earnings below $10,000 per year (Sorensen et al., 2007), suggesting
that low-income families are an appropriate focus for an analysis of child support debt. We find evidence
that higher assessed birthing costs are significantly and substantively associated with both reduced child
support payments and reduced formal earnings, particularly for younger fathers with stronger prior labor
force attachment. Because child support debt can be the result of low earnings and the failure to pay
support, establishing the direction of causality has been difficult. By exploiting an exogenous source of
variation in birthing charges, which contributes to substantial differences in debt burdens early in the
child support payment experience, we are able to more confidently identify the effects of debt on child
support paid and on formal employment.
Ironically, the same feature (birthing charges being unrelated to father’s characteristics) that
makes birthing costs an excellent instrument for identifying the causal effects of arrears also makes it a
27
problematic public policy. In 2000, the congressionally mandated Medical Support Working Group
recommended that child support enforcement agencies be precluded from attempting to recover Medicaid
covered birthing costs from noncustodial parents (MSWG, 2000; Recommendation 20). And in an amicus
brief of the Center on Fathers, Families, and Public Policy (2001), an argument is made that the practice
of charging fathers for birthing costs goes against the intent of Congress to encourage mothers to obtain
appropriate health care during and following pregnancy, without concern for the implications for
noncustodial parents and their future ability to pay child support. As such, very few states currently act to
recover Medicaid birthing costs, and the Deficit Reduction Act did not include this policy among the
many aspects of the child support enforcement addressed. In addition, other recent bills have included
provisions to eliminate Medicaid birthing-cost recovery, in part because this policy has not factored in the
father’s ability to pay. In 2006, Wisconsin Act 304 reduced birthing cost assessments for low-income
fathers, limiting the amount of recovery to one-half the actual and reasonable costs of the pregnancy and
birth (Wisconsin Legislative Reference Bureau, 2006).17
Our interest, however, is less in the policy of birthing costs per se, than in contributing to our
understanding of the likely implications of growing child support arrears for the functioning of the child
support system and the well-being of resident and nonresident parents and their families. At a time when
federal support for child support agencies has been wavering, and many agencies are facing reductions in
staff and other resources, there is growing pressure to implement or maintain policies that offset
government costs. The assessment of birthing costs is consistent with a widespread focus on cost-
recovery. It is estimated, for example, that in the short run, abandoning the current policy for recovering
The elimination of birthing cost assessments was
an important provision of The Responsible Fatherhood and Healthy Families Act, co-sponsored in 2007
by then-Senator Obama, and was featured in policy proposals he made during his presidential campaign.
17The act was not retroactive, and did not affect the cases included in our analysis, all of which were ordered to pay birthing costs in 2003 or earlier.
28
birthing costs would cost the Wisconsin child support and Medicaid programs over $20 million per year.18
18Correspondence with the Wisconsin Bureau of Child Support, Department of Workforce Development.
On the other hand, such efforts to recover short-term or one-time government costs may be
counterproductive if they lead to reduced cooperation with the child support system. Our results suggest
that higher arrears, in themselves, substantially reduce both child support payments and formal earnings
for the fathers and families that already likely struggle in securing steady employment and coping with
economic disadvantage, a serious unintended consequence of child support policy.
29
Appendix A Sample Construction
We draw our sample from 72,363 legally established fathers and court-ordered payers whose
first-born (oldest) child lives with his/her mother, and was born no earlier than November 1, 1997 (when
administrative data on birthing costs is available), and no later than the first quarter of 2004 (to allow us
to potentially observe 2 years of post-baseline outcomes).
1) Restricting the sample to 21,512 fathers charged birthing costs and owing child support. Of the 72,363 father-child pairs, we eliminated 39,160 fathers who owed no birthing costs, 833 fathers with missing information on birthing costs, and 746 fathers for whom we could not match birthing costs to an individual child. We also eliminate 9,439 who had never owed child support. A manual check of a few of these cases suggests most are co-habiting resident fathers. We also eliminated 671 fathers who owed no support in the 2 years after baseline (because their first order was of very short duration).
2) Of 21,512 remaining father-child pairs, we eliminated 285 fathers with an unknown date of paternity establishment, 101 fathers whose paternity was oddly established after the baseline started, 120 fathers with unknown birthdates, and 407 fathers with missing or incorrect Social Security numbers (and consequently no earnings information).
3) Of 20,700 remaining father-child pairs, we eliminated 4,508 cases whose baseline (birthing costs assessed and first child support order in place) was after the first quarter of 2004, in order to have information on child support payments and earnings for 2 years after the baseline.
4) Of 16,599 remaining father-child pairs, we eliminated 296 fathers with extreme (above the 99th percentile) yearly earnings either in the year prior to baseline or any of the 2 years after the baseline.
5) Of 16,303 remaining father-child pairs, we selected 13,105 fathers who owed birthing costs in one of the 23 counties for which we developed information on typical birthing costs (see Appendix B), and in a month during which we observed typical costs.
6) Of the 13,105 remaining father-child pair, we eliminated 27 fathers whose paternity was not established until baseline.
7) Of 13,078 remaining father-child pairs, we eliminated 447 fathers who were under the age of 17 at the birth of child.
These steps resulted in a final sample of 12,631 father-child pairs.
30
Appendix B Construction of Typical Birthing Charges
We are not aware of any systematic documentation of birthing (birthing) charges by county and
over time in Wisconsin. Based on administrative records of charges in individual cases, we derived the
typical birthing costs for each county and month using the following procedure:
1) Recode individual birthing charges in $200 increments and call the modal category the “typical” birthing charge for that county/month in which the month refers to the month/year of child’s birth. This results in 1,632 county/month values (6 years and 2 months for 23 counties for a total of 1,702 county/months, less 70 county/months with at most one birthing charge observation).
2) If other amounts of individuals’ birthing charges than the modal category are found for a given county/month, provisionally set a second “typical” birthing charge for that county/month.
3) Smooth the data as follows: if the first typical birthing charge for a county/month deviates from the typical charge in adjacent months, while the charges in adjacent months are identical to one another, set the typical charge for the current county/month to match that of adjacent months. (Adjacent months are defined as 1 month before and 1 after, 2 months before and 1 month after, or 1 month before and 2 months after.) If the first typical charge is altered, set the second typical birthing cost equal to the original charge (overriding any existing second charge). Note that 7.17 percent of a total of 1,632 county/month birth charges were altered in this process. Additionally, out of the 70 county/months that were excluded in step 1 for the reason that there was at most one birthing charge observation for a county/month, 17 county/months were newly given the first typical charge from the typical charge in adjacent months. This results in 1,649 county/months with the first typical birthing charge.
4) Allow a second typical birthing cost in a given county/month if the value of the second typical charge is equal to the first typical charge in that county at some point in the previous or subsequent 12 months. This allows for some cases to be assessed an “old” or “new” charge, possibly because of delays in assessment, or of uneven implementation of a new cost structure. Note that 246 county/months were given a second typical charge as a result.
For each individual father-child pair (N=12,631), set the typical birthing charge to the first typical
charge for the relevant county and month (or, if the absolute differences between individuals’ actual
birthing charges and the first typical charge are more than $150, to the closest of the two typical charges
for the 193 county/months in which there are two options).
31
Appendix C First Stage Models of Arrears at Baseline and 1 Year after Baseline
N=12,631
Model: OLS (with typical county/month birthing charges)
Father’s Arrears at Baseline
Father’s Arrears 1 Year after Baseline
Coeff. S.E. Coeff. S.E.
Intercept 22,331.00*** 8,474.42
24,960.00* 13,834.00 Typical Lying-in (LI) costs/$1,000 (for county/month) 609.32*** 29.03
616.02*** 50.19
Father’s employment during 7–18 months prior to birth of child (reference category: zero quarter of earnings)
1–3 quarters of earnings -47.42 29.37
-13.07 49.42 4 quarters of earnings with a single employer -187.37*** 52.34
-265.87*** 87.96
4 quarters of earnings with multiple employers -107.29*** 41.40
-39.06 69.60 Annual Earnings of Father 7–18 months prior to
birth of child (conditional on some earnings divided by $1,000) -10.74** 4.77
-100.76*** 8.02
Father’s annual earnings squared 7–18 months prior to birth of child (conditional on some earnings and divided by $1,000,000) 0.16 0.14
1.99*** 0.24
Time difference among events including birth of child, paternity establishments, first child support order, and LI order (reference category: LI ordered within 6 months after first child support order and paternity established within 6 months after birth
First child support owed before LI order 803.71*** 34.61
1,051.39*** 58.55 First child support order after 6 months following
LI order, or paternity established after 6 months following birth of child -161.70*** 24.56
-16.02 41.30
Whether father has additional legal obligations for a child at the beginning of the first year after baseline (reference category: no more child)
Father has additional legal obligations for a child of the same female partner
232.90*** 59.08
Father has additional legal obligations for a child of another female partner
874.38*** 45.72
Age of Father (reference category: 17–20) 21–24 36.77 23.78
62.79 40.05
25–28 29.22 32.29
-11.94 54.36 29+ 90.84*** 33.20
147.67*** 56.05
Race of Father (reference category: Black) White -149.45*** 27.78
-504.93*** 47.02
Others -13.87 35.25
-200.40*** 59.40 Missing -203.54*** 40.72
-774.49*** 68.75
(table continues)
32
Appendix C, continued
N=12,631
Model: OLS (with typical county/month birthing charges)
Father’s Arrears at Baseline
Father’s Arrears 1 Year after Baseline
Coeff. S.E. Coeff. S.E.
Year of LI Order (reference category: between November 1997 and December 1998)
Year 1999 106.07*** 33.78
-41.27 54.70 Year 2000 308.11*** 38.36
130.06** 63.71
Year 2001 430.21*** 44.98
177.27** 75.31 Year 2002 666.33*** 53.54
323.76*** 89.96
Year 2003 860.31*** 69.99
415.96*** 117.88 Father’s County (compared to Milwaukee)
County 2 -3,235.84*** 1,100.51 -2,635.97 1,678.58 County 3 -1,767.22*** 435.25 -722.76 709.00 County 4 -2,479.44*** 742.73 -1,822.95 1,195.77 County 5 -3,665.67*** 1,374.91 -2,967.93 2,105.50 County 6 -2,675.73*** 551.28 -889.62 898.23 County 7 -2,417.91*** 930.82 -1,356.15 1,424.17 County 8 -2,766.16*** 1,044.31 -2,714.99* 1,593.85 County 9 -2,912.01** 1,454.43 -2,566.81 2,371.50 County 10 -3,110.19*** 1,164.50 -2,873.83 1,835.02 County 11 -4,687.93*** 1,308.92 -4,158.64** 2,079.94 County 12 -4,625.96*** 1,155.24 -2,949.60* 1,757.75 County 13 -2,806.38* 1,506.78 -4,886.60** 2,300.76 County 14 -4,399.20*** 1,234.36 -3,159.54* 1,872.75 County 15 -3,766.37** 1,470.27 -4,043.22 2,299.19 County 16 -5,171.62*** 1,311.54 -4,089.74** 2,007.43 County 17 -4,534.60*** 1,581.39 -3,934.09 2,533.35 County 18 -4,982.37*** 1,607.34 -5,120.26** 2,501.05 County 19 -4,937.34** 2,061.62 -6,621.37** 3,215.18 County 20 -6,093.73*** 1,818.48 -5,490.89* 2,835.17 County 21 -6,436.66*** 1,470.67 -4,364.33* 2,377.58 County 22 -5,618.25*** 1,889.10 -6,738.06** 3,026.49 County 23 -5,399.67*** 1,867.54 -5,489.01* 2,892.35
Log of Total Employment in County during 5-2 full quarters prior to Baseline -1,373.41*** 528.79 -1,399.66* 849.60
Employment Share of Agriculture and Forestry during 5-2 full quarters prior to Baseline 3,484.52 17,297.00 2,632.50 24,164.00
Employment Share of Mining during 5-2 full quarters prior to Baseline -188,362.00* 104,853.00 -264,708.00 213,570.00
Employment Share of Construction during 5-2 full quarters prior to Baseline 3,253.18 3,239.84 1,727.69 10,191.00
Employment Share of Manufacturing during 5-2 full quarters prior to Baseline 5,815.39*** 1,676.68 1,001.57 2,590.04
Employment Share of Wholesale trade during 5-2 full quarters prior to Baseline 5,753.46** 2,247.58 2,136.95 4,440.25
(table continues)
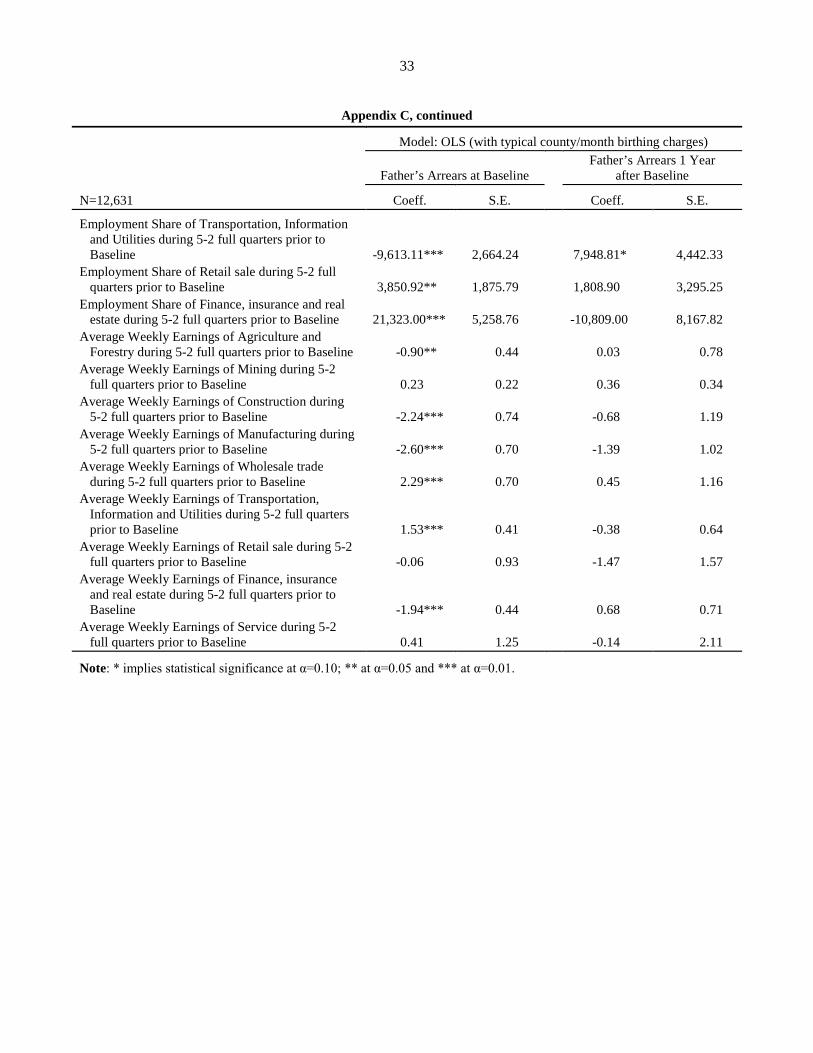
33
Appendix C, continued
N=12,631
Model: OLS (with typical county/month birthing charges)
Father’s Arrears at Baseline
Father’s Arrears 1 Year after Baseline
Coeff. S.E.
Coeff. S.E.
Employment Share of Transportation, Information and Utilities during 5-2 full quarters prior to Baseline -9,613.11*** 2,664.24 7,948.81* 4,442.33
Employment Share of Retail sale during 5-2 full quarters prior to Baseline 3,850.92** 1,875.79 1,808.90 3,295.25
Employment Share of Finance, insurance and real estate during 5-2 full quarters prior to Baseline 21,323.00*** 5,258.76 -10,809.00 8,167.82
Average Weekly Earnings of Agriculture and Forestry during 5-2 full quarters prior to Baseline -0.90** 0.44 0.03 0.78
Average Weekly Earnings of Mining during 5-2 full quarters prior to Baseline 0.23 0.22 0.36 0.34
Average Weekly Earnings of Construction during 5-2 full quarters prior to Baseline -2.24*** 0.74 -0.68 1.19
Average Weekly Earnings of Manufacturing during 5-2 full quarters prior to Baseline -2.60*** 0.70 -1.39 1.02
Average Weekly Earnings of Wholesale trade during 5-2 full quarters prior to Baseline 2.29*** 0.70 0.45 1.16
Average Weekly Earnings of Transportation, Information and Utilities during 5-2 full quarters prior to Baseline 1.53*** 0.41 -0.38 0.64
Average Weekly Earnings of Retail sale during 5-2 full quarters prior to Baseline -0.06 0.93 -1.47 1.57
Average Weekly Earnings of Finance, insurance and real estate during 5-2 full quarters prior to Baseline -1.94*** 0.44 0.68 0.71
Average Weekly Earnings of Service during 5-2 full quarters prior to Baseline 0.41 1.25 -0.14 2.11
Note: * implies statistical significance at α=0.10; ** at α=0.05 and *** at α=0.01.


35
References
Aizer, Anna, and Sara S. McLanahan. 2006. “The Impact of Child Support Enforcement on Fertility, Parental Investments, and Child Well-Being.” The Journal of Human Resources 41(1): 28–45.
Argys, Laura M., and H. Elizabeth Peters. 2001. “Interactions between Unmarried Fathers and Their Children: The Role of Paternity Establishment and Child-Support Policies.” The American Economic Review 91(2): 125–129.
Bartfeld, Judi. 2005. “Arrearages, Lying-In Orders, and Child Support Compliance among Fathers of W-2 Children in Wisconsin.” Working paper, University of Wisconsin–Madison.
Bartfeld, Judi. 2003. “Falling Through the Cracks: Gaps in Child Support among Welfare Recipients.” Journal of Marriage and Family 65(1): 72–89.
Bartfeld, Judi, and Daniel R. Meyer. 2003. “Child Support Compliance among Discretionary and Nondiscretionary Obligors.” Social Service Review 77(3): 347–372.
Bloom, David E., Cecilia Conrad, and Cynthia Miller. 1998. “Child Support and Fathers’ Remarriage and Fertility.” In Fathers Under Fire: The Revolution in Child Support Enforcement, edited by Irwin Garfinkel, Sara S. McLanahan, Daniel Meyer, and Jane A. Seltzer. New York: Russell Sage Foundation, pp. 128–156.
Cancian, Maria, and Daniel R. Meyer. 2005. “Child Support in the United States: An Uncertain and Irregular Income Source?” Discussion Paper 1298-05, Institute for Research on Poverty, University of Wisconsin–Madison.
Carlson, Marcia, Irwin Garfinkel, Sara S. McLanahan, Ronald Mincy, and Wendell Primus. 2004. “The Effects of Welfare and Child Support Policies on Union Formation.” Population Research and Policy Review 23: 513–542.
Center for Family Policy and Practice. 2001. “Congress Should Preclude Child Support Agencies from Recovering Medicaid-Covered Prenatal Birth Expenses.” (http://www.cffpp.org/publications/medicaid.html).
Freeman, Richard B., and Jane Waldfogel. 2001. “Dunning Delinquent Dads: The Effects of Child Support Enforcement Policy on Child Support Receipt by Never Married Women.” The Journal of Human Resources 36(2): 207–225.
Freeman, Richard B., and Jane Waldfogel. 1998. “Does Child Support Enforcement Affect Male Labor Supply?” In Fathers Under Fire: The Revolution in Child Support Enforcement, edited by Irwin Garfinkel, Sara S. McLanahan, Daniel Meyer, and Jane A. Seltzer. New York: Russell Sage Foundation, pp. 94–127.
Fullerton, Don. 1991. “Reconciling Recent Estimates of the Marginal Welfare Cost of Taxation.” The American Economic Review 81(1, March): 302–308.
Garfinkel, Irwin, I. Chien Huang, Sara S. McLanahan, and Daniel S. Gaylin. 2003. “Will Child Support Enforcement Reduce Nonmarital Childbearing?” Journal of Population Economics 16(1): 55–70.
36
Ha, Yoonsook, Daniel Meyer, and Mei-Chen Hu. 2006. “Do Higher Child Support Orders Discourage Child Support Payments?” Working paper, University of Wisconsin–Madison.
Heckman, James J. 1997. “Instrumental Variables: A Study of Implicit Behavioral Assumptions Used in Making Program Evaluations.” The Journal of Human Resources 32(3): 441–462.
Holzer, Harry J., Paul Offner, and Elaine Sorensen. 2005. “Declining Employment among Young Black Less-Educated Men: The Role of Incarceration and Child Support.” Journal of Policy Analysis and Management 24(2): 329–350.
Huang, Chien-Chung, James Kunz, and Irwin Garfinkel. 2002. “The Effect of Child Support on Welfare Exits and Re-Entries.” Journal of Policy Analysis and Management 21(4): 557–576.
McCormick, Mike, and Glenn Sacks. 2007. “Fatherhood Bill: Not Enough Carrot, Too Much Stick.” Wisconsin State Journal, July 1, C2.
Medical Child Support Working Group; U.S. Department of Labor and U.S. Department of Health and Human Services. 2000. 21 Million Children’s Health: Our Shared Responsibility (Executive Summary of Report) June. Retrieved from http://www.acf.hhs.gov/programs/cse/pubs/2000/reports/medrpt/.
Murray, Michael P. 2006. “Avoiding Invalid Instruments and Coping with Weak Instruments.” The Journal of Economic Perspectives 20(4): 111–132.
Ovwigho, Pamela C., Correne Saunders, and Catherine E. Born. 2005. “The Intersection of Incarceration and Child Support: A Snapshot of Maryland’s Caseload.” Report of the Family Welfare Research and Training Group, University of Maryland, School of Social Work.
Pate, David J., Jr. 2002. “An Ethnographic Inquiry into the Life Experiences of African American Fathers with Children on W-2.” In Nonexperimental Analyses of the Full Disregard and Pass-Through, Volume 2, edited by Daniel R. Meyer and Maria Cancian. Report to the Wisconsin Department of Workforce Development.
Plotnick, Robert D., Irwin Garfinkel, and Sara S. McLanahan. 2004. “Better Child Support Enforcement: Can It Reduce Teenage Premarital Childbearing?” Journal of Family Issues 25(5): 634–657.
Seltzer, Jane A., Sara S. McLanahan, and T. Hanson. 1998. “Will Child Support Enforcement Increase Father-Child Contact and Parental Conflict after Separation?” In Fathers Under Fire: The Revolution in Child Support Enforcement, edited by Irwin Garfinkel, Sara S. McLanahan, Daniel Meyer, and Jane A. Seltzer. New York: Russell Sage Foundation, pp. 157–190.
Sorenson, Elaine, and Helen Oliver. 2002. “Policy Reforms are Needed to Increase Child Support from Poor Fathers.” Working Paper, The Urban Institute, April.
Sorensen, Elaine, Liliana Sousa, and Simon Schaner. 2007. “Assessing Child Support Arrears in Nine Large States and the Nation.” Urban Institute report to U.S. Department of Health and Human Services. Downloaded from: http://aspe.hhs.gov/hsp/07/assessing-CS-debt/report.pdf.
Sousa, Liliana, and Elaine Sorensen. 2006. “The Economic Reality of Nonresident Mothers and Their Children.” The Urban Institute Policy Brief, Series B, No. B-69, May.
37
U.S. Department of Health and Human Services, Administration for Children and Families. 2008. Child Support Enforcement (CSE) FY 2007 Preliminary Report. Downloaded from: http://www.acf.hhs.gov/programs/cse/pubs/2008/preliminary_report_fy2007/.
Waller, Maureen R., and Robert Plotnick. (2001). “Effective Child Support Policy for Low-Income Families: Evidence from Street Level Research.” The Journal of Policy Analysis and Management 20(1): 89–110.
Wisconsin Legislative Reference Bureau. 2006. Summary of the 2005–2006 Wisconsin Legislative Session. Research Bulletin 2006–1. http://www.legis.state.wi.us/lrb/pubs/rb/06RB1.pdf.
Recommended