Downlink Probability Density Functionsfor EOS-McMurdo Sound :-
/; (i>
P. Christopher / '\-,,..J
Stanford Telecom
Reston, VA
A. H. Jackson
Goddard Space Flight Center (GSFC)Greenbelt, MD
Abstract
555
The visibility times and communication link dynamics for the EOS.McMurdo Sound direct downlinks havebeen studied recently. The 16-day EOS periodicity may be shown with the Goddard Trajectory
Determination System (GTDS), and the entire 16-day period should be simulated for representative link
statistics. We desire many attributes of the downlink, however, and a faster orbital determination method is
desirable. We use the method of osculating elements for speed and accuracy in simulating the EOS orbit.
The accuracy of the method of osculating elements is demonstrated by closely reproducing the observed
16-day Landsat periodicity. An autocorrelation function method is used to show the correlation spike at
16 days.
The entire 16-day record of passes over McMurdo Sound is then used to generate statistics for innage time,outage time, elevation angle, antenna angle rates, and propagation Io_s. The elevation angle probability
density function is compared with a 1967 analytic approximation which has been used for medium to high
altitude satellites. One practical result of this comparison is seen to be the rare occurrence of zenith passes.The new result is functionally different than the earlier result, with a heavy emphasis on low elevation
angles. EOS is one of a large class of sun synchronous satellites which may be downlinked to McMurdo
Sound. We examine delay statistics for an entire group of sun synchronous satellites ranging from 400 km to
1000 km altitude. Outage probability density function results are presented three dimensionally.
1. Introduction
A new series of environmental spacecraft, such as the Earth Observation Satellite (EOS), may use the Tracking
and Data Relay Satellite System CI'DRSS) in some unique ways. Polar orbiting environmental spacecraft spend an
appreciable portion of their orbit over the poles. The polar orbit of EOS or of Landsat may be represented as in
Figure 1-1. The individual views are taken as a series of snapshots at 8.2 minute intervals. It is seen to be slightlyretrograde, with a 98-degree inclination. EOS and other environmental spacecraft may fred it more convenient to
downlink their data directly to a ground station in Antarctica rather than relaying it over a distance of six earth
radii to a geosynchronous relay. We examine these downlinks in some detail.
A ground station at McMurdo Sound, Antarctica has been constructed by NASA to answer these needs. A polar
satellite such as an Earth Observation Satellite (F_,OS) would be able to link to McMurdo Sound in a visibilityregion as shown in Figure 1-2. McMurdo would then uplink to TDRS West, to complete the link to the White
Sands Complex (WSC).
WR 96039.[X3C
333
https://ntrs.nasa.gov/search.jsp?R=19960035776 2020-08-04T18:06:49+00:00Z

Figure 1-1: Incfined Landsat (EOS) Orbit Inside VanAIlen Belt
180"
120" 210"
90"240"
270"
OS_:,_6MraBS-l_CSr27 O"
Nou_I_ rumEOS imm.I_ (I).
Figure 1-2: McMurdo Sound-EOS Visibility Region _i_m ts r
334WR96039.D(_'

We address some of the communication link dynamics for the user satellite pass over McMurdo Sound. Sun
synchronous satellites will be of widespread interest, and we closely examine arrival times, departure times, and
atmospheric signal loss as a function of time during the pass over the ground station. These data may be furtherexamined to generate interarrival time statistics, link duration statistics, and signal loss statistics as an aid to the
system designer. EOS, as a clearly important member of the class of sun synchronous satellites, gets specialattention.
Many long computer simulations are necessary for this report. The method of osculating orbits (1) is used here for
speed and accuracy. The oblate earth perturbation terms are vital to descriptions of the 16-day EOS periodicity.Indeed, the 16-day periodicity can be used as a simulation check against existing Landsat4 data. Most of our EOS
runs include the entire 16-day periodic interval as a key check. However, only small portions of the output tables
are included here because of space limits. The report begins with a brief description of oblate earth perturbation
terms which are necessary for the method of osculating elements.
Atmospheric attenuation on the McMurdo-satellite link is closely related to the orbital computations because the
attenuation depends strongly on the ground station elevation angle. We use two new attenuation results as an
integral part of the orbital program. The first new propagation result is due to Liebe (2). The new propagationresults are used but not included because of space limitations. A short portion of a long EOS simulation follows.
The long-term EOS statistics are included as a way to keep the results brief. General sun synchronous results
conclude the report. Sun synchronous altitudes between 400-1000 Ion will be seen to offer short interarrival timesat McMurdo Sound, but altitudes below 500 km will occasionally skip an orbit before visibility repeats.
Appendix A condenses the long 16 day simulation into short graphical output.
2.0 Analysis
The anticipated long 16-day periodicity of EOS leads us to consider methods to reproduce the entire 16-day period
with suitable accuracy. Anything less would cause serious doubts about the ground elevation statistics and the
propagation loss studies which follow. The method of osculating elements, with analytic approximations for the
perturbed motion, is useful for fast and relatively accurate orbit prediction for missions of long duration. Moulton
(3) gives the basis of the method as the partial derivatives of the instantaneous orbital elements as a function of a
perturbing potential. Brouwer (4), Kozai (5), and Blitzer (6) have used the method to achieve exhaustive insightsinto the motion of low earth orbiting satellites. Their results for satellite perturbations may be subdivided into
secular components, long cycle components, and short cycle components. We desire only the secular componentshere, and omit the long and short cycle terms because they tend to cancel out their effects over the long term.
Omission of the short cycle component has implied a maximum instantaneous orbital error of a few kilometers for
the 1958 Vanguard orbit. We accept that error, along with the error due to lunar perturbations (although lunar
perturbations can be included with the method of osculating elements with the aid of results by Ash (1)).
The key secular terms are:
-T7't,TJ<°'<°+377' tTJlal i i,ll !,,
II[(4 + 121,iO"_-e_- 9e' )cos(i)+('-40- 361,47"Z_-e_ + 5e' )cos'(i)]
,, (,). }32 7, -_ (2+ 3e_ )(J- 7 cos2 (i))cos(i) Rad_sec
2-1
335WR96039.DOC

• [ - 10 + 241_'_-e 2- 25e 2+ (-36-1921_¢_'eT-e 2 + 126e')cos _(i)
+(430+ 360_-e 2 -45e')cos'(i) ]
4,128 J, "fi 12+9e "_+(-144-126e2)cos_(i)
+(196+189e')cos'(i)l} Rad_sec
2-2
1 u R :
• [ 10 + 161_"_-e 2 - 25e _ + (-60- 961.4"J'_-e_ + 90e')cos" (i)
45 R'+ :130 +144.¢f1- , ' - 2,e' )co,' (, , ] - 7_ " ("fi l _l - e'
• 0 - 30cos 2(i) + 35cos" (i) lJ
Rad_sec
2-3
with the key variables defined below
The method of osculating orbital elements allows the Keplerian orbital elements to be continuously updated
without concern for the time interval between updates. It also offers a concise orbital description, which allows
other important satellite communication features such as link propagation to be included in the same computercode.
The secular perturbations may be abbreviated further, while usually retaining over 99% of the accuracy of the
secular terms. The oblateness effects have been found to give a regression of nodes
3 uw= 1'cos ,,ro ,sec 2-4
The argument of perigee changes as
3 u
WP=_a_J2(R): (-]+Scos2(i))rad/$ec2-5
and the mean anomaly changes as
3 u2-6
W = right ascension, rad
Wp = argument of perigee, tad
R = earth radius, Ion
336 v_9_o_._c

la = earth gravitational constant
= 0.39860064 * 106 km3/sec z
P = a (1-e 2) = semilatus rectum
J2 = 1.082635 * 10 .3
e = eccentricity
i = inclination, rad.
3.0 EOS Simulation Results
Table 3-1 indicates a first pass (labeled 1) of EOS over the McMurdo Sound ground station. It uses 1992 Landsat4
orbital elements. Table 3-1 lists the first and second passes in an abbreviated simulation output. Elevation angle,
attenuation, and subsatellite point are listed as a function of time for the EOS passes. The In'st attenuation column
is for a single link, and the second represents a dual switched link. Attenuation is chosen at the 0.997 precipitation
probability level for a 1.0 km altitude precipitation layer (7,9). The subsatellite point is recognized as North
Latitude and East Longitude. Time is in hours from start of the Epoch (note 1 minute increments). Range is in
megameters.
Tab_ 3-1: EOS Downlinked to Antarctica
EOS DOWNLINKED TO ANTARCTICA TAVG(K)= 201
EOS LINK ; X BAND GND SITE-78.11 166.2272 GFHZ = 8.2875E+09
RP PREC.RATE(MM/HR) = 1.498039 AVAIL= .997 PRECIP. HT.= 1
A,E,I = 7077.79 .0014055 98.39766
MASK ANGLE- 1 DEG
I ELEV (SINGLE, DUAL,CLEAR &) NLAT ELON TIME
1.000 1.079 3.592 2.756 2.219 -69.334 263.313 1.150
2.000 5.205 0.897 0.702 0.612 -72.583 258.031 1.167
3.000 10.174 0.440 0.350 0.315 -75.652 250.604 1.183
4.000 16.527 0.265 0.213 0.195 -78.396 239.637 1.200
5.000 25.313 0.172 0.140 0.130 -80.528 223.122 1.217
6.000 38.572 0.115 0.095 0.089 -81.569 200.274 1.233
7.000 58.628 0.081 0.068 0.065 -81.124 175.823 1.250
8.000 68.386 0.073 0.062 0.060 -79.380 156.536 1.267
9.000 47.904 0.095 0.079 0.075 -76.841 143.511 1.283
i0.000 31.266 0.140 0.114 0.107 -73.880 134.820 1.300
11.000 20.539 0.212 0.172 0.158 -70.688 128.769 1.317
12.000 13.127 0.337 0.269 0.245 -67.364 124.337 1.333
13.000 7.543 0.604 0.476 0.423 -63.957 120.938 1.350
14.000 3.036 1.598 1.238 1.049 -60.496 118.227 1.367
15.000 2.627 1.868 1.443 1.212 -66.368 242.138 2.783
16.000 6.994 0.654 0.515 0.456 -69.714 238.066 2.800
17.000 12.329 0.360 0.287 0.260 -72.947 232.587 2.817
18.000 19.251 0.226 0.183 0.169 -75.988 224.838 2.833
19.000 28.865 0.151 0.123 0.115 -78.680 213.341 2.850
20.000 42.619 0.105 0.087 0.082 -80.714 196.072 2.867
21.000 57.172 0.082 0.069 0.066 -81.596 172.672 2.883
22.000 52.827 0.088 0.073 0.070 -80.981 148.547 2.900
23.000 37.117 0.119 0.098 0.092 -79.119 130.029 2.917
24.000 24.921 0.174 0.142 0.132 -76.517 117.610 2.933
25.000 16.414 0.267 0.215 0.197 -73.522 109.294 2.950
26.000 10.144 0.441 0.351 0.315 -70.311 103.472 2.967
27.000 5.200 0.898 0.702 0.613 -66.975 99.182 2.983
28.000 1.081 3.592 2.756 2.219 -63.561 95.876 3.000
RANG,MM2.989
2.582
2.179
1.785
1.408
1.071
0.825
0.765
0.929
1.230
1.591
1.978
2.378
2.783
2.835
2.432
2.036
1.653
1.298
1.004
0.837
0.875
1.097
1.419
1.786
2.175
2.574
2.979
WR96039.[X:IC
337

Elevation Angles at McMurclo
The time variation of elevation of EOS or Landsat over McMurdo Sound may be seen with some elevation and
attenuation plots. The f'u_t satellite pass over McMurdo may be seen in the lower left comer of Figure 3-1.
Elevation is shown with data points, and the corresponding aunospheric attenuation of a hypothetical 27 GHz link
is shown with a solid line. The data points are chosen at one minute intervals, and most passes are seen to be
limited to less than 10 minutes. The long period between passes is taken out of the figure so that almost two days
of satellite passes may be fitted onto the figure. The passes are seen to group as several high passes followed by a
group of very low passes barely above the assumed 5 degree mask. The simulated elevation after 16 days is shown
in the following figure (Figure 3-2). The figure is strikingly similar to that for the initial passes, but other methodsshould be used to confirm a true 16-day periodicity.
Figure 3-3 shows the result of an autocorrelalion of the entire 21.75-day elevation simulation with itself. The
autocorrelation peaks at 1.0 when the series is cross correlated with itself for zero phase delay. It is seen to have a
cyclic correlation with later passes. As the lag times get longer, the cross correlation is rarely over 0.4 until the lag
time is set at 16 days (Figure 3-4) when the autocorrelation peaks at over 0.7. Longer phase differences also match
the initial autocorrelation function (labeled Rx) well, but not perfectly.
Elevation Probability Density Functions
Elevation angle probability density functions (pdfs) have been interesting and important since the early '60s. Lutz
and Doroshesld (9) recognized that satellite ground station economics depended on the ground station elevation
angles. They looked at the entire ensemble of ground stations seen by a geosynchronous satellite, and ueated theensemble of elevation angles as apdf. Sugai and Christopher (10) derived a simpler _ whicl', was useful for
medium altitude to geosynchronous orbits. The simpler pdf was of the form:
p(E) _,180/ _180 A, 78-o E-- 3-1
V_here
E = elevation, deg.
E._ = minimum elevation, deg. = 5 °
s = earth radius/semimajor axis = 1/6.6227 for geo satellite
Figure 3-5 shows the emphasis on low elevation angle for the pdf generated by equation 3-1 for Geo altitudes.
However, the 16-day simulation of Landsat4 passes over McMurdo Sound and shows an entirely different emphasison low elevation angles, as seen in Figure 3-6. A fit for the McMurdo elevation pdf may be found as:
p( E ) = O.O0064269 csc2(_8o E) 4
i,-o54 5cos i 6)-sin( ))3-2
WR96039.DOC338

ELEV.,DEGIO0
8O
60
40
20
0
A, d F3
2
@
0 5O 100 150 200 250
TIME, MIN.
ELEVATION,DEG -- ATTEN.,dB
Figure 3-1: Elevation for McMurdo-EOS for Successive Passes
ELEV.,DEG.100
8O
6O
4O
2O
A,dBIt;
ATTEN>
©
d
1
0
0 5O 100 17 DA¥150
TIME, MIN2OO
FLEVATION,DEG. -- ATTEN.,dB
Figure 3-2: Elevation at 16 Days for McMurdo-EOS
0
25O
WR 96039.DOC
339

Rx
08
04
0.20
-O.4
I
50 100VISIBILITY
150 200 250
TIME, MIN.
_Rx
Figure 3-3: Elevation Autocorrelation vs. Lag Time, Min.
50 100 150 200 250
VISIBILITY TIME, MIN
--'-- Rx -4-- Rx(16 DAY)
Figure 3-4: Elevation Autocorrelation Compared to 16-Day Autocorrelation
WRgeO_.DOC340

Figure 3-5:
p(o) 0.1
0.08
0.06
0.04
O. 02
0 20 40 60 80
elevation, dog.
Ground Elevation Probability Density Function to Geosynchronous Satellite
p(e)O.l
0.08
0.06
0.04
0.02
0
_"_ "---.4..__ . _
20 40 60 80
elevation, dog.
Figure 3-6: Elevation PDF for McMurdo Sound-EOS
Equation 3-2 is compared with the McMurdo data in Figure 3-7. It is useful, because it emphasizes the importanceof the ground rite's ability to acquire Landsat or EOS quickly at the horizon. The overall communication timeavailable increases sha_ly if the minimum elevation at the ground site can be 3 deg., for example, rather than5 deg.
341WR96039.DOC
I_o)
Figure 3- 7:
O.l
0.08
0.06
0.04
0.02 -
0
\
20 40 60 80elevation, deg.
McMurdo Elevation PDF Compared to Geosynchronous PDF
Appendix A shows the full 16-day periodicity of actual Landsat 4 elements (assumed to be identical toEOS elements here). The interarrival interval statistics and other link statistics may be summarized as in
Table 3-2.
Table 3-2: EOS Downlink Statistics to McMurdo Sound
F = 8.28 GHz
i i ii i!iiiiiiiiii i i!!ii!!i!iiii iiiii ! !i! iiii i iii iii i iiiiii!ii!i iiiii i in view, hr (rain)
out of view
Mean
Precipitation Height = 1.0 km 0.997 Availability
Maximum
0.1848 (11.08)
Standard Deviation
0.032 (1.92)
0.0526 (3.15)1.4609 (87.6)
0.2167 (13.0)
1.550 (93.0)
attenuation, dB 0.70 0.80 3.59
elevation (deg) 17.653 16.868 90
Rate (deg/sec)elevation 0 0.1353 0.586
azimuth -0.057 0.3495 18.82
With maximum antenna rates from a separate run with 5 sec. increments
4.0 Outages For General Sun Synchronous Satellites
A large range of altitudes of sun synchronous satellites may be considered for use with a McMurdo Sound ground
site. Low-altitude, low-cost satellites such as reported for a November 1994 Pegasus launch may be considered a
prime opportunity for the McMurdo site. This section shows the variation in outage statistics as a function ofaltitude.
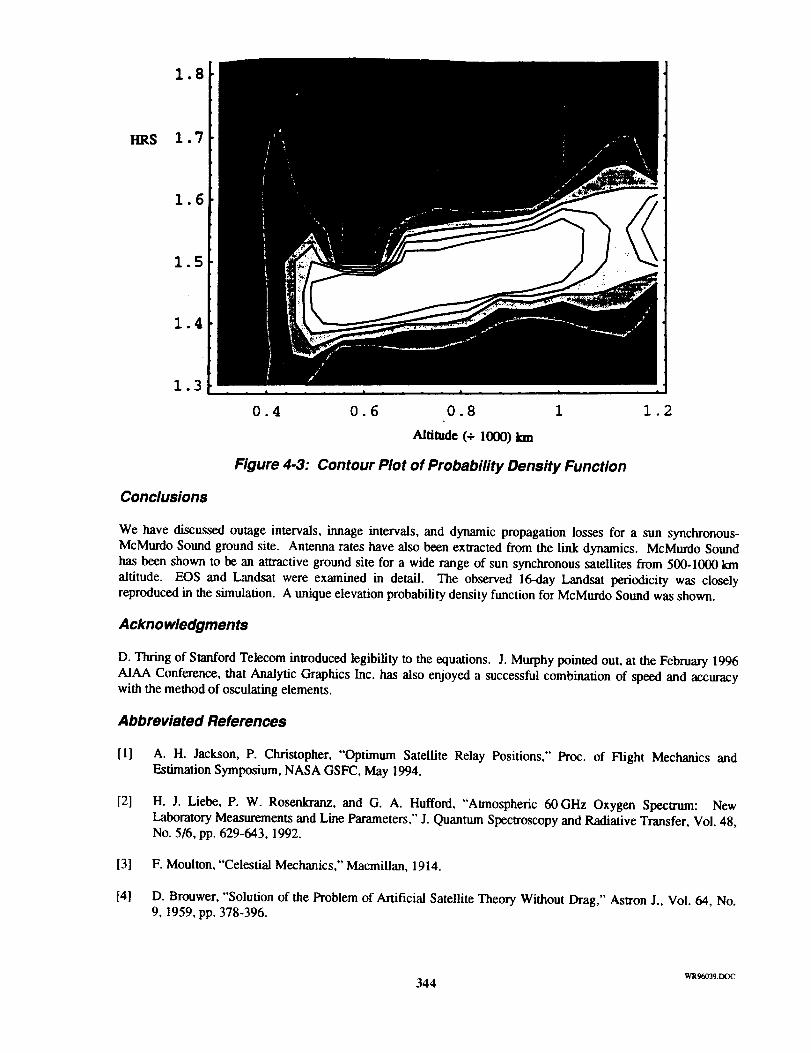
The inclination of sun synchronous satellites is actually function of altitude (Figure 4-1). This feature, along with
the increased viewing region associated with high altitudes, has noticeable effects on outage times and viewing
times. Long simulation can be done at each altitude and outage statistics extracted. Figure 4-2 shows the mean
outage times ranging from 1.45 hours at 550 km altitude to 1.5 hours at altitudes slightly greater than 1000 ian.Altitudes much less than 500 Ion, however, may actually skip an orbit before seeing McMurdo again. This appears
as long outage time in Figures 4-2 and 4-3.
342_960_9.DOC

/',z rzd_
I,deg. .
NO
J
Figure 4-1:
//
//
_0
semlmaJoraxis, km
Required Inclination for Sun Synchronous Satellites
PDF 10
1
Figure 4-2: Outage PDF vs. AltitudelO00
WR 96039.DOC
343
1.8
HRS I. 7
1.6
1.5
1.4
1.3
0.4 0.6 0.8 i 1.2
Alfimdo (÷ 1000) lull
Figure 4-3: Contour Plot of Probability Density Function
Conclusions
We have discussed outage intervals, irmage intervals, and dynamic propagation losses for a sun synchronous-McMurdo Sound ground site. Antenna rates have also been extracted from the link dynamics. McMurdo Sound
has been shown to be an attractive ground site for a wide range of sun synchronous satellites from 500-1000 km
altitude. EOS and Landsat were examined in detail. The observed 16-day Landsat periodicity was closelyreproduced in the simulation. A unique elevation probability density function for McMurdo Sound was shown.
Acknowledgments
D. Thring of Stanford Telecom introduced legibility to the equations. J. Murphy pointed out, at the February 1996
AIAA Conference, that Analytic Graphics Inc. has also enjoyed a successful combination of speed and accuracywith the method of osculating elements.
Abbreviated References
[1] A. H. Jackson, P. Christopher, "Optimum Satellite Relay Positions," Proc. of Flight Mechanics andEstimation Symposium, NASA GSFC, May 1994.
[21 H. J. Liebe, P. W. Rosenkranz, and G. A. Hufford, "Atmospheric 60 GHz Oxygen Spectrum: NewLaboratory Measurements and Line Parameters," J. Quantum Spectroscopy and Radiative Transfer, Vol. 48,No. 5/6, pp. 629-643, 1992.
[3] F. Moulton, "Celestial Mechanics," Macmillan, 1914.
[4] D. Brouwer, "Solution of the Problem of Artificial Satellite Theory Without Drag," Astron J., Vol. 64, No.9, 1959, pp. 378-396.
344 ws96o39.DOC

[51
[61
[7]
/8]
[9]
[10]
[11]
[12]
Y. Kozai, "The Motion of a Close Earth Satellite,", Astron J. Vol. 64, No. 9, 1959, pp. 367-377
L. Blitzer, M. Weisfield, and D. Wheelon, "Perturbation of a Satellite Orbit Due to the Earth's Oblateness,"
J. Appl. Physics 27, No. 10, Oct. 1956, pp. 1141-1149.
L. J. Ippolito, R. D. Kaul, and R. G. Wallace, "Propagation Effects Handbook for Satellite Systems Design,"
NASA Reference Publication 1082 (second edition), Dec. 1981.
R. K. Crane, "Prediction of Attenuation by Rain," IF_, Transactions on Communications, Vol. Com 28,
No. 9, September 1980.
S.G. Lutz and G. Dorusheski, "Earth Antenna Beam Elevation Angles of Multiple-Access SatelliteCommunication Systems," Hughes Research Lab., Malibu, CA, Dept. 7, Contract NASW-495, August 1963.
I. Sugai and P. Christopher, "Note on Distribution of Antenna Elevation Angles in Comsat System," IEEE
Trans. on Aerospace and Electronic Systems (Corres.), Nov. 1967, pp. 981-982.
A. K. Kamal, P. Christopher, "Communication at Millimeter Wavelengths," Proc. of InternationalCommunications Conference, Denver, June 1981.
S. Wolfram, MATHEMATICA a System for Doing Mathematics by Computer, Second Edition, Adios
Wesley Publishing Co., 1991.
WR96039.DOC
345
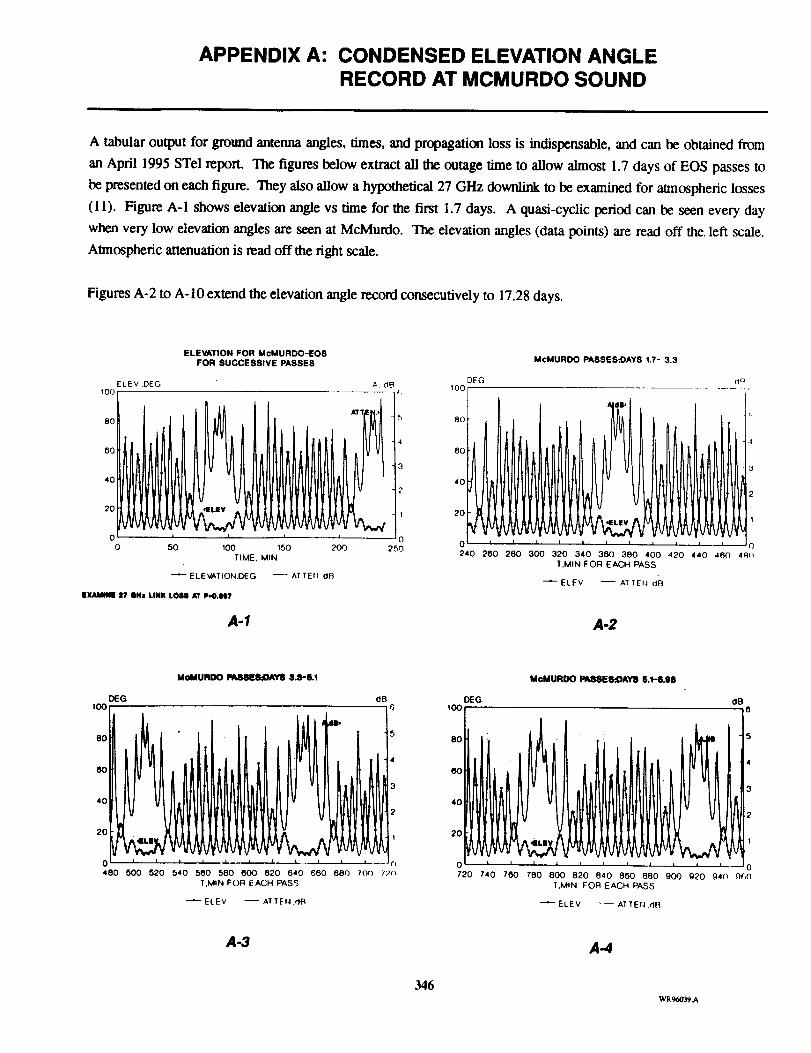
APPENDIX A: CONDENSED ELEVATION ANGLERECORD AT MCMURDO SOUND
A tabular output for ground antenna angles, times, and propagation loss is indispensable, and can be obtained from
an April 1995 STel report. The figures below extract all the outage time to allow almost 1.7 days of EOS passes to
be presented on each figure. They also allow a hypothetical 27 GHz downlink to be examined for atmospheric losses
(11). Figure A-1 shows elevation angle vs time for the first 1.7 days. A quasi-cyclic period can be seen every day
when very low elevation angles are seen at McMurdo. The elevation angles (data points) are read off the. left scale.
Almospheric attenuation is read off the right scale.
Figures A-2 to A-10 extend the elevation angle record consecutively to 17.28 days.
ELEVATION FOR McMURDO-EOSFOR SUCCESSIVE PASSES McMURDO PASSES,-OAYS 1.7- 3.3
A dO 100
*r lI_ 80
200 250
--- ATTErI,OR
ELEV,DEG100
80
60
40
2O 41
0 [
50 100 150
TIME, MIN
_ELEVATION.DEG
EXAMINE I? IHI LINK LOI_ AT P-O.l_7
DEG dR
i240 260 280 300 320 340 360 380 400 420 440 460 4Rtl
T,MIN FOR EACH PASS
ELEV -- AT TEN.dB
A-1 A.2
MoMURO0 PA86ES_)AY8 3.8-6.I MoMURO0 PA88ES_)AY8 6.1-6.88
DEG OB DEG 0B100 6 100 6
80 ' 5 80 i i . 5
• ,4 60 : ,46O
40 i 40 i
20 I t 'i i0 i c,
`480 500 520 540 560 580 600 620 6`40 ¢J60 680 700 72o 720 740 760 780 800 820 840 860 880 g00 920 940 _G(_
T.MIN FOR EACH PASS T,MIN FOR EACH PASS
_ELEV -- ATTEN.dR _ ELEV -- AT TEN.rlr_
A-3 A-4
346WR96039.A

M¢MURDO PASSES;DAY8 6.98-8.03
DEGI00
80
140
20
0
096 098
MeMURDO PA88EOiI_Iky80.S3-tO.S4
dB DEG. dB
t6 100 6
80 : d L 5
:o '2 o1 102 104 106 108 Ii 112 114 116 118 17 1.2 122 1.24 1.26 128 13 132 134 136 138 14 142 144
T,MIN FOR EACH PASS (ThouF.at_dsl T.MIN FOR EACH PASS (lhousands)
ELEV -- ATTEI4.dR _ELEV -- ATTEN.dB
A.5 A-6
McMURDO PASSES;DAYS 10.34-12.07
DEG d9
ion[ j,_, 80
A,dlI_ r_
6O 3 40
40
2 20
144 146 148 1.5 1.,52 "154 156 158 16 162 164 166 168
T,MIN FOR EACH PASS (Thousands)
ELEV -- AT TEll .dR
McMURDO PASSES:DAYS 12.1-13.9 DAYS
DEG ,IB
4
3
I
| I I _ I I I i i I ___ _L--__ _. fj
108 17 172 1.74 176 178 18 182 184 t86 188 1_ 02
T,MIN FOR EACH PASS (lhousFJnds)
ELEV -- AT TEll .d[3
A-7 A-8
M_MURIDO PA88ES;IDAY8 tli.9-16.1N! DAY8 MOMURDO PA88E$IDAY8 16.66-17.SS
DEG dB DEG dB
80 dO, 5 :I 5' i60
: °L i40
2O2O 1
0 I I I J I I I 11 0 1 I J I I ' I I I
192 1.04 1.06 198 2 202 204 206 208 21 212 214 216 210 2.18 2.2 2.22 224 2.26 228 23 232 234 236 ?38 ,
T,MIN FOR EACH PASS (Tho(asand'_.) T,MIN FOR EACH PASS (lhousBnds)
ELEV --- ATIEII dR _ ELEV -- ATTEII ,dEt
A-9 A-IO
347WR96039.A

Recommended