Draft Final FINAL
REPORT
AprilJuneFebruary
2008 2008
ID: 90805050263011
Total Maximum Daily Load Total Nitrogen and Total Phosphorus
For
Lake HenryCassidy Bayou
Yazoo River Basin Coahoma, Quitman, and Tallahatchie Leflore Countiesy, Mississippi
Prepared By Mississippi Department of Environmental Quality Office of Pollution Control TMDL/WLA Branch MDEQ PO Box 10385 Jackson, MS 39289-0385 (601) 961-5171 www.deq.state.ms.us
Mississippi Department of
Environmental Quality
Formatted: Font: Bold
Formatted: Font: Bold

Nutrient TMDL for Lake HenryCassidy Bayou
Yazoo River Basin 2
FOREWORD
This report has been prepared in accordance with the schedule contained within the federal
consent decree dated December 22, 1998. The report contains one or more Total Maximum
Daily Loads (TMDLs) for water body segments found on Mississippi’s 1996 Section 303(d) List
of Impaired Water bodies. Because of the accelerated schedule required by the consent decree,
many of these TMDLs have been prepared out of sequence with the State’s rotating basin
approach. The implementation of the TMDLs contained herein will be prioritized within
Mississippi’s rotating basin approach.
The amount and quality of the data on which this report is based are limited. As additional
information becomes available, the TMDLs may be updated. Such additional information may
include water quality and quantity data, changes in pollutant loadings, or changes in landuse
within the watershed. In some cases, additional water quality data may indicate that no
impairment exists.
Conversion Factors
To convert from To Multiply by To convert from To Multiply by
mile2 acre 640 acre ft2 43560
km2 acre 247.1 days seconds 86400
m3 ft3 35.3 meters feet 3.28
ft3 gallons 7.48 ft3 gallons 7.48
ft3 liters 28.3 hectares acres 2.47
cfs gal/min 448.8 miles meters 1609.3
cfs MGD 0.646 tonnes tons 1.1
m3 gallons 264.2 μg/l * cfs gm/day 2.45
m3 liters 1000 μg/l * MGD gm/day 3.79
Fraction Prefix Symbol Multiple Prefix Symbol
10-1 deci d 10 deka da
10-2 centi c 102 hecto h
10-3 milli m 103 kilo k
10-6 micro μ 106 mega M
10-9 nano n 109 giga G
10-12 pico p 1012 tera T
10-15 femto f 1015 peta P
10-18 atto a 1018 exa E

Nutrient TMDL for Lake HenryCassidy Bayou
Yazoo River Basin 3
TABLE OF CONTENTS
TMDL INFORMATION PAGE ................................................................................................... 54
EXECUTIVE SUMMARY .......................................................................................................... 65
INTRODUCTION ........................................................................................................................ 86
1.1 Background ......................................................................................................................... 86
1.2 Listing History .................................................................................................................... 96
1.3 Applicable Water Body Segment Use ................................................................................ 97
1.4 Applicable Water Body Segment Standard ...................................................................... 107
1.5 Nutrient Target Development ........................................................................................... 107
WATER BODY ASSESSMENT ............................................................................................... 129
2.1 Water Quality Data ........................................................................................................... 129
2.2 Assessment of Point Sources ............................................................................................ 129
2.3 Assessment of Non-Point Sources .................................................................................... 129
2.4 Estimated Existing Load for Total Nitrogen and Total Phosphorus ............................... 1510
ALLOCATION ......................................................................................................................... 1913
3.1 Wasteload Allocation ...................................................................................................... 1913
3.2 Load Allocation .............................................................................................................. 1913
3.3 Incorporation of a Margin of Safety ............................................................................... 1913
3.4 Calculation of the TMDL................................................................................................ 1913
3.5 Seasonality and Critical Condition ................................................................................. 2013
CONCLUSION ......................................................................................................................... 2114
4.1 Next Steps ....................................................................................................................... 2114
4.2 Public Participation ......................................................................................................... 2215
REFERENCES ......................................................................................................................... 2316
TMDL INFORMATION PAGE ..................................................................................................... 4
EXECUTIVE SUMMARY ............................................................................................................ 5
INTRODUCTION .......................................................................................................................... 6
1.1 Background ........................................................................................................................... 6
1.2 Stressor Identification ........................................................................................................... 6
1.3 Applicable Water Body Segment Use .................................................................................. 7
1.4 Applicable Water Body Segment Standard .......................................................................... 7
1.5 Nutrient Target Development ............................................................................................... 7
WATER BODY ASSESSMENT ................................................................................................... 9
2.1 Water Quality Data ............................................................................................................... 9
2.2 Assessment of Point Sources ................................................................................................ 9
2.3 Assessment of Non-Point Sources ........................................................................................ 9
2.4 Estimated Existing Load for Total Nitrogen and Total Phosphorus ................................... 10
ALLOCATION ............................................................................................................................. 12
3.1 Wasteload Allocation .......................................................................................................... 12
3.2 Load Allocation .................................................................................................................. 12
3.3 Incorporation of a Margin of Safety ................................................................................... 12
3.4 Calculation of the TMDL.................................................................................................... 12

Nutrient TMDL for Lake HenryCassidy Bayou
Yazoo River Basin 4
3.5 Seasonality and Critical Condition ..................................................................................... 13
CONCLUSION ............................................................................................................................. 14
4.1 Public Participation ............................................................................................................. 14
REFERENCES ............................................................................................................................. 15
FIGURES
Figure 1. Cassidy Bayou ............................................................................................................... 75
Figure 2. Cassidy Bayou §303(d) Listed Segment ....................................................................... 96
Figure 3. Cassidy Bayou Watershed Landuse .......................................................................... 1510
Figure 4. Delta Drainage Area to Flow Comparison ............................................................... 1611
Figure 1. Lake Henry ...................................................................................................................... 5
Figure 2. Lake Henry §303(d) Listed Segment .............................................................................. 6
Figure 3. Lake Henry Watershed Landuse ................................................................................... 10
Figure 4. Delta Drainage Area to Flow Comparison ................................................................... 11
TABLES
Table 1. Listing Information ......................................................................................................... 54
Table 2. Water Quality Standards ................................................................................................. 54
Table 3. Total Maximum Daily Load for Cassidy Bayou ............................................................ 54
Table 4. Nutrient Targets for the Delta Wadeable Streams ........................................................ 118
Table 5. TMDL Calculations and Watershed Sizes .................................................................. 1712
Table 1. Listing Information ........................................................................................................... 4
Table 2. Water Quality Standards ................................................................................................... 4
Table 3. Total Maximum Daily Load for Lake Henry .................................................................... 4
Table 4 Nutrient Targets for the Delta Wadeable Streams ............................................................. 8
Table 5. Nutrient Loadings for Various Land Uses ........................................................................ 9
Table 6. Landuse Distribution for the Lake Henry Watershed ..................................................... 10
Table 7. Estimated Existing Total Nitrogen Load for Lake Henry ............................................... 11
Table 8. Estimated Existing Total Phosphorous Load for Lake Henry ........................................ 11
Table 9. TN, TP, and TBODu Total Maximum Daily Load based on Ecoregion Range for
Waterbody ............................................................................................................................. 12

Nutrient TMDL for Lake HenryCassidy Bayou
Yazoo River Basin 5
TMDL INFORMATION PAGE
Table 1. Listing Information
Name ID County HUC Evaluated Cause
Lake
HenryCassidy
Bayou
MS385HLEMS2
74E
LefloreCoah
oma,
Quitman
08030207
08030202 Total Nitrogen and Total Phosphorus
Cassidy Bayou MS275E Quitman 08030202 Total Nitrogen and Total Phosphorus
Cassidy Bayou MS277E Tallahatchie 08030202 Total Nitrogen and Total Phosphorus
Table 2. Water Quality Standards
Parameter Beneficial use Water Quality Criteria
Nutrients Aquatic Life
Support
Waters shall be free from materials attributable to municipal, industrial,
agricultural, or other dischargers producing color, odor, taste, total suspended
solids, or other conditions in such degree as to create a nuisance, render the
waters injurious to public health, recreation, or to aquatic life and wildlife, or
adversely affect the palatability of fish, aesthetic quality, or impair the waters
for any designated uses.
Table 3. Total Maximum Daily Load for Lake HenryCassidy Bayou
WLA
lbs/day
LA
lbs/day MOS
TMDL
lbs/day
Total Nitrogen 0.6.430 1340.72219 Implicit 1347.15219
Total Phosphorous 0.02.90 33202.38 Implicit 205.2833
Formatted Table
Formatted Table
Formatted Table
Formatted: Font: (Default) Times New Roman, 12 pt
Formatted: Font: (Default) Times New Roman, 12 pt

Nutrient TMDL for Lake HenryCassidy Bayou
Yazoo River Basin 6
EXECUTIVE SUMMARY
This TMDL has been developed for Lake HenryCassidy Bayou which was placed on the
Mississippi 2006 Section 303(d) List of Impaired Water Bodies due to evaluated causes of
sediment and nutrients. Sediment will be addressed in a separate TMDL report. This TMDL
will provide an estimate of the total nitrogen (TN) and total phosphorus (TP) allowable in the
water body.
Mississippi does not have water quality standards for allowable nutrient concentrations. MDEQ
currently has a Nutrient Task Force (NTF) working on the development of criteria for nutrients.
An annual concentration of 1.05 mg/l is an applicable target for TN and 0.16 mg/l for TP for
water bodies located in Ecoregion 73the west side of the Delta. MDEQ is presenting these
preliminary target values for TMDL development which are subject to revision after the
development of numeric nutrient criteria.
The Lake HenryCassidy Bayou Watershed is located in HUC 0803020708030202. The listed
portion of Lake HenryCassidy Bayou (MS274E) is near Mattson from headwaters to the 274/275
watershed boundary is . Cassidy Bayou (MS275E) is near Tutwiller from the 274/275 watershed
boundary to the 275/277 watershed boundarynear Itta Bena. Cassidy Bayou (MS277E) is near
Webb from the 275/277 watershed boundary to the confluence with the Tallahatchie River. The
location of the watershed for the listed segments is shown in Figure 1.
Because the critical 7Q10 flow of Lake HenryCassidy Bayou is zero, a predictive model was not
needed to determine that this water body is not an appropriate receiving water body for
wastewater effluent. The limited nutrient data and estimated existing ecoregion concentrations
indicate reductions of nutrients can be accomplished with installation of best management
practices.
Nutrient TMDL for Lake HenryCassidy Bayou
Yazoo River Basin 7
Figure 1. Lake HenryCassidy Bayou

Nutrient TMDL for Lake HenryCassidy Bayou
Yazoo River Basin 8
INTRODUCTION
1.1 Background
The identification of water bodies not meeting their designated use and the development of total
maximum daily loads (TMDLs) for those water bodies are required by Section 303(d) of the
Clean Water Act and the Environmental Protection Agency’s (EPA) Water Quality Planning and
Management Regulations (40 CFR part 130). The TMDL process is designed to restore and
maintain the quality of those impaired water bodies through the establishment of pollutant
specific allowable loads. This TMDL has been developed for the 2006 §303(d) listed segment
shown in Figure 2.
Figure 2. Lake HenryCassidy Bayou §303(d) Listed Segment
1.2 Stressor IdentificationListing History
The impaired segment was listed due to evaluating the watershed for potential impairment.
Physical, chemical, and biological data were collected in Cassidy Bayou in 2002 and 2003 as a
part of a fish community monitoring program. This data were evaluated through a stressor
identification process that indicated sediment and nutrients were probable primary stressors.
There are no data available in the watershed.
There are no state criteria in Mississippi for nutrients. These criteria are currently being
developed by the Mississippi Nutrient Task Force in coordination with EPA Region 4. MDEQ

Nutrient TMDL for Lake HenryCassidy Bayou
Yazoo River Basin 9
proposed a work plan for nutrient criteria development that has been mutually agreed upon with
EPA Region 4 and is on schedule according to the approved timeline for development of nutrient
criteria (MDEQ, 2007).
For this TMDL, MDEQ is presenting preliminary targets for TN and TP. An annual
concentration 1.05 mg/l is an applicable target for TN and 0.16 mg/l for TP for water bodies
located in Ecoregion 73. However, MDEQ is presenting these preliminary target values for
TMDL development which are subject to revision after the development of nutrient criteria,
when the work of the NTF is complete.
1.3 Applicable Water Body Segment Use
The water use classifications are established by the State of Mississippi in the document State of
Mississippi Water Quality Criteria for Intrastate, Interstate, and Coastal Waters (MDEQ, 2007).
The designated beneficial use for the listed segments is Fish and Wildlife.
1.4 Applicable Water Body Segment Standard
The water quality standard applicable to the use of the water body and the pollutant of concern is
defined in the State of Mississippi Water Quality Criteria for Intrastate, Interstate, and Coastal
Waters (MDEQ, 2007).
Mississippi’s current standards contain a narrative criteria that can be applied to nutrients which
states “Waters shall be free from materials attributable to municipal, industrial, agricultural, or
other discharges producing color, odor, taste, total suspended or dissolved solids, sediment,
turbidity, or other conditions in such degree as to create a nuisance, render the waters injurious
to public health, recreation, or to aquatic life and wildlife, or adversely affect the palatability of
fish, aesthetic quality, or impair the waters for any designated use (MDEQ, 2007).” In the 1999
Protocol for Developing Nutrient TMDLs, EPA suggests several methods for the development of
numeric criteria for nutrients (USEPA, 1999). In accordance with the 1999 Protocol, “The target
value for the chosen indicator can be based on: comparison to similar but unimpaired waters;
user surveys; empirical data summarized in classification systems; literature values; or
professional judgment.” MDEQ believes the most economical and scientifically defensible
method for use in Mississippi is a comparison between similar but unimpaired waters within the
same region. This method is dependent on adequate data which are being collected in
accordance with the current nutrient criteria development plan.
1.5 Nutrient Target Development
Numeric nutrient criteria are not currently available for Delta streams. Biotic indices such as the
MBISQ index used to assess attainment of aquatic life use in streams in other parts of
Mississippi are also not available for the Delta. Therefore, a percentile approach has been used
to suggest nutrient targets applicable for Delta streams, following the approach suggested by
EPA (EPA 2000).
USGS data were partitioned into eastern and western nutrient distributions. USGS nutrient data
for the western portion of the Delta were combined with MDEQ’s WADES nutrient data. These
two data distributions were used to derive the nutrient concentration associated with the lower

Nutrient TMDL for Lake HenryCassidy Bayou
Yazoo River Basin 10
quartile following procedures similar to those used by EPA (2001) in developing nutrient criteria
recommendations for rivers and streams. The lower quartile nutrient concentrations associated
with these data sets are shown in the Table 4 below.
For this TMDL, MDEQ is presenting preliminary targets for TN and TP. An annual
concentration 1.05 mg/l is an applicable target for TN and 0.16 mg/l for TP for water bodies
located in the west side of the Delta. However, MDEQ is presenting these preliminary target
values for TMDL development which are subject to revision after the development of nutrient
criteria, when the work of the NTF is complete.
Table 4. Nutrient Targets for the Delta Wadeable Streams
Lower Quartile Values
Nutrient Conc. (mg/l) East (USGS) West (WADES/USGS)
TP 0.09 0.16
TN 0.58 1.05
Nutrient TMDL for Lake HenryCassidy Bayou
Yazoo River Basin 11
WATER BODY ASSESSMENT
2.1 Water Quality Data
There are no data available for this water body are presented in the stressor identification report
(MDEQ, 2008).
.
2.2 Assessment of Point Sources
There are two NPDES pointno point sources in the watershed.
Green Acres Water Association Inc, East Park Subdivision Water NPDES No. MS0022683
Coahoma County
Lyon, Mississippi
Coahoma County School District, Lyon Elementary School Water NPDES No. MS0031968
Coahoma County
Clarksdale, Mississippi
Both of these water permits are minor facilities, and they are not significant sources of pollutant
for this TMDL. The flows are 0.057 and 0.010 MGD respectively. The determination of the
WLA is shown in Table 5. The estimated concentration from the effluent is 11.5 mg/l TN and
5.2 mg/l TP for each facility.
2.3 Assessment of Non-Point Sources
Non-point loading of nutrients and organic material in a water body results from the transport of
the pollutants into receiving waters by overland surface runoff, groundwater infiltration, and
atmospheric deposition. The two primary nutrients of concern are nitrogen and phosphorus.
Total nitrogen is a combination of many forms of nitrogen found in the environment. Inorganic
nitrogen can be transported in particulate and dissolved phases in surface runoff. Dissolved
inorganic nitrogen can be transported in groundwater and may enter a water body from
groundwater infiltration. Finally, atmospheric gaseous nitrogen may enter a water body from
atmospheric deposition.
Unlike nitrogen, phosphorus is primarily transported in surface runoff when it has been sorbed
by eroding sediment. Phosphorus may also be associated with fine-grained particulate matter in
the atmosphere and can enter streams as a result of dry fallout and rainfall (USEPA, 1999).
However, phosphorus is typically not readily available from the atmosphere or the natural water
supply (Davis and Cornwell, 1988). As a result, phosphorus is typically the limiting nutrient in
most non-point source dominated rivers and streams, with the exception of watersheds which are
dominated by agriculture and have high concentrations of phosphorus contained in the surface
runoff due to fertilizers and animal excrement or watersheds with naturally occurring soils which
are rich in phosphorus (Thomann and Mueller, 1987).

Nutrient TMDL for Lake HenryCassidy Bayou
Yazoo River Basin 12
Watersheds with a large number of failing septic tanks may also deliver significant loadings of
phosphorus to a water body. All domestic wastewater contains phosphorus which comes from
humans and the use of phosphate containing detergents. Table 5 presents the estimated loads
from various land use types in the Delta based on information from USDA ARS Sedimentation
Laboratory. (Shields, et. al., 2008)typical nutrient loading ranges for various land uses.
Table 5. Nutrient Loadings for Various Land Uses
Landuse
Total Phosphorus [lbs/acre-y] Total Nitrogen [lbs/acre-y]
Minimum Maximum Median Minimum Maximum Median
Roadway 0.53 1.34 0.98 1.2 3.1 2.1
Commercial 0.61 0.81 0.71 1.4 7.8 4.6
Single Family-Low Density 0.41 0.57 0.49 2.9 4.2 3.6
Single Family-High Density 0.48 0.68 0.58 3.6 5.0 5.2
Multifamily Residential 0.53 0.72 0.62 4.2 5.9 5.0
Forest 0.09 0.12 0.10 1.0 2.5 1.8
Grass 0.01 0.22 0.12 1.1 6.3 3.7
Pasture 0.01 0.22 0.12 1.1 6.3 3.7
Source: Horner et al., 1994 in Protocol for Developing Nutrient TMDLs (USEPA 1999)
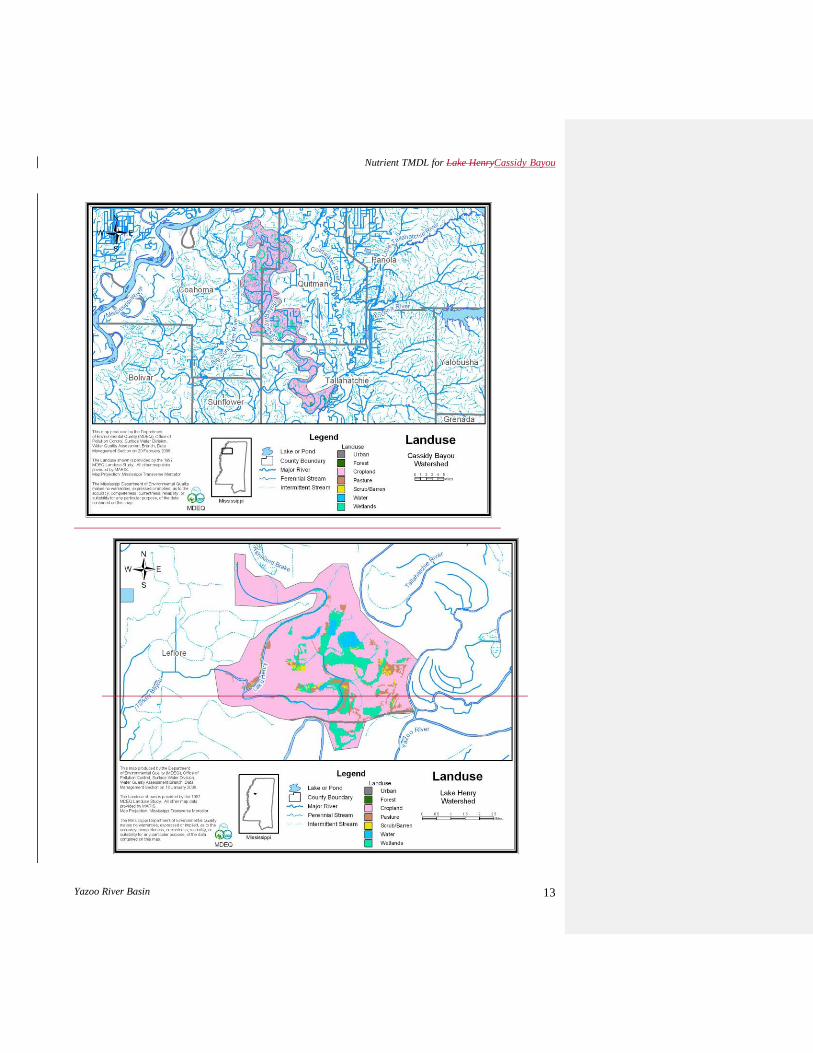
The drainage area of Lake Henry is approximately 16,800 acres or 26.2 square miles. The
watershed contains mainly cropland but also has different landuse types, including urban, water,
and wetlands. The land use information for the watershed is based on the National Land Cover
Database (NLCD). The landuse information given below is based on data collected by the State
of Mississippi’s Automated Resource Information System (MARIS) 1997. This data set is based
on Landsat Thematic Mapper digital images taken between 1992 2002 and 19932004. Cropland
is the dominant landuse within this watershed. The landuse distribution for the Lake
HenryCassidy Bayou Watershed is shown in Table 6 5 and Figure 3. By multiplyingtaking the
landuse category size by the estimated nutrient load, the watershed specific estimate can be
calculated. and calculating worst-case estimates based on figures given in Table 5 the estimated
existing TP concentration is 0.31 mg/l and the estimated existing TN concentration is 6.03
mg/l.Table 5 presents the estimated loads, the target loads, and the reductions needed to meet the
TMDLs.
Table 6. Landuse Distribution for the Lake Henry Watershed
In Acres Urban Forest Cropland Pasture Scrub/Barren Water Wetlands
Lake Henry 1,551.4 10.0 12,626.0 0.0 3.3 819.3 1,786.5
Percentage 9.24% 0.06% 75.17% 0.00% 0.02% 4.88% 10.64%
Formatted Table
Formatted: Centered
Formatted: Centered
Formatted: Centered
Formatted: Centered
Formatted: Centered
Formatted: Centered
Formatted: Centered
Formatted: Centered
Nutrient TMDL for Lake HenryCassidy Bayou
Yazoo River Basin 13

Nutrient TMDL for Lake HenryCassidy Bayou
Yazoo River Basin 14
Figure 3. Lake HenryCassidy Bayou Watershed Landuse
2.4 Estimated Existing Load for Total Nitrogen and Total
Phosphorus
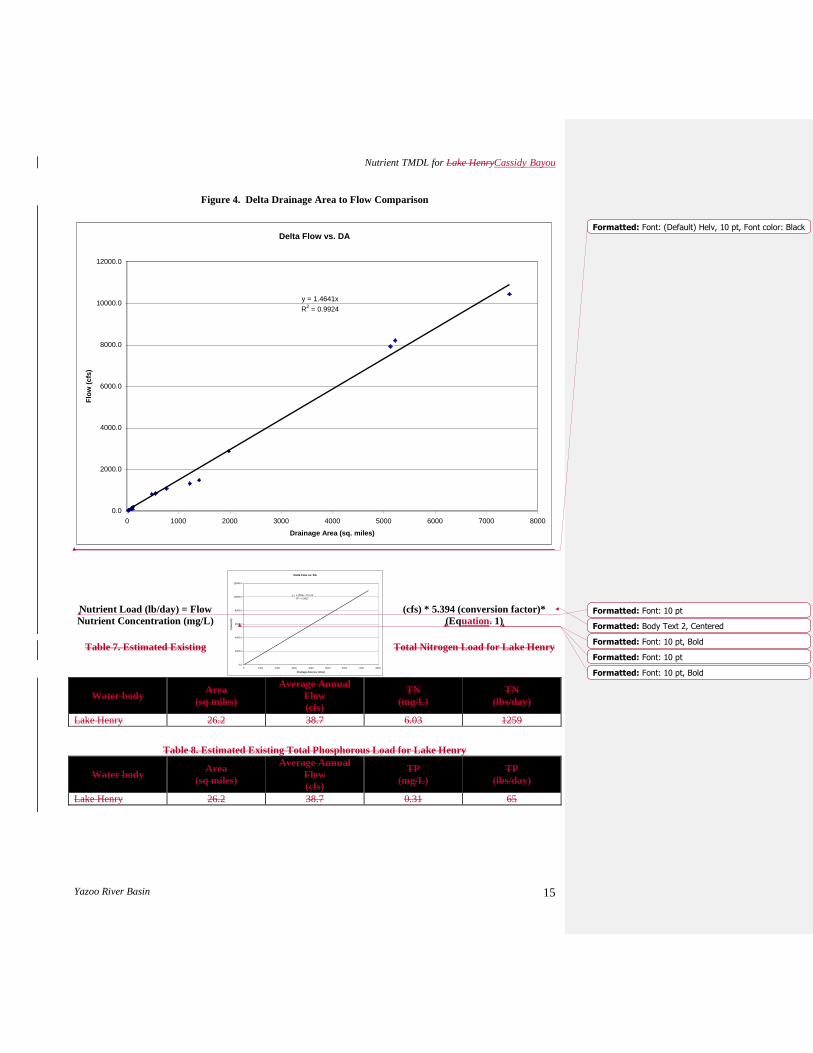
The average annual flow in the watershed was calculated by utilizing the flow vs. watershed area
graph shown in figure 4 below. All available gages were compared to the watershed size. A
very strong correlation between flow and watershed size was developed for the Delta. The
equation for the line that best fits the data was then used to estimate the annual average flow for
Cassidy Bayou watershed. The TMDL target TN and TP loads were then calculated, using
Equation 1 and the results are shown in Table 5.
The flow in the watershed was calculated by utilizing the flow to watershed graph shown below.
To convert the estimated existing total nitrogen concentration to a total nitrogen load, the
average annual flow for Lake Henry was estimated based on USGS monitoring stations located
in the Delta. All available gages were tallied and compared to the watershed size. A very strong
correlation between flow and drainage area size was developed for the Delta. Figure 4 shows the
graph comparing the drainage area to the annual average flows. The equation for the line that
best fits the data was then used to estimate the annual average flow for Lake HenryCassidy
Bayou watershed. Thus, the annual average flow in Lake Henry is estimated as 38.7 cfs. The
TMDLexisting TN and TP loads were then calculated, using Equation 1 and the results are
shown in Tables 57 and 8..
Nutrient TMDL for Lake HenryCassidy Bayou
Yazoo River Basin 15
Figure 4. Delta Drainage Area to Flow Comparison
Delta Flow vs. DA
y = 1.4641x
R2 = 0.9924
0.0
2000.0
4000.0
6000.0
8000.0
10000.0
12000.0
0 1000 2000 3000 4000 5000 6000 7000 8000
Drainage Area (sq. miles)
Flo
w (
cfs
)
Nutrient Load (lb/day) = Flow (cfs) * 5.394 (conversion factor)*
Nutrient Concentration (mg/L) (Equation. 1)
Table 7. Estimated Existing Total Nitrogen Load for Lake Henry
Water body Area
(sq miles)
Average Annual
Flow
(cfs)
TN
(mg/L)
TN
(lbs/day)
Lake Henry 26.2 38.7 6.03 1259
Table 8. Estimated Existing Total Phosphorous Load for Lake Henry
Water body Area
(sq miles)
Average Annual
Flow
(cfs)
TP
(mg/L)
TP
(lbs/day)
Lake Henry 26.2 38.7 0.31 65
Delta Flow vs. DA
y = 1.4793x - 72.413
R2 = 0.9927
0.0
2000.0
4000.0
6000.0
8000.0
10000.0
12000.0
0 1000 2000 3000 4000 5000 6000 7000 8000
Drainage Area (sq. miles)
Flo
w (
cfs
)Formatted: Font: (Default) Helv, 10 pt, Font color: Black
Formatted: Font: 10 pt
Formatted: Body Text 2, Centered
Formatted: Font: 10 pt, Bold
Formatted: Font: 10 pt
Formatted: Font: 10 pt, Bold
Nutrient TMDL for Lake HenryCassidy Bayou
Yazoo River Basin 16
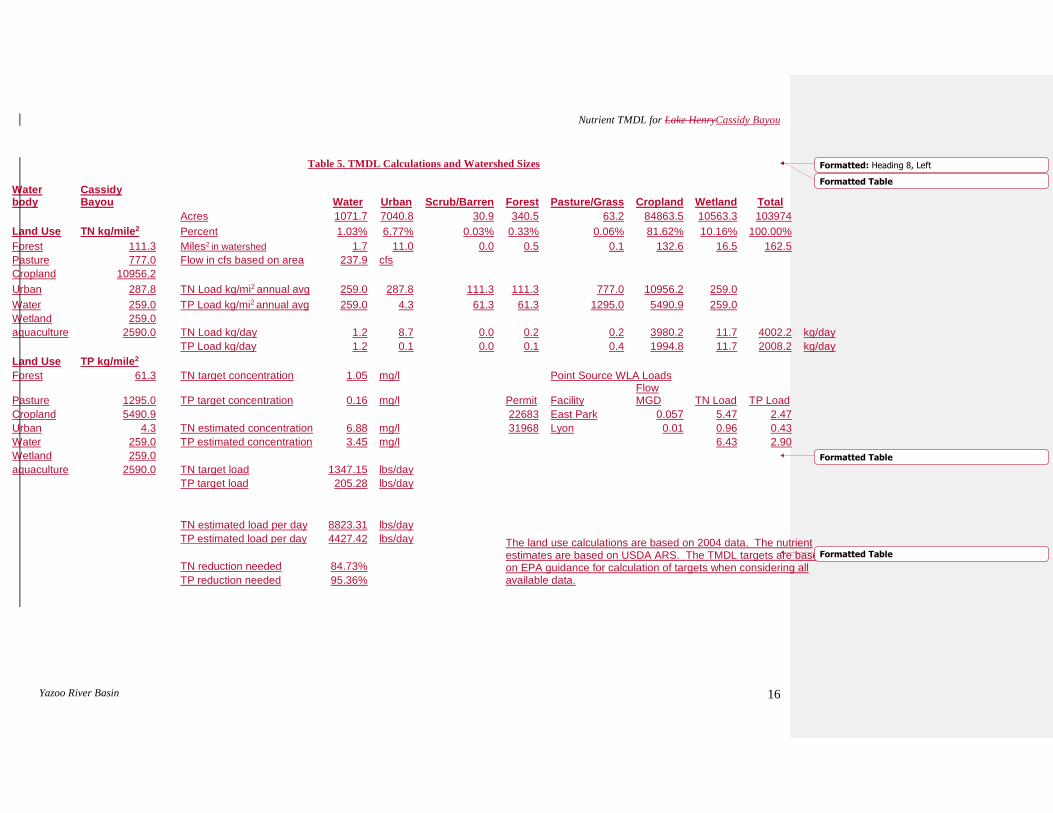
Table 5. TMDL Calculations and Watershed Sizes
Water body
Cassidy Bayou Water Urban Scrub/Barren Forest Pasture/Grass Cropland Wetland Total
Acres 1071.7 7040.8 30.9 340.5 63.2 84863.5 10563.3 103974
Land Use TN kg/mile2 Percent 1.03% 6.77% 0.03% 0.33% 0.06% 81.62% 10.16% 100.00%
Forest 111.3 Miles2 in watershed 1.7 11.0 0.0 0.5 0.1 132.6 16.5 162.5
Pasture 777.0 Flow in cfs based on area 237.9 cfs
Cropland 10956.2
Urban 287.8 TN Load kg/mi2 annual avg 259.0 287.8 111.3 111.3 777.0 10956.2 259.0
Water 259.0 TP Load kg/mi2 annual avg 259.0 4.3 61.3 61.3 1295.0 5490.9 259.0
Wetland 259.0
aquaculture 2590.0 TN Load kg/day 1.2 8.7 0.0 0.2 0.2 3980.2 11.7 4002.2 kg/day
TP Load kg/day 1.2 0.1 0.0 0.1 0.4 1994.8 11.7 2008.2 kg/day
Land Use TP kg/mile2
Forest 61.3 TN target concentration 1.05 mg/l Point Source WLA Loads
Pasture 1295.0 TP target concentration 0.16 mg/l Permit Facility Flow MGD TN Load TP Load
Cropland 5490.9 22683 East Park 0.057 5.47 2.47
Urban 4.3 TN estimated concentration 6.88 mg/l 31968 Lyon 0.01 0.96 0.43
Water 259.0 TP estimated concentration 3.45 mg/l 6.43 2.90
Wetland 259.0
aquaculture 2590.0 TN target load 1347.15 lbs/day
TP target load 205.28 lbs/day
TN estimated load per day 8823.31 lbs/day
TP estimated load per day 4427.42 lbs/day The land use calculations are based on 2004 data. The nutrient estimates are based on USDA ARS. The TMDL targets are based on EPA guidance for calculation of targets when considering all available data.
TN reduction needed 84.73%
TP reduction needed 95.36%
Formatted: Heading 8, Left
Formatted Table
Formatted Table
Formatted Table

Nutrient TMDL for Lake HenryCassidy Bayou
Yazoo River Basin 17
Formatted: Section start: New page
Nutrient TMDL for Lake HenryCassidy Bayou
Yazoo River Basin 18
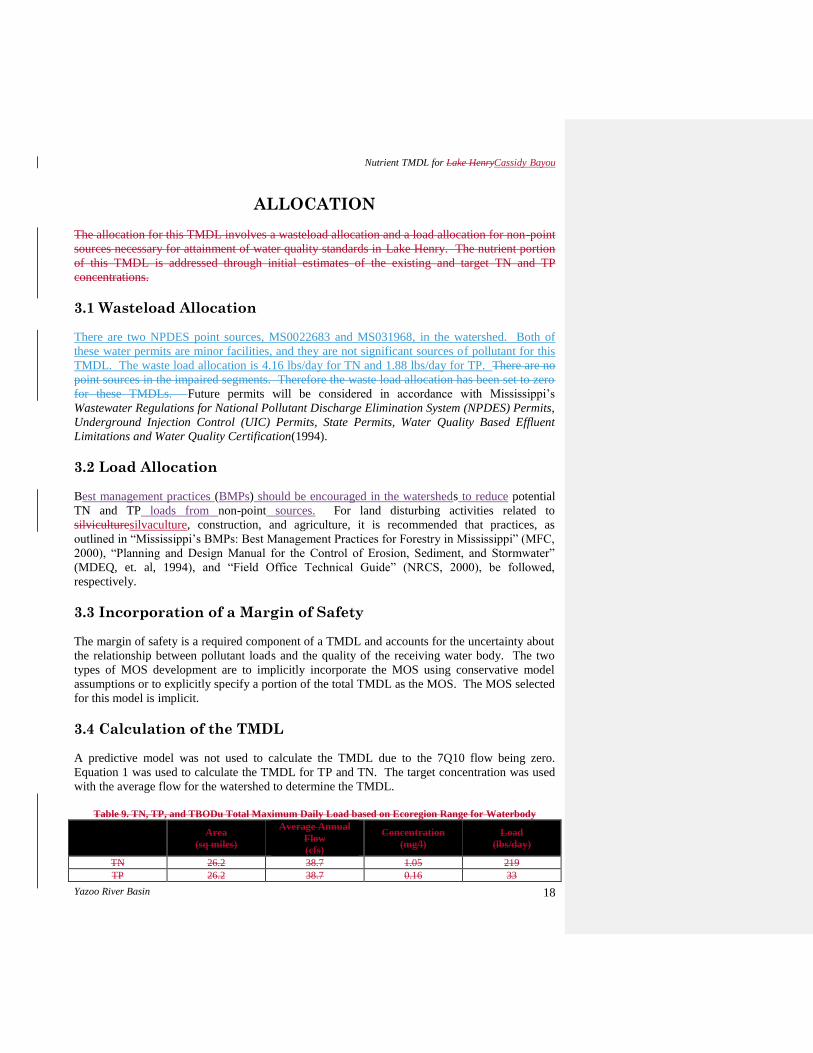
ALLOCATION
The allocation for this TMDL involves a wasteload allocation and a load allocation for non-point
sources necessary for attainment of water quality standards in Lake Henry. The nutrient portion
of this TMDL is addressed through initial estimates of the existing and target TN and TP
concentrations.
3.1 Wasteload Allocation
There are two NPDES point sources, MS0022683 and MS031968, in the watershed. Both of
these water permits are minor facilities, and they are not significant sources of pollutant for this
TMDL. The waste load allocation is 4.16 lbs/day for TN and 1.88 lbs/day for TP. There are no
point sources in the impaired segments. Therefore the waste load allocation has been set to zero
for these TMDLs. Future permits will be considered in accordance with Mississippi’s
Wastewater Regulations for National Pollutant Discharge Elimination System (NPDES) Permits,
Underground Injection Control (UIC) Permits, State Permits, Water Quality Based Effluent
Limitations and Water Quality Certification(1994).
3.2 Load Allocation
Best management practices (BMPs) should be encouraged in the watersheds to reduce potential
TN and TP loads from non-point sources. For land disturbing activities related to
silviculturesilvaculture, construction, and agriculture, it is recommended that practices, as
outlined in “Mississippi’s BMPs: Best Management Practices for Forestry in Mississippi” (MFC,
2000), “Planning and Design Manual for the Control of Erosion, Sediment, and Stormwater”
(MDEQ, et. al, 1994), and “Field Office Technical Guide” (NRCS, 2000), be followed,
respectively.
3.3 Incorporation of a Margin of Safety
The margin of safety is a required component of a TMDL and accounts for the uncertainty about
the relationship between pollutant loads and the quality of the receiving water body. The two
types of MOS development are to implicitly incorporate the MOS using conservative model
assumptions or to explicitly specify a portion of the total TMDL as the MOS. The MOS selected
for this model is implicit.
3.4 Calculation of the TMDL
A predictive model was not used to calculate the TMDL due to the 7Q10 flow being zero.
Equation 1 was used to calculate the TMDL for TP and TN. The target concentration was used
with the average flow for the watershed to determine the TMDL.
Table 9. TN, TP, and TBODu Total Maximum Daily Load based on Ecoregion Range for Waterbody
Area
(sq miles)
Average Annual
Flow
(cfs)
Concentration
(mg/l)
Load
(lbs/day)
TN 26.2 38.7 1.05 219
TP 26.2 38.7 0.16 33

Nutrient TMDL for Lake HenryCassidy Bayou
Yazoo River Basin 19
The nutrient TMDL loads were then compared to the estimated existing loads previously
calculated. The estimated existing TP concentration of 65 pounds per day indicates needed
reductions of 48.6 %. The TMDL for TP is 33 lbs/day. The estimated existing total nitrogen
concentration indicates needed reductions of 82.6%. The TMDL for TN is 219 lbs/day. Best
management practices are encouraged in this watershed to reduce the nonpoint nutrient and
organic enrichment loads. The BMPs used to control the nutrient loads will also control the
organic enrichment loads which will lead to the water quality meeting the standards.
3.5 Seasonality and Critical Condition
This TMDL accounts for seasonal variability by requiring allocations that ensure year-round
protection of water quality standards, including during critical conditions.

Nutrient TMDL for Lake HenryCassidy Bayou
Yazoo River Basin 20
CONCLUSION
Nutrients were addressed through an estimate of a preliminary total phosphorous concentration
target and a preliminary total nitrogen concentration target. Based on the estimated existing and
target total phosphorous concentrations, this TMDL recommends a 84.7348.6% reduction of the
phosphorous loads entering these water bodies to meet the preliminary target range of 0.16 mg/l.
Based on the estimated existing and target total nitrogen concentrations, this TMDL recommends
a 895.362.6 % reduction of the nitrogen loads entering these water bodies to meet the
preliminary target range of 1.05 mg/l. The implementation of these BMP activities should
reduce the nutrient load entering the creeks. This will provide improved water quality for
organic enrichment and the support of aquatic life in the water bodies, and will result in the
attainment of the applicable water quality standards.
4.1 Next Steps
MDEQ's Basin Management Approach and Nonpoint Source Program emphasize restoration of
impaired waters with developed TMDLs. During the watershed prioritization process to be
conducted by the Yazoo River Basin Team, this TMDL will be considered as a basis for
implementing possible restoration projects. The basin team is made up of state and federal
resource agencies and stakeholder organizations and provides the opportunity for these entities to
work with local stakeholders to achieve quantifiable improvements in water quality. Together,
basin team members work to understand water quality conditions, determine causes and sources
of problems, prioritize watersheds for potential water quality restoration and protection activities,
and identify collaboration and leveraging opportunities. The Basin Management Approach and
the Nonpoint Source Program work together to facilitate and support these activities.
The Nonpoint Source Program provides financial incentives to eligible parties to implement
appropriate restoration and protection projects through the Clean Water Act's Section 319
Nonpoint Source (NPS) Grant Program. This program makes available around $1.6M each grant
year for restoration and protections efforts by providing a 60% cost share for eligible projects.
Mississippi Soil and Water Conservation Commission (MSWCC) is the lead agency responsible
for abatement of agricultural NPS pollution through training, promotion, and installation of
BMPs on agricultural lands. USDA Natural Resource Conservation Service (NRCS) provides
technical assistance to MSWCC through its conservation districts located in each county. NRCS
assists animal producers in developing nutrient management plans and grazing management
plans. MDEQ, MSWCC, NRCS, and other governmental and nongovernmental organizations
work closely together to reduce agricultural runoff through the Section 319 NPS Program.
Mississippi Forestry Commission (MFC), in cooperation with the Mississippi Forestry
Association (MFA) and Mississippi State University (MSU), have taken a leadership role in the
development and promotion of the forestry industry Best Management Practices (BMPs) in
Mississippi. MDEQ is designated as the lead agency for implementing an urban polluted runoff
control program through its Stormwater Program. Through this program, MDEQ regulates most
construction activities. Mississippi Department of Transportation (MDOT) is responsible for
implementation of erosion and sediment control practices on highway construction.

Nutrient TMDL for Lake HenryCassidy Bayou
Yazoo River Basin 21
Due to this TMDL, projects within this watershed will receive a higher score and ranking for
funding through the basin team process and Nonpoint Source Program described above.
4.2 Public Participation
4.1 Public Participation
This TMDL will be published for a 30-day public notice. During this time, the public will be
notified by publication in the statewide newspaper. The public will be given an opportunity to
review the TMDLs and submit comments. MDEQ also distributes all TMDLs at the beginning
of the public notice to those members of the public who have requested to be included on a
TMDL mailing list. Anyone wishing to become a member of the TMDL mailing list should
contact Kay Whittington at [email protected].
All comments should be directed to [email protected] or Kay Whittington,
MDEQ, PO Box 10385, Jackson, MS 39289. All comments received during the public notice
period and at any public hearings become a part of the record of this TMDL and will be
considered in the submission of this TMDL to EPA Region 4 for final approval.
Formatted: Heading 2, Left, Widow/Orphan control
Formatted: Font color: Auto
Nutrient TMDL for Lake HenryCassidy Bayou
Yazoo River Basin 22
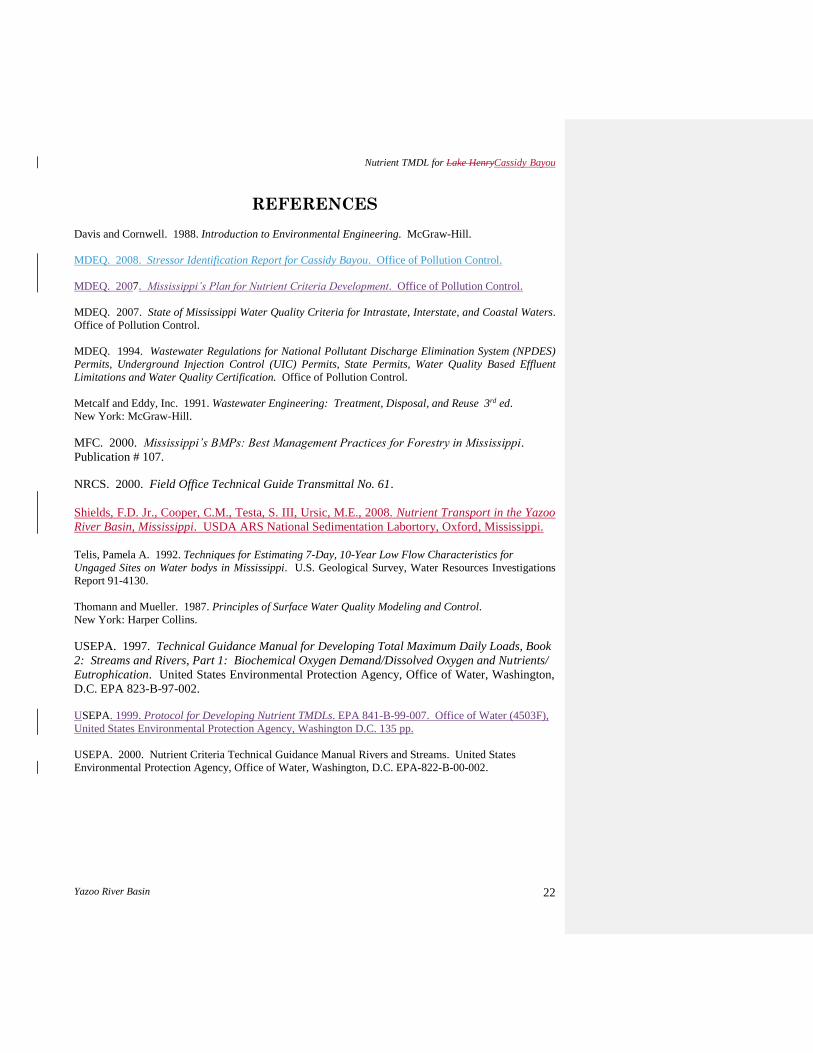
REFERENCES Davis and Cornwell. 1988. Introduction to Environmental Engineering. McGraw-Hill.
MDEQ. 2008. Stressor Identification Report for Cassidy Bayou. Office of Pollution Control.
MDEQ. 2007. Mississippi’s Plan for Nutrient Criteria Development. Office of Pollution Control.
MDEQ. 2007. State of Mississippi Water Quality Criteria for Intrastate, Interstate, and Coastal Waters.
Office of Pollution Control.
MDEQ. 1994. Wastewater Regulations for National Pollutant Discharge Elimination System (NPDES)
Permits, Underground Injection Control (UIC) Permits, State Permits, Water Quality Based Effluent
Limitations and Water Quality Certification. Office of Pollution Control.
Metcalf and Eddy, Inc. 1991. Wastewater Engineering: Treatment, Disposal, and Reuse 3rd ed.
New York: McGraw-Hill.
MFC. 2000. Mississippi’s BMPs: Best Management Practices for Forestry in Mississippi.
Publication # 107.
NRCS. 2000. Field Office Technical Guide Transmittal No. 61.
Shields, F.D. Jr., Cooper, C.M., Testa, S. III, Ursic, M.E., 2008. Nutrient Transport in the Yazoo
River Basin, Mississippi. USDA ARS National Sedimentation Labortory, Oxford, Mississippi.
Telis, Pamela A. 1992. Techniques for Estimating 7-Day, 10-Year Low Flow Characteristics for
Ungaged Sites on Water bodys in Mississippi. U.S. Geological Survey, Water Resources Investigations
Report 91-4130.
Thomann and Mueller. 1987. Principles of Surface Water Quality Modeling and Control.
New York: Harper Collins.
USEPA. 1997. Technical Guidance Manual for Developing Total Maximum Daily Loads, Book
2: Streams and Rivers, Part 1: Biochemical Oxygen Demand/Dissolved Oxygen and Nutrients/
Eutrophication. United States Environmental Protection Agency, Office of Water, Washington,
D.C. EPA 823-B-97-002.
USEPA. 1999. Protocol for Developing Nutrient TMDLs. EPA 841-B-99-007. Office of Water (4503F),
United States Environmental Protection Agency, Washington D.C. 135 pp.
USEPA. 2000. Nutrient Criteria Technical Guidance Manual Rivers and Streams. United States
Environmental Protection Agency, Office of Water, Washington, D.C. EPA-822-B-00-002.
Recommended