© EBA | European Banking Authority
Draft reports on the impact of the LCR and on uniform definitions of liquidity under Article 509 CRR
London, 23 October 2013
2 2
Disclaimer
This presentation intends to inform the state of play of the report on uniform definitions
of liquidity which the EBA is mandated to produce by 31 December 2013 for the
Commission as per Article 509 (3) of the CRR. It must be strictly considered that the
findings and conclusions included here are preliminary and can substantially change
when the full analysis is finalised.
3 3 3
Structure
1. Background and rationale for liquidity regulation
2. Part I: HQLA report
3. Part II: Impact assessment report
4. Conclusions and next steps
4 4
Background
The banking crisis and the need for further liquidity regulation:
1. The liquidity position of banks has been seriously hit during the recent crisis.
2. Inappropriate funding structures and scarce liquidity buffers prevailed.
3. Liquidity stress situations have led, on occasions, to public interventions.
4. Liquidity stress situations have proved lasting over time.
5. There was a clear evidence of need to intervene through regulations in the banking liquidity
management.
5 5
Background
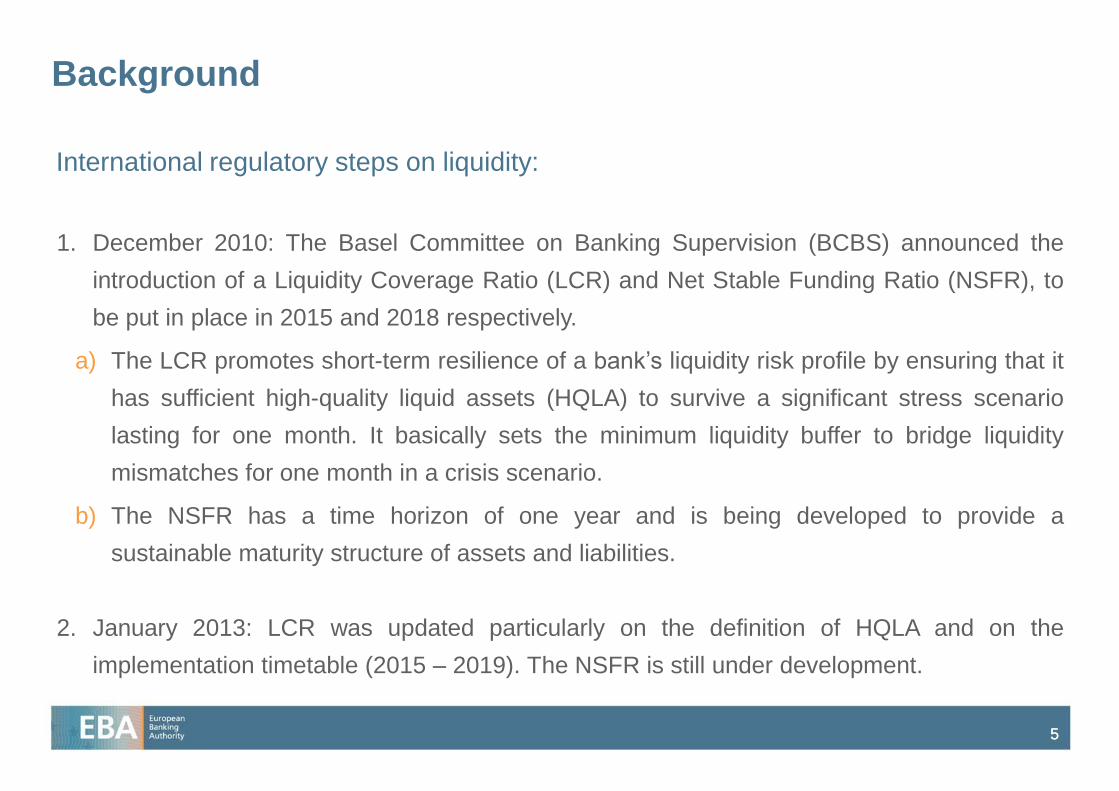
International regulatory steps on liquidity:
1. December 2010: The Basel Committee on Banking Supervision (BCBS) announced the
introduction of a Liquidity Coverage Ratio (LCR) and Net Stable Funding Ratio (NSFR), to
be put in place in 2015 and 2018 respectively.
a) The LCR promotes short-term resilience of a bank’s liquidity risk profile by ensuring that it
has sufficient high-quality liquid assets (HQLA) to survive a significant stress scenario
lasting for one month. It basically sets the minimum liquidity buffer to bridge liquidity
mismatches for one month in a crisis scenario.
b) The NSFR has a time horizon of one year and is being developed to provide a
sustainable maturity structure of assets and liabilities.
2. January 2013: LCR was updated particularly on the definition of HQLA and on the
implementation timetable (2015 – 2019). The NSFR is still under development.
6 6
Background
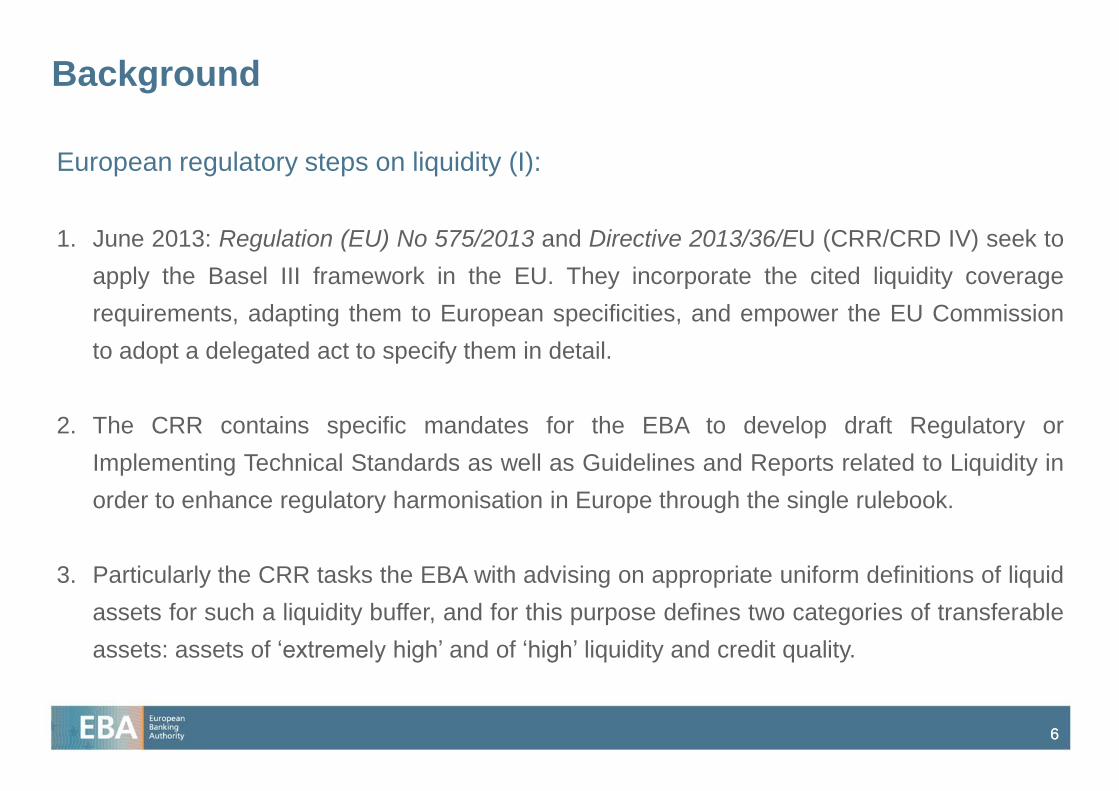
European regulatory steps on liquidity (I):
1. June 2013: Regulation (EU) No 575/2013 and Directive 2013/36/EU (CRR/CRD IV) seek to
apply the Basel III framework in the EU. They incorporate the cited liquidity coverage
requirements, adapting them to European specificities, and empower the EU Commission
to adopt a delegated act to specify them in detail.
2. The CRR contains specific mandates for the EBA to develop draft Regulatory or
Implementing Technical Standards as well as Guidelines and Reports related to Liquidity in
order to enhance regulatory harmonisation in Europe through the single rulebook.
3. Particularly the CRR tasks the EBA with advising on appropriate uniform definitions of liquid
assets for such a liquidity buffer, and for this purpose defines two categories of transferable
assets: assets of ‘extremely high’ and of ‘high’ liquidity and credit quality.
7 7
Background
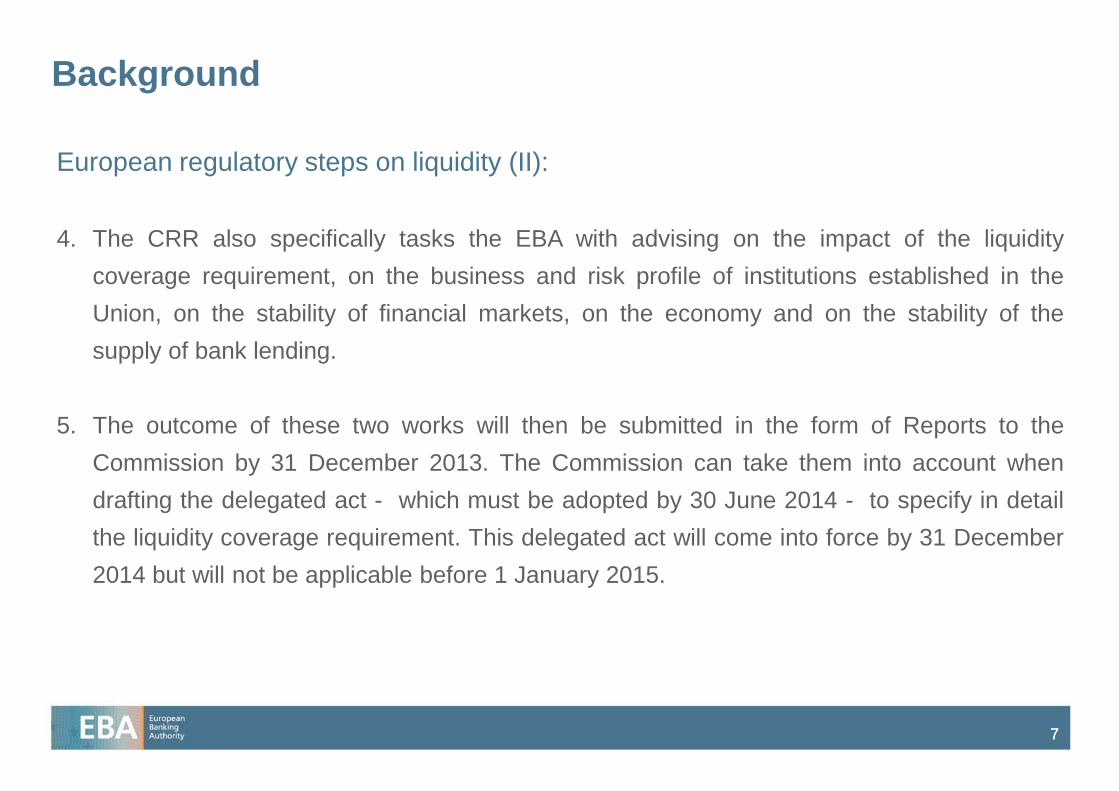
European regulatory steps on liquidity (II):
4. The CRR also specifically tasks the EBA with advising on the impact of the liquidity
coverage requirement, on the business and risk profile of institutions established in the
Union, on the stability of financial markets, on the economy and on the stability of the
supply of bank lending.
5. The outcome of these two works will then be submitted in the form of Reports to the
Commission by 31 December 2013. The Commission can take them into account when
drafting the delegated act - which must be adopted by 30 June 2014 - to specify in detail
the liquidity coverage requirement. This delegated act will come into force by 31 December
2014 but will not be applicable before 1 January 2015.
8 8
Background
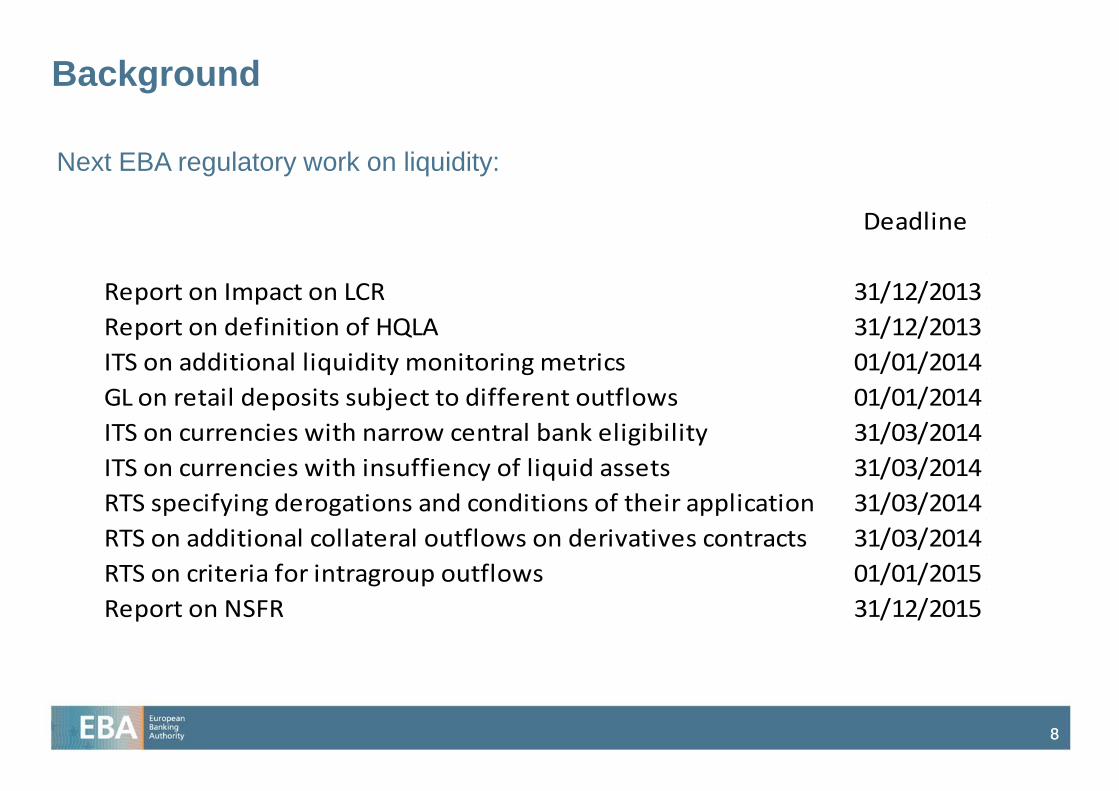
Next EBA regulatory work on liquidity:
Deadline
Report on Impact on LCR 31/12/2013
Report on definition of HQLA 31/12/2013
ITS on additional liquidity monitoring metrics 01/01/2014
GL on retail deposits subject to different outflows 01/01/2014
ITS on currencies with narrow central bank eligibility 31/03/2014
ITS on currencies with insuffiency of liquid assets 31/03/2014
RTS specifying derogations and conditions of their application 31/03/2014
RTS on additional collateral outflows on derivatives contracts 31/03/2014
RTS on criteria for intragroup outflows 01/01/2015
Report on NSFR 31/12/2015
9 9
PART I: HQLA Report
9
10 10
Mandate
The EBA shall report to the Commission for the purpose of reporting on :
1. Uniform definitions of extremely high liquidity and credit quality of transferable assets,
2. Uniform definitions of high liquidity and credit quality of transferable assets,
3. Haircuts on transferable assets that are of high liquidity and credit quality.
The EBA shall furthermore report on:
1. Operational requirements for the holdings of liquid assets in line with international
regulatory developments.
The report is to be consulted with
1. ESMA
2. ECB
11 11
Feedback from the DP on defining liquid assets (Feb 2013)
1. Broad support of the methodological approach.
2. The absence of coverage of repo markets was felt as critical by respondents. The volume
of private repo markets has been included as a supplementary liquidity metric.
3. Respondents considered a qualitative judgment as a necessary tool to complement the
quantitative analysis. In some cases a qualitative judgment is being employed due to lack of
empirical evidence. However, our mandate requires a quantitative approach where
possible.
4. Some respondents asked for an ISIN-list of liquid assets. The report will propose a set of
asset classes, with specific characteristics, which will be deemed eligible. The EBA will not
attempt to identify a list of individual ISINs, which will remain the responsibility of banks
when applying the precise methodology adopted for the EU.
12 12
Feedback from the DP on defining liquid assets (Feb 2013)
5. A periodic review/update of the definition of liquid assets was recommended. At this point in
time, the EBA has been mandated to provide a one-off report on a uniform definition of
liquid assets. However, we can recommend a periodic review in our report.
6. Guidance on the definition of HQLA denominated in non-EU currencies was requested. For
practical reasons and due to data restrictions, the quantitative assessment conducted by
EBA will focus on European currencies only. Nevertheless, the EBA is considering different
alternatives to deal with this issue.
13 13
Methodology (Gathering and cleaning of data)
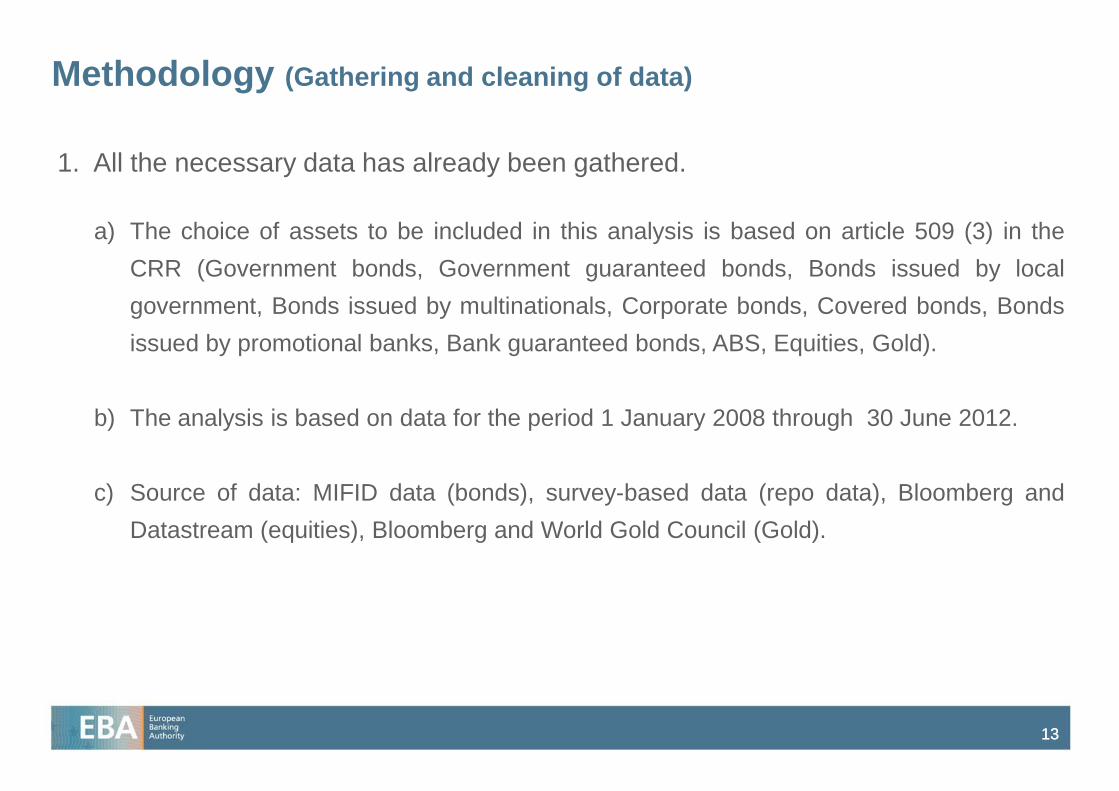
1. All the necessary data has already been gathered.
a) The choice of assets to be included in this analysis is based on article 509 (3) in the
CRR (Government bonds, Government guaranteed bonds, Bonds issued by local
government, Bonds issued by multinationals, Corporate bonds, Covered bonds, Bonds
issued by promotional banks, Bank guaranteed bonds, ABS, Equities, Gold).
b) The analysis is based on data for the period 1 January 2008 through 30 June 2012.
c) Source of data: MIFID data (bonds), survey-based data (repo data), Bloomberg and
Datastream (equities), Bloomberg and World Gold Council (Gold).
14 14
Methodology (Gathering and cleaning of data)
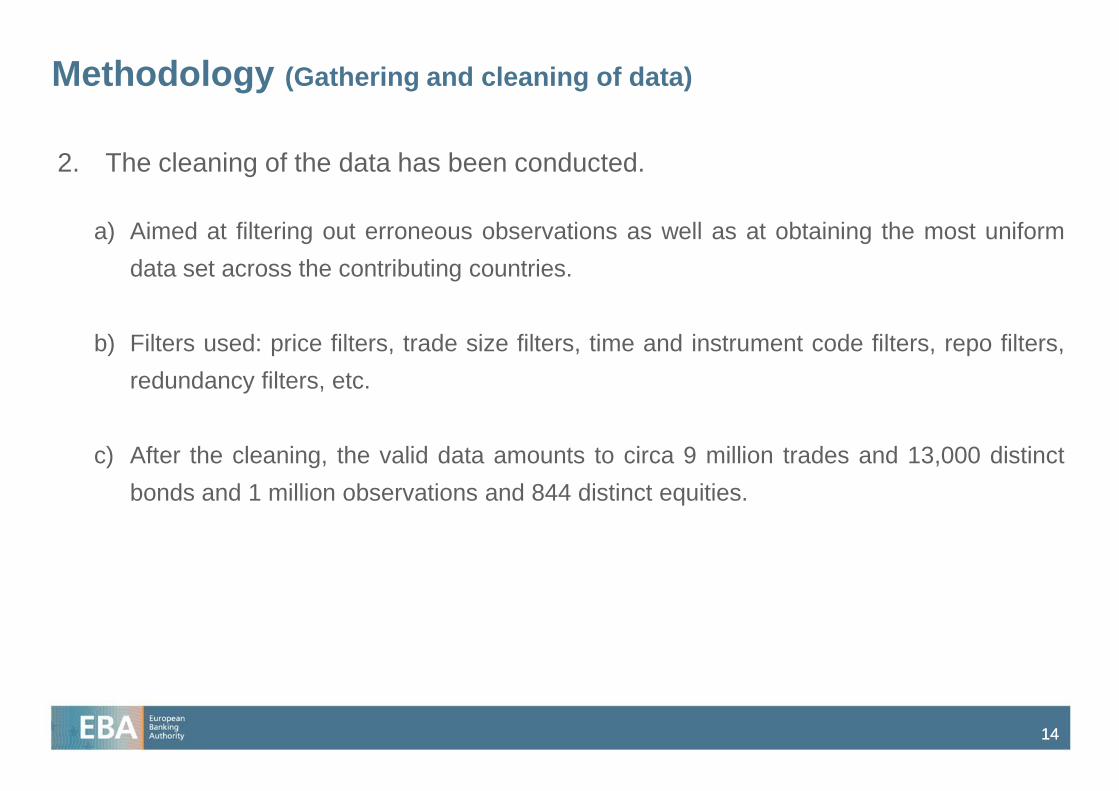
2. The cleaning of the data has been conducted.
a) Aimed at filtering out erroneous observations as well as at obtaining the most uniform
data set across the contributing countries.
b) Filters used: price filters, trade size filters, time and instrument code filters, repo filters,
redundancy filters, etc.
c) After the cleaning, the valid data amounts to circa 9 million trades and 13,000 distinct
bonds and 1 million observations and 844 distinct equities.
15 15
Methodology (underlying principles)
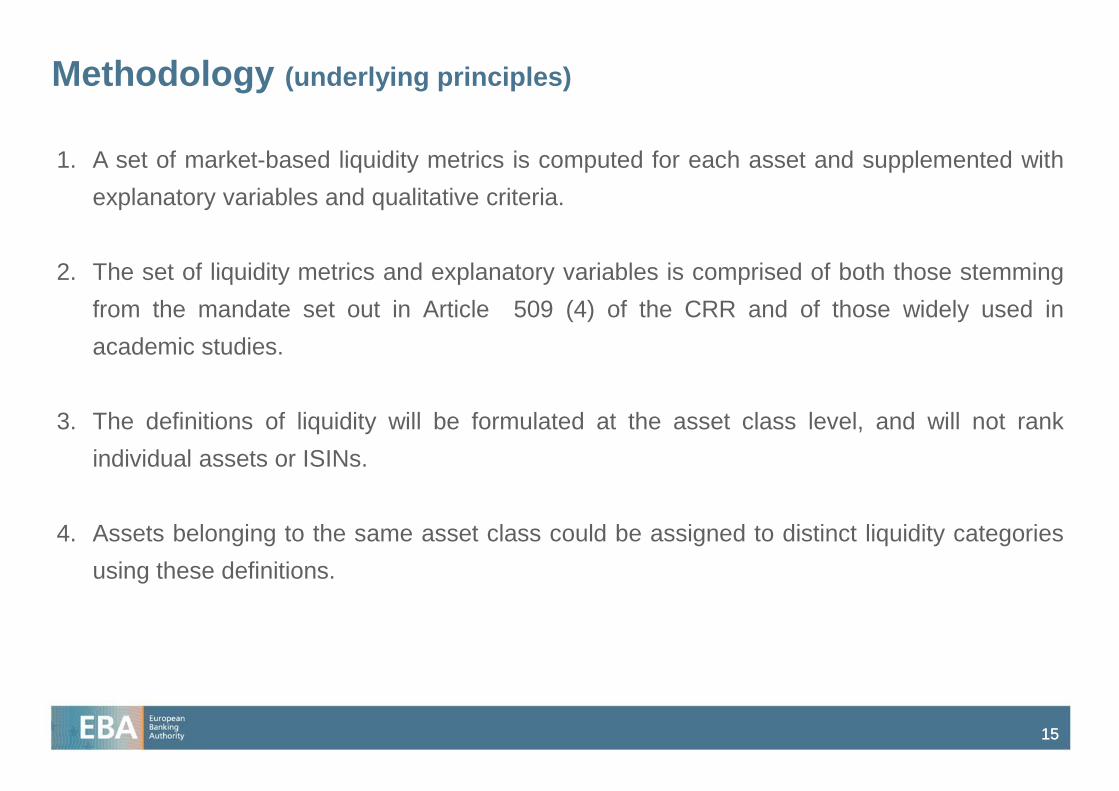
1. A set of market-based liquidity metrics is computed for each asset and supplemented with
explanatory variables and qualitative criteria.
2. The set of liquidity metrics and explanatory variables is comprised of both those stemming
from the mandate set out in Article 509 (4) of the CRR and of those widely used in
academic studies.
3. The definitions of liquidity will be formulated at the asset class level, and will not rank
individual assets or ISINs.
4. Assets belonging to the same asset class could be assigned to distinct liquidity categories
using these definitions.

16 16
Methodology (underlying principles)
5. The definition of liquidity will need to recognise that some asset classes or subgroups are
more liquid than others. The EBA will provide a tool to distinguish highly - and extremely
highly - liquid assets in EU regulation.
6. A quantitative analysis will not be performed for some asset classes due to insufficient
empirical data. A principle-based approach is being adopted for these asset classes.
7. Appropriate haircuts will be proposed for assets found to be of high liquidity and credit
quality based on evidence of historical price movements. These will take the haircuts in the
Basel text as a minimum.
17 17
Methodology (underlying principles)
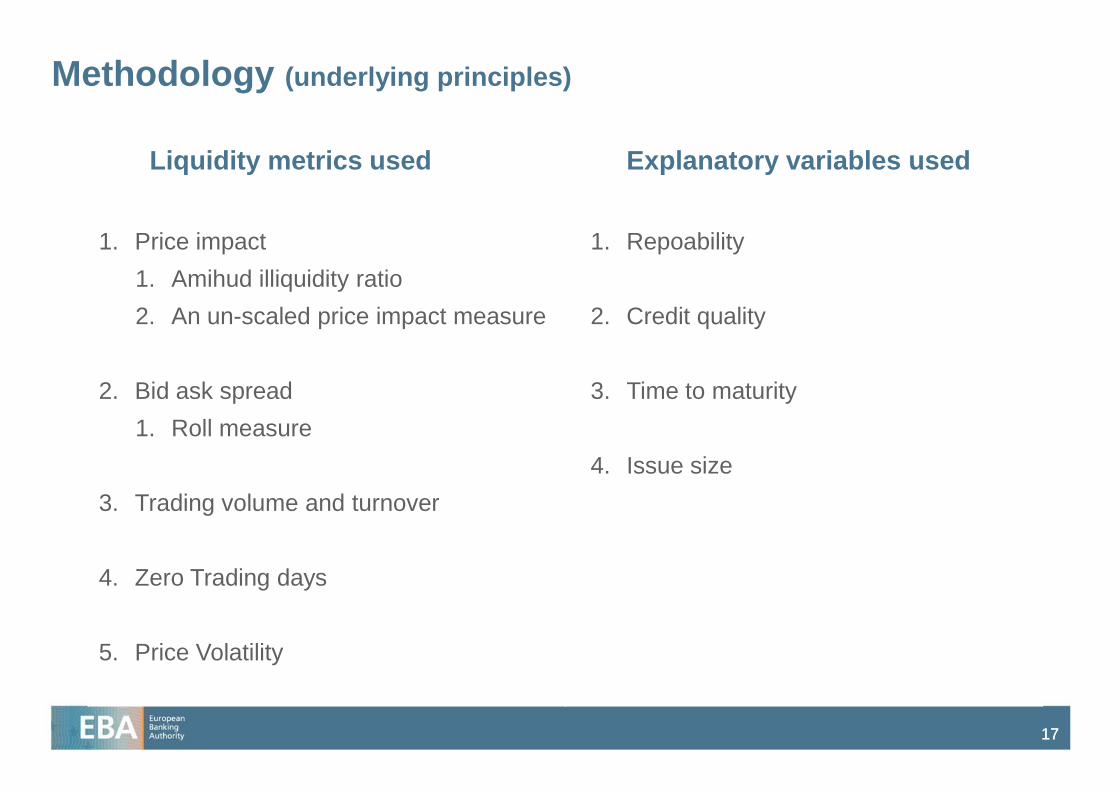
Liquidity metrics used
1. Price impact
1. Amihud illiquidity ratio
2. An un-scaled price impact measure
2. Bid ask spread
1. Roll measure
3. Trading volume and turnover
4. Zero Trading days
5. Price Volatility
Explanatory variables used
1. Repoability
2. Credit quality
3. Time to maturity
4. Issue size
18 18
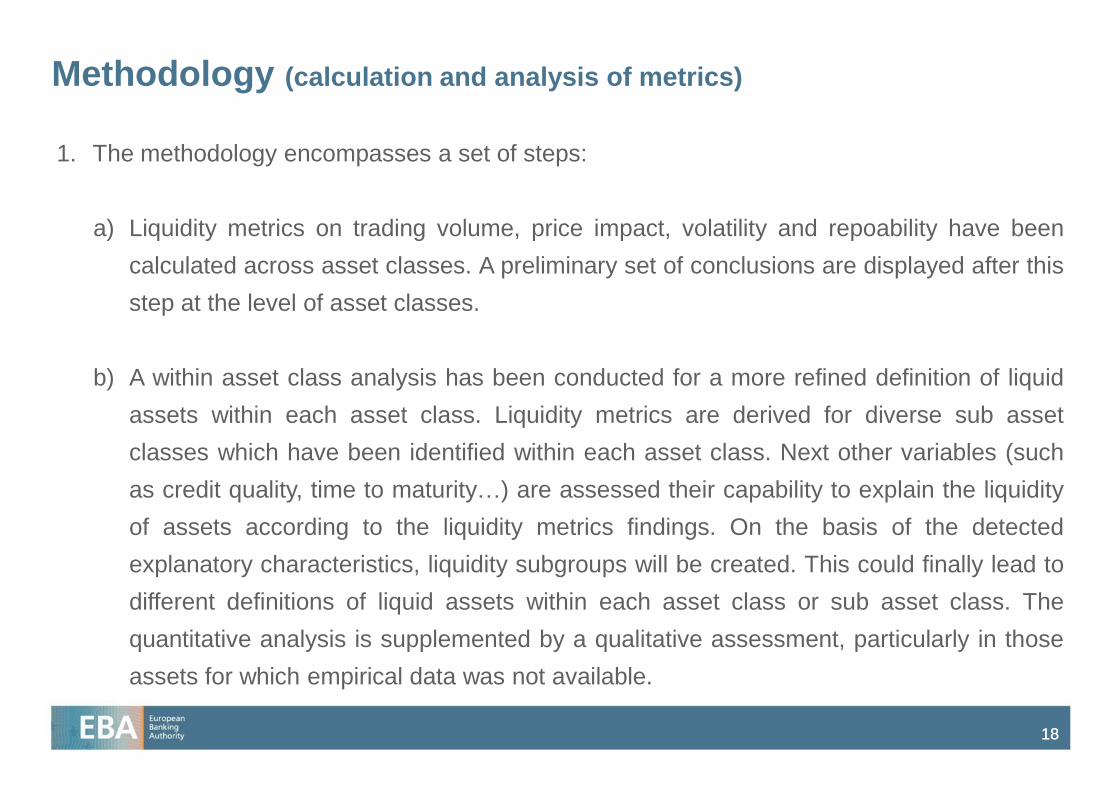
Methodology (calculation and analysis of metrics)
1. The methodology encompasses a set of steps:
a) Liquidity metrics on trading volume, price impact, volatility and repoability have been
calculated across asset classes. A preliminary set of conclusions are displayed after this
step at the level of asset classes.
b) A within asset class analysis has been conducted for a more refined definition of liquid
assets within each asset class. Liquidity metrics are derived for diverse sub asset
classes which have been identified within each asset class. Next other variables (such
as credit quality, time to maturity…) are assessed their capability to explain the liquidity
of assets according to the liquidity metrics findings. On the basis of the detected
explanatory characteristics, liquidity subgroups will be created. This could finally lead to
different definitions of liquid assets within each asset class or sub asset class. The
quantitative analysis is supplemented by a qualitative assessment, particularly in those
assets for which empirical data was not available.

19 19
Methodology (calculation and analysis of metrics)
c) The liquidity subgroups created will be evaluated in a cross asset class form by
comparing the relevant liquidity metrics. On this basis and together with relevant
qualitative judgments an ordinal ranking of the different asset groups is compiled.
Definitions of high and of extremely high liquidity and credit quality of transferable
assets are provided on the basis of the criteria to be met by individual assets, thus
constructing an ordinal ranking of asset classes for liquidity purposes.
d) Determination of haircuts on transferable assets of high liquidity and credit quality will be
set on the basis of the historical volatility of prices of the relevant asset groups.
20 20
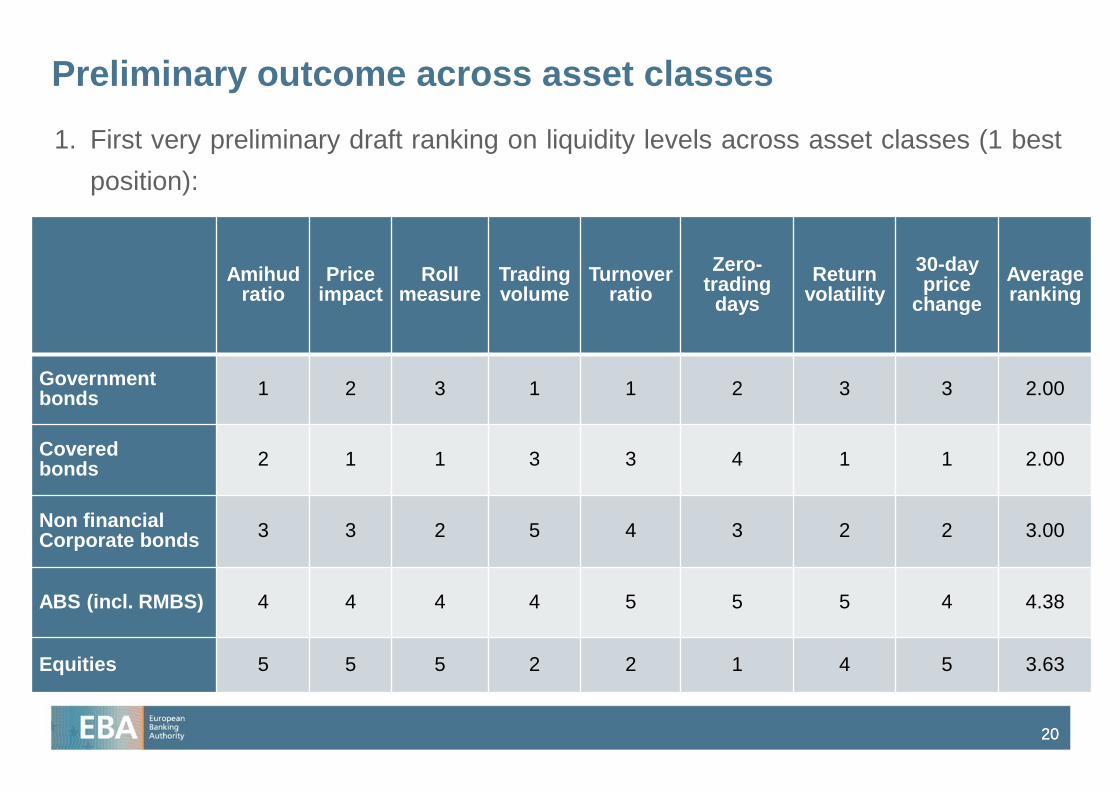
Preliminary outcome across asset classes
1. First very preliminary draft ranking on liquidity levels across asset classes (1 best
position):
Amihud ratio
Price impact
Roll measure
Trading volume
Turnover ratio
Zero-trading
days
Return volatility
30-day price
change
Average ranking
Government bonds
1 2 3 1 1 2 3 3 2.00
Covered bonds
2 1 1 3 3 4 1 1 2.00
Non financial Corporate bonds
3 3 2 5 4 3 2 2 3.00
ABS (incl. RMBS) 4 4 4 4 5 5 5 4 4.38
Equities 5 5 5 2 2 1 4 5 3.63
21 21
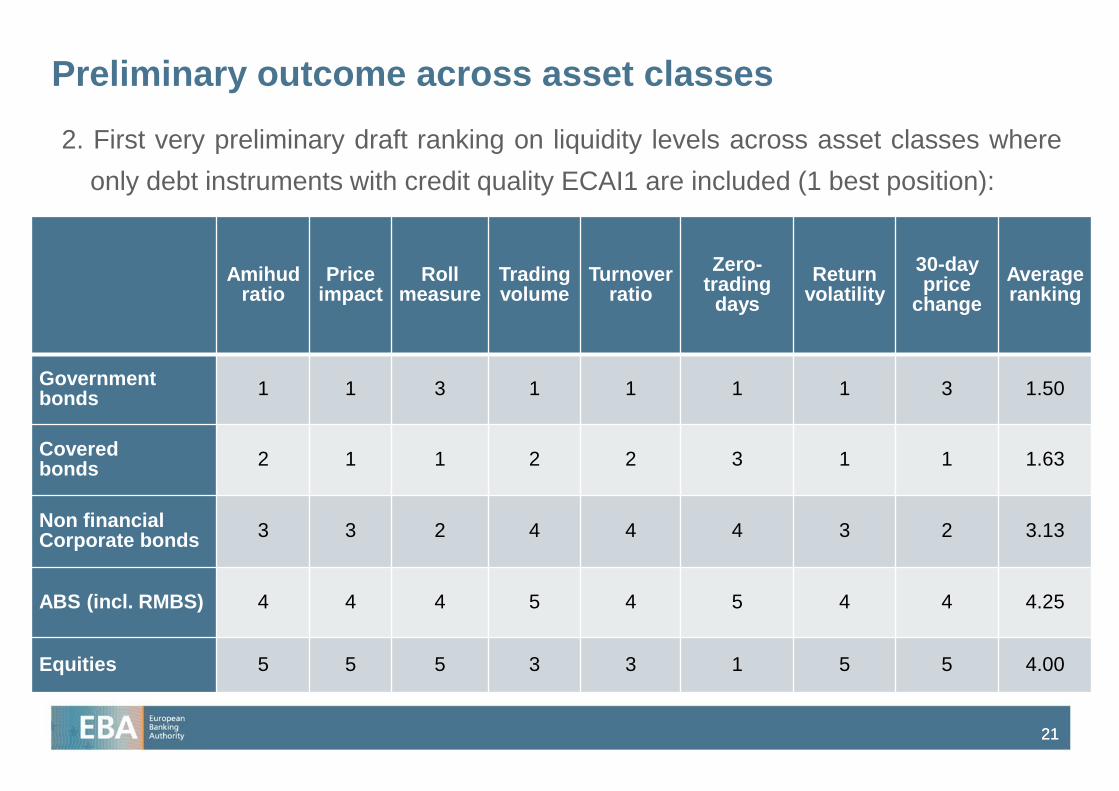
Preliminary outcome across asset classes
2. First very preliminary draft ranking on liquidity levels across asset classes where
only debt instruments with credit quality ECAI1 are included (1 best position):
Amihud ratio
Price impact
Roll measure
Trading volume
Turnover ratio
Zero-trading
days
Return volatility
30-day price
change
Average ranking
Government bonds
1 1 3 1 1 1 1 3 1.50
Covered bonds
2 1 1 2 2 3 1 1 1.63
Non financial Corporate bonds
3 3 2 4 4 4 3 2 3.13
ABS (incl. RMBS) 4 4 4 5 4 5 4 4 4.25
Equities 5 5 5 3 3 1 5 5 4.00
22 22
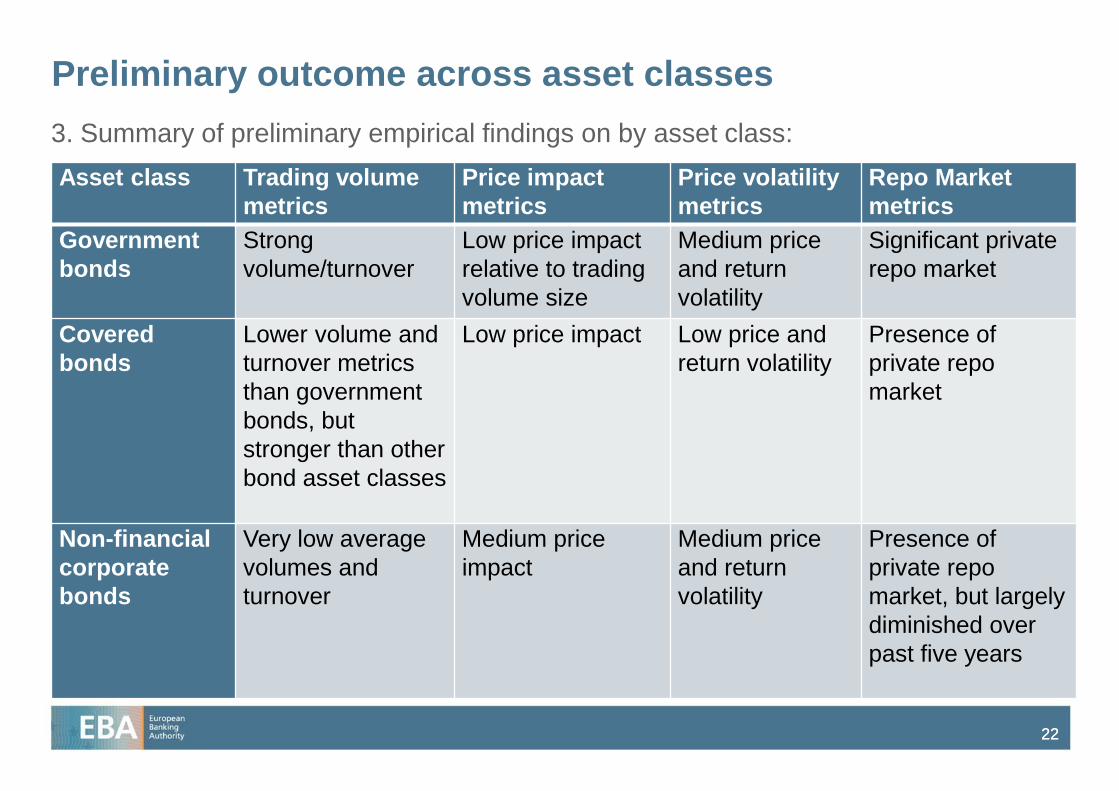
Preliminary outcome across asset classes
3. Summary of preliminary empirical findings on by asset class:
Asset class Trading volume
metrics
Price impact
metrics
Price volatility
metrics
Repo Market
metrics
Government
bonds
Strong
volume/turnover
Low price impact
relative to trading
volume size
Medium price
and return
volatility
Significant private
repo market
Covered
bonds
Lower volume and
turnover metrics
than government
bonds, but
stronger than other
bond asset classes
Low price impact Low price and
return volatility
Presence of
private repo
market
Non-financial
corporate
bonds
Very low average
volumes and
turnover
Medium price
impact
Medium price
and return
volatility
Presence of
private repo
market, but largely
diminished over
past five years
23 23
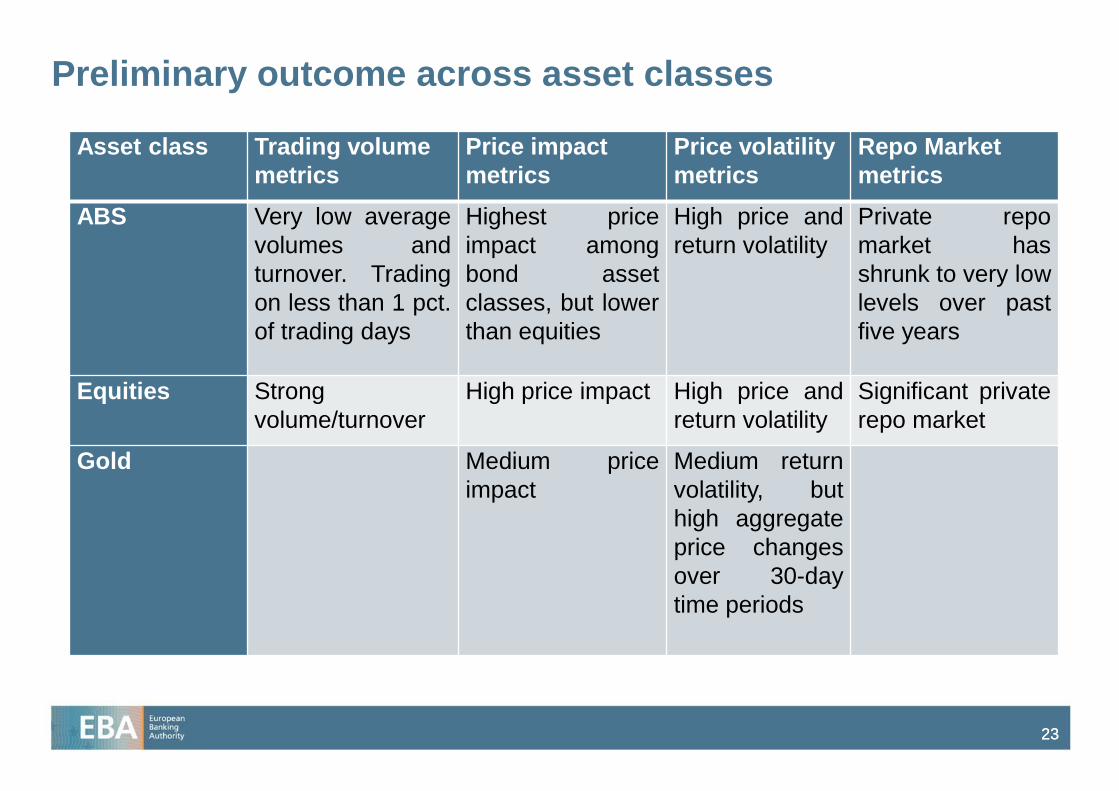
Preliminary outcome across asset classes
Asset class Trading volume
metrics
Price impact
metrics
Price volatility
metrics
Repo Market
metrics
ABS Very low average
volumes and
turnover. Trading
on less than 1 pct.
of trading days
Highest price
impact among
bond asset
classes, but lower
than equities
High price and
return volatility
Private repo
market has
shrunk to very low
levels over past
five years
Equities Strong
volume/turnover
High price impact High price and
return volatility
Significant private
repo market
Gold Medium price
impact
Medium return
volatility, but
high aggregate
price changes
over 30-day
time periods

24 24
Preliminary outcome within asset classes
1. Credit quality has a significant impact on liquidity for all asset classes (apart from equity of
course), but the sensitivity varies from one asset class to the other. For example, both
RMBS and covered bonds see a major difference between ECAI 1 and the other credit
steps, while liquidity is more robust at lower credit quality steps for corporate bonds.
2. The impact of issue size and time to maturity for each asset class has also been examined.
3. In general terms, sovereign bonds show a better performance in terms of liquidity than
other public sector debt.
4. In covered bonds, variables capturing the existence of regulatory characteristics which
reduce credit risk and enhance transparency are significant predictors of liquidity.
5. For ABS, RMBS are the most liquid sub class.

25 25
Preliminary outcome within asset classes
6. It has not been found any metrics that reliably segments the equity class into more and less
liquid categories. However, the reason for this could be that by requiring an examination of
assets within the main index, this filtering has already been performed.
7. The analysis has shown that the precise choice of liquidity metrics is not crucial. When
metrics on both trading volume and price volatility are incorporated, then the results remain
consistent whichever metrics within those groups is used.
26 26
Asset classes without empirical data
1. The lack of empirical data on trading in credit claims suggests this asset class should not
be defined as a liquidity asset.
2. Equities and corporate bonds issued by financials are not analysed, as they are not eligible
for the LCR liquidity buffer according to article 416.2(a) CRR, except if they meet
416.2(a)(iii) (e.g. if they are explicitly guaranteed by a central or regional government).
3. We can not examine the liquidity of CIU’s comprising eligible assets, until the definition of
liquid assets is finalised! However we will consider operational requirements for these
assets.
4. The report will recommend employing local definitions of liquidity for non EU assets when
they are determined for the implementation of the LCR in local jurisdictions.

27 27
Questions
1. Do you see major differences between the preliminary empirical findings and the
preliminary draft ranking on liquidity levels across asset classes?
2. What are your views on the definitional approach to rule out credit claims from the
quantitative analysis and from the definition of liquidity?
3. Do you have particular views on the preliminary findings within the asset class analysis?
4. Do you consider that any essential consideration is missing for the appropriate definition of
liquidity?
28 28
PART II: IMPACT
ASSESSMENT REPORT
28
29 29
Basis for the analysis
1. Voluntary exercise started in 2012 and now includes sample of around 350 banks
2. Sample represents more than 2/3 of total EU banking assets
3. Data cut off point Q4 2012, which enables us to include January 2013 GHOS
agreement
30 30
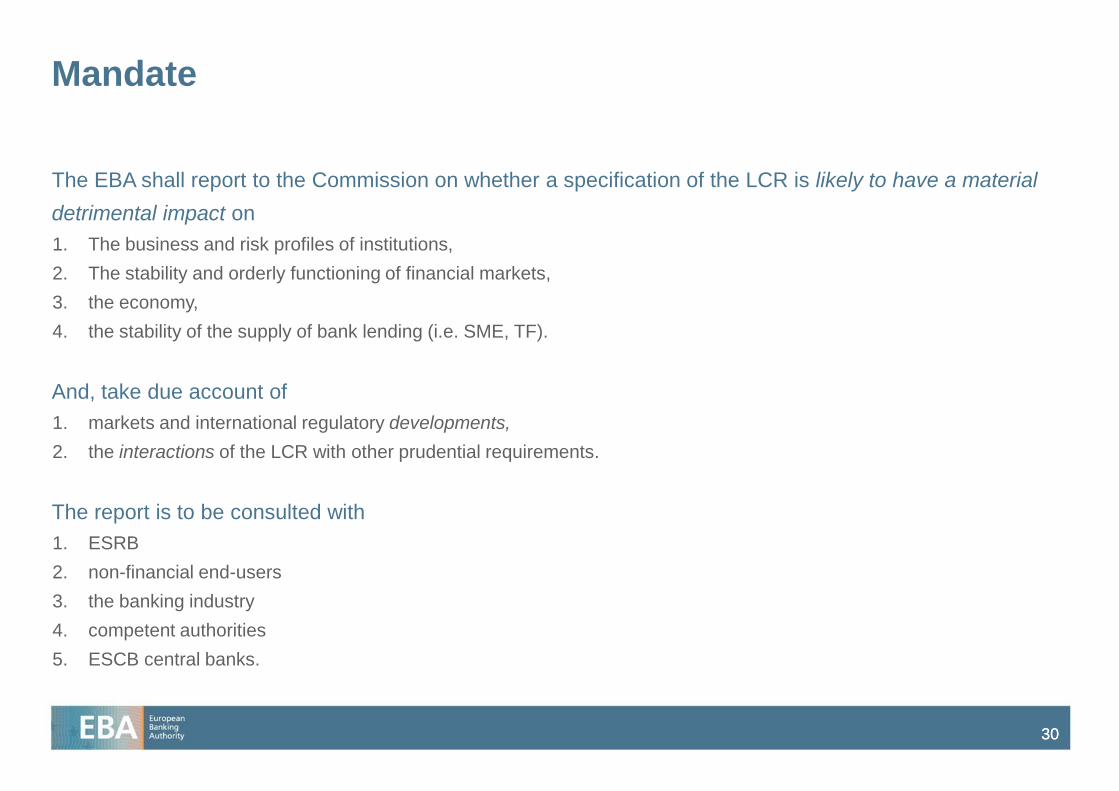
Mandate
The EBA shall report to the Commission on whether a specification of the LCR is likely to have a material
detrimental impact on
1. The business and risk profiles of institutions,
2. The stability and orderly functioning of financial markets,
3. the economy,
4. the stability of the supply of bank lending (i.e. SME, TF).
And, take due account of
1. markets and international regulatory developments,
2. the interactions of the LCR with other prudential requirements.
The report is to be consulted with
1. ESRB
2. non-financial end-users
3. the banking industry
4. competent authorities
5. ESCB central banks.
31 31
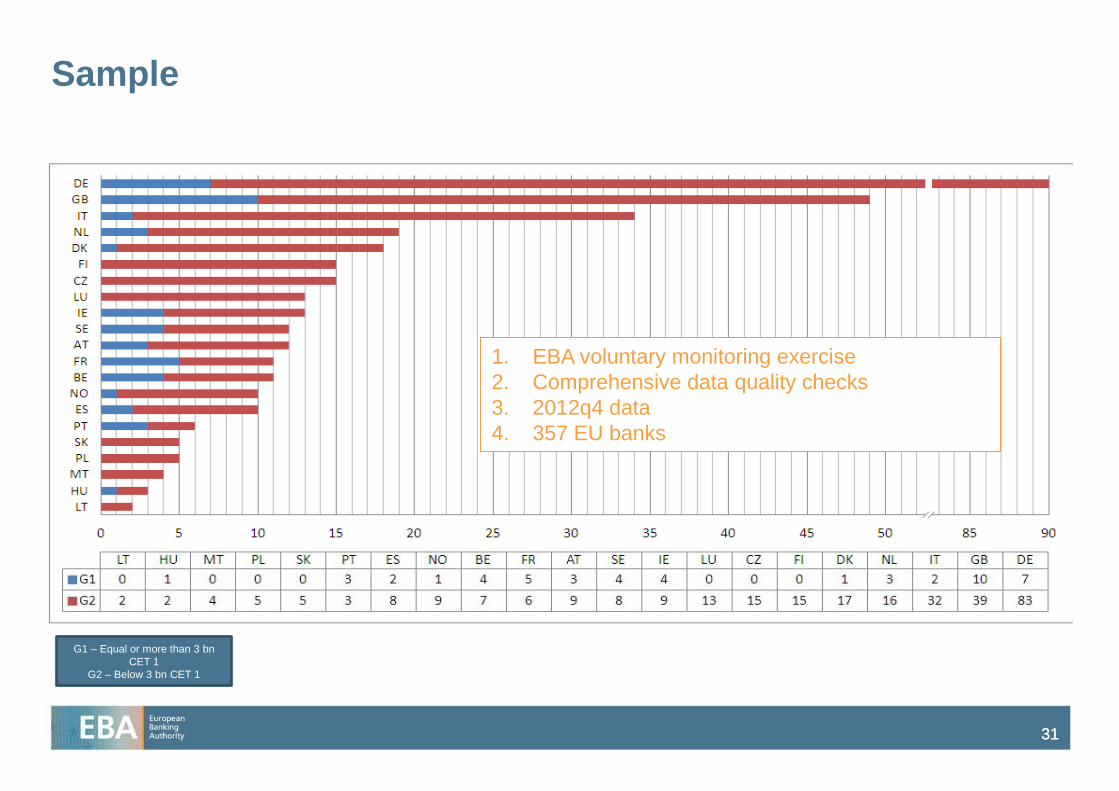
Sample
1. EBA voluntary monitoring exercise
2. Comprehensive data quality checks
3. 2012q4 data
4. 357 EU banks
G1 – Equal or more than 3 bn
CET 1
G2 – Below 3 bn CET 1
32 32
Data appendix
33 33
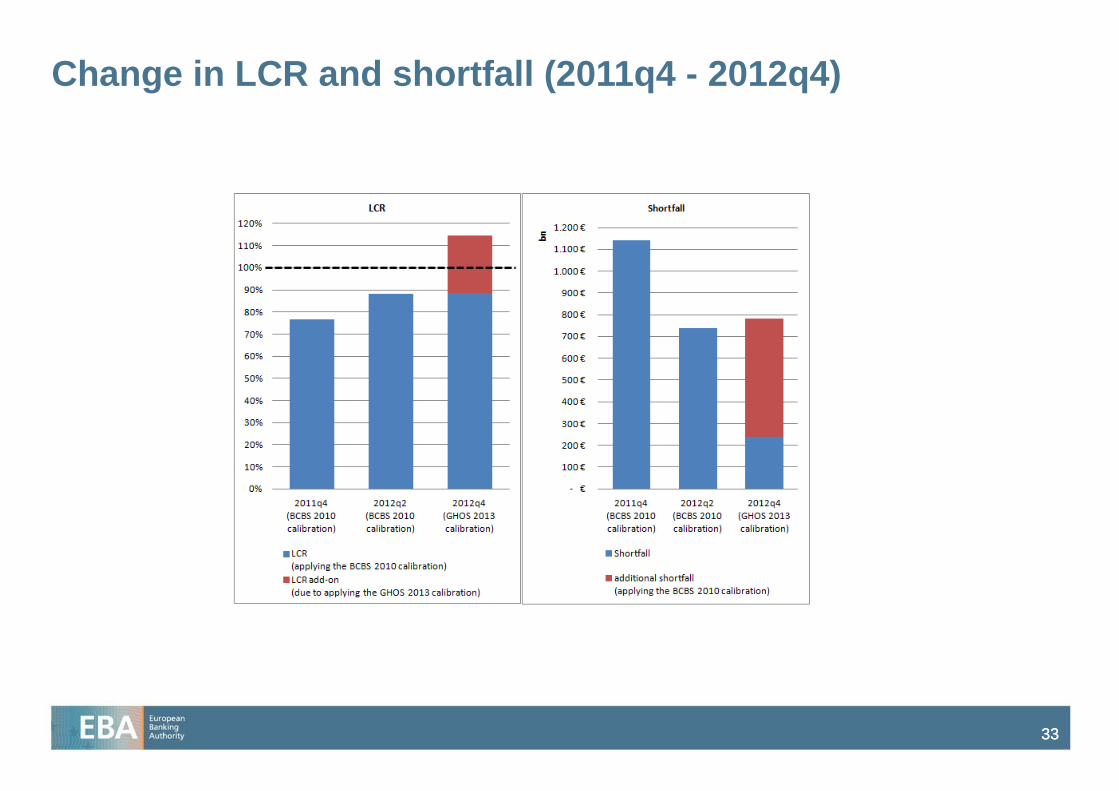
Change in LCR and shortfall (2011q4 - 2012q4)
34 34
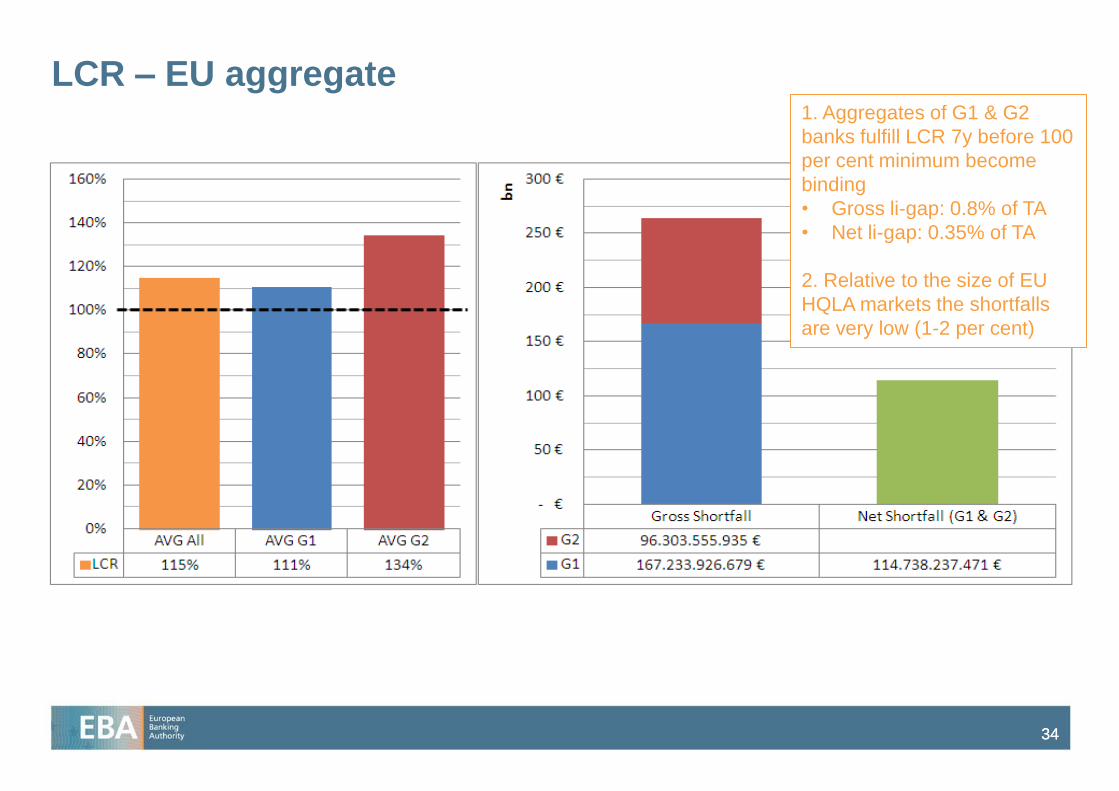
LCR – EU aggregate
1. Aggregates of G1 & G2
banks fulfill LCR 7y before 100
per cent minimum become
binding
• Gross li-gap: 0.8% of TA
• Net li-gap: 0.35% of TA
2. Relative to the size of EU
HQLA markets the shortfalls
are very low (1-2 per cent)
35 35
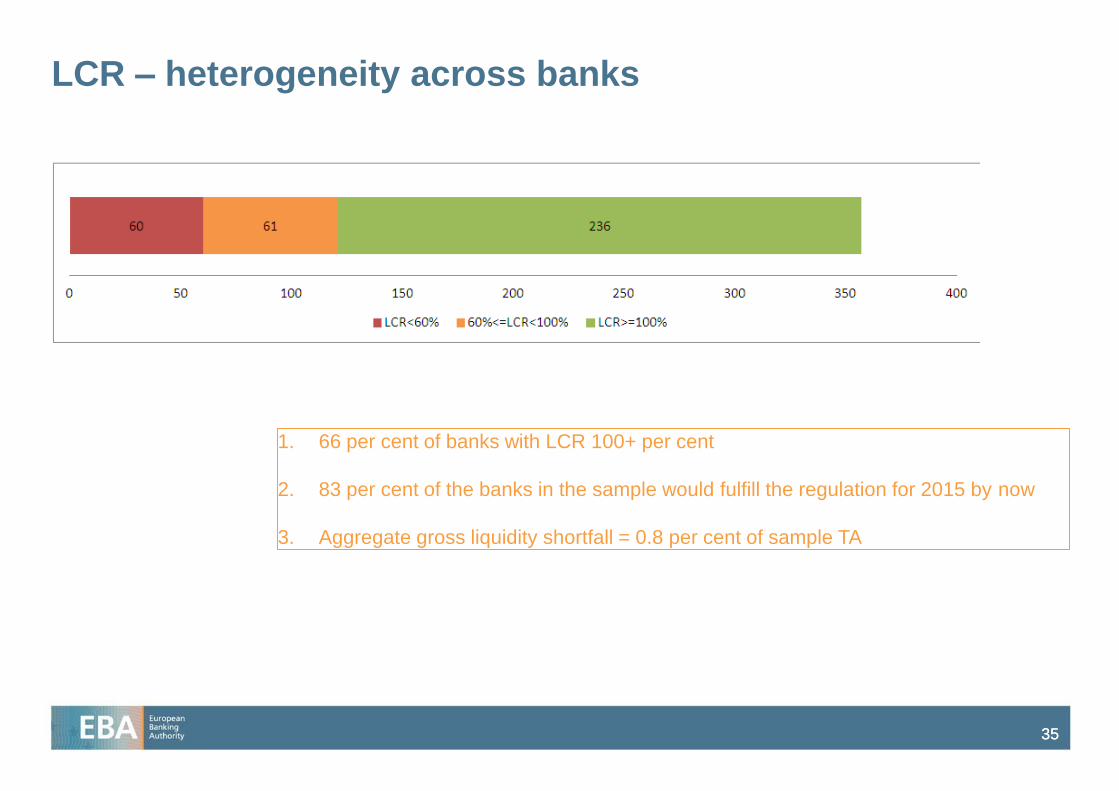
LCR – heterogeneity across banks
1. 66 per cent of banks with LCR 100+ per cent
2. 83 per cent of the banks in the sample would fulfill the regulation for 2015 by now
3. Aggregate gross liquidity shortfall = 0.8 per cent of sample TA

36 36
Business model categories
1. High concentration
of banks in few
business model
categories.
2. Representativeness
of some business
models poor:
• Leasing
&factoring: 1
• Shari´ah
compliant: 3
• Trade finance: 6
• Pass-through
financing: 7
Group 1 Well diversified large cross-border banks with substantial capital market activities
Group 2 Saving and loan associations
Group 3 Co-operative banks
Group 4 Pass-through financing banks
Group 5 Leasing and factoring banks
Group 6 Mortgage banks and building societies
Group 7 CCP, securities trading house, custodian institutions
Group 8 Auto banks, consumer credit banks
Group 9 Merchant banks (specialized in trade finance)
Group 10 Private banks
Group 11 Shari'ah compliant banks
Group 12 Other well diversified (predominantly nationally active) banks
Group 13 Other specialized credit institutions
37 37
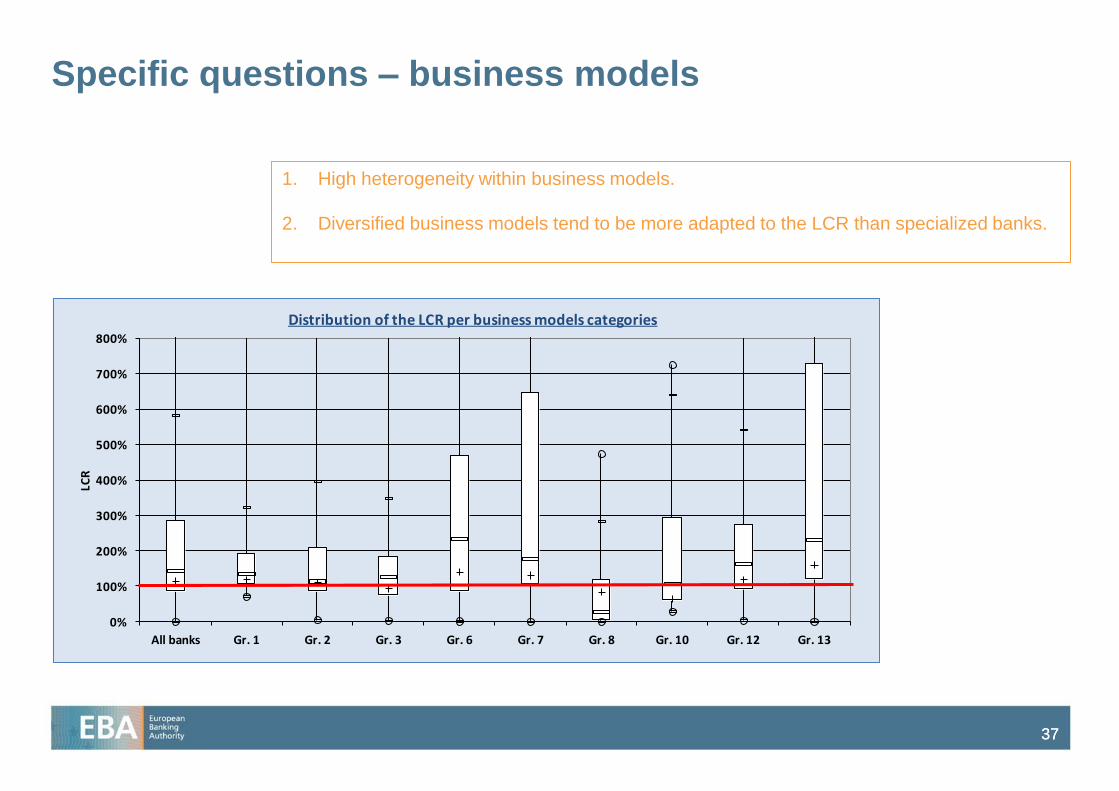
Specific questions – business models
0%
100%
200%
300%
400%
500%
600%
700%
800%
All banks Gr. 1 Gr. 2 Gr. 3 Gr. 6 Gr. 7 Gr. 8 Gr. 10 Gr. 12 Gr. 13
LCR
Distribution of the LCR per business models categories
1. High heterogeneity within business models.
2. Diversified business models tend to be more adapted to the LCR than specialized banks.
38 38
Specific aspects of calibration
1. Interaction with CET1, LR, and NSFR
> No indication that CET1 or LR constitute constraints on banks’ adjustment to the LCR
> Possible positive complementarities between the prudential requirements in the CRR
2. SME lending/Trade Finance
1. Methods: UK natural experiment, case studies (CH, SWE, NL, UK, DK, FR), multivariate analysis
> No correlation between SME/TF exposure and LCR level
> No indication of reduction of SME/TF due to increases in LCR
> UK natural experiment
> Case studies corroborate findings
39 39
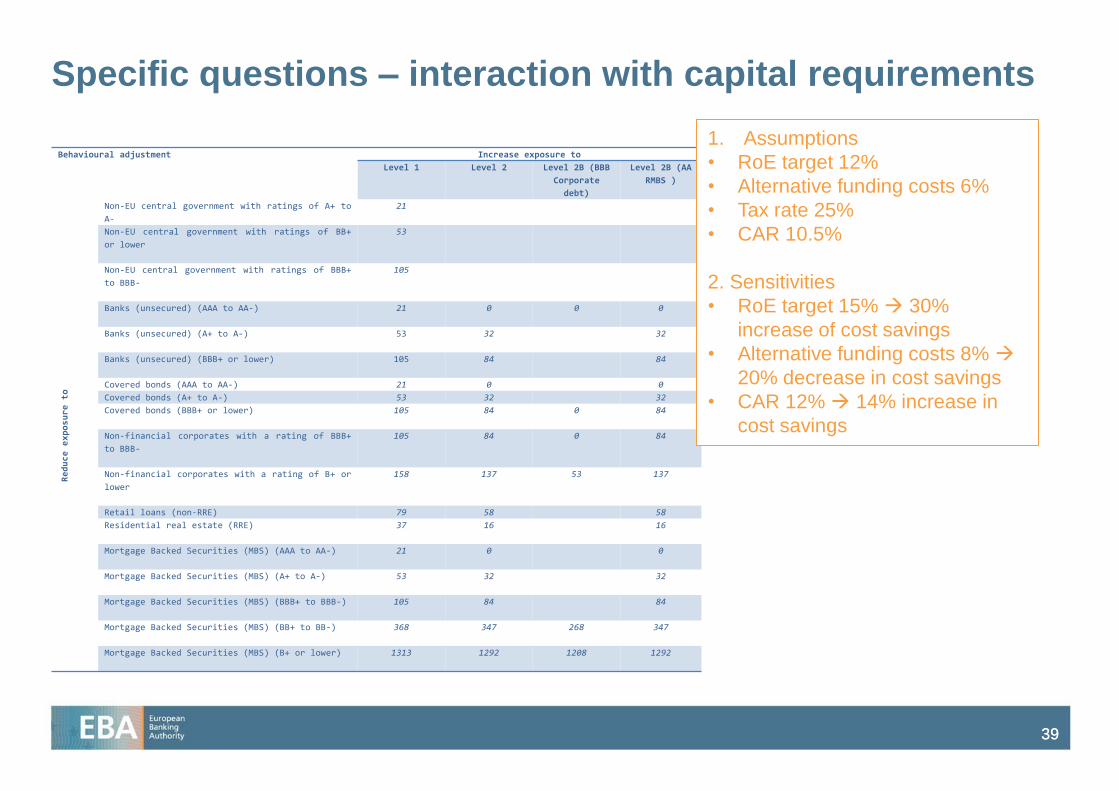
Specific questions – interaction with capital requirements
Behavioural adjustment Increase exposure to
Level 1 Level 2 Level 2B (BBB
Corporate
debt)
Level 2B (AA
RMBS )
Reduce exposure to
Non-EU central government with ratings of A+ to
A-
21
Non-EU central government with ratings of BB+
or lower
53
Non-EU central government with ratings of BBB+
to BBB-
105
Banks (unsecured) (AAA to AA-) 21 0 0 0
Banks (unsecured) (A+ to A-) 53 32 32
Banks (unsecured) (BBB+ or lower) 105 84 84
Covered bonds (AAA to AA-) 21 0 0
Covered bonds (A+ to A-) 53 32 32
Covered bonds (BBB+ or lower) 105 84 0 84
Non-financial corporates with a rating of BBB+
to BBB-
105 84 0 84
Non-financial corporates with a rating of B+ or
lower
158 137 53 137
Retail loans (non-RRE) 79 58 58
Residential real estate (RRE) 37 16 16
Mortgage Backed Securities (MBS) (AAA to AA-) 21 0 0
Mortgage Backed Securities (MBS) (A+ to A-) 53 32 32
Mortgage Backed Securities (MBS) (BBB+ to BBB-) 105 84 84
Mortgage Backed Securities (MBS) (BB+ to BB-) 368 347 268 347
Mortgage Backed Securities (MBS) (B+ or lower) 1313 1292 1208 1292
1. Assumptions
• RoE target 12%
• Alternative funding costs 6%
• Tax rate 25%
• CAR 10.5%
2. Sensitivities
• RoE target 15% 30%
increase of cost savings
• Alternative funding costs 8%
20% decrease in cost savings
• CAR 12% 14% increase in
cost savings
40 40
Intended economic consequences of the LCR
1. High credit growth at low interest rates is not an economic policy objective (ECB 2013d).
> Investment projects that only have positive net present value (NPV), if interest rates do not cover the
costs of liquidity and credit risk, are economically inefficient and should not be undertaken.
2. Anecdotal evidence suggests that credit spreads underestimate the costs of risk and are too low
during boom phases.
> This leads to an economically inefficient allocation of capital and risk
3. The implementation of the LCR merely makes the costs of liquidity risk explicit and helps
allocate these costs in an economically efficient way.
> No new costs are imposed on society; they are only redistributed from the public to the banking sector.
In the past these costs are shifted to tax payers via central bank emergency liquidity, government
guarantees for bank liabilities, and to bank customers through a reduction of credit supply and an
increase in loan spreads to recoup former underpricing of risk.
41 41 41
Preliminary assessment & policy recommendations
1. No material detrimental impact established so far on
(i) the stability and orderly functioning of financial markets
(ii) the economy and
(iii) the stability of the supply of bank lending (i.e. SME & TF).
But Heterogeneity across & within countries, banks, and business models.
2. No indication that CET1/LR constitute constraints on banks’ adjustment to the LCR
Possible positive complementarities between LCR & other prudential requirements in the CRR
3. No evidence so far for a detrimental impact of an inflow cap of 75% on aggregate, but on
different business models.
4. No evidence supporting a reduction of run-off rates of outflows on other liabilities according to
Art. 422(7) CRR compared to the GHOS 2013 calibration.
5. The reduction of roll-over rates for loans according to Art. 425(2) CRR from 50 to 0 per cent is
not realistic, as it assumes that non-financial loans would be cut by 100 per cent in times of
stress.
42 42 42
Preliminary assessment & policy recommendations
6. Rationale of setting a cap on level 2A/B assets as envisaged by the Basel rules text seems
justified.
7. Preferential treatment of intra-group exposures
Potential impact of an asymmetric vs. symmetric treatment not yet fully assessed
8. GHOS recalibration of draw-down rates of commitments to NFCs seems justified.
100 per cent rate would lead to 3.8-fold increase of the liquidity shortfall to EUR 1 trillion
9. Possible threshold for high-value retail deposits at EUR 1 million
This could be a possibility, or, alternatively, a separate class for high value deposits under retail with a
higher outflows rate could be established under Art. 421(3) CRR.
43 43 43
Preliminary assessment & policy recommendations
10. Specific outflow category for deposits insured by an effective DGS according to the BCBS
approach seems justified.
Strong support for COM proposal for harmonized criteria for DGS, already proposed in 2010. Once this package is
adopted, the preconditions for new retail deposit category with lower outflow rates may be fulfilled.
11. Shari‘ah compliant banks
Proposal to exempt Shari’ah compliant banks from certain operational requirements for Shari’ah compliant assets
44 44 44
Preliminary assessment & policy recommendations
11. Established operational relationships
(i) At least 24 months/data based evidence of client behaviour/excess funds (> 1 M average turn-over)
excluded/operational balance can be expected to be relatively stable over time/insensitive to changes of
the rate of interest /filter criteria
13. The outflow rates on corresponding banking and prime brokerage in the GHOS agreement seem
justified
14. SAREB/NAMA bonds grand-fathered as L1 assets
45 45 45
Preliminary assessment & policy recommendations
15. Monetary policy implementation
1. The opinion of the international community are taken into account
2. Banks should not be enabled or even incentivised to arbitrage liquidity regulation via central bank
operations
3. Treatment of CB repo exposure to be further assessed. Work continues in close cooperation with EU
central banks.
46 46 46
Preliminary assessment & policy recommendations
Monetary policy implementation (cont‘d)
(ii) Committed Liquidity Facilities (CLFs)
> A very broad range of eligible liquid assets in the LCR corresponds to the assumption of a committed
liquidity line of the central bank. Without limiting these quasi-committed lines appropriately, either in
terms of price or of the share of HQLA they can account for, regulation would be ineffective.
> Implementation involves a large number of complex choices
> Results of BCBS deliberations will be incorporated in this report
47 47
Preliminary assessment & policy recommendations
Monetary policy implementation (cont‘d)
(iii) EU money markets
> The European and, especially, the Euro unsecured money markets feature much lower volumes and
significantly shorter maturities than before the crisis.
> It is unlikely that the LCR contributes much to the explanation of the current situation on European
unsecured money markets.
> In the future, MM functioning might be largely determined by the behaviour of non-bank market
participants (e.g. insurance companies, money market funds), which in turn will be a function of the
confidence in the European banking sector.
(iv) Price stability
> BIII MG survey & case studies do not point to a negative impact
> We together with central banks will analyse granular bank/monetary policy data in order to generate
firmer and more useful results to guide policy-making

48 48
Next steps

49 49
Next steps
1. The final draft reports will be presented to the EBA Governance Structures in November
and to the Board of Supervisors in December.
2. The final reports will be submitted to the European Commission by end this year.
3. The final reports will be published on the EBA website.

50 50
THANK YOU
Recommended


![UNIFORM TRUST CODE · 1 UNIFORM TRUST CODE 2 ARTICLE 1 3 GENERAL PROVISIONS AND DEFINITIONS 4 SECTION 101. SHORT TITLE. This [Code] may be cited as the Uniform 5 Trust Code. 6 SECTION](https://img.pdfslide.net/doc/110x75/5be46be809d3f2ad378d5724/uniform-trust-1-uniform-trust-code-2-article-1-3-general-provisions-and-definitions.jpg)