www.elsevier.com/locate/powtec
Powder Technology 139 (2004) 21–32
Drag coefficients of irregularly shaped particles
Sabine Tran-Cong, Michael Gay, Efstathios E. Michaelides*
School of Engineering and Center for Bioenvironmental Research, Tulane University, New Orleans, LA 70118, USA
Received 22 April 2003; received in revised form 16 September 2003; accepted 10 October 2003
Abstract
The steady-state free-fall conditions of isolated groups of ordered packed spheres moving through Newtonian fluids have been studied
experimentally. Measurements of the drag coefficients are reported in this paper for six different geometrical shapes, including isometric,
axisymmetric, orthotropic, plane and elongated conglomerates of spheres. From these measurements, a new and accurate empirical
correlation for the drag coefficient, CD, of variously shaped particles has been developed. This correlation has been formulated in terms of the
Reynolds number based on the particle nominal diameter, Re, the ratio of the surface-equivalent-sphere to the nominal diameters, dA/dn, and
the particle circularity, c. The predictions have been tested against both the experimental data for CD collected in this study and the ones
reported in previous works for cubes, rectangular parallelepipeds, tetrahedrons, cylinders and other shapes. A good agreement has been
observed for the variously shaped agglomerates of spheres as well as for the regularly shape particles, over the ranges 0.15 <Re < 1500,
0.80 < dA/dn < 1.50 and 0.4 < c < 1.0.
D 2003 Elsevier B.V. All rights reserved.
Keywords: Drag; Particles; Irregular; Correlations
1. Introduction
The settling behavior for variously shaped particles is of
fundamental importance since natural and artificial solid
particles occur in almost any shape ranging from roughly
spherical pollen and fly ash through cylindrical asbestos
fibers to irregular mineral particles. Irregularly shaped
particles are met in many applications, such as sedimenta-
tion and flocculation of aggregates of fine particles in rivers
and lakes, chemical blending, mineral processing, powder
sintering, manufacturing with phase change and solidifica-
tion processes. In most of these applications, the determi-
nation of the falling velocity of the particle is of interest for
the design and optimization of processes and equipment.
Since the falling velocity of a particle depends greatly on its
drag coefficient, reliable correlations for the drag coefficient
of these irregular particles are required for the understanding
of the processes and the design of equipment.
Early investigations focused on the drag force experi-
enced by spheres moving through a fluid. Extensive sets of
0032-5910/$ - see front matter D 2003 Elsevier B.V. All rights reserved.
doi:10.1016/j.powtec.2003.10.002
* Corresponding author. Tel.: +1-504-865-5764; fax: +1-504-862-
8747.
E-mail address: [email protected] (E.E. Michaelides).
data were collected and combined with theoretical work.
The sets of data resulted in several empirical correlations for
the drag coefficient, CD, in terms of the Reynolds number,
Re. These correlations for spherical bodies were reviewed
subsequently by many authors in treatises and review
articles by Clift et al. [4] and Khan and Richardson [11].
A comparison between most of these correlations for
spheres by Hartman and Yates [6] showed relatively low
deviations.
The studies on the drag of irregular particles mainly
addressed a limited number of solid shapes and, in most
cases, formulated the particle free-falling velocity and drag
with respect to a well defined particle shape. A number of
empirical correlations were proposed for regular polyhe-
drons by Pettyjohn and Christiansen [20] and Haider and
Levenspiel [5]; for cylinders by Marchildon et al. [16],
McKay et al. [18] and Unnikrishan and Chhabra, [28]; for
thin disks by Squires and Squires [25] and Willmarth et al.
[30]; for parallelepipeds by Heiss and Coull [8]; for cones
by Jayaweera and Mason [10]; and for flat annular rings by
Roger and Hussey [22]. In comparison to these correlations
for specific particle shapes, very few studies appeared for
irregularly shaped particles. Notable among them are the
ones by Hottovy and Sylvester [9], Baba and Komar [1],
Lasso and Weidman [15] and Hartman et al. [7].

S. Tran-Cong et al. / Powder Technology 139 (2004) 21–3222
It is generally recognized and experiments have shown
that the departure of a particle from the spherical shape
causes a decrease of its terminal velocity in a fluid. This
implies a higher CD for the non-spherical particle as
observed by Pettyjohn and Christiansen [20] and Komar
[13]. Although there are many sets of data and empirical
methods for the determination of the drag coefficient for
irregularly shaped particles, there is not an unambiguous
method that yields this drag coefficient for a more than one
particular shape. Most of the previous studies on the subject
have been limited in collecting a large number of data on
variously shaped particles as a necessary step in an effort to
better understand and formulate the particle shape effects on
the settling behavior.
The primary objective of this study is to provide a
reliable correlation for the drag coefficient that covers as
many shapes as possible of the infinite set of the shapes of
the irregularly shaped particles. The irregular particles are
made of ordered arrangements of several smaller spheres
joined together. Thus, isometric, axisymmetric, orthotropic,
plane and longitudinal agglomerates of spheres were exam-
ined. The terminal velocities of these irregular particles were
measured by an optical method in glycerin–water solutions
of different concentration and viscosity, and, hence, their
steady-state drag coefficients were determined. From the
results obtained, we modified the well-known steady-state
correlation for the drag coefficient of spheres in an infinite
fluid [23] and we derived a simple and accurate correlation
of the drag coefficients of irregular spheres in terms of the
Reynolds number based on the nominal diameter, Re, the
ratio of the surface-equivalent-sphere to nominal diameters,
dA/dn, and the particle circularity, c. The predictions were
then compared with experimental data for the CD within
the ranges 0.05 < Re < 1500, 0.80 < dA/dn < 1.50 and
0.4 < c < 1.0. This data included our measurements for
variously shaped conglomerates of spheres and data
obtained by Pettyjohn and Christiansen [20], Heiss and
Coull [8], and Lasso and Weidman [15].
2. Previous studies
2.1. Drag coefficient for spheres
The drag force, FD, experienced by a particle settling
with a uniform velocity, ws, in a quiescent fluid is defined in
terms of a drag coefficient, CD, by the following expression:
FD ¼ CDAp
qfw2s
2; ð1Þ
where Ap is the projected surface area of the particle normal
to the direction of its motion and qf is the density of the
fluid. In the case of a freely falling sphere, the balance
between the drag force and the force due to the gravity leads
to the following expression, which was used in the exper-
imental determination of the drag coefficient:
CD ¼ 4
3dðqs � qf Þ
qf
g
w2s
: ð2Þ
In Eq. (2), d and qs are the diameter and the density of
the solid sphere respectively, and g is the gravitational
acceleration. For spheres falling in infinite fluids, the drag
coefficient has been correlated in terms of the dimensionless
parameter Re = qsdws/lf, where lf is the dynamic viscosity
of the fluid. Several correlations for CD were proposed over
a wide range of Re. One of the most widely used was the
empirical equation of Schiller and Naumann [23], which is
simple and accurate in the range 0.1 <Re < 800 [4,11].
Based on this expression, Clift et al. [4] developed an
improved and more accurate expression which is valid for
higher Re, up to 3� 105 and reads as follows:
CD ¼ 24
Reð1þ 0:15 Re0:687Þ þ 0:42
1þ 4:25� 104 Re�1:16: ð3Þ
In this study, we will use this expression for the drag
coefficient for spheres.
2.2. Shape factors and pertinent geometric parameters
For non-spherical particles in an infinite medium, it was
generally recognized that CD must be expressed in terms of
Re as well as one or more shape factors. Several methods
were suggested for obtaining these shape factors and for
classifying the non-spherical particles by size or shape
[4,27]. One of the most important measures was defined
by Wadell [29] as the volume-equivalent-sphere diameter or
nominal diameter, dn, which is defined as follows:
dn ¼ffiffiffiffiffiffiffiffiffiffiffi6V=p3
p; ð4Þ
where V is the particle volume. This size parameter has been
used extensively in particulate as well as bubbly flows to
define the Reynolds number of the particle [4].
A similar parameter may be defined in terms of the
projected area of the sphere, Ap. The surface equivalent
sphere diameter, dA, thus defined is equal to:
dA ¼ffiffiffiffiffiffiffiffiffiffiffiffiffi4Ap=p
q: ð5Þ
The ratio dn/dA was used as a pertinent and useful
dimensionless number in many studies on the drag coef-
ficients [8,21,24,28].
In similar manner and in order to account for the particle
elongation, axisymmetrical shapes were conveniently de-
scribed by their aspect ratio, E, which is defined as the
particle length along the symmetrical axis over the largest
diameter of the cross section. Relevant information on the
preferential settling orientation of cylinders with respect to
this shape factor was reported by Marchildon et al. [16] and
S. Tran-Cong et al. / Powder Technology 139 (2004) 21–32 23
Jayaweera and Mason [10]. It must be pointed out that the
aspect ratio is related to the two diameters defined above
and, that is often possible to express it analytically in terms
of these diameters. For example, the aspect ratio of a
cylinder falling with its flat surface at right angles to the
direction of motion, E = 4(dn/dA)3/p.
Another dimensionless number that is useful in studies of
spheroids and ellipsoids is the particle sphericity, w. Thisshape factor was first defined by Wadell [29] as the ratio of
the surface area of the equivalent-volume-sphere to the
actual surface area of the particle, A. Thus, w was given by:
w ¼ pd2n=A: ð6Þ
The sphericity is generally recognized to be an appro-
priate single dimensionless number measure for character-
izing the shape of isometric non-spherical particles [5,6,20].
From a practical standpoint, however, w is difficult to
determine for strongly irregular particles because it requires
a measure of the surface area, which it is not easy to
accomplish in all cases. For this reason, other shape factors
have been used, which are easier to determine for irregular
particles. Among these is the particle circularity (also called
surface sphericity), c, which is defined as follows:
c ¼ pdA=Pp; ð7Þ
where Pp is the projected perimeter of the particle in its
direction of motion. This is an easier parameter to mea-
sure. One of the difficulties of using the circularity, c, is
that occasionally it yields the same value for three-dimen-
sional and two-dimensional objects. For example, spheres
and disks that fall on their flat sides have the same
circularity.
Another approach for characterizing the shape of three-
dimensional irregular particles, while bypassing the diffi-
culty in determining their surface area, is to define dimen-
sionless numbers based on the largest, intermediate and
shortest particle axes. This approach was adopted by
McNown and Malaika [19], Komar and Reimers [14], Baba
and Komar [1] and others, who characterized irregular
particle shapes by using the so-called ‘‘Corey shape factor,’’
Co. This is defined as the ratio of the shortest particle axis to
the square root of the product of the other two axes.
One important feature of E and Co is that, for an ellipsoid
settling with its largest axis perpendicular to its motion, both
of these factors reduced to terms that are proportional to (dn/
dA)3. For a cylinder falling on its side, Co is equal to E� 1/2.
Accordingly, the Corey shape factor seems to be appropriate
to characterize the flatness of particles that exhibit a com-
pact shape. One of the disadvantages of using this shape
factor is that Co = 1 for spheres as well as for non-compact
particles having three perpendicular axes of same length,
such as star-shaped particles. For this reason, Co does not
give any information on the deviation of the shape of the
particle from the spherical shape.
It appears that a combination of several shape factors
may be necessary to properly describe the effect of the shape
of a particle on the hydrodynamic drag coefficient. After
studying the effect of all the above shape factors on the drag
coefficient, we found out that the particle volume, projected
area, flatness and circularity are well-characterized by the
nominal diameter, dn, the surface-equivalent-sphere diame-
ter, dA, the ratio dn/dA and the particle circularity, c.
2.3. The drag coefficients for non-spherical particles
Two approaches for the determination of the steady-state
drag force on a particle may be found in the literature. The
first and most widely used is based on the diameter and the
projected area of an equivalent-volume-sphere. Eq. (2) is the
expression that results from this approach, where the parti-
cle nominal diameter, dn plays the most important role.
The second approach is to calculate the drag force by
considering the actual projected surface area of the irregular
particle [10,16,17]. This drag coefficient, denoted by CDA,
is defined as follows:
CDA ¼ 4
3
d3nd2A
ðqs � qf Þqf
g
w2s
: ð8Þ
The ratio CD/CDA is equal to (dA/dn)2. Because the drag
force is a function of the projected area in the direction of
the flow, we used this approach for the determination of a
suitable correlation function. An a posteriori test of the data
and the derived correlation with both methods showed that
this was a very good choice for the reduction of the
experimental data.
3. Experimental facility and procedure
We conducted experiments for the determination of the
terminal velocity of irregular particles and the calculation of
the drag force exerted on them. Experiments were con-
ducted in a 1.85-m-long, 12.7-cm inner diameter, Plexiglas,
cylindrical tank with the lower end sealed. Water–glycerin
solutions of different concentrations and viscosities were
used as the fluid. The high-dynamic viscosities were mea-
sured by means of a Cannon–Fenske viscometer with
distilled water as the reference fluid, while the intermediate
and low viscosities were determined by using the falling ball
method. Comparisons with the results on the viscosity of the
fluid and published tables of the viscosity as a function of
the composition of the water–glycerin mixture showed
excellent agreement. The fluid was loaded into the tube at
least 24 h prior to the experiments, thereby allowing any air
bubbles to exit the liquid and for thermal equilibrium to be
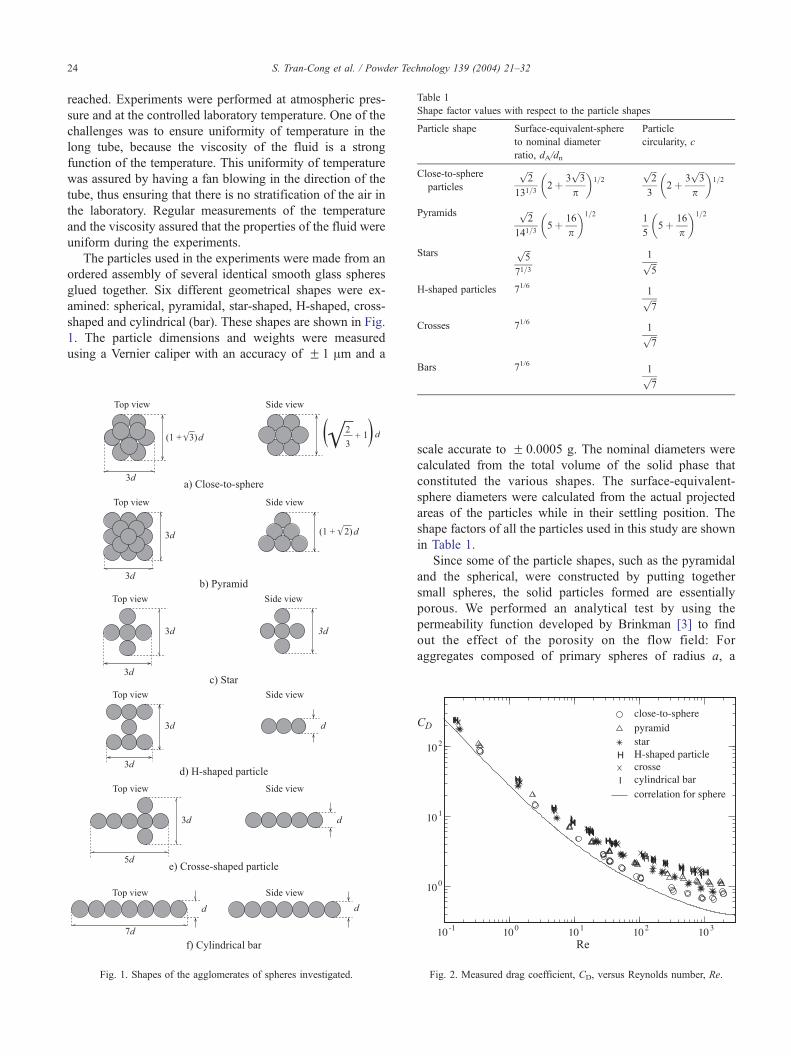
Table 1
Shape factor values with respect to the particle shapes
Particle shape Surface-equivalent-sphere
to nominal diameter
ratio, dA/dn
Particle
circularity, c
Close-to-sphere
particles
ffiffiffi2
p
131=32þ 3
ffiffiffi3
p
p
� �1=2
ffiffiffi2
p
32þ 3
ffiffiffi3
p
p
� �1=2
Pyramids ffiffiffi2
p
141=35þ 16
p
� �1=21
55þ 16
p
� �1=2
Stars ffiffiffi5
p
71=3
1ffiffiffi5
p
H-shaped particles 71/6 1ffiffiffi7
p
Crosses 71/6 1ffiffiffi7
p
S. Tran-Cong et al. / Powder Technology 139 (2004) 21–3224
reached. Experiments were performed at atmospheric pres-
sure and at the controlled laboratory temperature. One of the
challenges was to ensure uniformity of temperature in the
long tube, because the viscosity of the fluid is a strong
function of the temperature. This uniformity of temperature
was assured by having a fan blowing in the direction of the
tube, thus ensuring that there is no stratification of the air in
the laboratory. Regular measurements of the temperature
and the viscosity assured that the properties of the fluid were
uniform during the experiments.
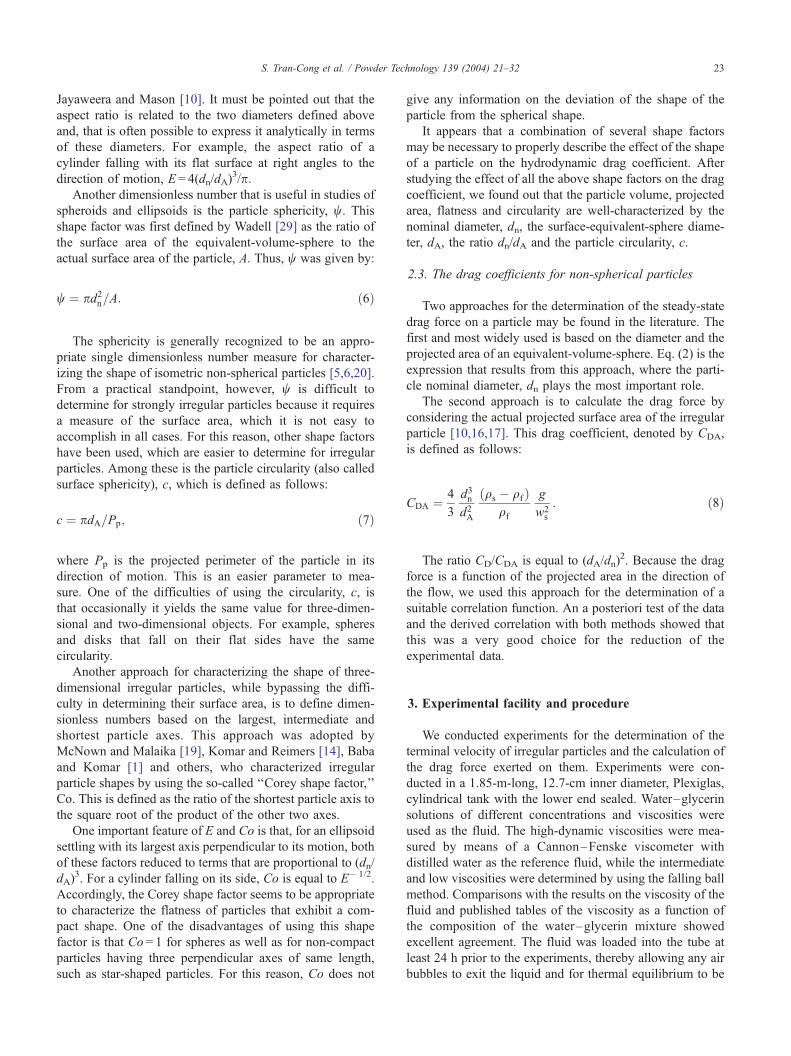
The particles used in the experiments were made from an
ordered assembly of several identical smooth glass spheres
glued together. Six different geometrical shapes were ex-
amined: spherical, pyramidal, star-shaped, H-shaped, cross-
shaped and cylindrical (bar). These shapes are shown in Fig.
1. The particle dimensions and weights were measured
using a Vernier caliper with an accuracy of F 1 Am and a
Fig. 1. Shapes of the agglomerates of spheres investigated.
Bars 71/6 1ffiffiffi7
p
scale accurate to F 0.0005 g. The nominal diameters were
calculated from the total volume of the solid phase that
constituted the various shapes. The surface-equivalent-
sphere diameters were calculated from the actual projected
areas of the particles while in their settling position. The
shape factors of all the particles used in this study are shown
in Table 1.
Since some of the particle shapes, such as the pyramidal
and the spherical, were constructed by putting together
small spheres, the solid particles formed are essentially
porous. We performed an analytical test by using the
permeability function developed by Brinkman [3] to find
out the effect of the porosity on the flow field: For
aggregates composed of primary spheres of radius a, a
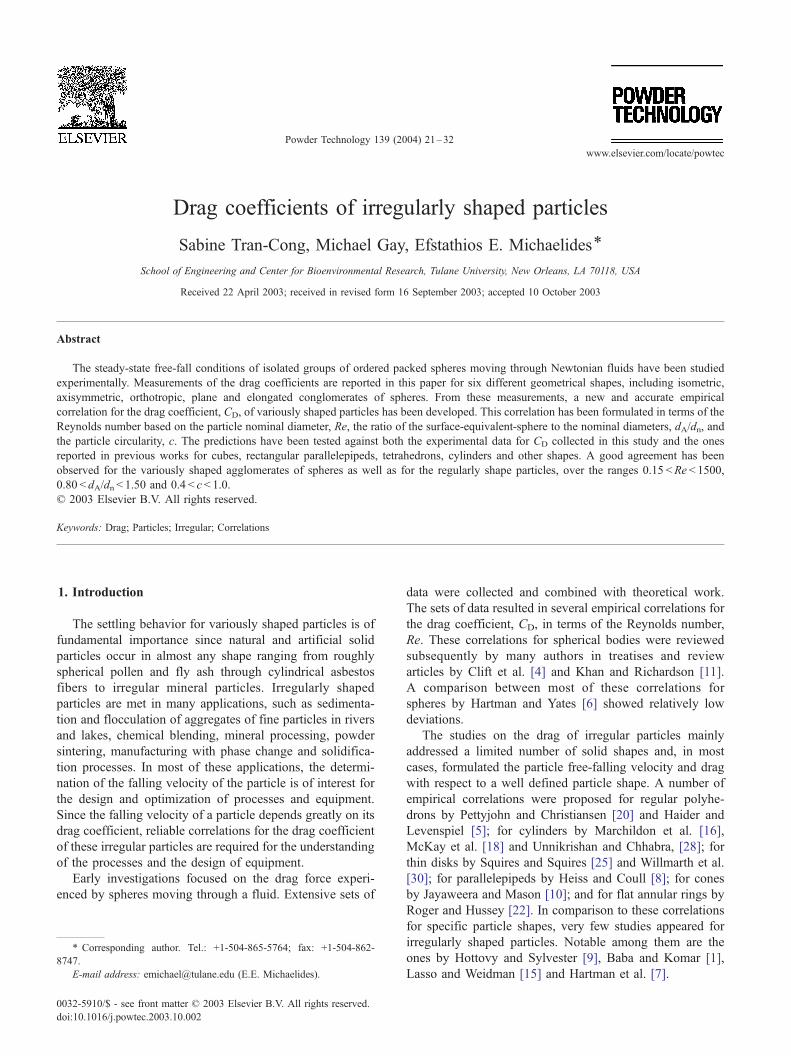
Re
CD
Fig. 2. Measured drag coefficient, CD, versus Reynolds number, Re.
S. Tran-Cong et al. / Powder Technology 139 (2004) 21–32 25
number of investigations concluded that the dimensionless
permeability j/a2 depends only on the solids fraction of the
medium [12]. The solids fraction, /, varies with the struc-
ture of the medium. In this study, we used two different
packing arrangements to construct the spherical and pyra-
midal shapes, which are shown in Fig. 1a and b, respec-
tively. For both arrangements, the solids fraction, /, wasequal to 0.7405, which corresponds to the closest packing of
spheres. Hence, the porosity was at its minimum value of
0.2595. The dimensionless permeability defined by Brink-
man [3] as,
ja2
¼ 2
9/1þ 3
4/ 1�
ffiffiffiffiffiffiffiffiffiffiffiffi8
/� 3
s ! !; ð9Þ
was very low (0.0012). This test showed that there was no
significant flow through these agglomerate particles, be-
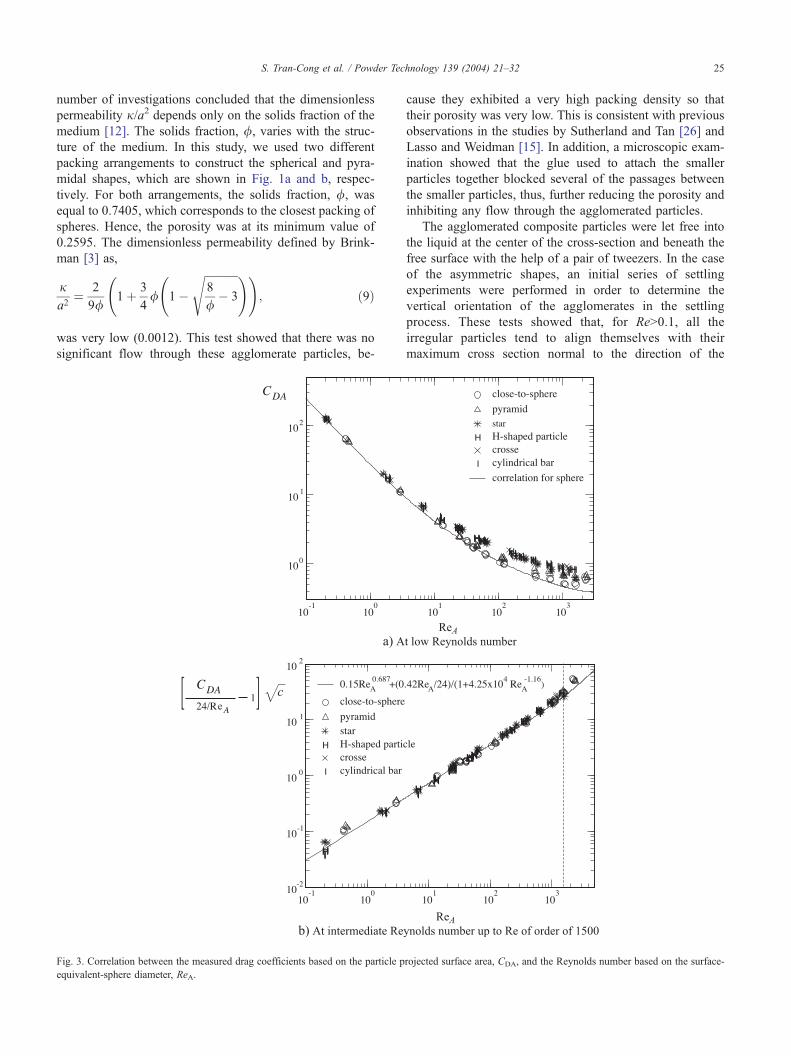
Fig. 3. Correlation between the measured drag coefficients based on the particle p
equivalent-sphere diameter, ReA.
cause they exhibited a very high packing density so that
their porosity was very low. This is consistent with previous
observations in the studies by Sutherland and Tan [26] and
Lasso and Weidman [15]. In addition, a microscopic exam-
ination showed that the glue used to attach the smaller
particles together blocked several of the passages between
the smaller particles, thus, further reducing the porosity and
inhibiting any flow through the agglomerated particles.
The agglomerated composite particles were let free into
the liquid at the center of the cross-section and beneath the
free surface with the help of a pair of tweezers. In the case
of the asymmetric shapes, an initial series of settling
experiments were performed in order to determine the
vertical orientation of the agglomerates in the settling
process. These tests showed that, for Re>0.1, all the
irregular particles tend to align themselves with their
maximum cross section normal to the direction of the
rojected surface area, CDA, and the Reynolds number based on the surface-
S. Tran-Cong et al. / Powder Technology 139 (2004) 21–3226
settling motion. The settling at this preferred orientation
was maintained up to Re = 100. At higher Re, the particles
settled in a steady-state orientation only after they were
released with their maximum cross section parallel to the
horizontal axis. For any other initial orientation, the
elongated particles show a tendency to wobble around a
horizontal axis, while the fuller bluff bodies tend to rotate
and, hence, they follow a spiral motion rather than a
straight vertical path. During the experiments, we ensured
that the irregular particles quickly reached their steady-
state settling by releasing them in the orientation they
settle steadily.
The terminal velocities were measured using a high-
speed video camera of high resolution with the CCD
captor sensor discerning 256 grey levels. The camera
takes 500 frames/s, with an exposure time of 1/500 s.
Whenever we found that the agglomerated particles
Predic
Re
Fig. 4. Comparison between our experimenta
exhibited unsteady oscillatory motion (at very high Re),
hit the wall of the container or went too close to the wall
(2–3 diameters) to be influenced by the presence of the
wall the measurements were excluded from the analysis.
The measured values of terminal velocity were used to
calculate CD from Eq. (2). Considering all the experi-
ments performed, the Reynolds numbers extended from
0.15 to 2000. The experimental uncertainties were calcu-
lated to be 5% in the range 0.15 <Re < 1, 2% for Re
from 1 to 100, and less than 4% for 100 <Re < 2000. The
higher uncertainty in the last range is due to the
unsteadiness of the settling because of the wakes formed
behind the agglomerate particles. It must be pointed out,
that because of the high-speed camera we used, the
uncertainties observed in the current set of data are lower
than the ones reported for the determination of the drag
coefficient of spheres [4].
ted CD
l drag coefficients and the correlation.

Table 2
Statistical averages for the correlation of the experimental data
Sphere Pyramid Star H-shaped Cross Bar
Number of
data pts.
40 45 42 46 44 48
Mean absolute
percent
error (%)
7.97 9.02 7.24 5.97 7.00 4.71
Root mean
square error
0.55 1.08 0.97 0.59 0.68 1.18
R2 value 0.99944 0.99835 0.99958 0.99990 0.99978 0.99958
R-value 0.99972 0.99918 0.99979 0.99995 0.99989 0.99979
S. Tran-Cong et al. / Powder Technology 139 (2004) 21–32 27
4. Experimental results and data reduction
The experimental data of the drag coefficient, CD, as a
function of the Reynolds number, Re, are plotted in Fig. 2.
At a given Reynolds number, the values of the drag
coefficient for all the irregular particles were higher than
the ones for spheres, regardless of the shape of the agglom-
erate. This difference increased with both the Reynolds
Fig. 5. Measured and predicted drag coefficients, CD, vers
numbers and the departure of the particle shape from an
isometric compact body. Three distinct trends were ob-
served during the experiments:
� First, agglomerates that have a near-spherical shape
showed the lowest drag coefficients and their drag curves
were always close to those of the spheres. The external
shape of these particles was close-to-sphere with a
corrugated outer surface.� Second, at a given Re, the highest values of CD were the
data for the agglomerates made with non-circular planar
constructions, such as the cylindrical bar, the cross-
shaped, and the H-shaped particles. All of these
agglomerates were characterized by the same projected
surface area and the same nominal diameter. Therefore,
they have the same ratio dA/dn. As shown in Fig. 2, the
data sets related to these planar shapes were very close to
each other, regardless of the actual particle elongation.
This leads to the conclusion that the ratio dA/dn is an
important parameter that characterizes the settling of
us Reynolds number, Re, for each shape examined.

S. Tran-Cong et al. / Powder Technology 139 (2004) 21–3228
irregular particles. Using this parameter as the character-
istic of particles brings together the drag coefficient data
for diverse groups and shapes of particles.� Third, the experimental data for the cylinder and star-
shaped agglomerates exhibited drag coefficients between
those of spheres and the shapes mentioned in the
previous paragraph. The only exception to this was
observed at Re>400, where the measured CD for the
pyramidal conglomerates were higher than the ones for
star-shaped particles. This is due to the fact that pyramids
at Re>400 shed unsteady vortices that slow the motion of
the particle itself.
Following the trends observed in Fig. 2, we correlated the
experimental data in terms of dimensionless numbers based
on the projected surface area of the irregular particles.We first
used the equivalent-surface-area for calculating a drag coef-
ficient. This resulted in a coefficient CDA as defined by Eq.
(8). This procedure brought the curves of CDA vs. Re for all
Fig. 6. Comparisons between the experimental drag coefficients for
isometric particles given by previous works [8,20] and the predictions
from both Eq. (10b) and Haider and Levenspiel’s [5] correlation.
the isometric shapes closer to each other up to Re = 100.
However, the curves of CDA vs. Re for particles made with
planar construction still deviated considerably from the
curves of CDA associated with spherical agglomerates. For
this reason, we selected the ratio dA/dn, which characterizes
the flatness of a particle. This ratio was also recognized to be
appropriate for this purpose in previous studies by Heiss and
Coull [8], Singh and Roychowdhury [24], Unnikrishan and
Chhabra [28], and Rodrigue et al. [21].
In order to express the deviation of the projected area of
the particle from that of a disk, we included the parameter of
circularity, c, in our analysis. Based on our experimental
observations and after examining several graphical ways to
reduce the whole set of experimental data, we decided that the
most general and accurate correlation would be obtained by
modifying Eq. (3) for the drag coefficient of spheres in an
infinite fluid. Thus, we derived a simple but accurate corre-
lation, which includes the parameters of circularity, c, and the
flatness ratio dA/dn. The final result is the following expres-
sion for the drag coefficient:
CDA ¼ 24
dA
dnRe
� � 1þ 0:15ffiffiffic
p dA
dnRe
� �0:687" #
þ 0:42
ffiffiffic
p1þ 4:25� 104
dA
dnRe
� ��1:16" # ; ð10aÞ
5. General observations
The corresponding set of data for each conglomerate
shapes examined is shown in Fig. 3. The various curves of
CDA vs. (dA/dn)*Re practically coincided in the range
0.2 < (dA/dn)Re < 10, which means that the data for all the
shapes are well correlated in this range. For higher Reynolds
numbers, the introduction of c was required to more accu-
rately correlate the data, as shown in Fig. 3b. It is observed in
this figure that the proposed correlation fits well the data up to
(dA/dn)*Re of the order of 1500.
From Eq. (10a), it is very easy to obtain an equation
for the actual drag coefficient, CD, which is defined in
terms of the nominal diameter by Eq. (2) and is the most
widely used definition for the drag coefficient of irregular
particles. The final correlation function obtained is as
follows:
CD ¼ 24
Re
dA
dn1þ 0:15ffiffiffi
cp dA
dnRe
� �0:687" #
þ0:42
dA
dn
� �2
ffiffiffic
p1þ 4:25� 104
dA
dnRe
� ��1:16" # : ð10bÞ
S. Tran-Cong et al. / Powder Technology 139 (2004) 21–32 29
Eq. (10b) was derived from data in the ranges 0.15 <
Re < 1500, 0.80 < dA/dn < 1.50 and 0.4 < c < 1.0. These ranges
cover most of the irregularly shaped particles in engineering
applications. It must be pointed out that the functional form of
Eqs. (10a) and (10b) was decided upon only after several
functional forms and data reduction methods were tested. The
criterion used in the determination of the functional form to
be used was the minimization of the standard deviation
(standard error) of the predicted data from the actual data.
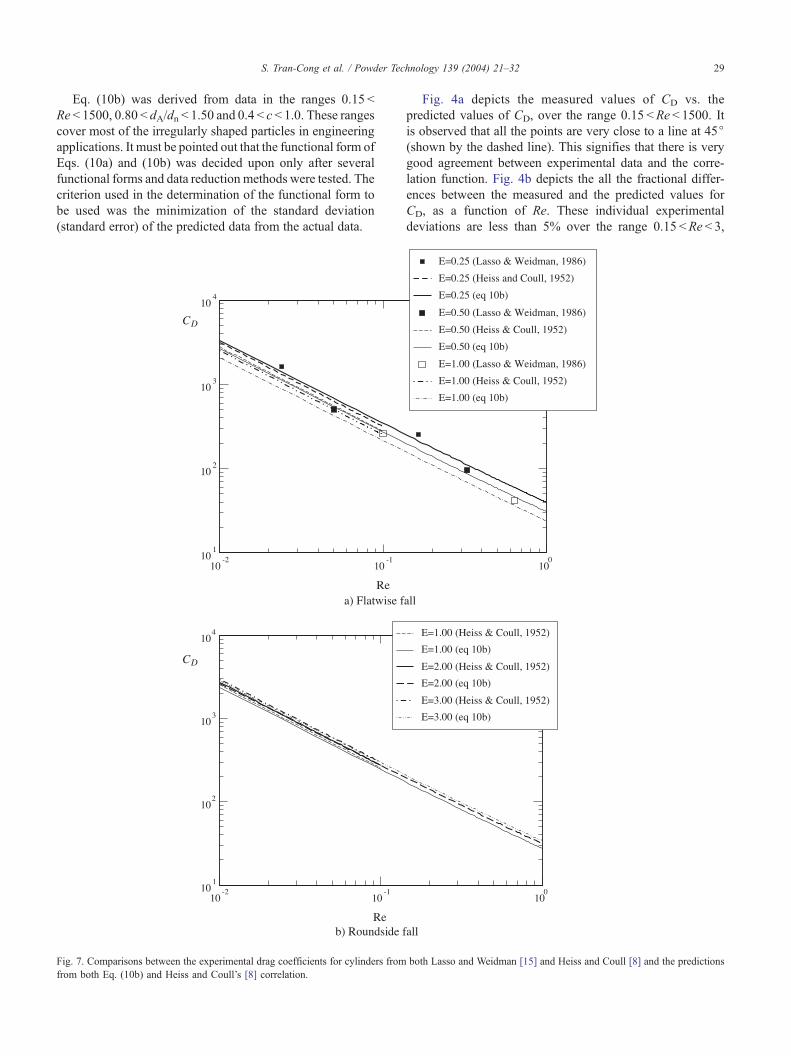
Fig. 7. Comparisons between the experimental drag coefficients for cylinders from
from both Eq. (10b) and Heiss and Coull’s [8] correlation.
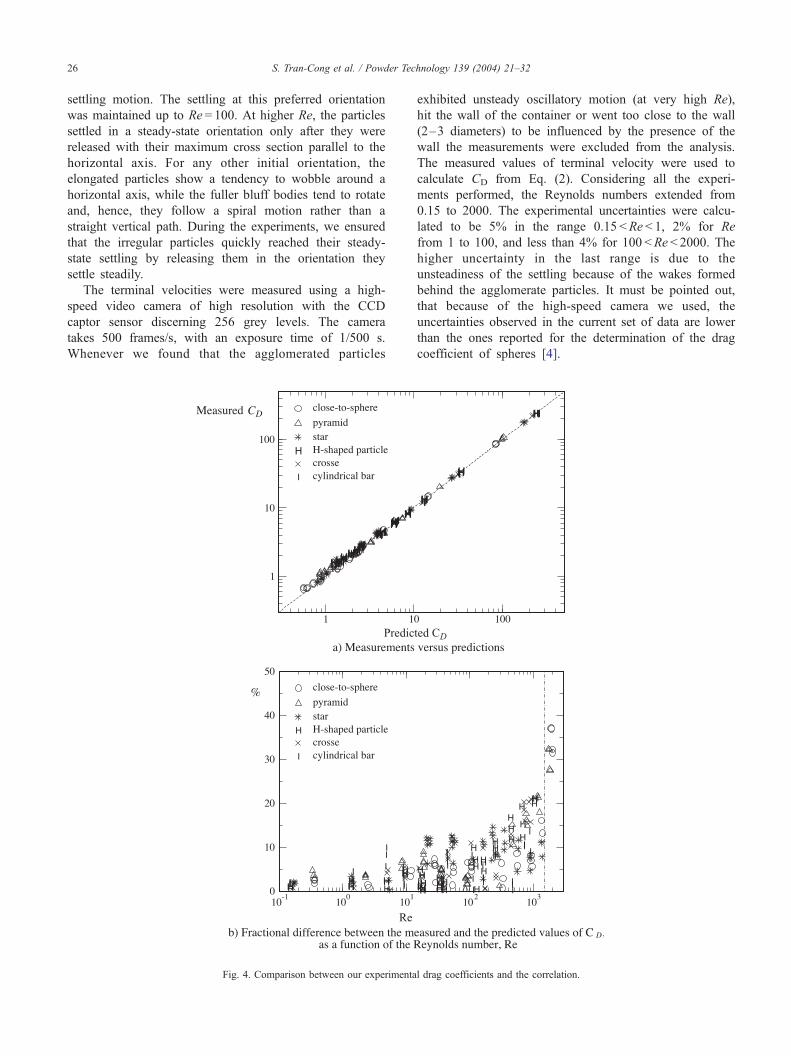
Fig. 4a depicts the measured values of CD vs. the
predicted values of CD, over the range 0.15 <Re < 1500. It
is observed that all the points are very close to a line at 45j(shown by the dashed line). This signifies that there is very
good agreement between experimental data and the corre-
lation function. Fig. 4b depicts the all the fractional differ-
ences between the measured and the predicted values for
CD, as a function of Re. These individual experimental
deviations are less than 5% over the range 0.15 <Re < 3,
both Lasso and Weidman [15] and Heiss and Coull [8] and the predictions
S. Tran-Cong et al. / Powder Technology 139 (2004) 21–3230
less than 12% in the range 3 <Re < 200, where the wake
behind the particle is formed and less than 20% for
200 < Re < 1500, where the wakes behind the particles
become unstable and vortices are shed in the flow. The
average data absolute errors are less than 10%. It appears in
Fig. 4b that even up to Re = 1550, which is shown by the
dot-dashed line, the correlation and the data agree fairly
well. Above this value of Re, the fractional differences
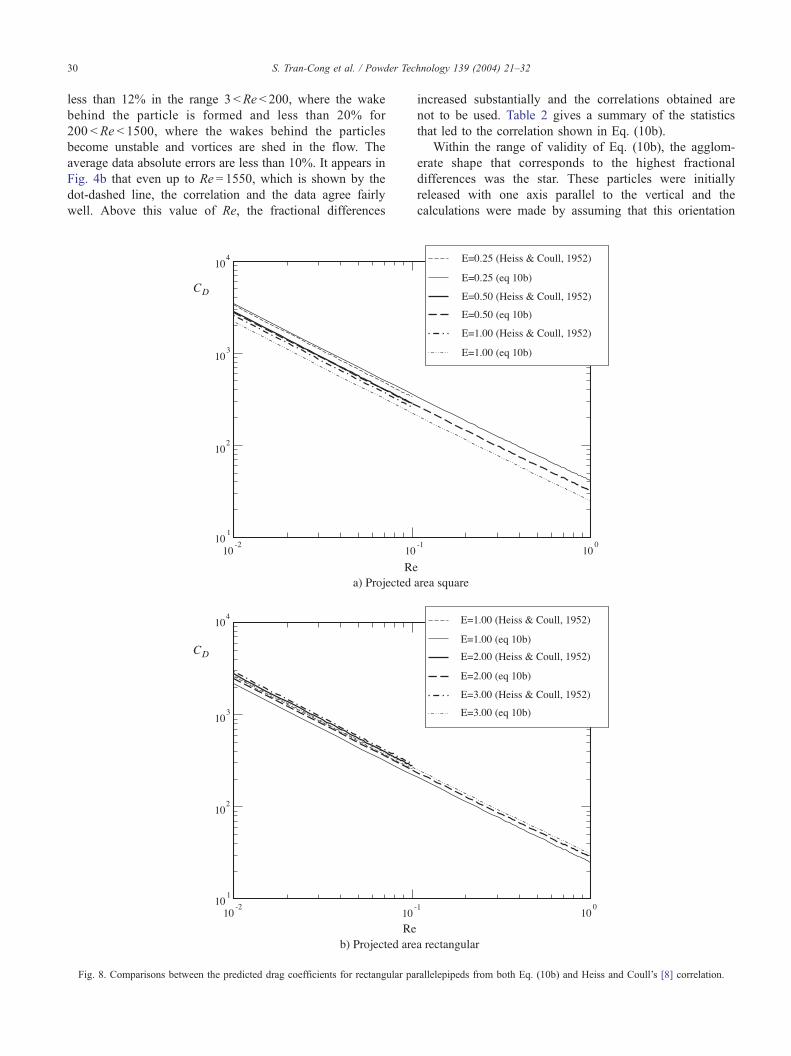
Fig. 8. Comparisons between the predicted drag coefficients for rectangular pa
increased substantially and the correlations obtained are
not to be used. Table 2 gives a summary of the statistics
that led to the correlation shown in Eq. (10b).
Within the range of validity of Eq. (10b), the agglom-
erate shape that corresponds to the highest fractional
differences was the star. These particles were initially
released with one axis parallel to the vertical and the
calculations were made by assuming that this orientation
rallelepipeds from both Eq. (10b) and Heiss and Coull’s [8] correlation.
Table 3
Comparison between the experimental drag coefficients for cylinders given
by previous works and predictions from Eq. (10b)
E Re dA/dn c Measured CD
from Lasso
and Weidman
Predicted CD
from Eq. (10b)
Absolute
fractional
difference (%)
1.00 0.634 0.8736 1.0 41.59 36.37 12.54
1.00 0.100 0.8736 1.0 261.5 215.55 17.57
0.50 0.326 1.1006 1.0 95.50 87.03 8.86
0.50 0.050 1.1006 1.0 592.6 539.09 9.03
0.75 0.164 1.3867 1.0 253.4 213.93 15.56
0.75 0.024 1.3867 1.0 1614 1406.7 12.87
S. Tran-Cong et al. / Powder Technology 139 (2004) 21–32 31
is stable throughout the settling process. However, at
intermediate and high Re, the stars showed an occasional
tendency to align themselves with two axes at 45j with
respect to the horizontal. In these cases, the actual surface
projected was higher than the one considered in the
calculations and this resulted in an under-prediction of
the drag coefficient, which is depicted in Fig. 5b.
The measured and predicted drag coefficients vs. the
Reynolds number are plotted in Fig. 5a, b and c. For the
close-to-sphere agglomerates, our measurements at low
Reynolds were consistent with the measured value of CD
from Lasso and Weidman [15] and with their correlation,
which is valid for Re up to 1. Our predictions for the
agglomerates made with both spherical and planar construc-
tions agreed very well with the measurements over the range
0.15 <Re < 1500, as shown in Fig. 5a and c. It must be
pointed out that the predictions for the cross-shaped, bar-
shaped and H-shaped agglomerates of spheres form a single
straight line, because these particles were characterized by
the same flatness ratio, dA/dn, and the same circularity, c.
The calculated drag coefficients for the pyramidal shape
slightly under-predicted the experimental data at Re higher
than 300. A similar trend was observed for the star-shaped
agglomerates over the range 20 <Re < 1000. However, these
discrepancies remained relatively low as shown in Fig. 4b.
We have also tested the derived correlation (Eq. (10b))
with experimental data and correlations given in previous
studies, for particles of regular shapes. Both isometric and
axisymmetric particles were considered. Comparisons for
isometric polyhedrons are shown in Fig. 6. Two shapes of
polyhedrons were examined: cubes and tetrahedrons. The
corresponding shape factors dA/dn and c for these shapes are
well within the range of validity of Eq. (10b). It is observed in
Fig. 6 that for low and intermediate Re, the predictions from
Eq. (10b) are always in very good agreement with both the
measured values from Pettyjohn and Christiansen [20] and
the correlation derived by Haider and Levenspiel [5]. The
individual fractional differences, which were higher for cubes
than for tetrahedrons, did not exceed the value of 10%, which
is close to the experimental uncertainty of previous methods.
This good agreement between the data and the correlations
is in the range 0.01 < Re < 200 for cubes and from
0.03 <Re < 50 for tetrahedrons. At higher values of Re, the
calculatedCD deviated from the experimental set of data. The
deviations abruptly increase and eventually become constant.
This is due to the formation of a strong wake at the aft of the
polyhedron, which tends to induce a wobbling or spinning
motion. This was also observed by Pettyjohn and Christian-
sen [20]. In this case, the two polyhedrons teetered or
wobbled and eventually spun or rolled on a horizontal axis
and followed a spiral path rather than a straight vertical path
in their descent. This difference in the settling process
explains the scattering observed in Fig. 6a.
It must be pointed out that, in our experiments with
agglomerates, this unstable settling process was observed
occasionally for 50 <Re < 1000, and systematically for Re
higher than 1600. Also that, even though the Haider and
Levenspiel [5] expression showed a good agreement with the
measuredCD for the isometric particles, it is unsuitable for the
predictions of the drag for agglomerates that are close to the
spherical shape. Because of the presence of an exponential
function in its formulation, a very small change in the
sphericity results in very large effects on the value for CD.
We also compared the drag coefficients obtained by Eq.
(10b) with experimental values for rectangular parallelepi-
peds and cylinders from previous studies. We considered the
data reported by Heiss and Coull [8] and by Lasso and
Weidman [15]. Both focused on very low Reynolds numb-
ers, Re < 1. We selected the data corresponding to particles
falling with their maximum cross section normal to the
motion of the particle and tested our correlation with the
experimental data. Then, we calculated the corresponding
CD using Eq. (10b). The results of this comparison are
shown in Figs. 7 and 8 as well as in Table 3. A glance at the
figures and the table proves that Eq. (10b) predicts fairly
well the experimental data for CD for axisymmetric par-
ticles, as long as they are settling with their axis either
horizontal or vertical. However, it should be mentioned that
the predictions for both cylinders and rectangles, which
were initially released with the maximum cross section
parallel to the motion, did not agree well with the measured
values of CD that are reported by Heiss and Coull [8] for
0.05 <Re < 0.1. The same observation was made by testing
the predicted CD values from Eq. (10b) with the data
reported by Lasso and Weidman [15] for solid cylinders in
the range 0.05 <Re < 0.6. This discrepancy is due to the fact
that these particles did not maintain their vertical orientation
as pointed out by Pettyjohn and Christiansen [20], Becker
[2] Marchildon et al. [16] and Jayaweera and Mason [10].
6. Conclusions
Laboratory measurements were conducted to determine
the terminal velocity of irregularly shaped agglomerates of
spheres. The drag coefficients were subsequently calculated
and reported. The experimental error of the measurements
was considerably lower than that of previous studies. From
these measurements and several optimization tests with
S. Tran-Cong et al. / Powder Technology 139 (2004) 21–3232
different functional forms, we derived a simple but accurate
correlation for the drag coefficients of irregular particles,
which is shown in Eq. (10b). A combination of several
shape factors was necessary to properly describe the effect
of the shape of a particle on the hydrodynamic drag
coefficient. We found out that the Reynolds number based
on the particle nominal diameter, Re, the ratio of the surface-
equivalent-sphere to the nominal diameters, dA/dn, and the
particle circularity, c are appropriate dimensionless number
measures for characterizing the deviation of the shape of the
particle from the spherical shape.
The proposed correlation is valid in the ranges of varia-
bles 0.15 <Re < 1500, 0.80 < dA/dn < 1.50 and 0.4 < c < 1.0.
These ranges cover most of the irregularly shaped particles in
engineering applications. Measurements and predictions are
in very good agreement for the sphere agglomerates, as well
as for more regularly shape particles that are reported in
previous studies provided that the particles were released
with their maximum cross section parallel to the motion.
Furthermore, in the case of spheres, the present correlation
for the drag coefficient reduces to a well-known expression
for spheres [4].
Acknowledgements
This research effort was partly supported by a grant by
the ONR to the Tulane/Xavier Center for Bioenvironmental
Research, for which the authors are thankful.
References
[1] J. Baba, P.D. Komar, Settling velocities of irregular grains at low
Reynolds number, J. Sediment. Petrol. 51 (1) (1981) 121–127.
[2] H.A. Becker, The effects of shape and Reynolds number on drag in
the motion of a freely oriented body in an infinite field, Can. J. Chem.
Eng. 37 (1959) 85–91.
[3] H.C. Brinkman, A calculation of the viscous force exerted by a flow-
ing fluid on a dense swarm of particles, Appl. Sci. Res., Sect. A,
Mech., Heat 1 (1947) 27–34.
[4] R. Clift, J.R. Grace, M.E. Weber, Bubbles, Drops and Particles, Aca-
demic Press, New York, 1978.
[5] A.M. Haider, O. Levenspiel, Drag coefficient and terminal velocity
of spherical and nonspherical particles, Powder Technol. 58 (1989)
63–70.
[6] M. Hartman, J.G. Yates, Free-fall of solid particles through fluids,
Collect. Czechoslov. Chem. Commun. 58 (5) (1993) 961–982.
[7] M. Hartman, O. Trnka, K. Svoboda, Free settling of nonspherical
particles, Ind. Eng. Chem. Res. 33 (1994) 1979–1983.
[8] J.F. Heiss, J. Coull, The effect of orientation and shape on the settling
velocity of non-isometric particles in a viscous medium, Chem. Eng.
Prog. 48 (3) (1952) 133–140.
[9] J.D. Hottovy, N.D. Sylvester, Drag coefficients for irregularly
shaped particles, Ind. Eng. Chem. Process Des. Dev. 18 (3)
(1979) 433–436.
[10] K.O.L.F. Jayaweera, B.J. Mason, The behavior of freely falling cylin-
ders and cones in viscous fluid, J. Fluid Mech. 22 (4) (1965) 709–720.
[11] A.R. Khan, J.F. Richardson, The resistance to motion of a solid sphere
in a fluid, Chem. Eng. Commun. 62 (1987) 135–150.
[12] A.S. Kim, K.D. Stolzenbach, The permeability of synthetic fractal
aggregates with realistic three-dimensional structure, J. Colloid Inter-
face Sci. 253 (2002) 315–328.
[13] P.D. Komar, Settling velocities of circular cylinders at low Reynolds
number, J. Geol. 48 (1980) 327–336.
[14] P.D. Komar, C.E. Reimers, Grain shape effects on settling rates,
J. Geol. 86 (1978) 193–209.
[15] I.A. Lasso, P.D. Weidman, Stokes drag on hollow cylinders and con-
glomerates, Phys. Fluids 29 (12) (1986) 3921–3934.
[16] E.K. Marchildon, A. Clamen, W.H. Gauvin, Drag and oscillatory
motion of freely falling cylindrical particles, Can. J. Chem. Eng. 42
(1964) 178–182.
[17] J.H. Masliyah, N. Epstein, Numerical study of steady flow past sphe-
roids, J. Fluid Mech. 44 (3) (1970) 493–512.
[18] G. McKay, W.R. Murphy, M. Hillis, Settling characteristics of discs
and cylinders, Chem. Eng. Res. Des. 66 (1988) 107–112.
[19] J.S. McNown, J. Malaika, Effects of particle shape on settling velocity
at low Reynolds’ numbers, Trans. - Am. Geophys. Union 31 (1950)
74–82.
[20] E.S. Pettyjohn, E.R. Christiansen, Effect of particle shape on free-
settling rates of isometric particles, Chem. Eng. Prog. 44 (1948)
157–172.
[21] D. Rodrigue, D. DeKee, R.P. Chhabra, Drag on non-spherical particles
in non-Newtonian fluids, Can. J. Chem. Eng. 72 (1994) 588–593.
[22] R.P. Roger, R.G. Hussey, Stokes drag on a flat annular ring, Phys.
Fluids 25 (6) (1982) 915–922.
[23] L. Schiller, A. Naumann, Uber die grundlegende Berechnung bei der
Schwekraftaufbereitung, Ver. Deutch Ing. 77 (1933) 318–320.
[24] A.N. Singh, K.C. Roychowdhury, Study of the effects of orientation
and shape on the settling velocity of non-isometric particles, Chem.
Eng. Sci. 24 (1969) 1185–1186.
[25] L. Squires, W. Squires, The sedimentation of thin discs, Trans. Am.
Inst. Chem. Eng. 33 (1937) 1–11.
[26] D.N. Sutherland, C.T. Tan, Sedimentation of a porous sphere, Chem.
Eng. Sci. 25 (1970) 1950–1951.
[27] L.B. Torobin, W.H. Gauvin, Fundamental aspects of solid–gas flow:
Part IV. The effects of particle rotation, roughness and shape, Can. J.
Chem. Eng. 38 (1960) 142–153.
[28] A. Unnikrishan, R.P. Chhabra, An experimental study of motion of
cylinders in Newtonian fluids: wall effects and drag coefficient, Can.
J. Chem. Eng. 69 (1991) 729–735.
[29] H. Wadell, Sphericity and roundness of rock particles, J. Geol. 41
(1933) 310–331.
[30] W.W. Willmarth, N.E. Hawks, R.L. Harvey, Steady and unsteady
motions and wakes of freely disks, Phys. Fluids 7 (1964) 197–208.
Recommended