Introduction to D3.jsRamanathan Pachaiyappan
PwC
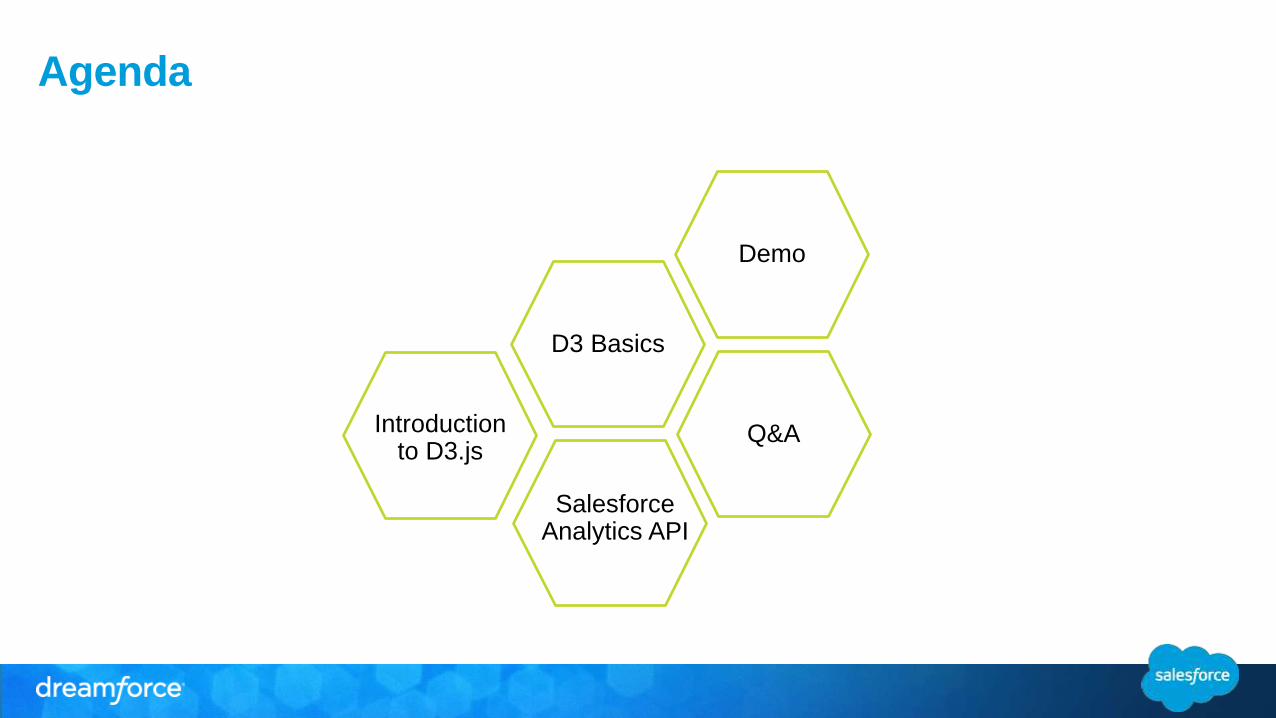
Agenda
D3 Basics
Introduction to D3.js
Salesforce Analytics API
Demo
Q&A
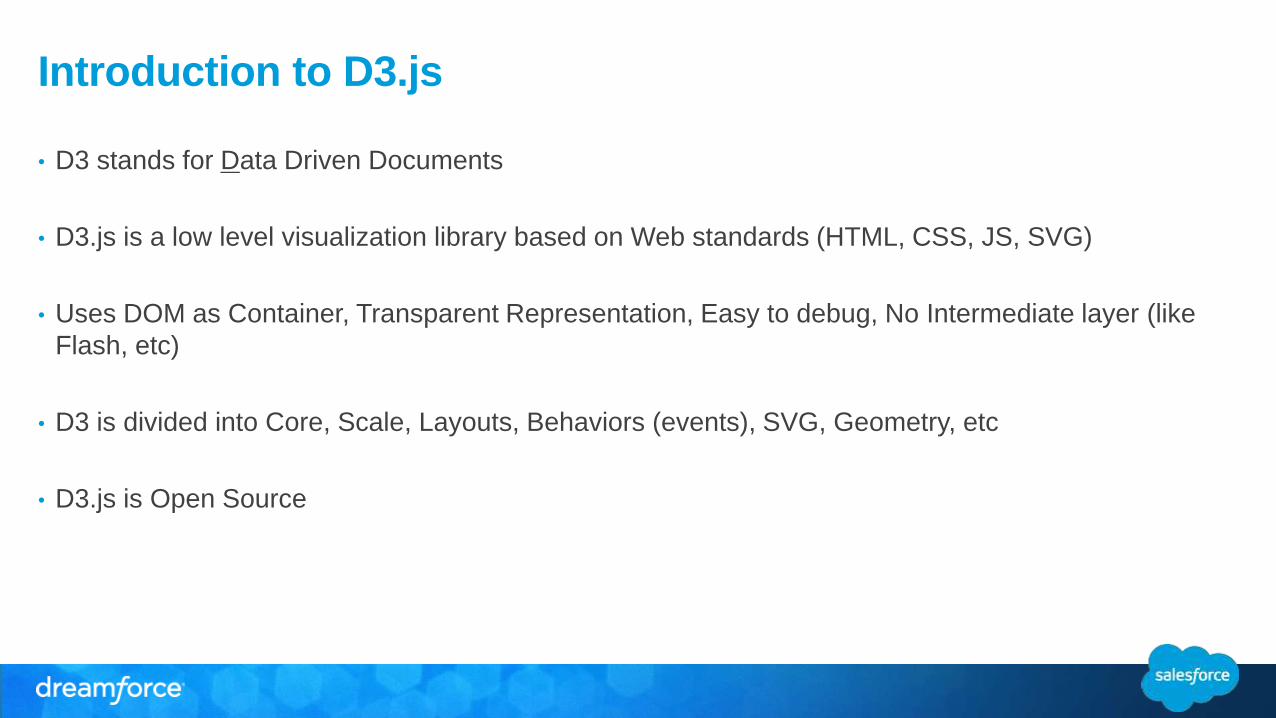
Introduction to D3.js
• D3 stands for Data Driven Documents
• D3.js is a low level visualization library based on Web standards (HTML, CSS, JS, SVG)
• Uses DOM as Container, Transparent Representation, Easy to debug, No Intermediate layer (like
Flash, etc)
• D3 is divided into Core, Scale, Layouts, Behaviors (events), SVG, Geometry, etc
• D3.js is Open Source
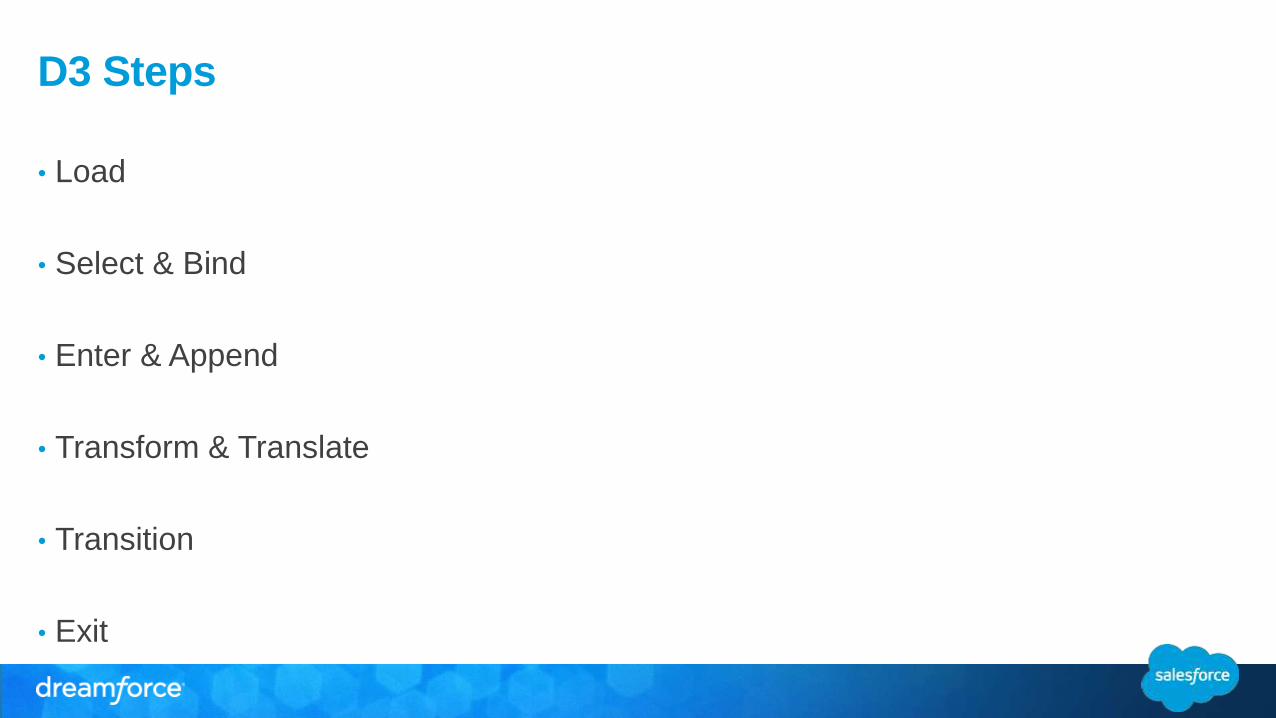
D3 Steps
• Load
• Select & Bind
• Enter & Append
• Transform & Translate
• Transition
• Exit
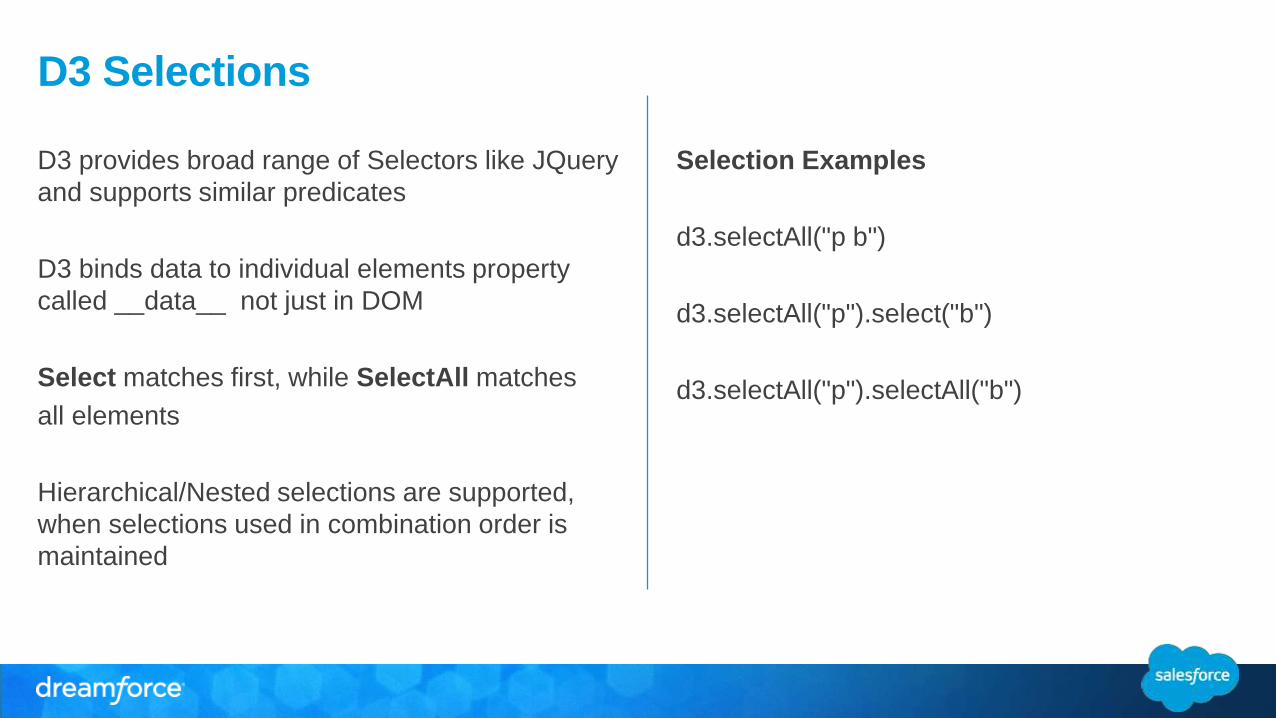
Selection Examples
d3.selectAll("p b")
d3.selectAll("p").select("b")
d3.selectAll("p").selectAll("b")
D3 Selections
D3 provides broad range of Selectors like JQuery
and supports similar predicates
D3 binds data to individual elements property
called __data__ not just in DOM
Select matches first, while SelectAll matches
all elements
Hierarchical/Nested selections are supported,
when selections used in combination order is
maintained
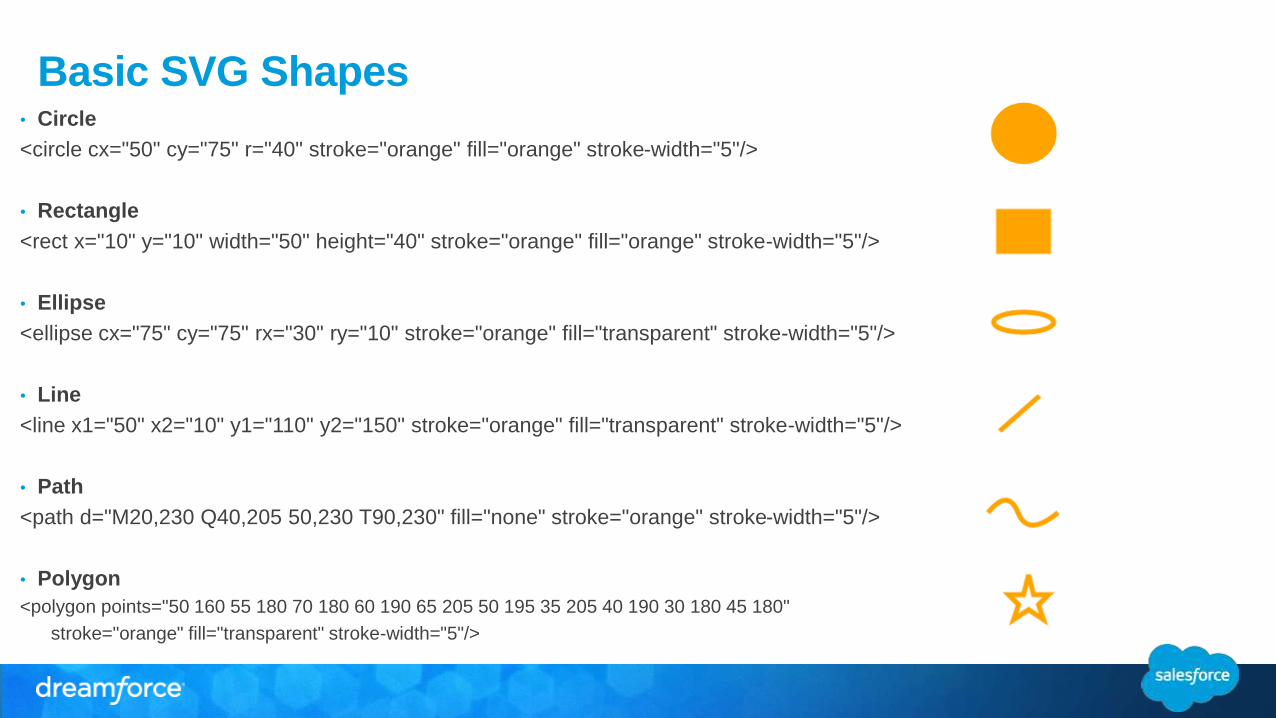
Basic SVG Shapes• Circle
<circle cx="50" cy="75" r="40" stroke="orange" fill="orange" stroke-width="5"/>
• Rectangle
<rect x="10" y="10" width="50" height="40" stroke="orange" fill="orange" stroke-width="5"/>
• Ellipse
<ellipse cx="75" cy="75" rx="30" ry="10" stroke="orange" fill="transparent" stroke-width="5"/>
• Line
<line x1="50" x2="10" y1="110" y2="150" stroke="orange" fill="transparent" stroke-width="5"/>
• Path
<path d="M20,230 Q40,205 50,230 T90,230" fill="none" stroke="orange" stroke-width="5"/>
• Polygon
<polygon points="50 160 55 180 70 180 60 190 65 205 50 195 35 205 40 190 30 180 45 180"
stroke="orange" fill="transparent" stroke-width="5"/>
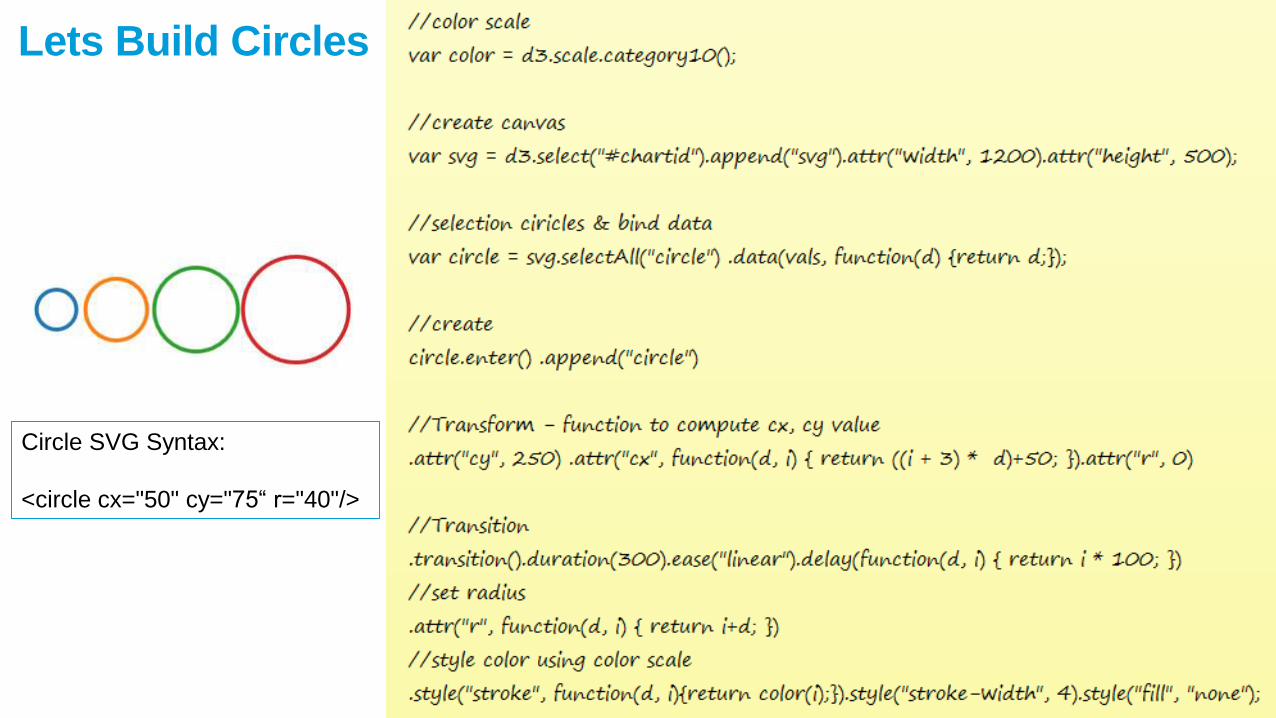
Lets Build Circles
Circle SVG Syntax:
<circle cx="50" cy="75“ r="40"/>
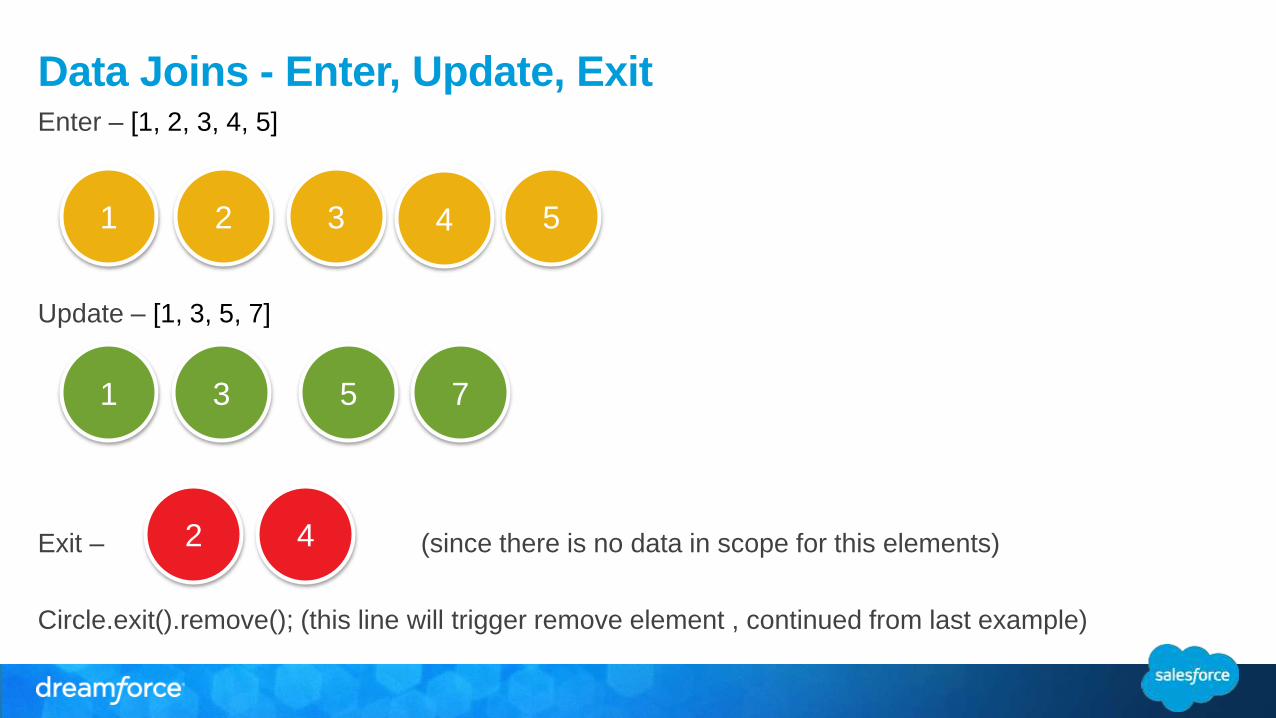
Data Joins - Enter, Update, ExitEnter – [1, 2, 3, 4, 5]
Update – [1, 3, 5, 7]
Exit – (since there is no data in scope for this elements)
Circle.exit().remove(); (this line will trigger remove element , continued from last example)
1 2 543
1 3 5 7
2 4
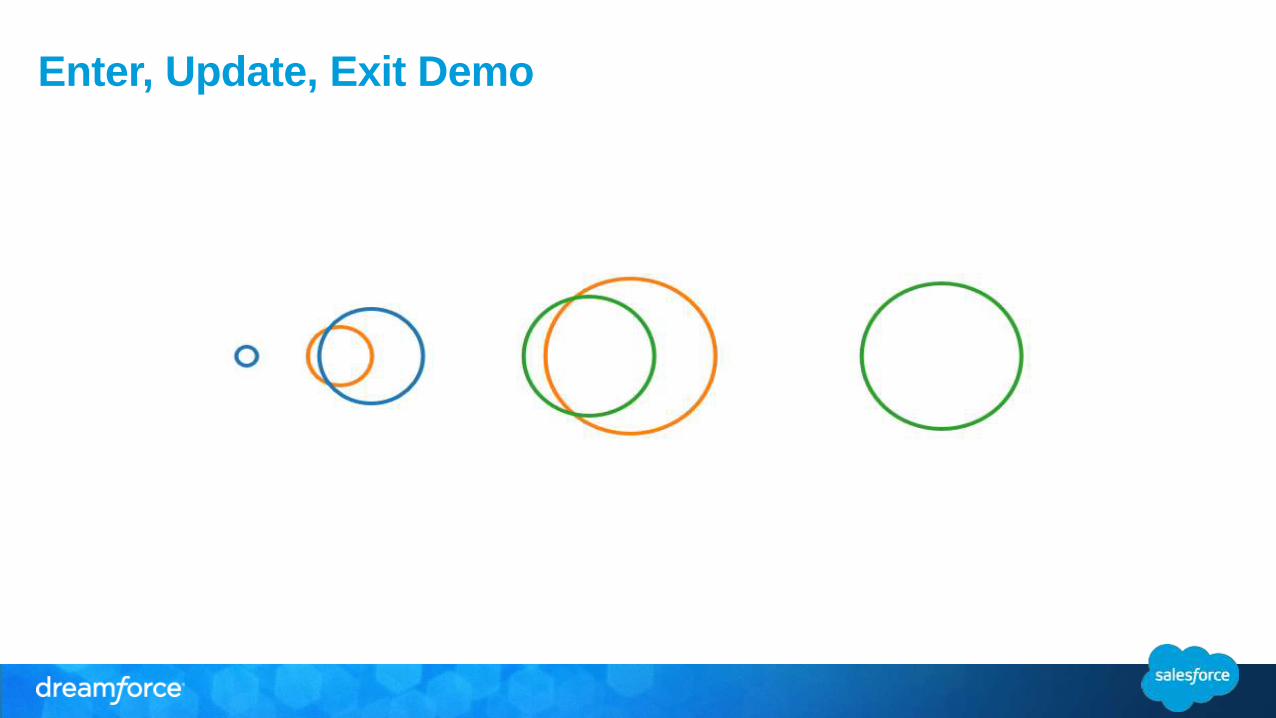
Enter, Update, Exit Demo
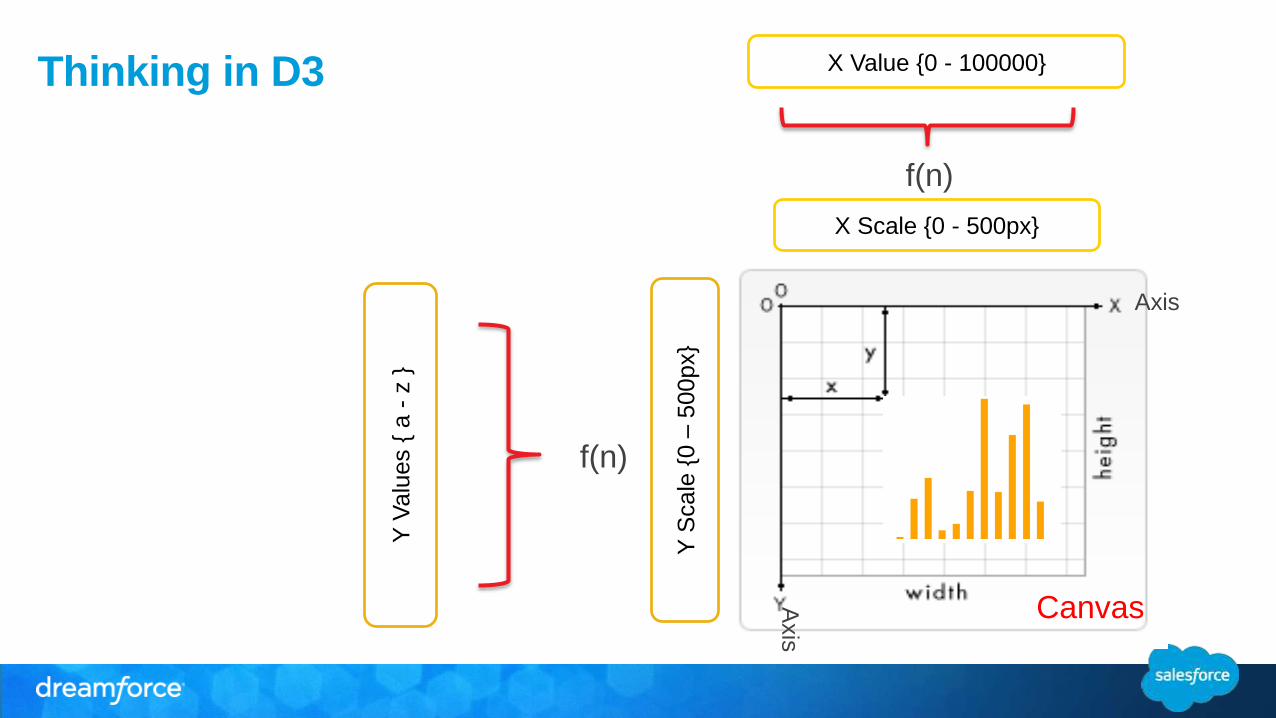
Thinking in D3
Y S
cale
{0 –
500px}
Y V
alu
es {
a -
z }
X Scale {0 - 500px}
X Value {0 - 100000}
Axis
Axis
Canvas
f(n)
f(n)
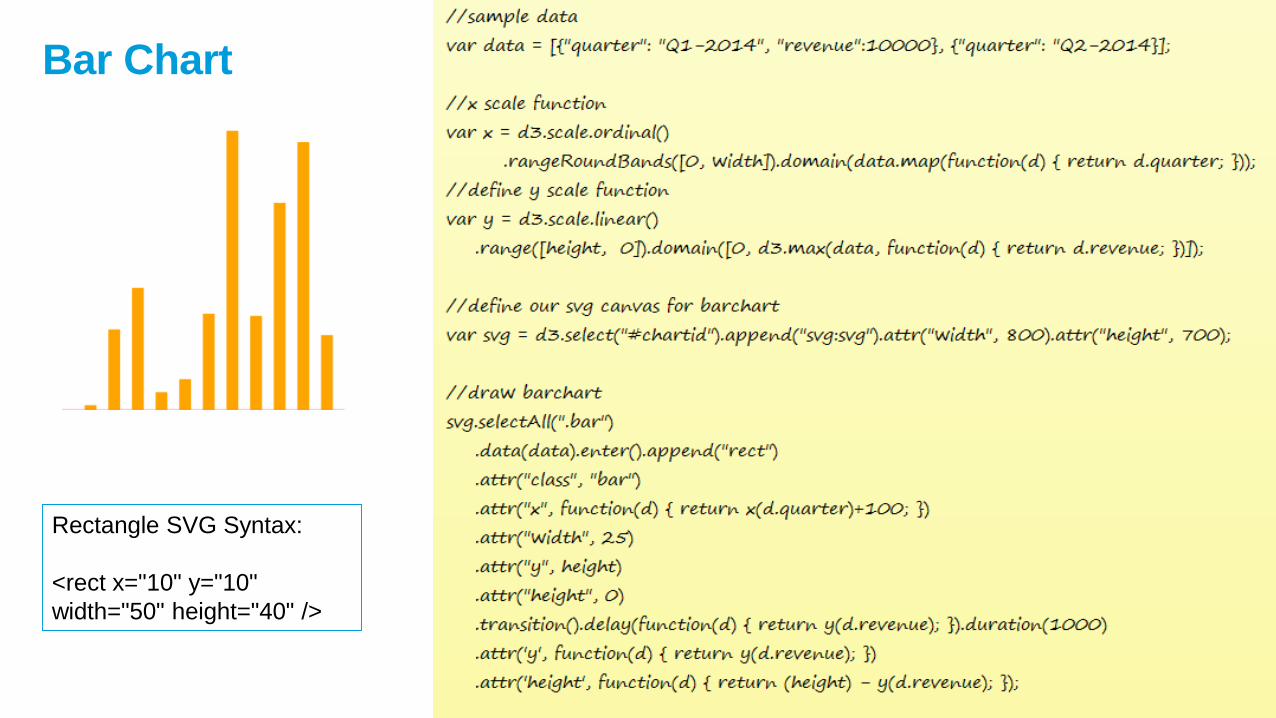
Bar Chart
Rectangle SVG Syntax:
<rect x="10" y="10"
width="50" height="40" />
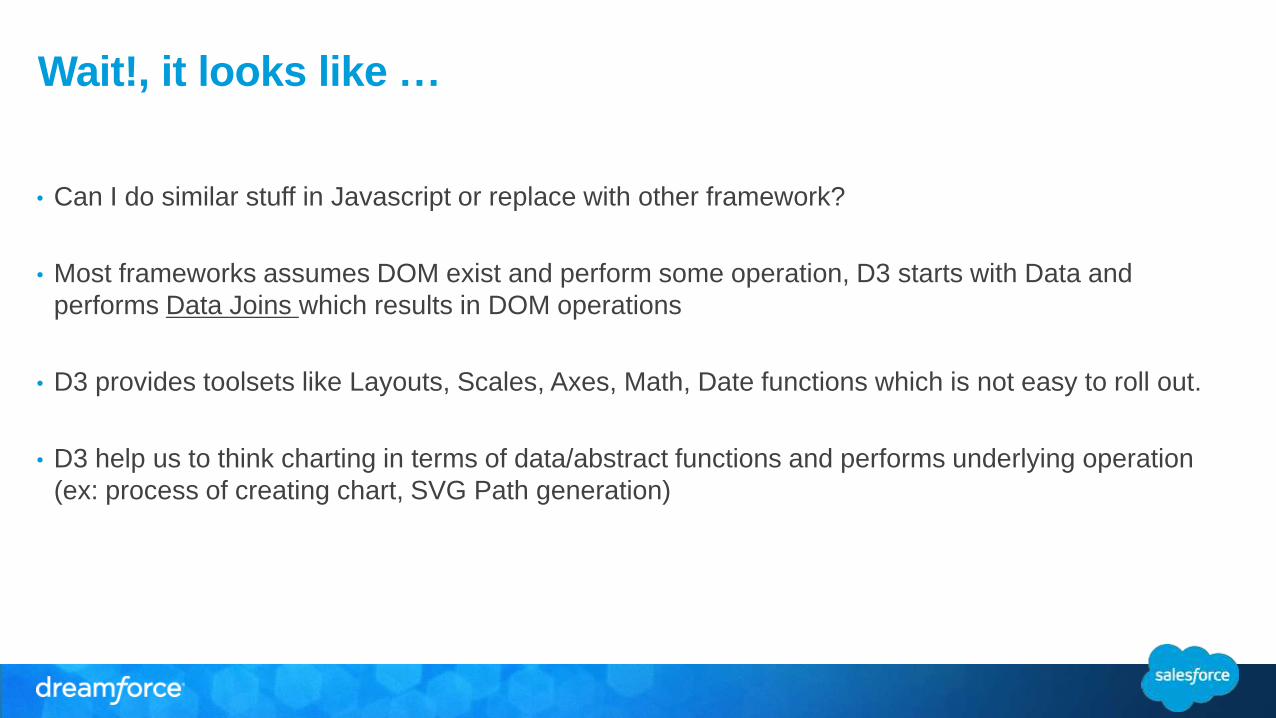
Wait!, it looks like …
• Can I do similar stuff in Javascript or replace with other framework?
• Most frameworks assumes DOM exist and perform some operation, D3 starts with Data and
performs Data Joins which results in DOM operations
• D3 provides toolsets like Layouts, Scales, Axes, Math, Date functions which is not easy to roll out.
• D3 help us to think charting in terms of data/abstract functions and performs underlying operation
(ex: process of creating chart, SVG Path generation)
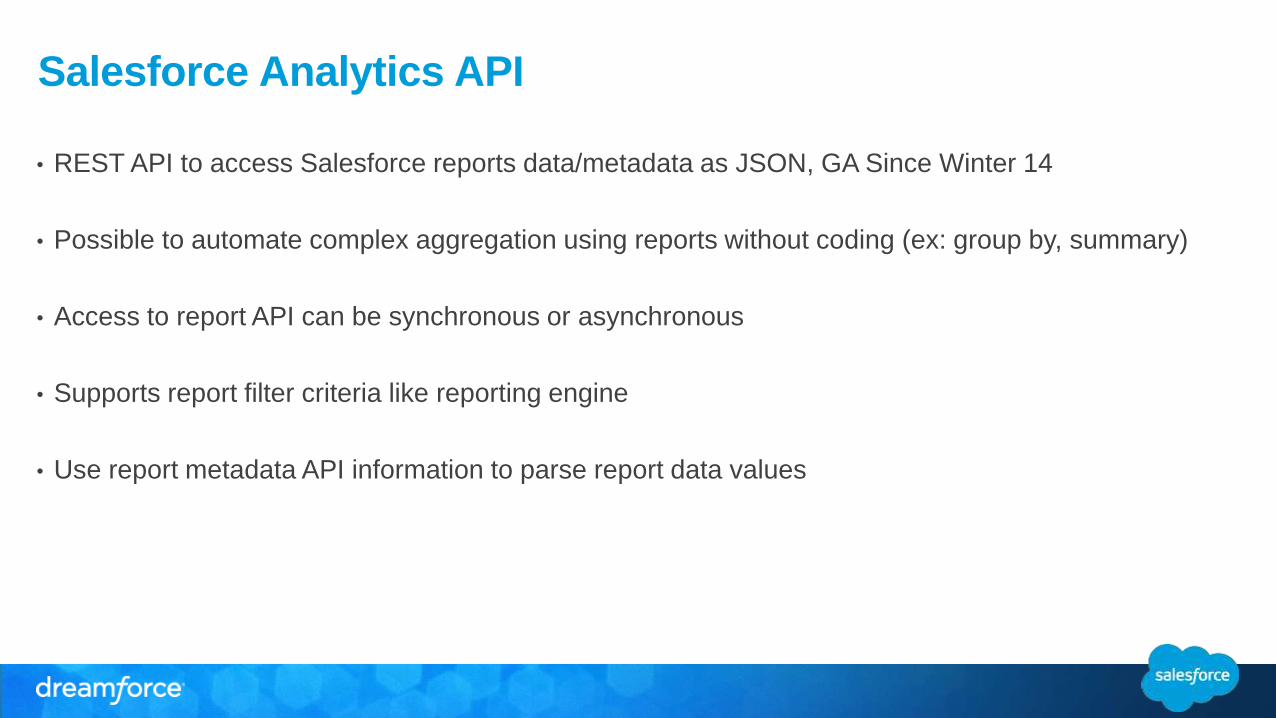
Salesforce Analytics API
• REST API to access Salesforce reports data/metadata as JSON, GA Since Winter 14
• Possible to automate complex aggregation using reports without coding (ex: group by, summary)
• Access to report API can be synchronous or asynchronous
• Supports report filter criteria like reporting engine
• Use report metadata API information to parse report data values
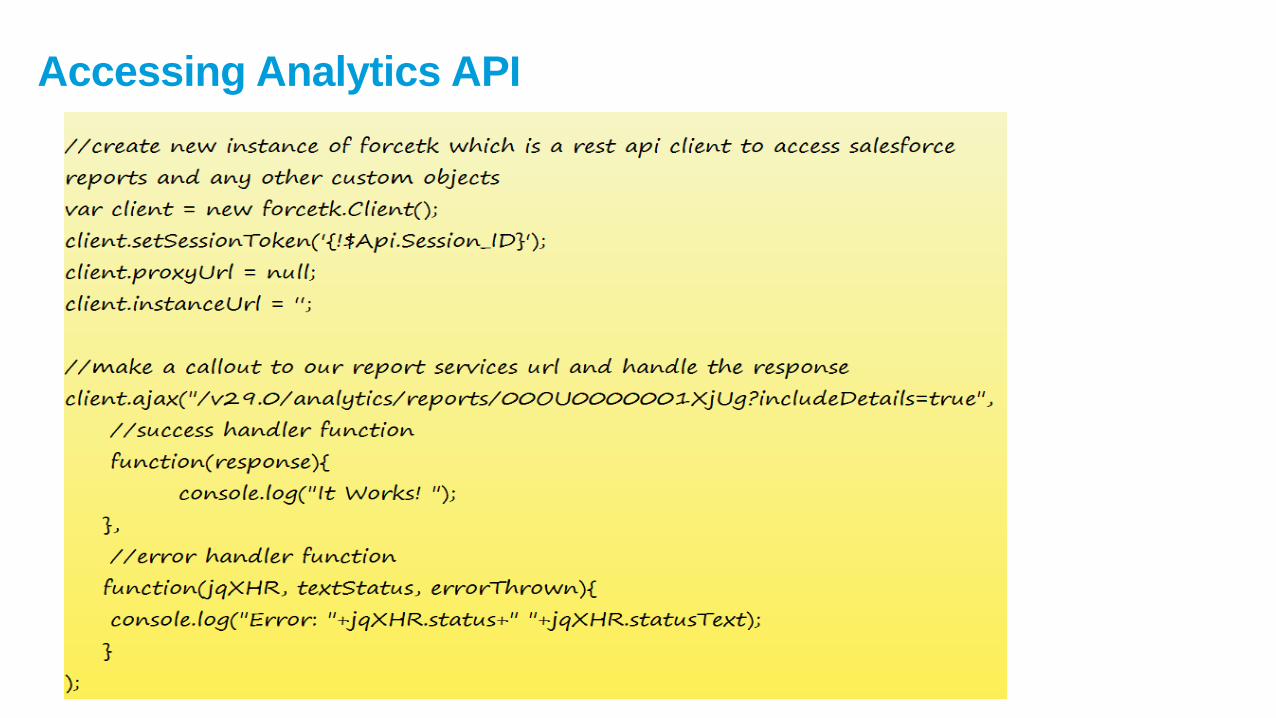
Accessing Analytics API
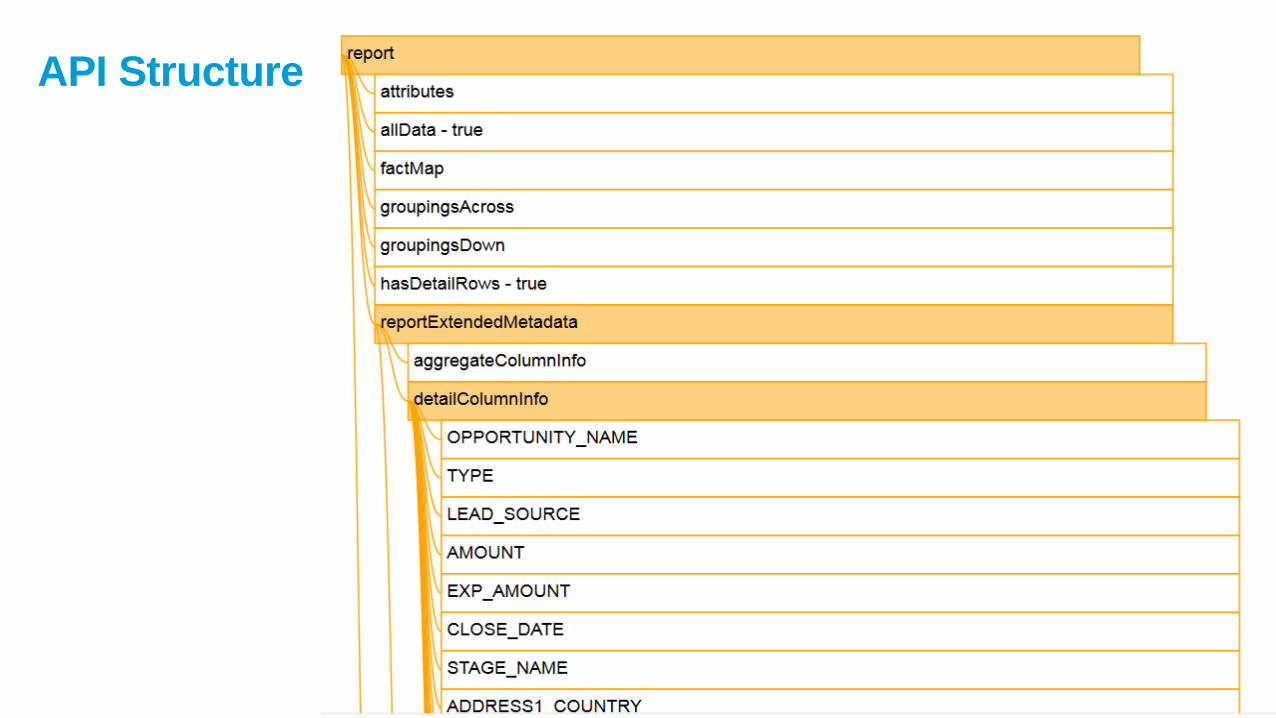
API Structure
Use to
introduce a
demo, video,
Q&A, etc. Other Demos
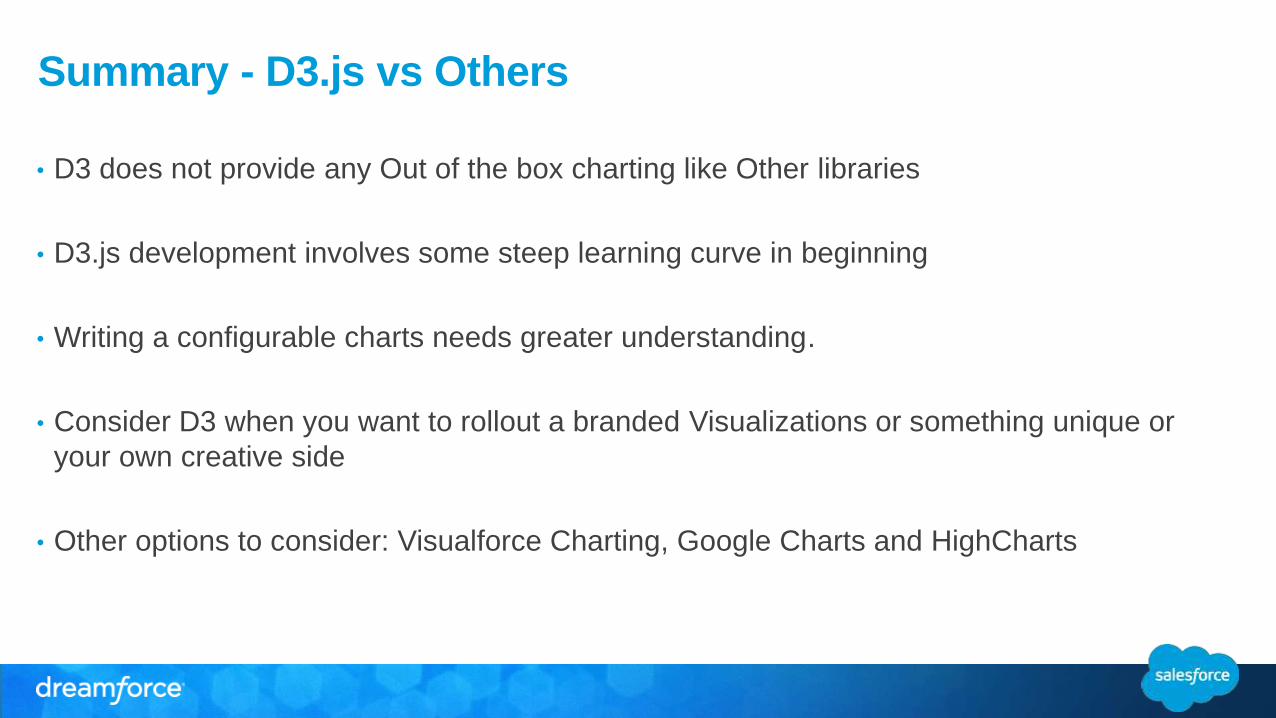
Summary - D3.js vs Others
• D3 does not provide any Out of the box charting like Other libraries
• D3.js development involves some steep learning curve in beginning
• Writing a configurable charts needs greater understanding.
• Consider D3 when you want to rollout a branded Visualizations or something unique or
your own creative side
• Other options to consider: Visualforce Charting, Google Charts and HighCharts
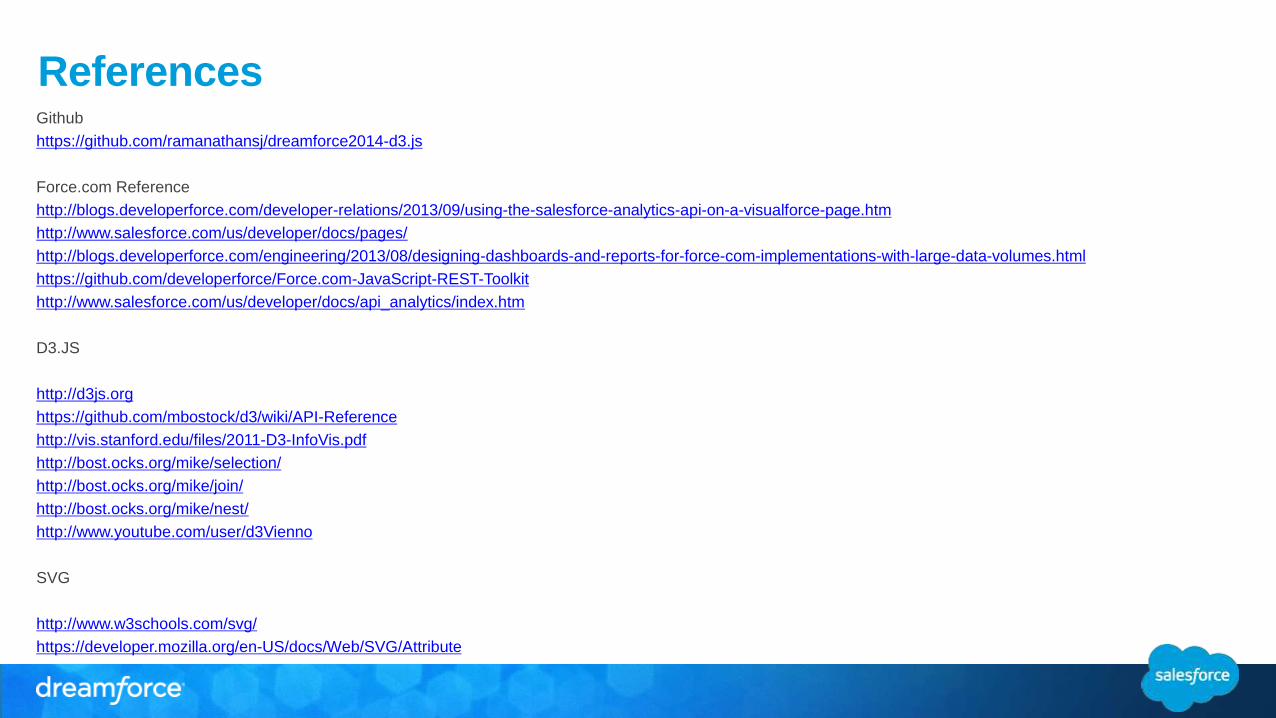
ReferencesGithub
https://github.com/ramanathansj/dreamforce2014-d3.js
Force.com Reference
http://blogs.developerforce.com/developer-relations/2013/09/using-the-salesforce-analytics-api-on-a-visualforce-page.htm
http://www.salesforce.com/us/developer/docs/pages/
http://blogs.developerforce.com/engineering/2013/08/designing-dashboards-and-reports-for-force-com-implementations-with-large-data-volumes.html
https://github.com/developerforce/Force.com-JavaScript-REST-Toolkit
http://www.salesforce.com/us/developer/docs/api_analytics/index.htm
D3.JS
http://d3js.org
https://github.com/mbostock/d3/wiki/API-Reference
http://vis.stanford.edu/files/2011-D3-InfoVis.pdf
http://bost.ocks.org/mike/selection/
http://bost.ocks.org/mike/join/
http://bost.ocks.org/mike/nest/
http://www.youtube.com/user/d3Vienno
SVG
http://www.w3schools.com/svg/
https://developer.mozilla.org/en-US/docs/Web/SVG/Attribute

Questions

Demo Screenshots
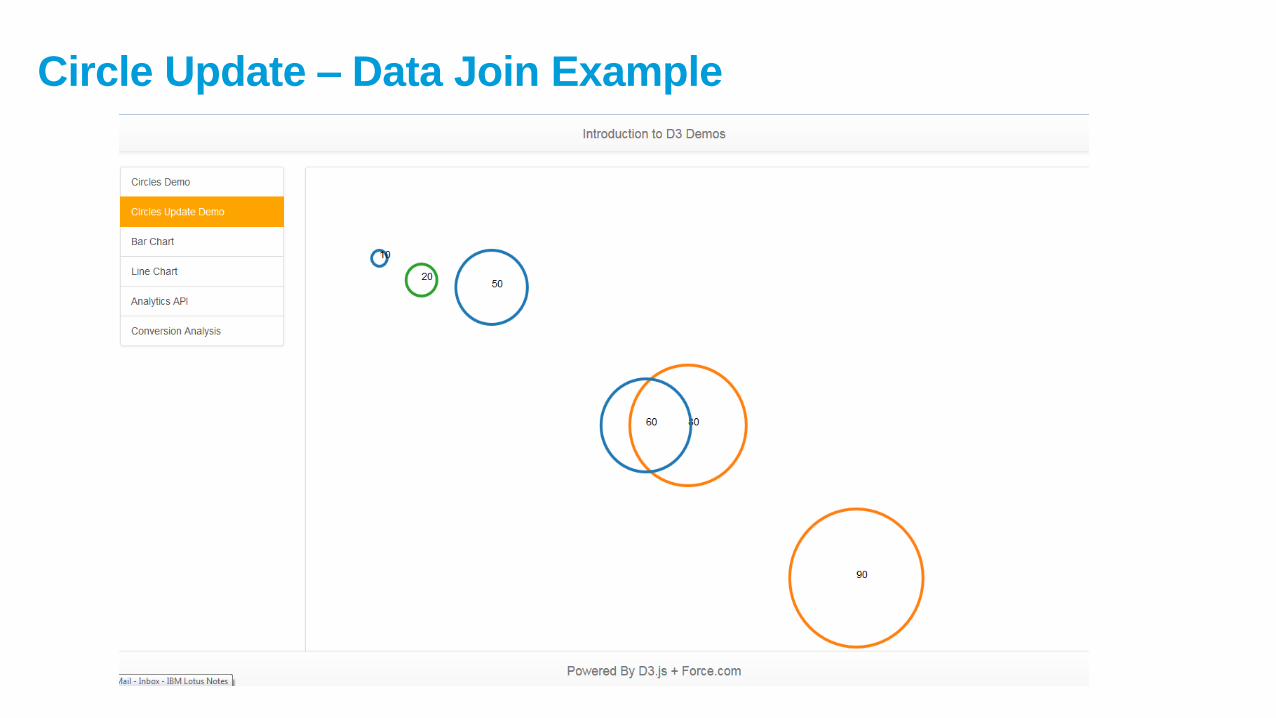
Circle Update – Data Join Example
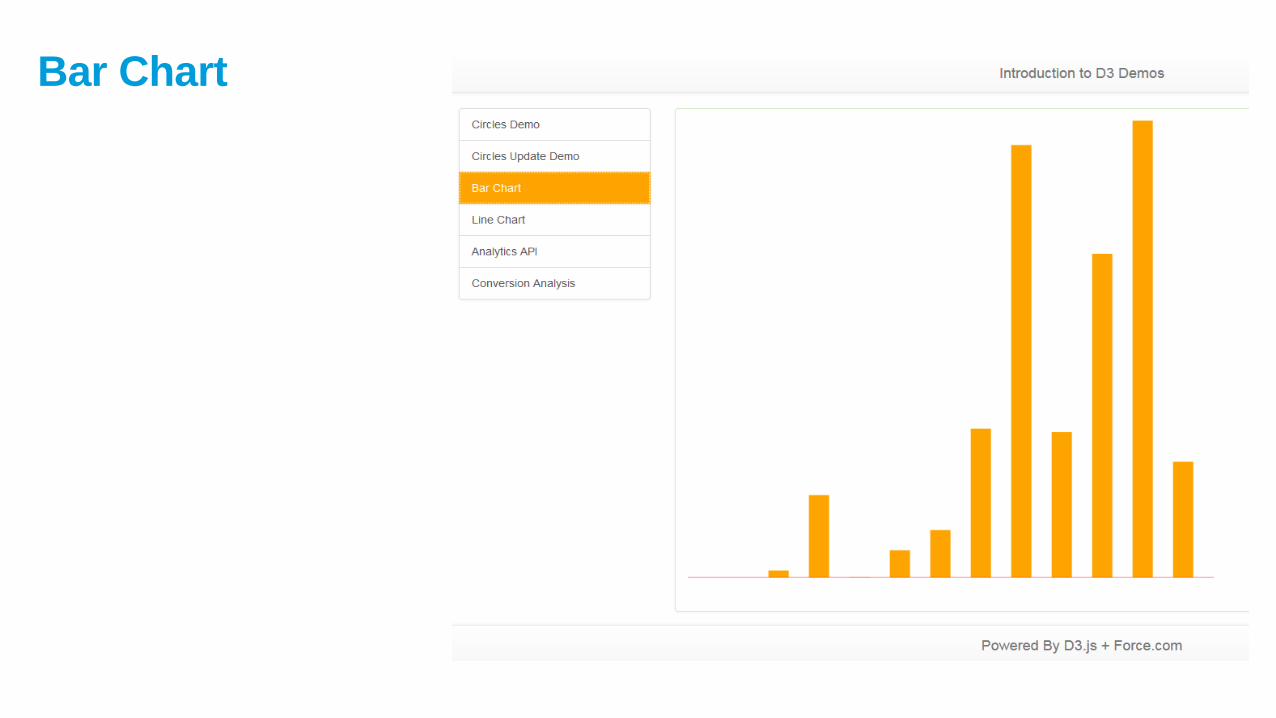
Bar Chart
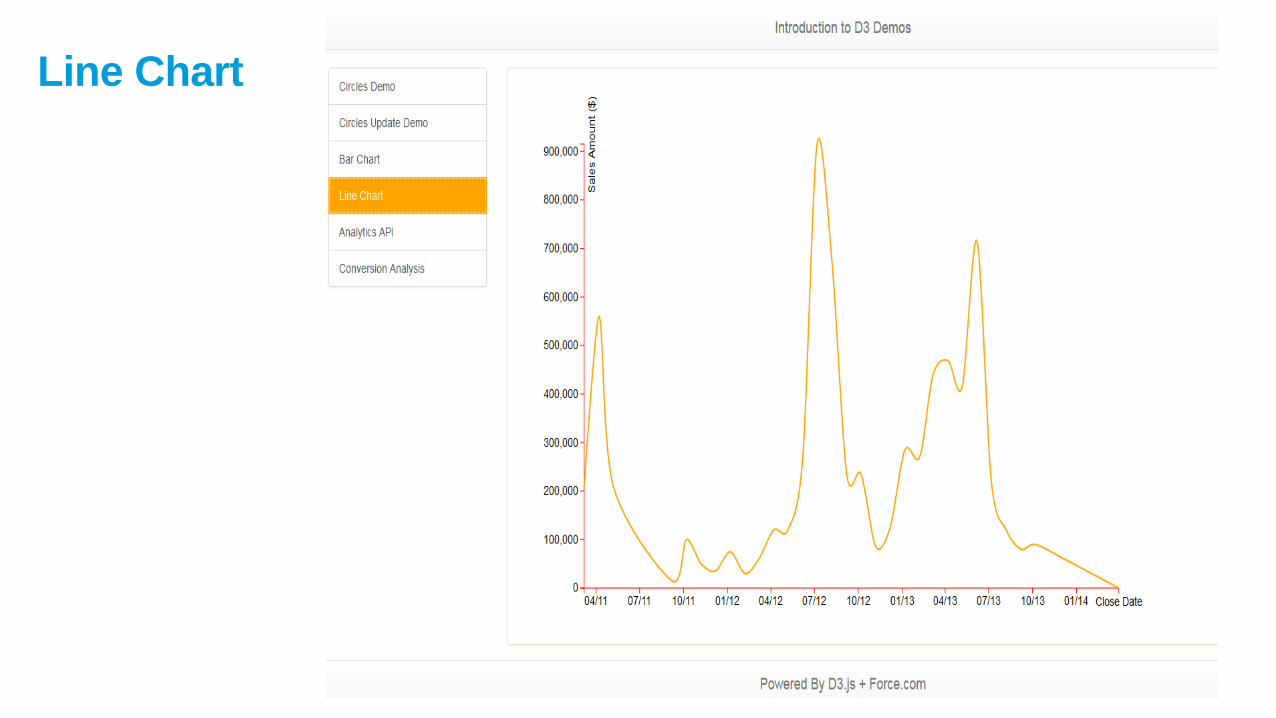
Line Chart
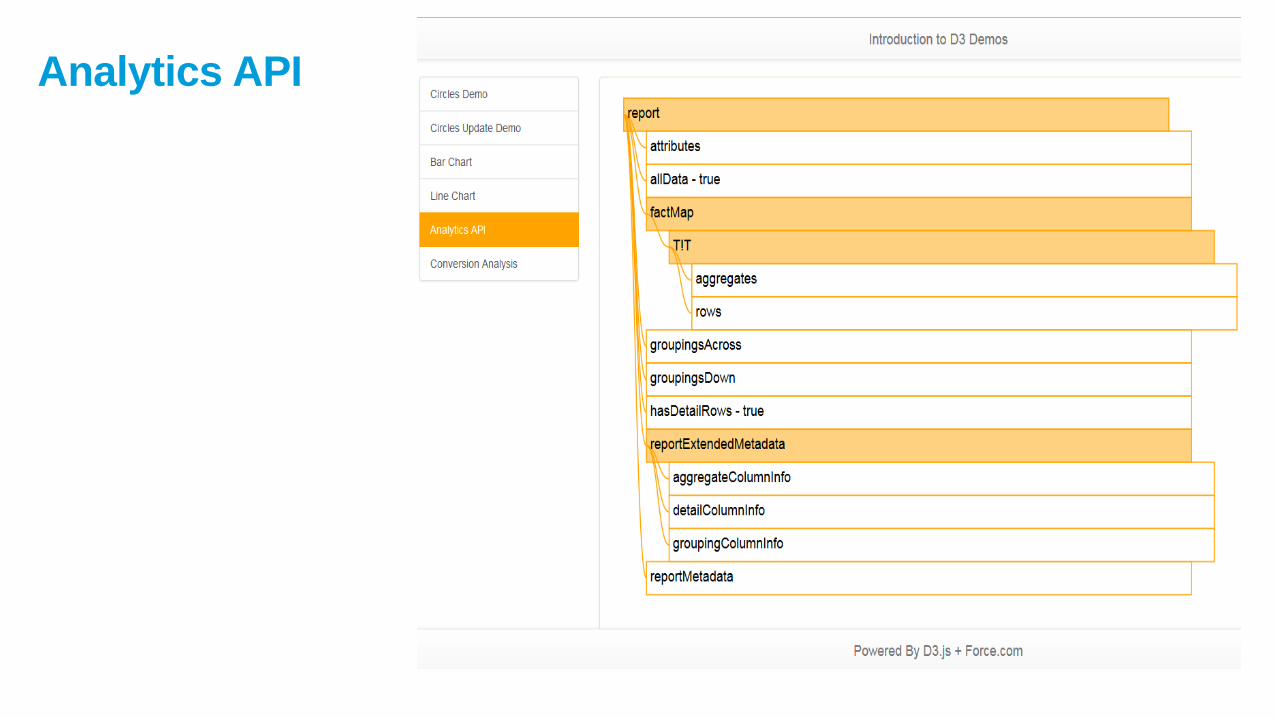
Analytics API
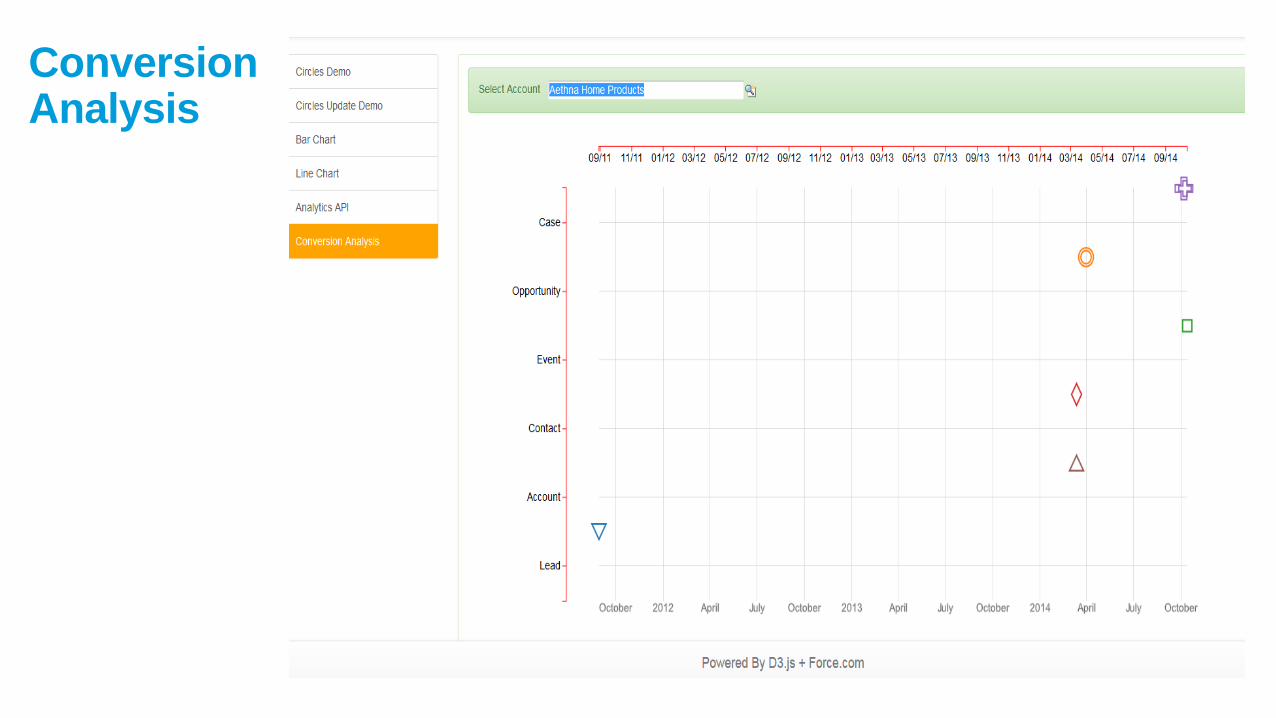
ConversionAnalysis
Recommended