Stud. Mar., 25(1): 1-20 UDK: 589.9(262.3)
1
DYNAMICS OF PHYTOPLANKTON IN BOKA KOTORSKA BAY
Dragana Drakulović1, Nenad Vuksanović1 and Danijela Joksimović1 1Institute of Marine Biology, P.O. Box 69, 85330, Kotor, Montenegro
E-mail: [email protected]
ABSTRACT
Distribution of phytoplankton and their composition were presented in
Boka Kotorska Bay, small semi-enclosed bay, situated in south-eastern part of
Adriatic Sea. Samples were taken at seven stations in the whole Boka Kotorska
Bay, on monthly interval from April to September 2010. Abundance was
higher in inner part - Kotor Bay and decreasing in outer part - Tivat Bay,
especially in the most opened part of Bay - Herceg Novi Bay. Diatoms
prevailed throughout all investigated period, with maximum in summer (1.2 x
106 cells L-1). Domination of nutrient preferred species: Thalassionema
nitzschioides, Pseudo-nitzschia spp., Leptocylindrus danicus, Nitzschia
longissima was noticed.
Due to the anticipated increase of human impact in the area, this study
can serve as a basis for future environmental studies in Boka Kotorska Bay.
Keywords: Phytoplankton distribution, Boka Kotorska Bay, South Adriatic Sea
Drakulović, D. et al.
2
INTRODUCTION
The Mediterranean Sea is an oligotrophic ecosystem (Azov, 1991), but
nowadays Mediterranean coastal ecosystems are undergoing rapid alteration
since they are under the combined pressure of climate change and human
impact (Turley, 1999; Bianchi & Morri, 2000; Béthoux et al., 2002).
The Adriatic Sea is the northernmost basin in the Mediterranean,
divided into three parts: northern, middle and southern part of Adriatic Sea.
There are many studies which are focused on hydro-chemical properties and
phytoplankton distribution and dynamics in northern Adriatic Sea (Revelante &
Gilmartin, 1976, 1980; Revelante et al. 1984, Možetić et al. 2002, Totti et al.
2005), in middle Adriatic (Caroppo et al. 1999, Totti et al. 2000) and southern
part of Adriatic Sea (Viličić et al. 1995, Jasprica & Carić, 2001).
Boka Kotorska Bay is a semi-enclosed Bay with surface area of 87.3
km2. In this Bay, especially in its inner part, anthropogenic impact has been
substantial. The Bay is not under high influx of fresh waters, except in the
period of precipitation, when streams start their activities and input of nutrients
to sea ecosystems increase.
The literature concerning phytoplankton and impact of hydrographical
conditions on phytoplankton communities in Bay is scarce.
The purpose of this study is to analyze phytoplankton assemblages and
to estimate possible changes and with all that to contribute to our knowledge of
the southern Adriatic Sea - Boka Kotorska Bay.
MATERIALS AND METHODS
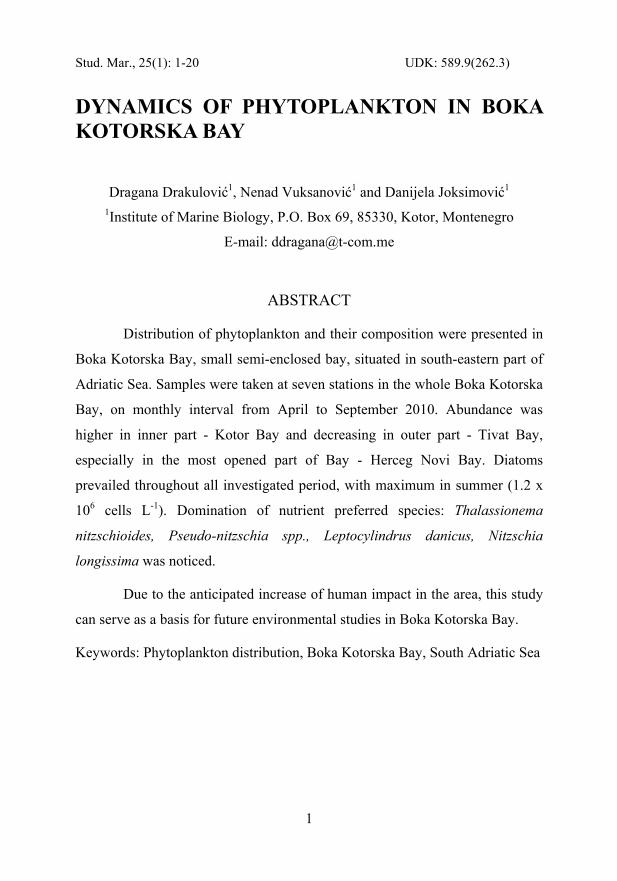
Sampling was carried out at seven stations in the whole of Boka
Kotorska Bay. It comprises three positions in Kotor Bay: IBM, Orahovac and
DYNAMICS OF PHYTOPLANKTON IN BOKA KOTORSKA BAY
3
Kotor-central position, in Risan Bay one position, in Tivat Bay two positions:
Sveta Nedelja and Tivat-central position and in Herceg -Novi Bay one position
(Fig.1.).
Water samples for analyses were collected from April 2010 to
September 2010, on a monthly basis at three depths: surface, middle and
bottom, using 5 L Niskin bottle (Hydro Bios).
Figure 1. Sampling positions (1-IBM, 2-Kotor-central, 3-Orahovac, 4- Risan, 5-Sveta
Nedelja, 6- Tivat-central, 7-Herceg Novi)
Physical parameters such as temperature, salinity and oxygen
concentration were measured in situ with universal meter (Multiline P4).
Oxygen concentrations and saturation values were determined with an oxygen
electrode (Oxy Guard Handy Gamma). Transparency was determined with a
Secchi disc (30cm).
Concentration of nitrates, nitrites and phosphates was determined in
accordance with methods proposed by Strickland and Parsons 1972.

Drakulović, D. et al.
4
Absorbances were detected on a Perkin-Elmer UV/VIS spectrophotometer
(Lambda 2), at a different wavelength for each nutrient.
Water samples for measurement of chlorophyll a were first filtered
through Whatman GF/F filters, and then the pigment was extracted in 90%
acetone. Finally, chlorophyll a concentrations were determined by measurment
of absorbances on a Perkin-Emer spectrophotometer and calculated according
to Jeffrey et al. (1997).
Samples for phytoplankton investigation were preserved in a 3%
neutralized formaldehyde solution and analyzed on a Leica DMI4000 B
inverted microscope according to Utermöhl 1958. Determination of
phytoplankton was done by using the keys for phytoplankton identification
such as: Hustedt (1959), Hasle & Sylvertsen (1997), Round et al. (1990) and
Throndsen et al. (2007).
RESULTS AND DISCUSSION
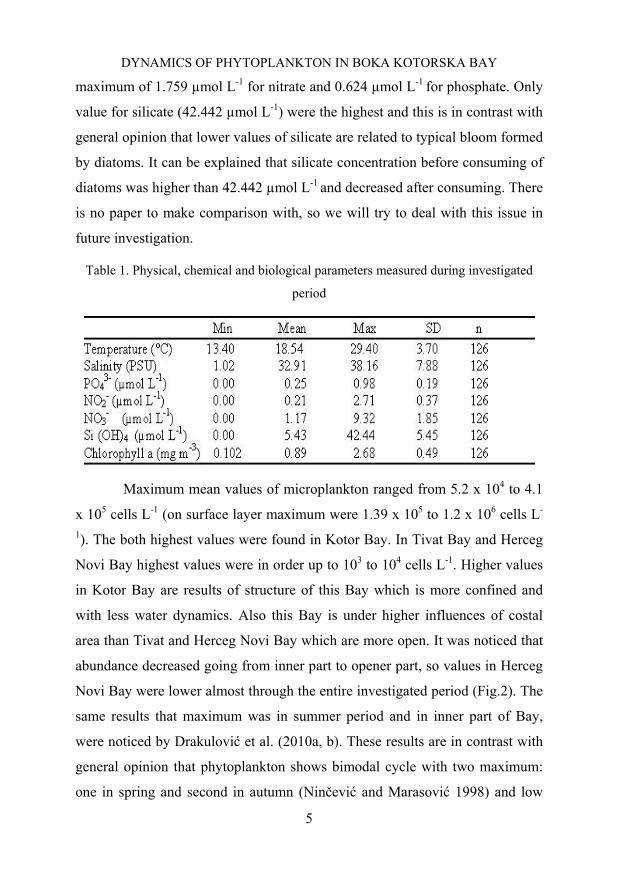
Physical parameters (temperature, salinity) varied during the
investigated period. Temperature was from 13.40 0C to 29.40 0C, while salinity
showed minimum of 1.02 PSU and maximum of 38.16 PSU (Tab. 1).
The highest nutrient concentrations (for nitrate 9.32 µmol L-1, nitrite
2.71 µmol L-1, phosphate 0.98 µmol L-1) were determined during the pre-bloom
period (May) and have been considered as the available nutrient stock.
The nutrient stock in aquatic ecosystems significantly decreases when a
phytoplankton bloom occurs, being transformed into biomass. In the same way,
nutrient availability usually limits species growth at the end of the bloom
(Howarth, 1988; Roelke et al. 1999).
Concentration of nutrients in the period of highest phytoplankton
growth were lower as a results of phytoplankton consumption and ranged from
DYNAMICS OF PHYTOPLANKTON IN BOKA KOTORSKA BAY
5
maximum of 1.759 µmol L-1 for nitrate and 0.624 µmol L-1 for phosphate. Only
value for silicate (42.442 µmol L-1) were the highest and this is in contrast with
general opinion that lower values of silicate are related to typical bloom formed
by diatoms. It can be explained that silicate concentration before consuming of
diatoms was higher than 42.442 µmol L-1 and decreased after consuming. There
is no paper to make comparison with, so we will try to deal with this issue in
future investigation.
Table 1. Physical, chemical and biological parameters measured during investigated
period
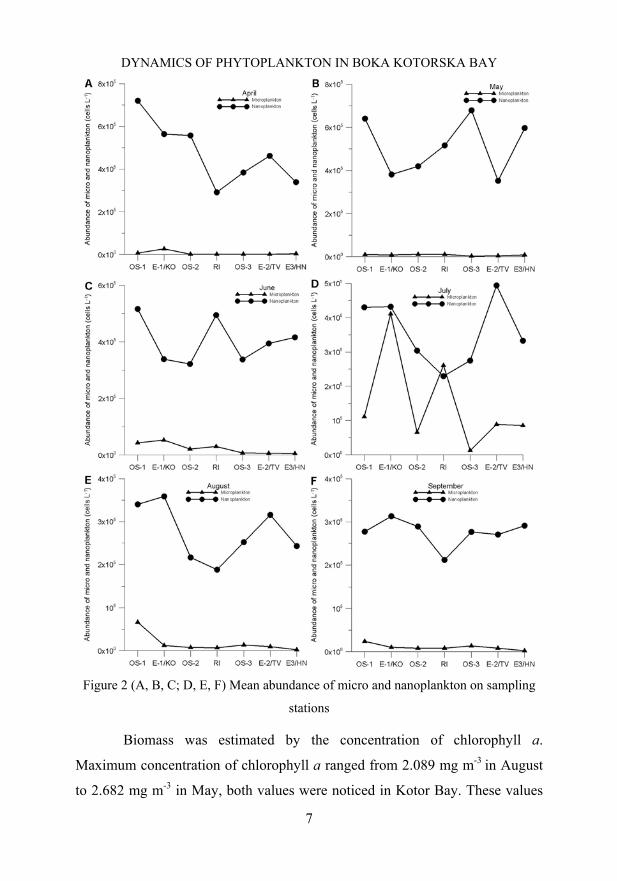
Maximum mean values of microplankton ranged from 5.2 x 10⁴ to 4.1
x 105 cells L-1 (on surface layer maximum were 1.39 x 10⁵ to 1.2 x 10⁶ cells L-
1). The both highest values were found in Kotor Bay. In Tivat Bay and Herceg
Novi Bay highest values were in order up to 103 to 104 cells L-1. Higher values
in Kotor Bay are results of structure of this Bay which is more confined and
with less water dynamics. Also this Bay is under higher influences of costal
area than Tivat and Herceg Novi Bay which are more open. It was noticed that
abundance decreased going from inner part to opener part, so values in Herceg
Novi Bay were lower almost through the entire investigated period (Fig.2). The
same results that maximum was in summer period and in inner part of Bay,
were noticed by Drakulović et al. (2010a, b). These results are in contrast with
general opinion that phytoplankton shows bimodal cycle with two maximum:
one in spring and second in autumn (Ninčević and Marasović 1998) and low
Drakulović, D. et al.
6
values in warmer period. Data noticed by Kefi et al. 2005 showed a clear
autumnal maximum, often higher than the winter-spring bloom. The autumnal
blooms are a common feature in the western Mediterranean coastal areas
(Zingone et al. 1995). It is important to emphasize that our data only comprise
six months period, so for autumn and winter we do not have data and we are
not able to compare. In summer, Kotor Bay (Krivokapić et al. 2009) was
characterized by low concentration of nutrients, high light transparency and
absence of phytoplankton blooms. These suggested summer oligotrophication,
as in other eastern Adriatic environments (Svensen et al. 2007, Viličić et al.
2008). However this is in contrast with current study, in which the highest
values were in summer, being the period of stratification. This can be explained
as a result of human impact.
Values found in this work, namely mean abundance of 104 and 105
cells L-1 coincide with data from northeastern Adriatic (Viličić et al. 2009,
Bosak et al. 2009), but are higher than values found for northeastern
Mediterranean which is classified as oligotrophic area (Balkis 2009).
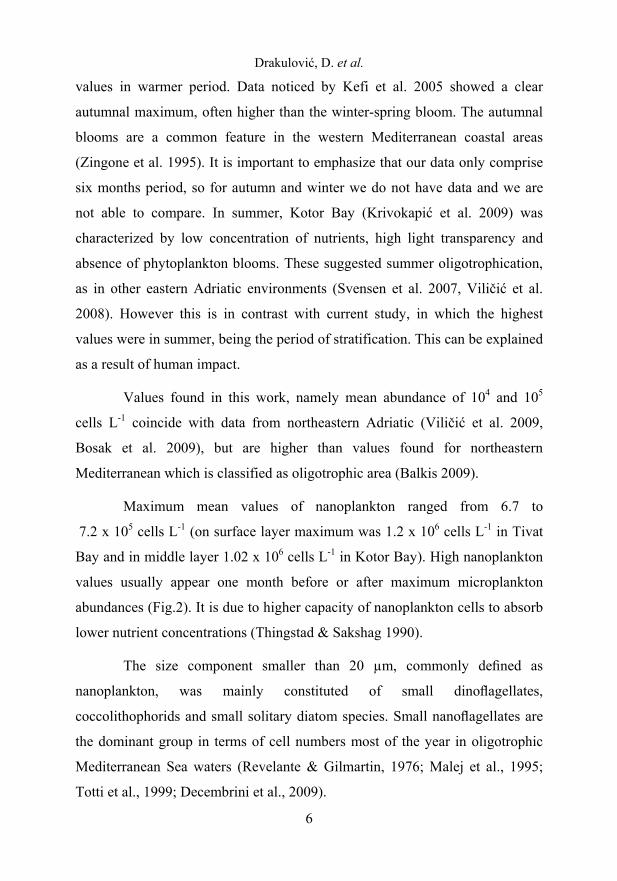
Maximum mean values of nanoplankton ranged from 6.7 to
7.2 x 10⁵ cells L-1 (on surface layer maximum was 1.2 x 10⁶ cells L-1 in Tivat
Bay and in middle layer 1.02 x 10⁶ cells L-1 in Kotor Bay). High nanoplankton
values usually appear one month before or after maximum microplankton
abundances (Fig.2). It is due to higher capacity of nanoplankton cells to absorb
lower nutrient concentrations (Thingstad & Sakshag 1990).
The size component smaller than 20 µm, commonly defined as
nanoplankton, was mainly constituted of small dinoflagellates,
coccolithophorids and small solitary diatom species. Small nanoflagellates are
the dominant group in terms of cell numbers most of the year in oligotrophic
Mediterranean Sea waters (Revelante & Gilmartin, 1976; Malej et al., 1995;
Totti et al., 1999; Decembrini et al., 2009).
DYNAMICS OF PHYTOPLANKTON IN BOKA KOTORSKA BAY
7
Figure 2 (A, B, C; D, E, F) Mean abundance of micro and nanoplankton on sampling
stations
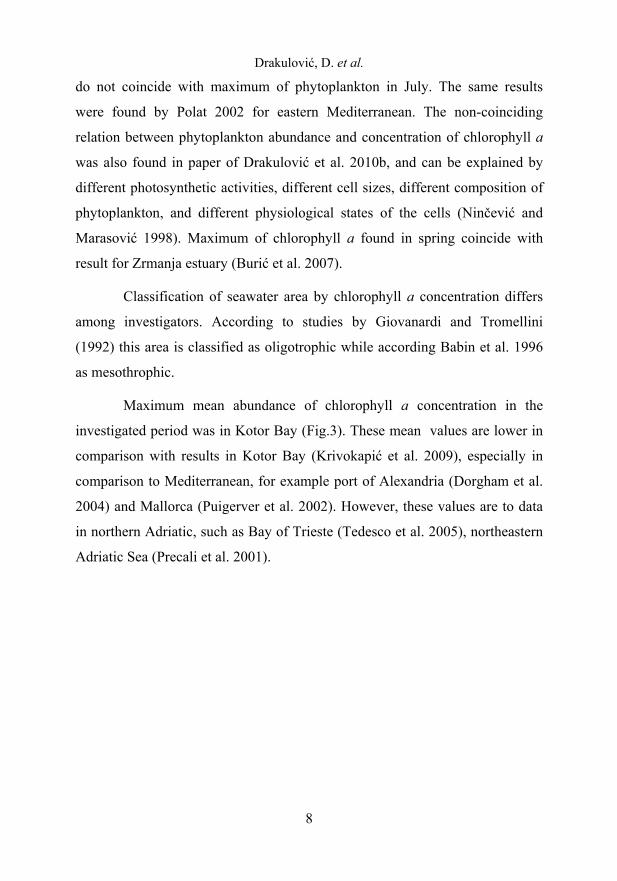
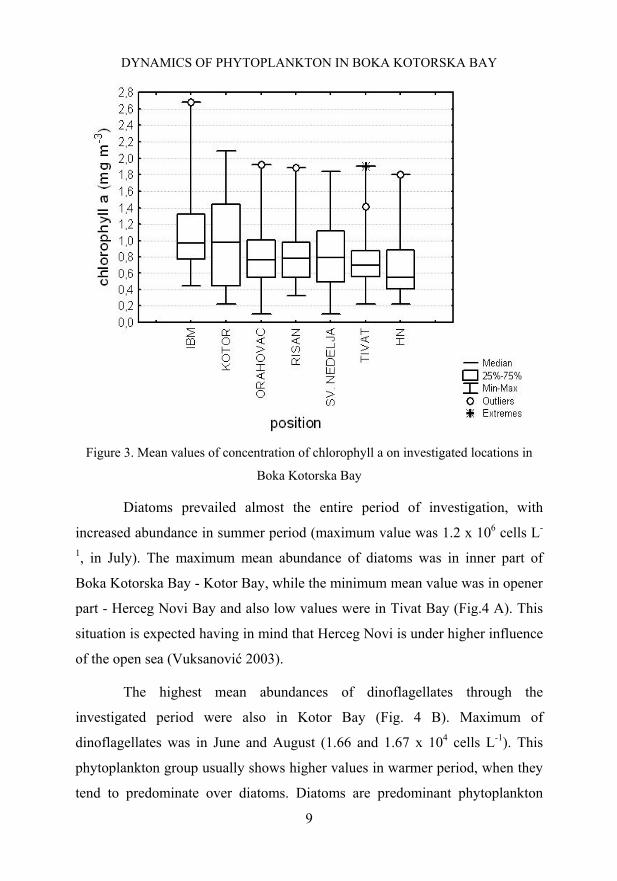
Biomass was estimated by the concentration of chlorophyll a.
Maximum concentration of chlorophyll a ranged from 2.089 mg m-3 in August
to 2.682 mg m-3 in May, both values were noticed in Kotor Bay. These values
Drakulović, D. et al.
8
do not coincide with maximum of phytoplankton in July. The same results
were found by Polat 2002 for eastern Mediterranean. The non-coinciding
relation between phytoplankton abundance and concentration of chlorophyll a
was also found in paper of Drakulović et al. 2010b, and can be explained by
different photosynthetic activities, different cell sizes, different composition of
phytoplankton, and different physiological states of the cells (Ninčević and
Marasović 1998). Maximum of chlorophyll a found in spring coincide with
result for Zrmanja estuary (Burić et al. 2007).
Classification of seawater area by chlorophyll a concentration differs
among investigators. According to studies by Giovanardi and Tromellini
(1992) this area is classified as oligotrophic while according Babin et al. 1996
as mesothrophic.
Maximum mean abundance of chlorophyll a concentration in the
investigated period was in Kotor Bay (Fig.3). These mean values are lower in
comparison with results in Kotor Bay (Krivokapić et al. 2009), especially in
comparison to Mediterranean, for example port of Alexandria (Dorgham et al.
2004) and Mallorca (Puigerver et al. 2002). However, these values are to data
in northern Adriatic, such as Bay of Trieste (Tedesco et al. 2005), northeastern
Adriatic Sea (Precali et al. 2001).
DYNAMICS OF PHYTOPLANKTON IN BOKA KOTORSKA BAY
9
Figure 3. Mean values of concentration of chlorophyll a on investigated locations in
Boka Kotorska Bay
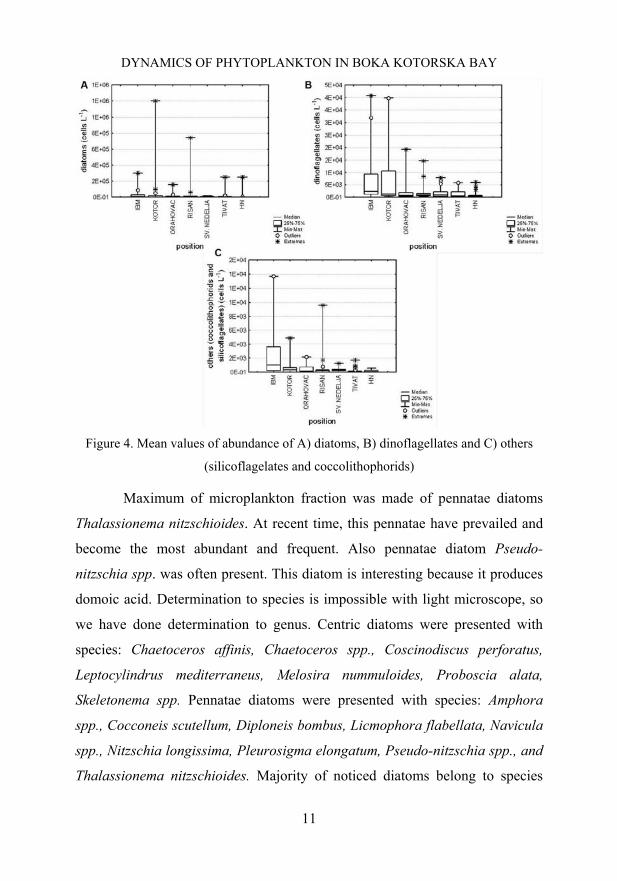
Diatoms prevailed almost the entire period of investigation, with
increased abundance in summer period (maximum value was 1.2 x 10⁶ cells L-
1, in July). The maximum mean abundance of diatoms was in inner part of
Boka Kotorska Bay - Kotor Bay, while the minimum mean value was in opener
part - Herceg Novi Bay and also low values were in Tivat Bay (Fig.4 A). This
situation is expected having in mind that Herceg Novi is under higher influence
of the open sea (Vuksanović 2003).
The highest mean abundances of dinoflagellates through the
investigated period were also in Kotor Bay (Fig. 4 B). Maximum of
dinoflagellates was in June and August (1.66 and 1.67 x 10⁴ cells L-1). This
phytoplankton group usually shows higher values in warmer period, when they
tend to predominate over diatoms. Diatoms are predominant phytoplankton
Drakulović, D. et al.
10
group most of the year, while dinoflagellates prevail only in oligotrophic
conditions, in summer period (Bernardi Aubry et al. 2004). In this study
diatoms prevailed over dinoflagellates the entire period of investigation
especially in summer when we noticed diatoms bloom which is in correlation
with findings of Drakulović et al. 2010b, at the same area. This results from the
increased input of nutrients which provide high phytoplankton growth in
summer stratification period.
As for other groups (silicoflagellates, coccolithophorids and
euglenophyta), maximum mean abundance was in Kotor Bay (Fig.4 C). The
maximum mean abundance of this fraction was 5.468 x 10³ cells L-1 (maximum
was on surface 1.3 x 10⁴ cells L-1 in August). This peak was made mostly of
coccolithophorids which dominate on other groups during the investigated
period. Silicoflagellates prefer colder period, so we cannot make comparison
because our investigation did not comprise colder period. We can only say that
in the period that we investigated abundance of silicoflagellates was low.
DYNAMICS OF PHYTOPLANKTON IN BOKA KOTORSKA BAY
11
Figure 4. Mean values of abundance of A) diatoms, B) dinoflagellates and C) others
(silicoflagelates and coccolithophorids)
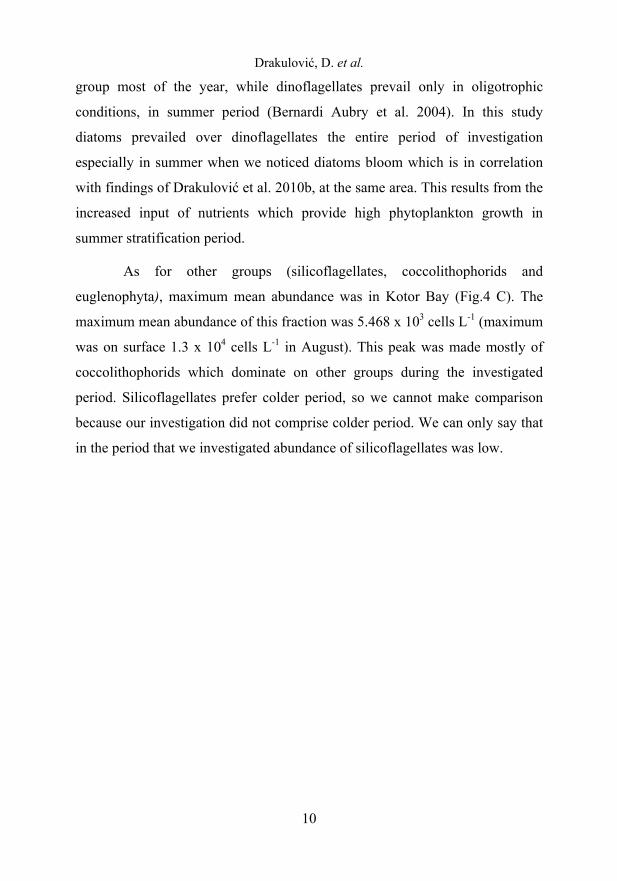
Maximum of microplankton fraction was made of pennatae diatoms
Thalassionema nitzschioides. At recent time, this pennatae have prevailed and
become the most abundant and frequent. Also pennatae diatom Pseudo-
nitzschia spp. was often present. This diatom is interesting because it produces
domoic acid. Determination to species is impossible with light microscope, so
we have done determination to genus. Centric diatoms were presented with
species: Chaetoceros affinis, Chaetoceros spp., Coscinodiscus perforatus,
Leptocylindrus mediterraneus, Melosira nummuloides, Proboscia alata,
Skeletonema spp. Pennatae diatoms were presented with species: Amphora
spp., Cocconeis scutellum, Diploneis bombus, Licmophora flabellata, Navicula
spp., Nitzschia longissima, Pleurosigma elongatum, Pseudo-nitzschia spp., and
Thalassionema nitzschioides. Majority of noticed diatoms belong to species
Drakulović, D. et al.
12
which grow better in area rich with nutrients (Pucher-Petković and Marasović
1980).
Cloern (2001) indicated that changes from oligotrophic to eutrophic
conditions lead to changes in the species composition and food web and he
emphasised the importance and usefulness of the above mentioned indicators as
tools for assessment of the eutrophication status
Dinoflagellates were presented with some frequent species such as:
Ceratium furca, Ceratium fusus, Dinophysis acuminata, Dinophysis fortii,
Gonyaulax spp., Gyrodinium fusiforme, Gymnodinium spp, Prorocentrum
micans, Prorocentrum minimum, Protoperidinium diabolus, Protoperidinium
globulum, Protoperidinium spp., Scrippsiella sp.
Toxic dinoflagellates (e.g. Dinophysis fortii) were also noticed.
However their concentration was not so high to become harmful for the
environment or human health.
Among coccolithophorids the most frequent were species
Calyptosphaera oblonga, Helicosphaera walichii, Rhabosphaera tignifera,
Syracosphaera pulchra. Silicoflagellates were presented with species Dictyocha
fibula.
The dendrogram for different ecological parameters by months showed
the highest similarity between salinity and temperature on one side which and
between nutrient concentration and chlorophyll a on the other side. The highest
similarity between salinity and temperature was expected because both
parameters depend of weather conditions. On the other hand, concentration of
chlorophyll a depends on nutrient concentration (Fig.5.)

DYNAMICS OF PHYTOPLANKTON IN BOKA KOTORSKA BAY
13
Figure 5. Tree diagram for different parameters in different months (complete linkage
Euclidean distance).
CONCLUSION
Considering the results mentioned above, namely abundance of 106
cells L-1 and presence of nutrients preferred species, it is obvious that this area
is exposed to increased human impact. This impact is higher in the inner part of
Boka Kotorska Bay as in the outer part of the Bay is lower as a result of the
influence of the open sea.
Drakulović, D. et al.
14
REFERENCES
Azov, Y. (1991): Eastern Mediterranean — a marine desert? Mar. Pollut.Bull.,
23, 225–232.
Babin, M., A. Morel, H. Claustre, A. Bricaud, Z., Kolber and P.G. Falkowski
(1996): Nitrogen-and irradiance-dependent variations of the maximum
quantum yield of carbon fixation in eutrophic, mesotrophic and
oligotrophic marine systems. Deep-Sea Res., 43, 1241–1272.
Balkis, N. (2009): Seasonal variations of microphytoplankton assemblages and
environmental variables in the coastal zone of Bozcaada Island in the
Aegean Sea (NE Mediterranean Sea). Microphytoplankton and
environmental variables of Bozcaada Island. Aquat Ecol (2009)
43:249–270.
Bianchi, C.N., C. Morri (2000): Marine biodiversity of the Mediterranean Sea:
situation, problems and prospects for future research. Marine Pollution
Bulletin, 40: 367-376.
Bethoux, J. P., P. Morin and D. P. Ruiz-Pino (2002): Temporal trends in
nutrient ratios: chemical evidence of Mediterranean ecosystem changes
driven by human activity. Deep-Sea Research II, 49: 2007-2016.
Bernardi Aubry, F., A. Berton, M. Bastianini, G. Socal and F. Acri (2004):
Phytoplankton succession in a coastal area of the NW Adriatic, over a
10-year sampling period (1990–1999). Continental Shelf Research 24,
97–115.
Bosak, S., Z. Burić, T. Đakovac and D. Viličić (2009): Seasonal distribution of
plankton diatoms in Lim Bay, northern Adriatic Sea. Acta Bot. Croat.
68 (2): 351–365.
DYNAMICS OF PHYTOPLANKTON IN BOKA KOTORSKA BAY
15
Burić, Z., I. Cetinić, D. Viličić, K. Caput Mihalić, M. Carić and G. Olujić
(2007): Spatial and temporal distribution in a highly stratified estuary
(Zrmanja, Adriatic Sea). Mar. Ecol. 28: 169–177.
Caroppo,C., A. Fiocca, P. Sammarco and G. Magazzu (1999): Seasonal
variations of nutrients and phytoplankton in the coastal SW Adriatic
Sea (1995–1997). Botanica Marina, 42, 389–400.
Cloern, J.E. (2001): Our evolving conceptual model of the coastal
eutrophication problem. Mar. Ecol. Prog. Ser., 210, 223– 253.
Dali Yahia-Kefi, O., Souissi, S., Gomez, F. and M. N. Daly-Yahia (2002):
Spatio-temporal distribution of the dominant Diatom and
Dinoflagellate species in the Bay of Tunis (SW Mediterranean Sea).
Medit. Mar. Sci., 6/1, 2005, 17-34.
Decembrini, F., C. Caroppo and M. Azzaro (2009): Size structure and
production of phytoplankton community and carbon pathways
channelling in the Southern Tyrrhenian Sea (Western Mediterranean),
Deep-Sea Res. Pt. II, 56, 687–699.
Dorgham, M., N. E. Abdel-Aziz, K. Z. El-Deeb and M. A. Okbah (2004):
Eutrophication problems in the Western Harbour of Alexandria, Egypt.
Oceanologia 46: 25–44.
Drakulović, D., N. Vuksanović, S. Krivokapić and B. Pestorić (2010a):
Phytoplankton Community as indicator of Eutrophication in the Boka
Kotorska Bay,
http://balwois.com/balwois/administration/full_paper/ffp-1697.pdf
(19.12.2010).

Drakulović, D. et al.
16
Drakulović, D and N. Vuksanović (2010b): Phytoplankton assemblages and
density in the Montenegrin coastal sea. Rapp. Comm. Int. mer Médit.
(CIESM), 39: pp.351.
Giovanardi, F., E. Tromellini (1992): Statistical assessment of trophic
conditions. Application of the OECD methodology to the marine
environment. Sci. Total Environ. Suppl., 211– 233.
Hasle, G. R. and E. E. Syvertsen (1997): Marine diatoms. In: Tomas, C.R.
(ed.), Identifying marine diatoms and dinoflagellates. Academic Press,
San Diego. pp. 5–385.
Howarth, R. W. (1988): Nutrient limitation of net primary production in marine
ecosystems. Annual Review of Ecology and Systematic, 19, 89–110.
Hustedt, F. (1959): Die Kieselalgen Deutschlands, Österreichs und der
Schweitz. Otto Koeltz, Scientific Publishing, Koenigstein.
Jasprica, N., M. Carić (2001): Planktonic diatoms and their relation to
environmental factors at three stations in the Southern Adriatic,
Mediterranean Sea. In: Lange-Bertalot-Festschrift: Studies on Diatoms
(R. Jahn, J.P. Kociolek, A. Witkowski & P. Compere, eds), 513-536.
Gantner, Ruggell. Berlin.
Jeffrey, S. W., R. F. C. Mantoura and S. W. Wright (1997): Phytoplankton
pigments in Oceanography. UNESCO, Paris.
Krivokapić, S., N. Vuksanović and Ž. Stanković (2009): Seasonal variation of
phytoplankton biomass and environmental conditions in the inner Boka
Kotorska Bay (eastern Adriatic Sea). Acta Bot. Croat. 68 (1): 45–55.
Malej, A., P. Mozetić, V. Malacic, S. Terzić and M. Ahel (995): Phytoplankton
responses to freshwater inputs in a small semi-enclosed gulf (Gulf of
Trieste, Adriatic Sea), Mar. Ecol.-Prog. Ser., 120, 111–121.
DYNAMICS OF PHYTOPLANKTON IN BOKA KOTORSKA BAY
17
Možetić, P., S. Fonda Umani and L. Kamburska (2002): Plankton Variability in
the Gulf of Trieste (Northern Adriatic). Archo Oceanogr. Limnol. 23,
7-19, Istituto di Biologia del Mare, Venezia, Italia
Ninčević Ž. and I. Marasović (1998): Chlorophyll a and primary production of
size fractionated phytoplankton in the middle Adriatic Sea. Rapp.
Comm. Int. mer Médit. (CIESM), 35: 472–473.
Polat, S. (2002): Nutrients, Chlorophyll a and Phytoplankton in the Iskenderun
Bay (Northeastern Mediterranean). Mar. Ecol. 23(2): 115–126.
Precali, R., T. Daković, N. Smodlaka and I. Ivančić (2001): Long-term changes
of nutrient concentration and phytoplankton biomass in the Northern
Adriatic Sea. Rapp. Comm. Int mer Medit. 36: 156.
Pucher-Petković, T., I. Marasović (1980): Développement des populations
phytoplanctoniques caractéristiques pour un milieu eutrophisé (Baie de
Kaštela). Acta Adriatica, 21, 79–93.
Puigserver M., G. Ramon, G. Moýa and A. Martỉnez-Taberner (2002):
Planktonic chlorophyll a and eutrophication in two Mediterranean
littoral system (Mallorca Island, Spain). Hydrobiologia 475/476: 493–
503.
Revelante, N., M. Gilmartin (1976): Temporal succession of the phytoplankton
in the northern Adriatic. Netherlands Journal of Sea Research 10, 377–
396.
Revelante, N and M. Gilmatin (1980): Microplankton diversity indices as
indicators of eutrophication in the northern Adriatic Sea.
Hydrobiologia 70, 277–286.
Revelante, N., W. T. Williams and M. Gilmartin (1984): A numerical
assessment of the temporal and spatial distribution of phytoplankton
Drakulović, D. et al.
18
assemblages in the northern Adriatic Sea. Journal of the Experimental
Marine Biology and Ecology 77, 137–150.
Roelke, D. L., P. M. Eldridge and L. A. Cifuentes (1999): A model of
phytoplankton competition for limiting and nonlimiting nutrients:
implications for development of estuarine and nearshore management
schemes. Estuaries, 22, 92–104.
Round, F.E., R. M. Crawford and D. G. Mann (1990): The diatoms. Biology
and morphology of the genera. Cambridge University Press,
Cambridge.
Svensen, C., D. Viličić, P. Wassmann, E. Arashkevich and T. Ratkova (2007):
Plankton distribution and vertical flux of biogenic matter during high
summer stratification in the Krka estuary (Eastern Adriatic). Estuar.
Coast. Shelf Sci. 71: 381–390.
Throndsen, J., G. R. Hasle and K. Tangen (2007): Phytoplankton of Norwegian
coastal waters. Almater Forlag As, Oslo.
Tedesco, L., G. Socal, F, Bianchii, F. Acri, D. Veneri and M. Vichi (2007):
NW Adriatic Sea variability in relation to chlorophyll-a dynamics in
the last 20 years (1986-2005). Biogeosci. 4: 651–685.
Thingstad, T. F. and E. Sakshaug (1990): Control of phytoplankton growth in
nutrient recycling ecosystems. Theory and terminology. Mar. Ecol.
Prog. Ser. 63, 261-272.
Turley, C.M. (1999): The changing Mediterranean Sea - a sensitive ecosystem?
Progress in Oceanography, 44: 387-400.
Totti, C., A. Ghetti, R. Pariante and T. Hopkins (1999): Biological coherence in
the Western Adriatic Coastal Current: phytoplankton assemblages, in:
The Adriatic Sea (EUR 18834), edited by: Hopkins, T., Artegiani, A.,
DYNAMICS OF PHYTOPLANKTON IN BOKA KOTORSKA BAY
19
Cauwet, G., Degobbis, D., and Malej, A., Ecosystems Research
Report, vol. 32, 385–400, Portonovo (Ancona), Italy.
Totti,C., G. Civitarese, F. Acri, D. Barletta, G. Candelari,E. Paschini and A.
Solazzi (2000): Seasonal variability of phytoplankton populations in
the middle Adriatic sub-basin. Journal of Plankton Research 22, 1735–
1756.
Totti, C., M. Cangini, C. Ferrari, R. Kraus, M. Pompei, A. Pugnetti, T.
Romagnoli, S. Vanucci and G. Socal (2005): Phytoplankton size
distribution and community structure in relation tomucilage occurrence
in the northern Adriatic Sea. Science of the Total Environment 353,
204–217.
Utermöhl, H. (1958): Zur Vervollkommung der quantitativen Phytoplankton
Methodik, Mitt. Int. Ver.Theor. Angew. Limnol. 9: 1–38.
Viličić, D., N. Leder, Z Gržetić, N. Jasprica (1995): Microphytoplankton in the
Strait of Otranto (eastern Mediterranean). Marine Biology 123, 619–
630.
Viličić, D., S. Terzić, M. Ahel, Z. Burić, N. Jasprica, M. Carić, K. Caput-
Mihalić and G. Olujić (2008): Phytoplankton abundance and pigment
biomarkers in the oligo-trophic eastern Adriatic estuary. Environ.
Monit. and Assess. 142: 199–218.
Viličić, D., T. Đakovac, Z. Burić and S. Bosak (2009): Composition and annual
cycle of phytoplankton assemblages in the northeastern Adriatic Sea.
Botanica Marina 52, 291–305.
Vuksanović, N. (2003): Procjena količine fitoplanktona u području
Crnogorskog primorja kao posljedica eutrofikacije. »Zaštita voda
2003« Zbornik radova, 383-385.

Drakulović, D. et al.
20
Zingone, A., R. Casotti, M. Riverad’Alcala, M., Scardi and D. Marino (1995):
St Martin’s summer: the case of an autumn phytoplankton bloom in the
Gulf of Naples (Mediterranean Sea). Journal of Plankton Research, 17:
575-593.
Recommended