Copyrights of some images used in this report belong toPapercast、Terrada Music Score (Listing the company's names in alphabetical order).
E INK
HO
LDIN
GS IN
C. 2
01
7 A
nn
ua
l Rep
ort
• Taiwan Stock Exchange Market Observation Post System (Also known as MOPS): http://mops.twse.com.tw • EIH annual report is available at www.eink.com • Printed on April 24, 2018
E INK HOLDINGS INC. 2017 Annual Report
EIH: 8069
No.3, Lixing 1st Rd., Hsinchu Science Park,Hsinchu 300, TaiwanTel: 886 3 5643200www.eink.com

001
TABLE OF CONTENTSCONTENTS
002 • Company Milestones
004 • Letter To The Shareholders
006 • Financial Highlights
012 • Company Introduction
013 • Affiliate and Subsidiaries
014 • Company Organization
018 • Review of Operations
028 • Consolidated Financial Statements
112 • Financial Statements
SPOKESPERSON / DEPUTY SPOKESPERSON
Patrick Chang, Chief Financial Officer/ Ricky Tsai, Director of Financial DivisionT. 886 3 [email protected]/ [email protected]
OFFICE / FACTORY
E INK HOLDINGS INC.No. 3, Li-Hsin Road One, HsinChu Science Park, HsinChu, Taiwan 300, R.O.C.T. 886 3 5643200
http://www.eink.com
STOCK LISTING
The company's common stock is listed on the Taiwan's OTC/TPEX Securities Market. (Ticker: 8069)Common Share Transfer Agent & Registrar: SinoPac Securities3F, 17 Po Ai Rd., Taipei, Taiwan, R.O.C.T. 886 2 2381-6288
http://www.sinotrade.com.tw
INDEPENDENT CERTIFIED PUBLIC ACCOUNTANT
Deloitte & Touche12F, 156 Min Sheng E Road, Sec. 3, Taipei, Taiwan, R.O.C.T. 886 2 2545-9988
http://www.deloitte.co.tw
NAME OF INTERNATIONAL PUBLIC SECURITIES EXCHANGES ANDHOW TO GET INFORMATION ABOUT SECURITIES TRADED THERE
Trading house: Luxembourg Stock ExchangeInquiry method: Bloomberg
Website http://www.bourse.lu/

002
COMPANY MILESTONESDate of Establishment: June 16th, 1992
Milestones in the Company's History:
Sept 2000 : Monthly capacity reached 18,000 substrates.
Oct 2000 : Securities & Futures Information Center issued authorization for public offering.
Sept 2001 : Expanded its monthly capacity to 36,000 substrates.
Oct 2001:ObtainedISO9001certification.
Apr 2002 : Taiwan's Investment Commission approved set up of Transcend Optronics (Yangzhou) Co Ltd, the company's PRC subsidiary, through a third region
investment entity.
Jul 2002:ObtainedQS-9000Certificationforproductquality,ISO14001Certificationforenvironmentalstandards,andOHSAS1800Certificationforoccupational
health and safety management systems.
Feb 2003 : Listed its shares on Taiwan's Emerging Stock Market.
Oct 2003 : Applied for its shares to be listed on Taiwan's GreTai(TPEX/OTC) Securities Market (GTSM).
Jan 2004 : GTSM approved the Company's application for its shares to be listed.
Mar 2004 : Commenced trading on the GTSM on March 30, 2004.
Nov 2004 : Taiwan's Investment Commission approved the Company's application for indirect investment in Rich Optronics (Yangzhou) Co Ltd in PRC through a third
region investment entity.
May 2005 : Partnered with Philips in EPD (Electronic Paper Display) business.
May 2006 : Executed the 1st treasury stock repurchase and retired 296,000 issued shares.
Oct 2006 : Established US subsidiary to expand sales network in the America.
May 2007 : Signed a technology and patent licensing agreement with Company A.
Nov 2007 : Signed a merger memorandum with BOE Hydis Technology of South Korea.
Jul 2008:OfficiallyacquiredshareownershipofHydisTechnologies.
Jun 2009 : Signed agreement to acquire 100% share ownership of E Ink Corporation (EIC) USA.
Sept 2009 : Signed amended agreement for the 100% share transfer with EIC and shareholder representatives to obtain 100% share ownership of EIC, effective on
December 23rd, 2009.
Dec 2009 : Hydis Technologies signed corporate bond purchase agreement, guarantee agreement, investment agreement and cross-licensing agreement with LG
Display of Korea.
May 2010 : Taiwan's Investment Commission approved the company's application to establish Transyang Electronics (Yangzhou) Ltd through a third region investment entity.
Jun 2010 : Changed English name of the company to "E Ink Holdings Inc.".
Nov 2010 : The company's latest EPD product, E Ink PearlTM , won the Popular Science award for "Best of What's New 2010".
Dec 2010 : Won Printed Electronics Awards at The 4th IDTechEx, USA.
Jan 2011 : Approved by the Investment Commission to invest in the Chuanyuan Electronics (Yangzhou) Co., Ltd. in Mainland China through a third-location
investment vehicle.
Mar 2011 : The Company's Board of Directors passed a resolution for a second treasury stock repurchase to be used for employee incentive programs.
May 2011 : The E Ink TritonTM EPD was awarded by the SID as the Best Display Component of Year 2011.
May 2011 : The Company decided that divisions without operational control power but with an investment purpose of our subsidiary Yong Yu Investment Co., Ltd.
willbespunoffandbeincorporatedinnewlyestablishedKaiYuInvestmentCo.,Ltd.,inordertostrengthenallocationefficiencyoflaborinthemanagement
of this subsidiary, and improve its return on investment.
Jul 2011 : Partnered with Chunghwa Picture Tubes Ltd.by subscribing to the unsecured convertible bonds from its non-public offering with amount NT$1.5B after
approved by the board of directors.
Oct 2011 : The E Ink TritonTM EPD won 2011 Technology Innovation Award issued by Wall Street Journal, USA.
Oct 2011:SubscribedtonewlyissuedHydiscorporatebondsamountingtoUS$30,500,000tostrengthenHydis'financialhealthyandstructureandenrichthe
capital required for its operations.
Nov 2011 : The E Ink PearlTM EPD won 2011 Innovation Awards for Electronics issued by IET, UK.
Nov 2011 : Terminated the joint investment in Hydis with LG Display under a mutual agreement. Hydis redeemed its corporate bonds held by LG Display and relieved
all the guarantee contracts related with said bonds.
Jun 2012 : The next generation E Ink high performance EPD won the Fifteenth Excellent Optical Product Prize from the Photonics Industry & Technology Association.
Jun 2012 : The high contrast E Ink PearlTM EPD won the Eleventh Surface Display Component Product Technology Prize's Excellent Component from the Image
DisplayIndustryAdvancementOffice,IndustrialDevelopmentBureauoftheMinistryofEconomicAffairs.
Jul 2012 : E Ink Holdings Inc. and its Korean subsidiary, Hydis Technologies Co., Ltd entered patents cross-licensing agreement with Company B.
Oct 2012 : E Ink Holdings Inc. and its Korean subsidiary, Hydis Technologies Co., Ltd entered patents cross-licensing agreement with Company C.
Nov 2012 : E Ink Holdings Inc completed the purchase of SiPix Technology, Inc. and its wholly owned subsidiary SiPix Imaging, Inc. (USA)
Dec 2012 : E Ink Holdings Inc. and its Korean subsidiary, Hydis Technologies Co., Ltd entered patents cross-licensing agreement with Company D.
Jan 2013 : E Ink Holdings Inc. bought facilities and equipment from its subsidiary, Sipix at Linkou, to integrate production capacity in Taiwan and to improve assets utilization.

003
May 2013 : E Ink Holdings won the Best in Show award for 2013 from the Society of Information Display (SID) of the United States.
May 2013 : E Ink SpectraTM released. Spectra is the world's only electronic paper display capable of displaying three colors of red, black, and white.
June 2013 : E Ink TritonTM , the all-functional color EPD, received the 16th Outstanding Optical Electronic Product Award from the Photonics Industry and Technology
Development Association (PIDA).
Nov 2013 : The Company’s Korean subsidiary Hydis Technologies Co., Ltd. signed a patent exchange authorization agreement with Company E.
Apr 2014 : The Company’s Korean subsidiary Hydis Technologies Co., Ltd. signed a patent exchange authorization agreement with Company F.
Jun 2014 : The E Ink SpectraTM three-pigment EPD won the 17th Outstanding Optoelectronic Product Award from the Photonics Industry & Technology Development
Association (PIDA).
Dec 2014 : Won the SEMI Standards Contribution Award from SEMI Taiwan.
Jan 2015 : Launched the programmable color and pattern EPD technology: E Ink PrismTM.
Aug 2015 : Won the "Best Technology Award at the 14th Gold Panel Awards organized" by the Taiwan Display Union Association for the wireless power transfer (WPT)
electronic paper display (EPD).
Dec 2015 : Subsidiary Hydis Technologies Co., Ltd. in South Korea signed the patent mutual licensing agreement with Company G.
Apr 2016 : E Ink Spectra Tri-colored ePaper display received Silver Award of Taiwan Excellence from Ministry of Economic Affairs, ROC.
May 2016 : ACeP(Advanced Colorful ePaper) won the “Best in Show 2016” by SID(Society of Information Display)
July 2016 : Two 100% owned subsidiaries YYI & KYI completed the cash merger for the integration.
Sept 2016 : The Company’s Korean subsidiary Hydis Technologies Co., Ltd. signed a patent exchange authorization agreement with Company H.
Nov 2016 : The Company signed a strategic alliance agreement with Company I.
Dec 2016 : The Company received “Green Electric Power Gratitude Award” from Ministry of Economic Affairs, ROC.
Feb 2017 : 32-inch full-color ePaper Display was honored with the Taiwan Excellence Award presented by the Ministry of Economic Affairs (MOEA), R.O.C.
April 2017 : E Ink and Sony Semiconductor Solutions Corporation set up a joint venture to manage their ePaper Display business together.
Sept 2017:6.1-inchnon-geometricflexiblewearableePaperDisplaywashonoredwiththeGoldDisplayAwardoftheGoldPanelAwardspresentedbyTaiwan
Display Union Association (TDUA)
Oct 2017 : Since 2015, our company receives Intellectual Asset Management awards in three consecutive years granted by Asia IP Elite.
Nov 2017 : Our “2016 Corporate Social Responsibility Report” won the 10th Corporate Sustainability Award hosted by the Center for Corporate Sustainability and the
special honor of the Gold Award for electronic information manufacturers: “2017 10th Taiwan Corporate Sustainability Award” of the reports category.
004
LETTER TO THE SHAREHOLDERS
Ladies and Gentlemen,
2017 Business Report
In 2017, under the joint efforts of our global team, E Ink Holdings (the Company) has seen continuous improvement in operational performance
comparedwiththepreviousyear.In2017,theCompanyhadconsolidatedrevenueofNT$15.2billion,grossprofitofNT$6.28billionwithgross
profitmarginof41.3%andnetincomeaftertaxesofNT$2.08billion.Theearningspershare(EPS)for2017wasNT$1.85.
The development of Internet of Things (IoT) applications in recent years is becoming more and more encouraging and widespread. Relevant
applications have been probed to smart retailing (or new retailing), smart manufacturing, smart medicals and smart city, etc., which involve
various business activities and daily-life uses. According to the market intelligence report issued by Gartner, a research and advisory company,
there will be 20.4 billion devices for IoT applications in 2020. Numerous low powered end devices, integrate with software and hardware, will
be installed in all kinds of circumstances to realize the real value of IoT applications. Most of the end devices, however, will need a display or a
sensor as the interface between humans and the devices. ePaper, with the feature of low power consumption, is the most suitable display for IoT
applications. Following such mega trends, E Ink has been aggressively conducting various actions not only promotes the use of ePaper in new
application domains but works with the supply chain partners to build ecosystems for IoT applications .
The business achievements of the Company in 2017 were fruitful. The Company has been keeping continuing to dedicate for eReader business
on the digital reading market and also concentrating on IoT applications such as the Electronic Shelf Label (ESL), smart tag, smart card, signage,
mobileandwearableproducts.WiththebenefitofePaper’sbistableandlowpowerconsumptioncapabilities,theCompanyhasbeensupporting
customers in these different application domains to introduce multiple innovative products. Among them, thanks to the dramatic growth on
smart retailing applications in Europe, US and China, the ESL business has become one of the important growth engines to E Ink.
IoT applications as the basis of organizational operations, solid technology development and complete manufacturing capability were main
drivers to the Company’s business growth in 2017. The Company has been also working aggressively with strategical partners in the ecosystems,
integrating technologies and resources from upstream to downstream, and adopting the well-established ePaper supply chain to provide the
customers comprehensive products and services including hardware, software, materials, components, manufacturing and development. The
goalistocollaboratewiththecustomerstodevelopandmanufacturediversifiedmultipleePaperapplications.
To continue the eReader's excellent reputation over the global market, the Company has successfully integrated the handwriting feature
to eNote products. Collaborating with global brands, the handwriting embedded eNote has been providing paper-less, convenient, light-
weighted and easy-edited reading and writing experience to users for education, office and professional applications. To strengthen the
development on handwriting applications and facilitate the introduction of paper-less circumstances, the Company established a joint venture
with Sony Semiconductor Solutions Corporation to plan, design, develop, manufacture, sell, distribute and license ePaper relevant products and
applications. The new company also offers comprehensive solutions for customers in different application domains while the goal is to provide a
convenient way of introducing ePaper products to shorten time to market.
The Company’s development and research deliverables on ePaper technology was also highly recognized in 2017 besides the fruitful business
achievements. The 32” Color ePaper Display won the Taiwan Excellence Gold Award from the Ministry of Economic Affairs and the 6.1” Non-
Geometrical Flexible ePaper Display for Wearables was awarded the Gold Panel Award- Best Product, from the Taiwan Display Union Association.
In addition, the Company has been devoting to corporate social responsibility (CSR) for many years. The Company helped elementary schools
build a "mobile library of eBooks" derivative from eReader’s core value to share the company’s resources with society. Furthermore, the Company's
"2016 CSR Report" earned the Golden Award of the electronic information manufacturing category from the 10th Taiwan Sustainability Awards.

005
Operation Highlights in 2018
Tobusinessgrowth,diversificationofproducts, innovationofproducts,shorteningtimetomarketandcreationofsuitableecosystemswith
partners for application domains are main focuses for the two main business segments, Consumer Electronics (CE) and IoT.
To technology development, the technology preparation for Advanced Color ePaper (ACeP) will be completed for further commercialization and
massproduction.TheCompanywillalsocontinuetorefinethetechnologicalperformancesofanothercriticaltechnology-flexibledisplay,aswell
as collaborate with supply chain partners to enhance manufacturing capability and increase manufacturing capacity.
To operations management, productivity increment by raising automation level is critical. Cost control and supply chain management are also
main focuses in order to provide more timely delivery for customers by preventing the shortage on critical components in recent years .
Prospect
The Company has been developing ePaper technology for years and obtained various technological breakthroughs which led to important critical
patent assets. The Company manages a comprehensive ePaper supply chain from upstream to downstream as well as creates innovative, user-
experience focused products developed with customers in different application domains. All of this puts the Company on a critical kernel role over
the ePaper ecosystems. The Company will continue to devote resources to the research and development of products to keep its’ leading position
in the global ePaper display industry through technological and innovative prowess. At the same time, the Company will continue to be actively
devoted to corporate social responsibility and make contributions to society.
Chairman & CEO

006
007
FINANCIAL HIGHLIGHTS
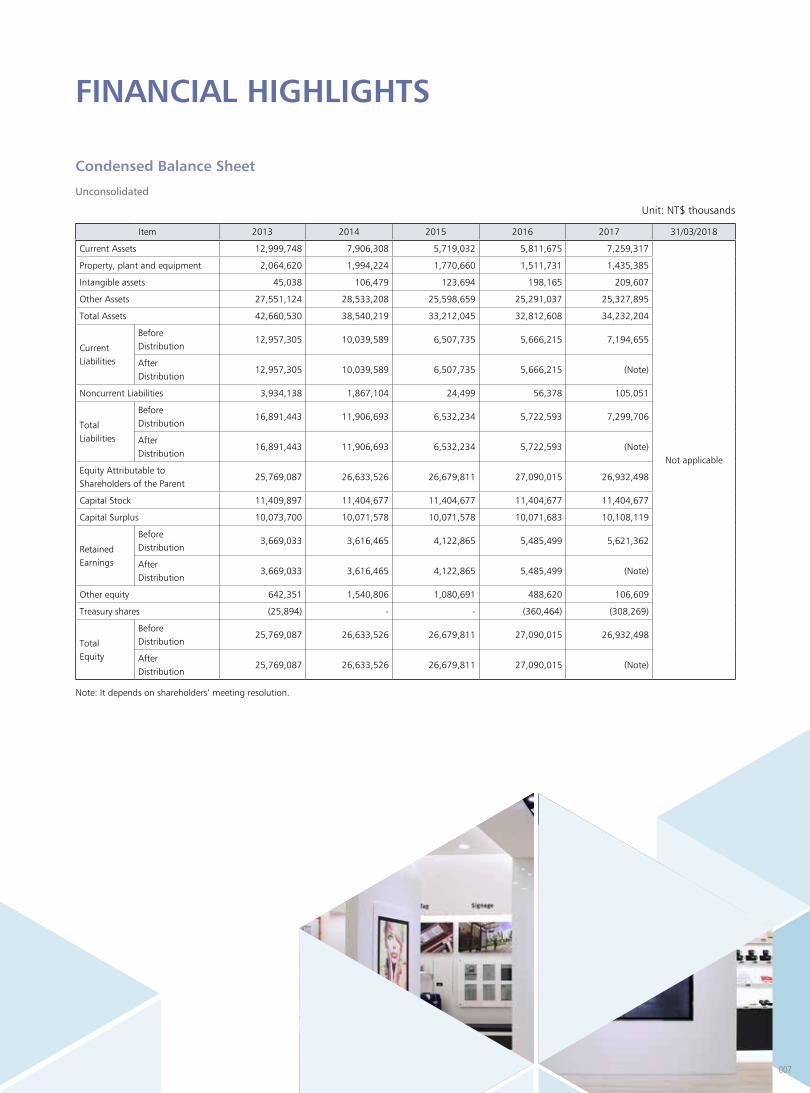
Condensed Balance Sheet
Unconsolidated
Unit: NT$ thousands
Item 2013 2014 2015 2016 2017 31/03/2018
Current Assets 12,999,748 7,906,308 5,719,032 5,811,675 7,259,317
Not applicable
Property, plant and equipment 2,064,620 1,994,224 1,770,660 1,511,731 1,435,385
Intangible assets 45,038 106,479 123,694 198,165 209,607
Other Assets 27,551,124 28,533,208 25,598,659 25,291,037 25,327,895
Total Assets 42,660,530 38,540,219 33,212,045 32,812,608 34,232,204
CurrentLiabilities
BeforeDistribution
12,957,305 10,039,589 6,507,735 5,666,215 7,194,655
AfterDistribution
12,957,305 10,039,589 6,507,735 5,666,215 (Note)
Noncurrent Liabilities 3,934,138 1,867,104 24,499 56,378 105,051
Total Liabilities
BeforeDistribution
16,891,443 11,906,693 6,532,234 5,722,593 7,299,706
AfterDistribution
16,891,443 11,906,693 6,532,234 5,722,593 (Note)
Equity Attributable to Shareholders of the Parent
25,769,087 26,633,526 26,679,811 27,090,015 26,932,498
Capital Stock 11,409,897 11,404,677 11,404,677 11,404,677 11,404,677
Capital Surplus 10,073,700 10,071,578 10,071,578 10,071,683 10,108,119
Retained Earnings
BeforeDistribution
3,669,033 3,616,465 4,122,865 5,485,499 5,621,362
AfterDistribution
3,669,033 3,616,465 4,122,865 5,485,499 (Note)
Other equity 642,351 1,540,806 1,080,691 488,620 106,609
Treasury shares (25,894) - - (360,464) (308,269)
Total Equity
BeforeDistribution
25,769,087 26,633,526 26,679,811 27,090,015 26,932,498
AfterDistribution
25,769,087 26,633,526 26,679,811 27,090,015 (Note)
Note: It depends on shareholders’ meeting resolution.

008
Consolidated
Unit:NT$ thousands
Item 2013 2014 2015 2016 2017 2018/03/31
Current Assets 14,216,444 15,882,253 13,730,805 14,707,222 14,747,740 16,859,341
Property, plant and equipment 9,835,142 9,041,082 6,497,167 5,319,822 4,752,982 4,676,340
Intangible assets 9,797,804 9,675,994 9,461,830 9,178,475 8,591,789 8,423,322
Other Assets 6,235,705 4,354,523 3,735,424 4,208,044 4,783,409 4,872,739
Total Assets 40,085,095 38,953,852 33,425,226 33,413,563 35,875,920 34,831,742
CurrentLiabilities
BeforeDistribution
8,561,571 9,112,824 6,036,805 5,143,950 6,781,552 5,691,800
AfterDistribution
8,561,571 9,112,824 6,572,825 6,824,652 (Note) (Note)
Noncurrent Liabilities 5,971,409 3,328,026 804,891 1,180,474 1,777,473 1,459,797
Total Liabilities
BeforeDistribution
14,532,980 12,440,850 6,841,696 6,324,424 8,649,025 7,151,597
AfterDistribution
14,532,980 12,440,850 7,377,716 8,005,126 (Note) (Note)
Equity Attributable to Shareholders of the Parent
25,769,087 26,633,526 26,679,811 27,090,015 26,932,498 27,359,733
Capital Stock 11,409,897 11,404,677 11,404,677 11,404,677 11,404,677 11,404,677
Capital Surplus 10,073,700 10,071,578 10,071,578 10,071,683 10,108,119 10,113,307
Retained Earnings
BeforeDistribution
3,669,033 3,616,465 4,122,865 5,485,499 5,621,362 6,081,853
AfterDistribution
3,669,033 3,616,465 3,586,845 3,804,797 (Note) (Note)
Other equity 642,351 1,540,806 1,080,691 488,620 106,609 68,165
Treasury shares (25,894) - - (360,464) (308,269) (308,269)
Non-Controlling Interests (216,972) (120,524) (96,281) (876) 294,397 320,412
Total Equity
BeforeDistribution
25,552,115 26,513,002 26,583,530 27,089,139 27,226,895 27,680,145
AfterDistribution
25,552,115 26,513,002 26,047,510 25,408,437 (Note) (Note)
Note: It depends on shareholders’ meeting resolution.
Condensed Statement of Income
Unconsolidated
Unit: NT$ thousands (Except EPS: NT$)
Item 2013 2014 2015 2016 2017For the Year Ended
31/03/2018
Net Sales 14,427,628 12,461,581 12,501,126 13,112,855 13,905,359
Not applicable
GrossProfit 1,293,885 919,055 1,973,787 1,740,245 2,648,799
Income from Operations 59,302 (486,906) 511,724 130,769 934,774
Non-operating Income and Expenses (16,413) 458,895 122,021 1,830,786 1,297,179
Profit(Loss)BeforeIncomeTax 42,889 (28,011) 633,745 1,961,555 2,231,953
Net Income (Loss) 29,303 13,476 539,330 1,907,939 2,078,065
Other comprehensive income (loss), net of income tax
1,131,137 939,451 (483,569) (601,356) (387,910)
Total Comprehensive Income (Loss) 1,160,440 952,927 55,761 1,306,583 1,690,155
Earnings (Loss) Per Share(Note) 0.03 0.01 0.47 1.69 1.85
Note:Based on weighted average shares outstanding in each year

009
Consolidated
Unit: NT$ thousands (Except EPS: NT$)
Item 2013 2014 2015 2016 2017For the Year Ended
31/03/2018
Net Sales 18,905,129 13,498,720 13,306,503 14,006,206 15,203,334 2,897,634
GrossProfit 3,018,681 3,049,866 4,148,730 5,120,546 6,284,416 1,108,629
Income from Operations (1,648,317) (1,388,942) (449,217) 60,588 1,102,387 (263,893)
Non-operating Income and Expenses 1,436,827 2,955,409 3,196,182 2,347,936 2,235,624 382,720
Profit(Loss)BeforeIncomeTax (211,490) 1,566,467 2,746,965 2,408,524 3,338,011 118,827
Net income of continuing operation (36,009) 1,942,431 2,429,173 2,057,909 2,932,298 49,055
Net income from discontinued operation
- (1,888,222) (1,861,568) (64,588) (849,968) -
Net Income (Loss) (36,009) 54,209 567,605 1,993,321 2,082,330 49,055
Other comprehensive income (loss) , net of income tax
1,117,883 934,274 (481,085) (591,333) (368,115) (66,874)
Total Comprehensive Income (Loss) 1,081,874 988,483 86,520 1,401,988 1,714,215 (17,819)
Total Net Income Attributable to Shareholders of the Parent
29,303 13,476 539,330 1,907,939 2,078,065 41,1641
Total Net Income Attributable to Shareholders of the non-controlling interests
(65,312) 40,733 28,275 85,382 4,265 7,891
Total Comprehensive Income Attributable to Shareholders of the Parent
1,160,440 952,927 55,761 1,306,583 1,690,155 (22,933)
Total Comprehensive Income Attributable to Shareholdersof the non-controlling interests
(78,566) 35,556 30,759 95,405 24,060 5,114
Earnings (Loss) Per Share(Note) 0.03 0,01 0.47 1.69 1.85 0.04
Note:Based on weighted average shares outstanding in each year
Auditors’ Opinions from 2013 to 2017
Year CPA Firm CPA Audit Opinion
2013 Deloitte & Touche Shu-Wan Lin, Ya Ling Wong AModifiedUnqualifiedOpinions
2014 Deloitte & Touche Shu-Wan Lin, Ya Ling Wong AnUnqualifiedOpinions
2015 Deloitte & Touche Ya Ling Wong, Chin-Ming Shao AnUnqualifiedOpinions
2016 Deloitte & Touche Ya Ling Wong, Chin-Ming Shao AnUnqualifiedOpinions
2017 Deloitte & Touche Ya Ling Wong, Chin-Ming Shao AnUnqualifiedOpinions

010
Financial Analysis
Unconsolidated
Item 2013 2014 2015 2016 2017 31/03/2018
Capital StructureAnalysis (%)
Liability to Total Assets Ratio 39.60 30.89 19,67 17.44 21.32
Not applicable
Long-term Fund to Fixed Assets Ratio 1,438.68 1,429.16 1,508.16 1,795.72 1883.64
Liquidity Analysis (%)
Current Ratio 100.33 78.75 87.88 102.57 100.9
Quick Ratio 88.60 68.36 71.17 84.73 72.88
Times Interest Earned 1.33 0.73 11.14 117.73 229.42
OperatingPerformanceAnalysis
Average Collection Turnover 1.90 2.33 3.78 3.74 3.34
Days Sales Outstanding 191 157 97 98 110
Average Inventory Turnover 12.41 9.63 11.61 12.87 7.95
Average Inventory Turnover Days 1.16 1.41 2.06 2.47 2.06
Average Payment Turnover 29 38 32 29 46
Property, Plant and Equipment Turnover 6.99 6.14 6.64 7.99 9.44
Total Assets Turnover 0.33 0.31 0.35 0.40 0.41
ProfitabilityAnalysis
Return on Total Assets 0.26 0.25 1.64 5.82 6.22
Return on Equity Attributable to Shareholders of the Parent
0.12 0.05 2.02 7.10 7.69
Pre-tax Income to Paid-in Capital Ratio 0.38 (0.25) 5.56 17.20 19.57
Net Margin 0.20 0.11 4.31 14.55 14.94
Earnings Per Share 0.03 0.01 0.47 1.69 1.85
Cash Flow (%)
Cash Flow Ratio (14.58) (1.54) (14.35) 14.40 12.12
Cash Flow Adequacy Ratio 103.84 99.62 56.34 105.41 16.62
Cash Flow Reinvestment Ratio (4.91) (0.42) (2.66) 0.79 -2.37
LeverageOperating Leverage 5.91 0.38 1.57 3.27 1.29
Financial Leverage (1.50) 0.82 1.14 1.14 1.01
Consolidated
Item 2013 2014 2015 2016 2017 31/03/2018
Capital StructureAnalysis (%)
Liability to Total Assets Ratio 36.26 31.94 20.47 18.93 24.11 20.53
Long-term Fund to Fixed Assets Ratio 322.73 331.39 423.03 531.42 604.04 616.28
Liquidity Analysis (%)
Current Ratio 166.05 174.28 227.45 285.91 258.28 296.20
Quick Ratio 125.12 149.10 200.74 252.83 232.88 249.21
Times Interest Earned 0.15 (1.43) 10.68 76.18 103.14 78.33
OperatingPerformanceAnalysis
Average Collection Turnover 3.65 4.51 6.62 8.77 8.36 6.36
Days Sales Outstanding 99 81 56 42 44 58
Average Inventory Turnover 4.82 4.03 5.36 6.15 4.95 3.12
Average Inventory Turnover Days 4.10 5.11 7.12 8.22 5.34 3.92
Average Payment Turnover 75 91 69 60 74 117
Property, Plant and Equipment Turnover 1.89 1.43 1.71 2.37 3.02 2.46
Total Assets Turnover 0.44 0.34 0.37 0.42 0.44 0.33
ProfitabilityAnalysis
Return on Total Assets 0.41 0.36 1.69 5.78 6.06 0.12
Return on Equity Attributable to Shareholders of the Parent
0.12 0.05 2.02 7.10 7.69 0.15
Pre-tax Income to Paid-in Capital Ratio (1.28) (3.18) 7.52 19.80 21.27 0.97
Net Margin 0.16 0.10 4.05 13.62 13.67 1.42
Earnings Per Share 0.03 0.01 0.47 1.69 1.85 0.04
Cash Flow (%)
Cash Flow Ratio 34.14 46.10 40.75 93.87 80.26 (24)
Cash Flow Adequacy Ratio 113.14 145.39 156.12 236.02 310.34 279.86
Cash Flow Reinvestment Ratio 5.55 8.07 7.12 12.2 11.31 (4.40)
LeverageOperating Leverage (0.25) (0.41) (2.71) 22.63 2.06 (0.05)
Financial Leverage 0.90 0.90 0.84 1.96 1.02 0.99

011
1. Capital Structure Analysis
(1) Debt Ratio = Total Liabilities / Total Assets
(2) Long-term Fund to Property, Plant and Equipment Ratio = (Shareholders’ Equity + Noncurrent Liabilities) / Net Property, Plant and
Equipment
2. Liquidity Analysis
(1) Current Ratio = Current Assets / Current Liabilities
(2) Quick Ratio = (Current Assets - Inventories - Prepaid Expenses) / Current Liabilities
(3) Times Interest Earned = Earnings before Interest and Taxes / Interest Expenses
3. Operating Performance Analysis
(1) Average Collection Turnover = Net Sales / Average Trade Receivables
(2) Days Sales Outstanding = 365 / Average Collection Turnover
(3) Average Inventory Turnover = Cost of Sales / Average Inventory
(4) Average Payment Turnover = Cost of Sales / Average Trade Payables
(5) Average Inventory Turnover Days = 365 / Average Inventory Turnover
(6) Property, Plant and Equipment Turnover = Net Sales / Average Net Property, Plant and Equipment
(7) Total Assets Turnover = Net Sales / Average Total Assets
4.ProfitabilityAnalysis
(1) Return on Total Assets = (Net Income + Interest Expenses * (1 - Effective Tax Rate)) / Average Total Assets
(2) Return on Equity attributable to Shareholders of the Parent = Net Income Attributable to Shareholders of the Parent / Average Equity
Attributable to Shareholders of the Parent
(3) Pre-tax Income to Paid-in Capital Ratio = Income before Tax / Paid-in Capital
(4) Net Margin = Net Income / Net Sales
(5) Earning per Share = (Net income attributable to Shareholders of the Parent - Preferred Stock Dividend) / Weighted Average Number of
Shares Outstanding
5. Cash Flow
(1) Cash Flow Ratio = Net Cash Provided by Operating Activities / Current Liabilities
(2) Cash Flow Adequacy Ratio = Five-year Sum of Cash from Operations / Five-year Sum of Capital Expenditures, Inventory Additions, and Cash
Dividend
(3) Cash Flow Reinvestment Ratio = (Cash Provided by Operating Activities - Cash Dividends) / (Gross Property, Plant and Equipment + Long
term Investments + Other Noncurrent Assets + Working Capital)
6. Leverage
(1) Operating Leverage = (Net Sales - Variable Cost) / Income from Operations
(2) Financial Leverage = Income from Operations / (Income from Operations - Interest Expenses)

012
COMPANY INTRODUCTION
E Ink Holdings Inc. started in 1992 and manufactures Electronic Paper (ePaper based on Electrophoretic technology) and TFT LCD (Thin Film
Transistor based Liquid Crystal Display). E Ink is the world leader in the global ePaper industry and one of the High-Tech Subsidiaries of the YFY
Group.TheYFYGroupincludesthelargestprofessionalpapermanufacturingcompanyinTaiwan,andwasthefirstintheGreaterChinaregionto
establish an R&D center for paper manufacturing. The founding of E Ink Holdings began with the YFY Group's rich history in paper manufacturing
and the ancient Chinese history of paper inventions. In the early 1990’s, Mr. SC Ho, the founder of YFY group, realized that digital publishing
wasaninevitabletrendandthatpaperandprintingmighteventuallybereplacedbypaperlesselectronicdevices.Hetaskedhisteamtofindnew
technologies to bridge the gap between the printed page and digital content and delivery methods. This led to investments by the YFY Group in
LCD technology and the continued research into future display technologies that could realize this vision. In 1992 E Ink Holdings Inc. (formerly
PrimeViewInternational)wasestablishedasthefirstTFTLCDcompany inTaiwan,focusingonhighqualitysmall-to-medium-sizedTFTLCDs.
In 2002 E Ink Holdings established Transcend Optronics in YangZhou, China in order to match the increasing demand in the TFT LCD industry.
In 1997, E Ink Corporation was spun out of the MIT Media Lab to commercialize electronic ink and ePaper technology using TFTs from Philips
Electronics. Seeing the potential of this new display medium, in 2005 E Ink Holdings acquired the ePaper business unit from Philips, and together
withE InkCorporation, launchedthefirstEPDeBooks intothemarket.To increasecapacityastheeReadermarketexpanded,E InkHoldings
merged with the Korean TFT LCD company, Hydis Technologies, in 2008. In 2009, YFY Group authorized the acquisition of E Ink Corporation by E
Ink Holdings to further integrate and expand the ePaper supply chain. The demand for ePaper has increased dramatically thanks to the booming
eReader industry. With the leading ePaper technology, high quality products and outstanding supply chain, E Ink Holdings is now the world's
leading supplier of ePaper modules to global top tier eReader brand names like Amazon, Sony, Hanvon, Barnes & Noble, and has a global market
share of 90+%. E Ink Holdings' corporate philosophy aims to deliver revolutionary products, excellent user experiences, and environmental
benefitsthroughadvancedtechnologydevelopment.Withnewproductslikecolor,flexible,andtouch-enabledePaper,EInkHoldings
013
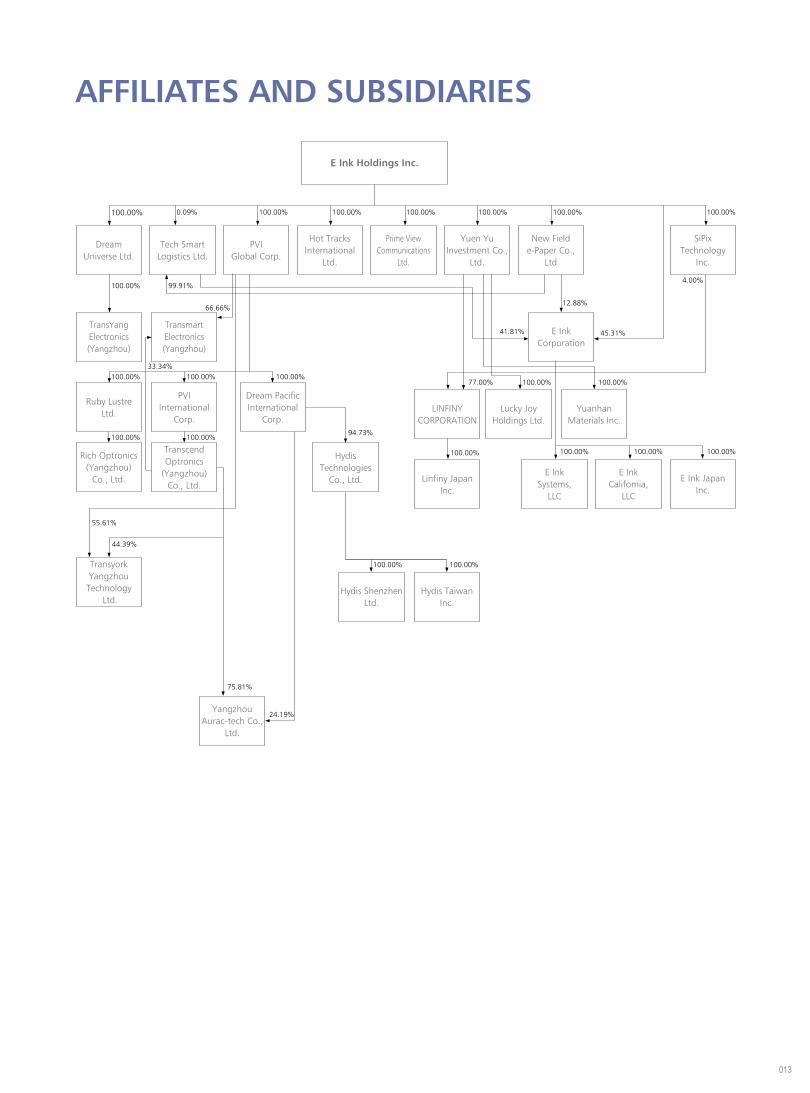
AFFILIATES AND SUBSIDIARIES
Transmart Electronics (Yangzhou)
TransyorkYangzhouTechnology
Ltd.
Yangzhou Aurac-tech Co.,
Ltd.
Rich Optronics (Yangzhou)
Co., Ltd.
Transcend Optronics
(Yangzhou) Co., Ltd.
E InkCalifomia,
LLC
E InkSystems,
LLC
SiPixTechnology
Inc.
E Ink Japan Inc.
Ruby Lustre Ltd.
PVIInternational
Corp.
DreamPacificInternational
Corp.
Hydis Technologies
Co., Ltd.
Lucky JoyHoldings Ltd.
LINFINY CORPORATION
LinfinyJapanInc.
Yuanhan Materials Inc.
Hydis Shenzhen Ltd.
Hydis Taiwan Inc.
Tech Smart Logistics Ltd.
PVIGlobal Corp.
Hot Tracks International
Ltd.
Prime View Communications
Ltd.
Yuen Yu Investment Co.,
Ltd.
New Field e-Paper Co.,
Ltd
E Ink Corporation
DreamUniverse Ltd.
TransYang Electronics (Yangzhou)
E Ink Holdings Inc.
100.00%
100.00%
100.00%
100.00%
100.00%
100.00%
100.00%
100.00%
44.39%
55.61%
75.81%
24.19%
100.00%
94.73%
100.00%
100.00%
100.00%
4.00%
33.34%
0.09%
99.91%
66.66%
100.00% 100.00% 100.00% 100.00% 100.00%
12.88%
41.81%
77.00%
100.00%100.00%100.00%
45.31%
100.00%

014
COMPANY ORGANZATIONE Ink Group
2017.12.31
Board of Directors
Chairman & CEO
President
Integrated BusinessManagerment Div.
Product Managenment
Central Div.
Application Service Div.
China Branch
Korea Branch
Japan Branch
America Sales Div.
RemunerationCommittee
Audit Committee
AuditorOffice
Legal Div.
Global HR Central Div.
IT Div
Public Relations Office
Research & Development Center
Finance Center
Operation Center
Strategy integration Center
Project Center
CE BU loT BU
Sales Center

015

016
OFFICE AND FUNCTIONS
● Chairman &CEO Office (including Auditor Office, Legal Division, Global HR Central Division, IT Division and Public Relations Office):
Planning and implementation of corporate strategy and internal controls; legal affairs administration; and planning and management of
document control; Planning and execution of human resources and public affairs; planning and implementation of industrial safety and
environmental protection; IT planning and implementation, building corporate healthy image and media contact; and organization, planning,
and execution of public relation affairs such as international exhibitions and product promotional activities.
● President Office (Including Product Application Division, Integration Business Management Division, Industrial Safety Division,
Environmental Protection Division)
SetupsalesgoalforeachBU(BusinessUnit),Integration&optimizationofsalesordersflow,AssisteachBUtopromotethenewproduct&
new application to customers, Tackle down the possible problems to design in, Develop the evaluation kit for customer quick design in.
● R&D Center:
Technology innovation, research and development of EPD, and implementation of mass production, including EPD research and development;
patent deployment and planning; the design and the research and development of process technology of cutting-edge panels; development
of the process technology of new platforms and modules; and the introduction of key materials, parts, and components; Provision of the
reference design of terminal applications and products to customers; development of EPD system products; and assistance for customers to
quickly design and implement mass production.
● Operation Center:
Planning and implementation of process analysis and production management, procurement planning and implementation of raw materials,
equipment and projects; raw material demand planning; bonded product and logistics management; quality and reliability assurance of
raw materials and products; management and implementation of production plans; planning and implementation of process analysis and
production management of in-process products.
● Finance Center:
Finance, accounting & business analysis;
● Strategy Integration Center:
New product verification, product management and planning; and implementation of the product management platforms across all the
business units;
● Project Center:
Planning long-term development and strategies for the non-display application of products based on the internal materials, structures, and
process technology of E Ink core value.
● CE BU:
Sales and cultivation of customers and markets of e-Reader/e-Note/EPD products; solving and analysis of relevant problems in customer
projects; and discussion, proposal, and provision of technical documents;
● Electronic Shelf Industrial Products(ESI) BU:
Specialize in R&D, design, manufacture; and sale of all the ESL, smart card, smart home, medical, industrial/ IoT tag products.
●Mobile Device (MD) BU:
The design of mobile phone and wearable products; provision of total solutions; development of the mobile device eco-system and product
sales; assistance to customers for product planning ,design and implementation of mass production.

017
1.Chairman & CEO / Frank Ko 2. President / Johnson Lee 3.Chief Technology Officer / C.C. Tsai 4. Vice President (Operating Center) / Luke Chen
134 2
MANAGEMENT TEAM
Title/Division Name On-board Date (Note)
Chairman & CEO Frank Ko 02-12-2013
President Johnson Lee 01-03-2008
Chief Technology Officer CC Tsai 01-08-2014
Vice President Lloyd Chen 23-04-2018
Vice President(Sales Center) FY Gan 20-06-2017
Vice President (Auditor Office) Mico Yu 06-02-2012
Vice President (Operation Center) Luke Chen 01-10-2010
Vice President James Hong 15-03-2010
Vice President (Advanced Technology Research Central Div.) Yung-Sheng Chang 01-02-1996
Assistant Vice President (CE BU) Jeff Chang 07-06-2011
Assistant Vice President (FPL MFG Central Div.) Mano Lo 09-12-2013
Assistant Vice President (CE BU) Ian Douglas French 01-03-2012
Assistant Vice President (Product Development Div.) Eric Lo 17-07-2017
Assistant Vice President (Product Development Div.) Tung-Liang Lin 25-05-1995
Assistant Vice President (Oversea Project) Max Chen 01-02-2013
Director (Finance Center) Patrick Chang 01-02-2017
Deputy Director (Accounting Div.) James Huang 03-12-2013
DIRECTORS AND INDEPENDENT DIRECTORS
Title Name Date Elected
Chairman & CEO Frank Ko, Representative of Aidatek Electronics Inc. 20-06-2017
Director Johnson Lee, Representative of Aidatek Electronics Inc. 20-06-2017
Director Shou-Chung Ho, Representative of Aidatek Electronics Inc. 20-06-2017
Director Felix Ho, Representative of Aidatek Electronics Inc. 20-06-2017
Director CC Tsai, Representative of YFY Inc. 20-06-2017
Director FY Gan, Representative of YFY Inc. 20-06-2017
Independent Director Ten-Chung Chen 20-06-2017
Independent Director Biing-Seng Wu 20-06-2017
Independent Director Chao-Tung Wen 20-06-2017
DIRECTORS AND SUPERVISORS

018

019
REVIEW OF OPERATIONS
Business and Products
Business Scope
1.Primary Content of E Ink's Business Range
E Ink Holdings Inc. is the world leader in ePaper technology, engages in the research, development, manufacturing and sales of display devices
and materials concerning electronic paper (ePaper) technology, e.g., FPL Film and Electronic Paper Display (EPD).
2.Business Percentage
YearProduct
Year 2017
Revenue (NT$1000) Percentage
EPD Modules 11,868,586 78.07%
Electronic Shelf Labels and Others 3,334,748 21.93%
Total 15,203,334 100.00%
3.E Ink's current major products and their applications
Major products are EPD modules, and they can be applied in eReaders, Electronic Shelf Labels (ESL), eNotes, ePaper Mobile devices, Digital
Signage and so on.
4.New Products and Services in the Pipeline
EInk’scurrentproductdevelopmentgoesinthefollowingfivedirections:
A.To take advantage of ePaper’s paper-like quality and strengthen the product development for the reading and hand-writing applications, e.g.,
eReaders, eNotes, etc.
B.To take advantage of ePaper’s low-power consumption and strengthen the product development for IoT applications, e.g., ESLs, mobile
devices, smart homes, and Digital Signage.
C.To continue with the development evaluation kits design, development and all-in-one Turnkey Solutions in order for customers to speed up
their new product integration and develop new applications.
D.Tointroducenewmaterialsandnewmanufacturingprocesses,toenhanceePaper’sproductperformanceandspecificationstocomplywith
market needs, and to strengthen product competiveness.
E.To foster strategic cooperation and horizontal alliances with domestic/overseas companies for shared investment in technology and resources
so as to develop low-power ePaper display technology applications and to build the foundation for sustainable management.

020
Industry Overview
Current State and Development of EPD Industry
The ePaper development can be traced back to early 1970s. In 1996, the Massachusetts Institute of Technology solved the problem of dye
particle condensation with the Microcapsules technology, thereby affirming the development of Electrophoretic Display technology which
contributes to what we know as Electronic Ink today. ePaper technology underwent continuous extensive development, sample trial runs and
limitedproductionandfinally,enteredthemassproductionphasein2008.In2012,EInkHoldingsInc.mergedwithSiPixTechnologyInc.and
acquired the Microcups® in the Electrophoretic Display technology, not only to secure its consistently leading position in technology, to expand
patent deployment, and to invest in ePaper industry on a long term basis, but also to integrate global talents, technologies and resources from
Taiwan, China, the US and Japan, in a bid to complete its deployment in the ePaper technology sector.
ePaper featurespaper-thin, low-power,bistable, readable indirectsunlightandflexibleattributeswithawideviewingangle.Besidesbeing
applied in eReaders, ePaper’s market potential has been well acknowledged, as seen in continuously rising demand for Electronic Shelf Labels,
whose presence has reached all major retailers in the US and Europe. Electronic Shelf Labels also comply with the demand trend for low power
consumption in IoT applications, and we can anticipate a future growth in demand.
Electronic notebooks (eNotes) with an emphasis on reading and writing can be applied in commerce and education markets. Recent cases of
successful commercialization on customers’ end include SONY, reMarkable and OKAY that have launched new products to the market to indicate
eNotes’ increasing market demand.
Applications like Digital Signage and digital walls come in two display modes: full color and Black & White. This has not only entailed a diverse
evolution of conventional advertisement paper but also started a new market for green display technologies. Further, advanced color ePaper, E
Ink PrismTM, can be applied in all kinds of architectures, for instance, digital dynamic architectural sculptures.
As the ePaper technology’s product applications and ecosystem continue to develop, E Ink plays a pivotal role in the overall supply chain and
remains as the industry leader in terms of technology and production capacity via endless innovation and resources investment.
Correlations between the upstream, midstream and downstream of the industry
Upstream Color Pigment, PET Film, TFT Substrate, PI Film, Driving IC, PCB, Front Light Module, Touch Panel
Midstream FPL Film, EPD
Downstream Module Manufacturers, System Manufacturers, Brand Customers
Various Product Development Trends
1. eReader
As times change, along comes rising health consciousness. Consumers have been looking for mobile reading devices that save storage space,
will not harm your eyes and are available anytime anywhere for your reading pleasure. To this end, eReaders no doubt are one of the most
competitive products, their biggest niche being light, compact, easy to carry and not causing eye fatigue after extensive use.
E Ink has been investing and developing eReaders as an ePaper application for many years, teaming up with eReader brands from all over the
world to launch a wide range of eReaders added with a front light plus dust-proof and water-proof features compliant with international
standards. E Ink will continue developing enlarged screen sizes in eReaders. In response to the weight increase indirectly caused by enlarged
screens,EInkhasalsobeencollaboratingwithleadingplayersinmaterialtechnologiestojointlydevelopultra-thinglasssubstratesandflexible
substrates, which will be implemented in future product planning.
2. Electronic Shelf Label ˙ ESL
Thanks to the increasingly mature technology for smart retailing applications, merchandise management and price marking in today’s physical
stores can also rely on Electronic Shelf Labels (ESLs) for real-time updates. Compared with traditional paper tags, Electronic Shelf Labels will
not only reduce pricing errors but also allow stores a fast response mechanism to price changes in a highly competitive market with real-time
promotional pricing updates, while reducing labor cost in manually renewing the price tags. ESLs application can also be extended to smart
inventory management and factory/warehouse logistics, all in compliance with the Industry 4.0 trends: automation and smart management.
Its stable attribute allows ePaper products to draw power only during data inputs or updates. When the displayed information remains un-
updated, it will consume no power. This advantage not only complies with the energy-saving low-power trend but also reduces the electricity
cost for extensive ESLs uses in the malls. Additionally, compared with LCD displays, ePaper offers a close-to-180 degree viewing angle, which
enables clear viewing even from a distance or from a slanted angle.
021
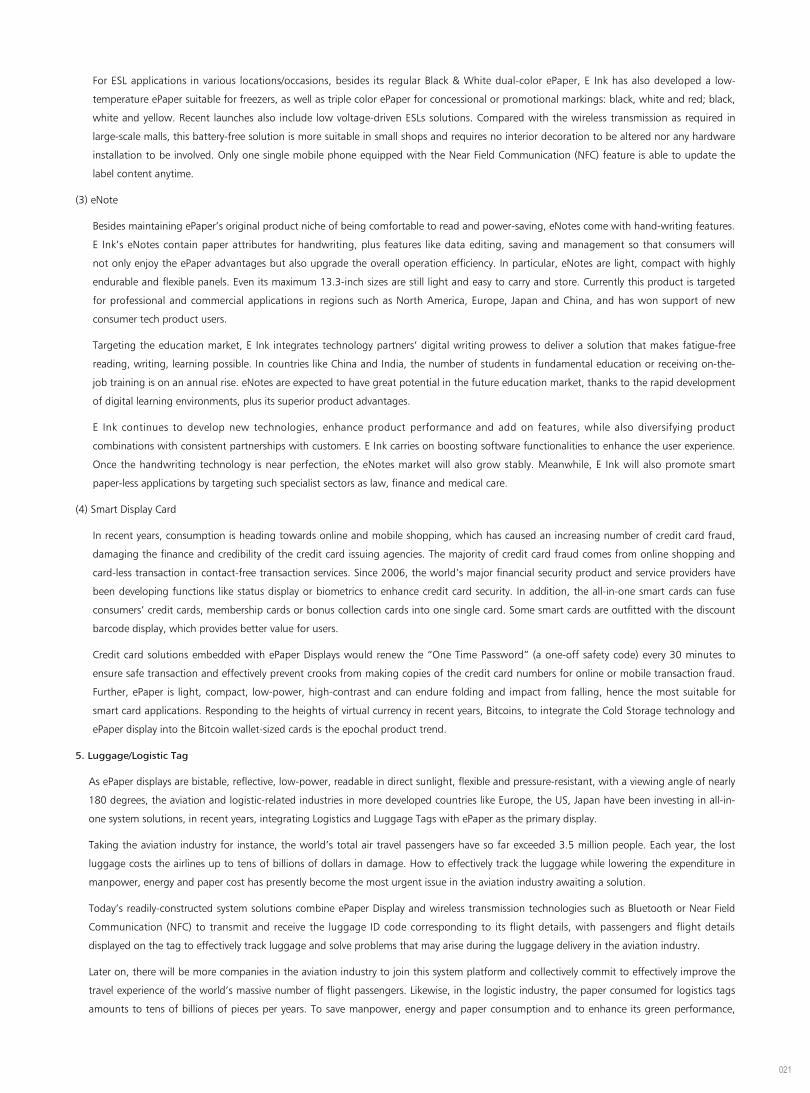
For ESL applications in various locations/occasions, besides its regular Black & White dual-color ePaper, E Ink has also developed a low-
temperature ePaper suitable for freezers, as well as triple color ePaper for concessional or promotional markings: black, white and red; black,
white and yellow. Recent launches also include low voltage-driven ESLs solutions. Compared with the wireless transmission as required in
large-scale malls, this battery-free solution is more suitable in small shops and requires no interior decoration to be altered nor any hardware
installation to be involved. Only one single mobile phone equipped with the Near Field Communication (NFC) feature is able to update the
label content anytime.
(3) eNote
Besides maintaining ePaper’s original product niche of being comfortable to read and power-saving, eNotes come with hand-writing features.
E Ink’s eNotes contain paper attributes for handwriting, plus features like data editing, saving and management so that consumers will
notonlyenjoytheePaperadvantagesbutalsoupgradetheoveralloperationefficiency.Inparticular,eNotesarelight,compactwithhighly
endurableandflexiblepanels.Evenitsmaximum13.3-inchsizesarestilllightandeasytocarryandstore.Currentlythisproductistargeted
for professional and commercial applications in regions such as North America, Europe, Japan and China, and has won support of new
consumer tech product users.
Targeting the education market, E Ink integrates technology partners’ digital writing prowess to deliver a solution that makes fatigue-free
reading, writing, learning possible. In countries like China and India, the number of students in fundamental education or receiving on-the-
job training is on an annual rise. eNotes are expected to have great potential in the future education market, thanks to the rapid development
of digital learning environments, plus its superior product advantages.
E Ink continues to develop new technologies, enhance product performance and add on features, while also diversifying product
combinations with consistent partnerships with customers. E Ink carries on boosting software functionalities to enhance the user experience.
Once the handwriting technology is near perfection, the eNotes market will also grow stably. Meanwhile, E Ink will also promote smart
paper-lessapplicationsbytargetingsuchspecialistsectorsaslaw,financeandmedicalcare.
(4) Smart Display Card
In recent years, consumption is heading towards online and mobile shopping, which has caused an increasing number of credit card fraud,
damagingthefinanceandcredibilityofthecreditcardissuingagencies.Themajorityofcreditcardfraudcomesfromonlineshoppingand
card-lesstransactionincontact-freetransactionservices.Since2006,theworld’smajorfinancialsecurityproductandserviceprovidershave
been developing functions like status display or biometrics to enhance credit card security. In addition, the all-in-one smart cards can fuse
consumers’creditcards,membershipcardsorbonuscollectioncardsintoonesinglecard.Somesmartcardsareoutfittedwiththediscount
barcode display, which provides better value for users.
Credit card solutions embedded with ePaper Displays would renew the “One Time Password” (a one-off safety code) every 30 minutes to
ensure safe transaction and effectively prevent crooks from making copies of the credit card numbers for online or mobile transaction fraud.
Further, ePaper is light, compact, low-power, high-contrast and can endure folding and impact from falling, hence the most suitable for
smart card applications. Responding to the heights of virtual currency in recent years, Bitcoins, to integrate the Cold Storage technology and
ePaper display into the Bitcoin wallet-sized cards is the epochal product trend.
5. Luggage/Logistic Tag
AsePaperdisplaysarebistable,reflective,low-power,readableindirectsunlight,flexibleandpressure-resistant,withaviewingangleofnearly
180 degrees, the aviation and logistic-related industries in more developed countries like Europe, the US, Japan have been investing in all-in-
one system solutions, in recent years, integrating Logistics and Luggage Tags with ePaper as the primary display.
Taking the aviation industry for instance, the world’s total air travel passengers have so far exceeded 3.5 million people. Each year, the lost
luggage costs the airlines up to tens of billions of dollars in damage. How to effectively track the luggage while lowering the expenditure in
manpower, energy and paper cost has presently become the most urgent issue in the aviation industry awaiting a solution.
Today’s readily-constructed system solutions combine ePaper Display and wireless transmission technologies such as Bluetooth or Near Field
Communication (NFC) to transmit and receive the luggage ID code corresponding to its flight details, with passengers and flight details
displayed on the tag to effectively track luggage and solve problems that may arise during the luggage delivery in the aviation industry.
Later on, there will be more companies in the aviation industry to join this system platform and collectively commit to effectively improve the
travelexperienceoftheworld’smassivenumberofflightpassengers.Likewise,inthelogisticindustry,thepaperconsumedforlogisticstags
amounts to tens of billions of pieces per years. To save manpower, energy and paper consumption and to enhance its green performance,

022
many logistics-related companies are working on how to switch the current practice of traditional logistic tags to ePaper applications and
fuse with wireless transmission systems for all-in-one solutions featuring central control and monitor of stock status. To combine luggage
and logistics tags will save paper, energy consumption, manpower resources in switching tags, as well as enabling remote surveillance on the
luggage and stocks to drastically lower the overall cost in travel/logistic time, money and speed. This has become the inevitable trend in the
future global aviation and logistic industries.
6. Mobile Device
Forthedual-screenapplication,in2018,wewillseetheproductreleaseofthefirsteditionofTablet-and-NBfusion,initiatingEPDintothe
innovative product sector of PC Convertibles, offering the new user experience of the 3-in-1 features: dynamic keyboards, handwriting and
reading. Wearable products will continue to feature ePaper attributes: always-on, low-power, readable outdoors, and further integrate
traditional watches with rotating hands for the Hybrid watch sector in a bid to pioneer new user experience and product ranges.
E Ink will cultivate on the two major market applications: consumer and commercial devices. On the end products of consumer electronics,
E Ink expects the Hybrid smart watches designed for the wearable device market to entail great potential in demand, because this kind of
products retains the design elements of traditional watches, and the watch following the hand wrist curves can be read under any light
sources. The data on the watch face will stay visible without disappearing with added smart elements like Bluetooth connection, information
streaming, plus long-lasting inbuilt battery which will run for one month once fully charged. ePaper is therefore a highly viable option for
display devices.
Ontheotherhand,forcommercialapplications,ePaper’sflexible, low-power,continuousdisplayattributescatertocustomerneedsfrom
the fashion design and medical care. For instance, in fashion design, ePaper can be used as creation materials and turned into technology-
integrated garments.
7. Digital Signage
It is extremely valuable to provide useful and precise information at the right moment. Under such premises, Digital Signage has become an
industry worth several billions of dollars. Drawing on the strength of ePaper’s existing low-power, readable in direct sunlight and paper-like
attributes, E Ink has secured a highly favorable position in the Digital Signage market.
Digital Signage can be widely applied in various public places, e.g., public transportation, gas stations, retailers, education industry, health &
care industry, museums and libraries. In direct sunlight, ePaper Digital Signage is clearly readable, can be driven by solar power supply systems
and has the frames of images renewed/updated via mobile phone’s remote online networks. As such, ePaper Digital Signage is suitable for
installation in remote areas or places with no power lines.
The environmental impact is an important consideration for commercial users and governmental agencies during their evaluation of Digital
Signage installation. ePaper’s attribute of exceptionally low power consumption makes ePaper Digital Signage a great green product
regarding environmental sustainability issues. ePaper Digital Signage System’s simple design requires no components or parts for fans and
air conditioners, enabling lighter, more compact and easier installation. Under certain circumstances, they can even be installed onto existing
infrastructures to for immense cost reduction in installation and maintenance, plus speedy installation.
Digital Signage installations are mostly solutions that span over several years. Its Total Cost of Ownership (TCO) is the key factor that
determines the Return on Investment (ROI). Owing to its extremely low cost in power consumption and maintenance, easy installation, and
long-standing reliability, ePaper Digital Display serves as a sustainable solution offering both TCO and fantastic outdoor readability. As the
demand continues to grow for Digital Signage, plus E Ink’s product advantages in the market, Digital Signage is expected to contribute
significantlytowardstherevenueforthenextfewyears.
Currently, the growing demand for Digital Signage can be seen mostly in Europe, North America, South America and Asia. Most display signs
are still static paper products and rely on manual switch. The need to replace such displays has propelled the growth of Digital Signage. In the
meantime, E Ink has secured a great position in this continuously growing Digital Signage market.
With EDP at the core, E Ink’s technology partners continue to add on value to EDP products. We expect the Digital Signage’s application
market will carry on expanding, and we will work with customers of various sectors to enhance our product and technology visibility and sales
growth in the market.

023
8. Architecture
In 2017, the market continued to give focus to the E Ink PrismTM technology. Given the new market and media promotion, E Ink PrismTM has
received media exposure in over 40 specialist paper publications and on multi-national televisions, as well as winning the recognition and
recommendation of the French haute couture designer, Jean Paul Gaultier. As a design material, E Ink PrismTM along with our collaborative
partners has gone on trade fairs such as the Retail Tech Japan for retailer applications and the Japan Shop for high-end goods and the
ArabHealth in Dubai for international medical equipment.
Looking back on the 2017, E Ink teamed up with San Diego International Airport and the Ueberall International to create the world’s biggest
ePaper architectural decorative art, DAZZLE, on the outer wall of the San Diego International Airport, US. E Ink PrismTM’s programmability,
coupled with wireless transmission technology, enables back-stage control for each tile and brick on the DAZZLE wall and automatic rotation
of over 25 different animated images. DAZZLE also serves to showcase E Ink PrismTM’s IoT-connected creative prowess.
E Ink will continue to work with key partners, integrate E Ink PrismTM for further applications and launch a series of key products, including
new software platforms and E Ink PrismTM modules as control components whose release is expected by yearend of 2018. Designers and
manufacturers of relevant sectors will, as a result, have a better grasp of what a wide range of designs that E Ink PrismTM can present in
products.
Competition Updates
E Ink has secured an absolute leading position in the global market of ePaper technology and products. In the market of eReaders as EPD
application, E Ink owns more than 95% of the market share. The world’s major eReader brand suppliers, e.g., Amazon, kobo, all use E Ink-
produced EPD. ePaper for Electronic Shelf Labels applications has in recent years gradually replaced LCD displays, with its penetration rate rising
by the year, due to ePaper’s attributes and advantages. Further, regarding eNotes as an EPD application, E Ink has also partnered with the likes of
SONY and reMarkable to release a host of products which are all market leaders.
E Ink has the fundamentals of managing this type of markets for many years, plus top research and development teams, so E Ink has
undoubtedly a great competitive edge in terms of future technology research and product development.
Research and Development Overview
E Ink continued its commitment to the development of EPD products and technologies. In addition to continuously advance the EPD module
technology,wearealsodevotedtotheinnovationofcolorEPDtechnology.Leveragingtheknow-howofelectronicshelf label,flexibledisplay
and touch panel, our new products received very positive market feedback. Meanwhile, we expanded the manufacturing capacity to maintain our
leadershipintheEPDmarket.InYear2016,2017andfirstquarterin2018,EInk’sconsolidatedresearchanddevelopmentexpensewasNT$1.85
billion, NT$ 1.94 billion and NT$0.49 billion.
1. ePaper Technology
E Ink CartaTM is the latest generation of the mass-produced ePaper. E Ink CartaTMhasthehighestreflectivitytodate,with50%highercontrast
ratioand22%higherreflectivitycomparedtoEInkPearlTM, the previous E Ink product. E Ink CartaTM is lightweight, environmentally friendly
and can be comfortably read for extended periods of time, making it suitable for eReaders, digital dictionaries, reference books, magazines
and other future products to replace the traditional printed paper. E Ink CartaTM allows readers to enjoy the convenience of digital products
withoutsacrificingthereadingexperienceprovidedbyprintedmaterials. In2015,EInkupgradedtheePapertechnologytoCartaTM 1.2 for
sharper image quality.
2. Advanced Color ePaper (ACeP) Technology
EInklaunchedACeP,ahighquality,fullcolorreflectivedisplay.Forthefirsttimeever,anEPDcanproducefullcolorgamutwithouttheuseof
acolorfilterarraybyhavingallthecoloredpigmentsineverypixel.ACePsetsanewstandardforbright,reflectivecolorachievablewithEPDs.
Thiseliminatesthelightattenuation,whichcanbequitesignificant.LikeregularEInkePaper,ACePmaintainstheultra-low-powerandpaper-
like readability under all lighting conditions.

024
3. Three Pigment ePaper Technology
E Ink SpectraTM is the latest generation of mass-produced multi-colored E Ink product. In addition to black and white pigments, E Ink
SpectraTM includes an additional red or yellow pigment, making it suitable for the application of electronic shelf labels and advertising displays.
Retailers can easily change the product price, enabling dynamic pricing. Moreover, the third color can be remotely activated to display
promotion and sale items dynamically. Combining with red or yellow backgrounds, the electronic shelf labels can draw consumer’s attention
to enhance product marketability. E Ink SpectraTM supports both active matrix and segmented systems to meet different retailers’ requirement.
The three pigment EPD can also be employed for ID cards in industrial, smart card and medical applications.
4. Color Changing Film for Architecture and Art Design
E Ink PrismTM is the latest dynamic color display technology ideally suited for the architecture and art design applications. Besides being a
static display technology without consuming power, E Ink PrismTM can also support dynamic presentation. Coupled with motion sensing,
E Ink PrismTM can completely transform a lifeless space into an interactive environment. This innovation enables architects and designers to
express their ideas by presenting space and surroundings in a unique manner. The revolutionary way of applying E Ink PrismTM gives architects
anddesignersmoreflexibilityandfreedom.Inacommercialbuilding,ahotellobby,anairport,atransitstationorastadium,architectsand
designers can change the appearance of the venue by E Ink PrismTM to enhance people’s perception through color transformation.
5. Flexible EPD
E Ink MobiusTM isaflexibleEPDwithflexibleplasticbackplanesofeitheramorphoussiliconororganicTFT.Theflexibledisplaytechnology
enablescustomerstointegrateconformalelementintoproductdesign,leadingtoendproductswithuniquedesignandfunction.Theflexible
EPDdevicehasbeenmass-producedandintroducedinthemarket.Usingaplasticsubstrate,theflexibleEPDmoduleisthinner,lighterand
shatter proof compared to its glass counterpart. Such features become more important as the display grows larger. We have collaborated with
leading companies to develop and mass produce E Ink MobiusTM EPD products, which have received positive feedbacks from the market. Such
eco-friendly and power saving E Ink MobiusTM EPD will have great potential to grow in the near future.
6. Front Light and Touch Panel Technologies
Reading under dim light is a common requirement of eReader, which can be realized by integrating front light on top of eReaders. In addition,
we have developed a color-temperature-modulation technology of the front light, which allows consumers to adjust the color temperature
of the eReader from a cooler color to a warmer color, or vice versa, depending on their personal preference. In addition to the commonly
adopted capacitive touch technology, we have been actively working with partners to develop touch panels for EPDs. These new touch panel
modulesnotonlymaintainthereflectivityofEPD,butalsoofferotherdesignbenefitstosupportnewproductdevelopments.
7. EPD with Energy Harvesting Technology
The ultra-low power consumption feature of EPD makes it possible to adopt the wireless energy harvesting technology to drive a low-voltage
EPDmodule.ThesmallamountoftheelectricitygeneratedbywirelesstransmissionissufficienttodriveandrefreshtheEPDwithouttheneed
of a battery. The technology supports both the Near Field Connection (NFC) at 13.56 MHz and the ultra-high frequency (UHF) at 915 MHz for
short and long distance applications, respectively, which are in complete compliance with the mainstream wireless communication protocols.
For the short distance application, the EPD modules can be used in an eWallet, Smart Display Cards, as well as eReaders or smart watches with
an NFC receiver. For the long distance application, the EPD with the UHF RFID reader can be used in a transportation system, ESL, eLuggage
Tag for logistics, warehouse automation system, smart home, eBulletin and Digital Signage.

025
Long-Term and Short-Term Sales Development Plan
1. Short-Term Sales Development Plan
(1) To follow current product plans, to promote standardized products, to upgrade the current products’ performance and to provide all-in-
one systematic solutions.
(2) To enhance product quality, to provide more comprehensive manufacturing services so as to win over the custom of more major
international players.
(3) To establish local support services for the US, Europe, China and Japan, and strengthen distribution channels.
2. Long-Term Sales Development Plan
(1) To put research and development resources on ACeP, Flexible, Low-Power technologies and strengthen processing capabilities, while
continuing to complete the patent deployment to maintain the leading position.
(2) To continue promoting the new application market and cultivating on its ecosystem, to integrate the upstream and downstream industries
and to jointly develop products and applications with more value and more features.
(3) To build a highly-efficient marketing operation model, to combine marketing channels, products, research and development, and
production for seamless team collaboration that will effectively support the commercial development and facilitate a win-win relationship
between E Ink and customers.
Market, Manufacturing & Sales Overview
Supply and Growth in the ePaper Market
E Ink’s diverse market development strategies continue to optimize customer combinations. ePaper technology features such core attributes and
advantagesthatothertypesofdisplaytechnologiescannotoffer:paper-liketexture, low-powerconsumption,flexibleandreadable indirect
sunlight. Compared with regular self-illuminating display technologies, ePaper’s unique niches allow E Ink to direct its business towards emerging
markets and application sectors. With long-standing cultivation, ePaper applications are expected to create stable growth in all kinds of smart
spheres.
Electronic Shelf Labels (ESLs) are the spotlight market in 2017 and 2018. In the past decade or so, ESLs are E Ink’s key development sector and
have grown rapidly in recent years as expected. Markets like Digital Signage, eNotes and architectural applications continue to develop and
mature, while emerging applications like smart packaging and medical care are seeing preliminary results.
E Ink can see a huge innovative prowess on customers, collaborative partners and employees. To manifest such innovative prowess, E Ink in 2017
launched a new brand message: “E Ink, Creativity On Display” and will continue to spread such a message in ePaper technology promotion so as
to stimulate a wider range of ePaper application possibilities.
Customer Feedbacks and Participation
Looking back on 2017, E Ink promoted the advanced technology and all kinds of ePaper Display applications by taking part in and inviting
collaborative partners to attend the world’s professional key trade fairs concerning electronic technologies and display devices, including CES,
Flex, DSE, SEGD, NeoCon, SID, Touch Taiwan and MWC Shanghai. E Ink also worked closely with online marketing strategies such as new
editions of corporate websites with intuitive operation interface, promoted ePaper and its applications via key social media such as Weibo,
Instagram, LinkedIn and Facebook, and combined customers’ marketing resources for joint promotion in order for target customers and the
general public to better understand E Ink’s business and for better sales development. Meanwhile in 2017, E Ink launched a series of ePaper
module development evaluation kits built-in with basic software interface, which are available on online stores. The development evaluation kits
serve as a reference for interested R&D and product development engineers, helping them to fast integrate ePaper solutions while creating more
ePaper application possibilities.

026
Competitive Niches
ePaper Technology Advantages: ePaper’s bistable, non-self-illuminating, paper-like texture attributes are advantages unobtainable by traditional
LCD/LED-based display technologies. These attributes offer various opportunities for smart display interface integration and enable ePaper
applications and customers’ end products to depart from the frame and boundary of traditional display devices, thus carving out a unique
competitive position in the market.
To carry on strengthening the research and development energy: E Ink continues to invest research and development resources in the ePaper
sector, its annual research and development expenditure taking up a higher percentage of the revenue than the industry average. E Ink’s research
and development personnel are placed all over the world, their expertise covering materials, chemistry, electrical and electronics engineering,
and mechanical engineering. E Ink is also the industry leader in ePaper patents. All above are factors that have sustained E Ink’s long-standing
position as a technology leader.
To shorten the customer’s ePaper integration time: many of E Ink’s customers are situated in the highly competitive consumer electronics and
industrial applications market and require shorter product design cycles in response to the rapidly changing market. E Ink has successfully
launched many ePaper design and development evaluation kits and all-in-one Turnkey Solutions so that customers can speed up the new product
integration and new application development and help the product development personnel in the customer end to easily apply ePaper in their
product design.

027
Favorable/Unfavorable Factors for the Future Prospect and Our Responsive Strategies
E Ink’s primary challenge is how to lower the cost to meet market expectations and satisfy supply needs. E Ink’s response is to reduce design cost
via research and development and lower production cost via automation. Besides ensuring the effective increase of FPL production capacity, E Ink
will also deepen the collaborative relationships with material partners to make sure our production capacity will meet market demands.
In terms of competitors, other reflective display technologies are currently still in the research and development pipeline, not yet ready for
commercialization from production capacity and cost perspectives, and therefore posing less of a threat to ePaper. On the other hand, regular
self-illuminating display technology will remain as a competitive rival in the market. Chinese manufacturers’ rising capacity in producing outdoors
LED display indicates the display market will soon enter a price war. In fact, the price of white-light LED display shows that displays have been
freed from traditional red-light and green-light limitations, thus getting a foothold in the mainstream market and attracting certain customers
thatmayalso likethetextureofePaperDisplays.Assuch,ePaper’spaper-likecomfytexture,flexiblebackplanes,anddrasticallyreducedTotal
Cost of Ownership (TCO) by low-power consumption over a long period of time, are the three key factors that contribute to ePaper’s sustained
competitiveness in the market.
The performance of TFT LCD displays is being upgraded all the time. For instance, TFT LCD’s 4K and quantum dot display technology will keep
TFTLCDastheleaderindisplaytechnologies.The4KspecificationwilleliminatethegapbetweenTFTLCDandePaper’shigh-resolution300ppi
niche.OLEDisoneofePaper’srarecompetitorsinflexibledisplaytechnologies.Yet,non-self-illuminatingePaperandself-illuminatingOLEDare
technologies that cannot replace each other. Therefore OLED is not much of a threat to ePaper so far.
Moreover, in the industry and in the market, there are corporates researching, developing and promoting technologies relevant to ePaper.
However, E Ink as the ePaper industry leader has mature technologies as the niche, capable of large-scale technologies and mass production. So,
other competitors have not yet caused much negative impact on E Ink’s business.

028

029
E INK HOLDINGS INC. AND SUBSIDIARIES Consolidated Financial Statements for theYears Ended December 31, 2017 and 2016 andIndependent Auditors’ Report

- 2 -
REPRESENTATION LETTER OF COMBINED FINANCIAL STATEMENTS OF AFFILIATES
The entities that are required to be included in the combined financial statements of E Ink Holdings Inc. as of
and for the year ended December 31, 2017, under the Criteria Governing the Preparation of Affiliation Reports,
Consolidated Business Reports and Consolidated Financial Statements of Affiliated Enterprises are the same as
those included in the consolidated financial statements prepared in conformity with the International Financial
Reporting Standard 10, “Consolidated Financial Statements.” In addition, the information required to be
disclosed in the combined financial statements is included in the consolidated financial statements.
Consequently, E Ink Holdings Inc. and its subsidiaries do not prepare a separate set of combined financial
statements.
Very truly yours,
E INK HOLDINGS INC.
By:
Frank Ko
Chairman
March 27, 2018

- 3 -
INDEPENDENT AUDITORS’ REPORT
The Board of Directors and Shareholders
E Ink Holdings Inc.
Opinion
We have audited the accompanying consolidated financial statements of E Ink Holdings Inc. and subsidiaries
(the Group), which comprise the consolidated balance sheets as of December 31, 2017 and 2016, and the
consolidated statements of comprehensive income, changes in equity and cash flows for the years then ended,
and the notes to the consolidated financial statements, including a summary of significant accounting policies.
In our opinion, the accompanying consolidated financial statements present fairly, in all material respects, the
consolidated financial position of the Group as of December 31, 2017 and 2016, and its consolidated financial
performance and its consolidated cash flows for the years then ended in accordance with the Regulations
Governing the Preparation of Financial Reports by Securities Issuers, and International Financial Reporting
Standards (IFRS), International Accounting Standards (IAS), IFRIC Interpretations (IFRIC), and SIC
Interpretations (SIC) endorsed and issued into effect by the Financial Supervisory Commission of the Republic
of China.
Basis for Opinion
We conducted our audits in accordance with the Regulations Governing Auditing and Attestation of Financial
Statements by Certified Public Accountants and auditing standards generally accepted in the Republic of China.
Our responsibilities under those standards are further described in the Auditors’ Responsibilities for the Audit of
the Consolidated Financial Statements section of our report. We are independent of the Group in accordance
with The Norm of Professional Ethics for Certified Public Accountant of the Republic of China, and we have
fulfilled our other ethical responsibilities in accordance with these requirements. We believe that the audit
evidence we have obtained is sufficient and appropriate to provide a basis for our opinion.
Key Audit Matters
Key audit matters are those matters that, in our professional judgment, were of most significance in our audit of
the consolidated financial statements for the year ended December 31, 2017. These matters were addressed in
the context of our audit of the consolidated financial statements as a whole, and in forming our opinion thereon,
and we do not provide a separate opinion on these matters.
Key audit matters for the Group’s consolidated financial statements for the year ended December 31, 2017 are
stated as follows:
Impairment of Goodwill
As disclosed in Notes 4 and 16 as well as Table 7 to the consolidated financial statements, the Group’s goodwill
was arisen from acquiring related subsidiaries to obtain electronic ink research and development and
manufacturing centers, as well as to integrate patents of ePaper techniques. The amount of goodwill is
material to the overall consolidated financial statements, therefore, management annually accesses the
impairment of goodwill in accordance with the IAS 36 “Impairment of Assets”.

- 4 -
Management assesses goodwill for any impairment by comparing the carrying amount with the calculated
recoverable amount as assessed based on the entire consolidated financial statements of the subsidiaries. In
order to perform the assessment, management needs to estimate future operating cash flows allocated to the
subsidiaries and determine their suitable discount rates to calculate the recoverable amount. When determining
future operating cash flows, management considers the forecasted growth rate of sales and profit rate, etc. based
on future operating perspective of the subsidiaries to calculate weighted average cost of capital as their discount
rates. Since the major assumptions are subject to management’s judgement and may be variable to future
market or prosperity of economy, which has its uncertainty, the impairment of goodwill has been identified as a
key audit matter.
Our key audit procedures performed in respective of the above area included the following:
1. Understood the related process and controls that management used to assess the impairment of goodwill,
including basis of assumptions and source of the data used in evaluation.
2. Evaluated whether management has taken into account the Group’s recent operating performance and its
industry conditions when estimating future growth of sales and profit rate to assess their achievability.
3. Evaluated the reasonableness of the discount rates that management used, and re-performed to check the
calculation.
Impairment of Inventories
As disclosed in Notes 4 and 12 to the consolidated financial statements, inventories of the Group are stated at
the lower of cost or net realizable value. Management estimates net realizable value based on current market
conditions and historical experience with product sales of a similar nature. Impairment is recognized on
inventories without any moving for certain periods. Rapid changes in the development of technology and
market conditions may have influence on the estimation, and results in obsolete and aged inventories.
Consequently, impairment of inventories has been identified as a key audit matter.
Our key audit procedures performed in respective of the above area included the following:
1. Understood management’s accounting policy and method of calculation of obsolete and aged inventories,
and inquired if there were significant issues in the current year that would impact the accounting treatment.
2. Evaluated the process and basis on management’s decision on the impairment ratio of obsolete and aged
inventories, and examined the conditions of obsolete and aged inventories when performing inventories
physical counts, to confirm the reasonableness of impairment recognized on inventories.
3. Acquired inventory aging reports and, with the assistance of our internal computer audit specialists, tested
the consistency of inventories movement with management’s estimation.
Other Matter
We have also audited the financial statements of E Ink Holdings Inc. as of and for the years ended December 31,
2017 and 2016, on which we have issued an unmodified opinion.
- 5 -
Responsibilities of Management and Those Charged with Governance for the Consolidated Financial
Statements
Management is responsible for the preparation and fair presentation of the consolidated financial statements in
accordance with the Regulations Governing the Preparation of Financial Reports by Securities Issuers, IFRS,
IAS, IFRIC, and SIC endorsed and issued into effect by the Financial Supervisory Commission of the Republic
of China, and for such internal control as management determines is necessary to enable the preparation of
consolidated financial statements that are free from material misstatement, whether due to fraud or error.
In preparing the consolidated financial statements, management is responsible for assessing the Group’s ability
to continue as a going concern, disclosing, as applicable, matters related to going concern and using the going
concern basis of accounting unless management either intends to liquidate the Group or to cease operations, or
has no realistic alternative but to do so.
Those charged with governance, including members of the audit committee, are responsible for overseeing the
Group’s financial reporting process.
Auditors’ Responsibilities for the Audit of the Consolidated Financial Statements
Our objectives are to obtain reasonable assurance about whether the consolidated financial statements as a
whole are free from material misstatement, whether due to fraud or error, and to issue an auditors’ report that
includes our opinion. Reasonable assurance is a high level of assurance, but is not a guarantee that an audit
conducted in accordance with the auditing standards generally accepted in the Republic of China will always
detect a material misstatement when it exists. Misstatements can arise from fraud or error and are considered
material if, individually or in the aggregate, they could reasonably be expected to influence the economic
decisions of users taken on the basis of these consolidated financial statements.
As part of an audit in accordance with the auditing standards generally accepted in the Republic of China, we
exercise professional judgment and maintain professional skepticism throughout the audit. We also:
1. Identify and assess the risks of material misstatement of the consolidated financial statements, whether due
to fraud or error, design and perform audit procedures responsive to those risks, and obtain audit evidence
that is sufficient and appropriate to provide a basis for our opinion. The risk of not detecting a material
misstatement resulting from fraud is higher than for one resulting from error, as fraud may involve
collusion, forgery, intentional omissions, misrepresentations, or the override of internal control.
2. Obtain an understanding of internal control relevant to the audit in order to design audit procedures that are
appropriate in the circumstances, but not for the purpose of expressing an opinion on the effectiveness of
the Group’s internal control.
3. Evaluate the appropriateness of accounting policies used and the reasonableness of accounting estimates
and related disclosures made by management.
4. Conclude on the appropriateness of management’s use of the going concern basis of accounting and, based
on the audit evidence obtained, whether a material uncertainty exists related to events or conditions that
may cast significant doubt on the Group’s ability to continue as a going concern. If we conclude that a
material uncertainty exists, we are required to draw attention in our auditors’ report to the related
disclosures in the consolidated financial statements or, if such disclosures are inadequate, to modify our
opinion. Our conclusions are based on the audit evidence obtained up to the date of our auditors’ report.
However, future events or conditions may cause the Group to cease to continue as a going concern.
5. Evaluate the overall presentation, structure and content of the consolidated financial statements, including
the disclosures, and whether the consolidated financial statements represent the underlying transactions and
events in a manner that achieves fair presentation.

- 6 -
6. Obtain sufficient and appropriate audit evidence regarding the financial information of the entities or
business activities within the Group to express an opinion on the consolidated financial statements. We
are responsible for the direction, supervision, and performance of the group audit. We remain solely
responsible for our audit opinion.
We communicate with those charged with governance regarding, among other matters, the planned scope and
timing of the audit and significant audit findings, including any significant deficiencies in internal control that
we identify during our audit.
We also provide those charged with governance with a statement that we have complied with relevant ethical
requirements regarding independence, and to communicate with them all relationships and other matters that
may reasonably be thought to bear on our independence, and where applicable, related safeguards.
From the matters communicated with those charged with governance, we determine those matters that were of
most significance in the audit of the consolidated financial statements for the year ended December 31, 2017,
and are therefore the key audit matters. We describe these matters in our auditors’ report unless law or
regulation precludes public disclosure about the matter or when, in extremely rare circumstances, we determine
that a matter should not be communicated in our report because the adverse consequences of doing so would
reasonably be expected to outweigh the public interest benefits of such communication.
The engagement partners on the audit resulting in this independent auditors’ report are Ya-Ling Wong and
Chih-Ming Shao.
Deloitte & Touche
Taipei, Taiwan
Republic of China
March 27, 2018
Notice to Readers
The accompanying consolidated financial statements are intended only to present the consolidated financial
position, financial performance and cash flows in accordance with accounting principles and practices
generally accepted in the Republic of China and not those of any other jurisdictions. The standards,
procedures and practices to audit such consolidated financial statements are those generally applied in the
Republic of China.
For the convenience of readers, the independent auditors’ report and the accompanying consolidated financial
statements have been translated into English from the original Chinese version prepared and used in the
Republic of China. If there is any conflict between the English version and the original Chinese version or any
difference in the interpretation of the two versions, the Chinese-language independent auditors’ report and
consolidated financial statements shall prevail.

- 7 -
E INK HOLDINGS INC. AND SUBSIDIARIES
CONSOLIDATED BALANCE SHEETS
DECEMBER 31, 2017 AND 2016
(In Thousands of New Taiwan Dollars)
2017 2016
ASSETS Amount % Amount %
CURRENT ASSETS
Cash and cash equivalents (Notes 4 and 6) $ 11,878,649 33 $ 8,564,749 26
Financial assets at fair value through profit or loss (Notes 4 and 7) - - 405,325 1
Debt investments with no active market (Notes 4 and 10) 519,209 1 435,596 1
Accounts receivable (Notes 4, 11 and 30) 2,009,800 6 1,625,716 5
Other receivables (Note 4) 325,740 1 243,369 1
Current tax assets (Notes 4 and 23) 315,229 1 425,835 1
Inventories (Notes 4 and 12) 2,143,359 6 1,461,343 4
Prepayments (Note 30) 220,007 1 240,633 1
Non-current assets held for sale (Notes 4 and 13) - - 973,212 3
Other financial assets (Notes 4 and 6) 199,391 - 23,244 -
Other current assets (Note 31) 136,356 - 308,200 1
Total current assets 17,747,740 49 14,707,222 44
NON-CURRENT ASSETS
Available-for-sale financial assets (Notes 4 and 8) 2,749,317 8 1,787,015 5
Financial assets measured at cost (Notes 4 and 9) 267,981 1 300,255 1
Investments accounted for using the equity method (Notes 4 and 30) 88,756 - 114,291 -
Property, plant and equipment (Notes 4, 13 and 15) 4,752,982 13 5,319,822 16
Goodwill (Notes 4 and 16) 6,702,636 19 6,907,594 21
Other intangible assets (Notes 4 and 16) 1,889,153 5 2,270,881 7
Deferred tax assets (Notes 4 and 23) 1,425,249 4 1,689,278 5
Other non-current assets (Notes 30 and 31) 252,106 1 317,205 1
Total non-current assets 18,128,180 51 18,706,341 56
TOTAL $ 35,875,920 100 $ 33,413,563 100
LIABILITIES AND EQUITY
CURRENT LIABILITIES
Short-term borrowings (Note 17) $ 377,600 1 $ 451,500 1
Notes and accounts payable (Note 30) 2,201,116 6 1,136,394 3
Other payables (Notes 18 and 27) 1,641,420 5 1,264,464 4
Current tax liabilities (Notes 4 and 23) 153,649 - 74,052 -
Provisions (Notes 4, 13 and 19) 637,781 2 482,188 2
Receipts in advance (Note 4) 1,701,659 5 1,528,641 5
Current portion of long-term borrowings (Note 17) 117,993 - 129,000 -
Other current liabilities 40,334 - 77,711 -
Total current liabilities 6,871,552 19 5,143,950 15
NON-CURRENT LIABILITIES
Long-term borrowings (Note 17) 45,545 - 170,981 1
Deferred revenue - non-current (Note 4) 1,607,917 5 906,903 3
Net defined benefit liabilities (Notes 4 and 20) 70,350 - 64,470 -
Other non-current liabilities (Notes 4, 23 and 30) 53,661 - 38,120 -
Total non-current liabilities 1,777,473 5 1,180,474 4
Total liabilities 8,649,025 24 6,324,424 19
EQUITY ATTRIBUTABLE TO OWNERS OF THE COMPANY (Notes 4, 21, 25 and 26)
Share capital 11,404,677 32 11,404,677 34
Capital surplus 10,108,119 28 10,071,683 30
Retained earnings
Legal reserve 1,304,481 4 1,113,687 3
Special reserve 70,678 - 70,678 -
Unappropriated earnings 4,246,203 12 4,301,134 13
Total retained earnings 5,621,362 16 5,485,499 16
Other equity 106,609 - 488,620 2
Treasury shares (308,269) (1) (360,464) (1)
Total equity attributable to owners of the Company 26,932,498 75 27,090,015 81
NON-CONTROLLING INTERESTS (Notes 21 and 26) 294,397 1 (876) -
Total equity 27,226,895 76 27,089,139 81
TOTAL $ 35,875,920 100 $ 33,413,563 100
The accompanying notes are an integral part of the consolidated financial statements.

- 8 -
E INK HOLDINGS INC. AND SUBSIDIARIES
CONSOLIDATED STATEMENTS OF COMPREHENSIVE INCOME
FOR THE YEARS ENDED DECEMBER 31, 2017 AND 2016
(In Thousands of New Taiwan Dollars, Except Earnings Per Share)
2017 2016
Amount % Amount %
OPERATING REVENUE (Notes 4 and 30) $ 15,203,334 100 $ 14,006,206 100
OPERATING COSTS (Notes 12, 22 and 30) 8,918,918 59 8,885,660 64
GROSS PROFIT 6,284,416 41 5,120,546 36
OPERATING EXPENSES (Notes 22 and 30)
Selling and marketing expenses 728,467 5 528,498 4
General and administrative expenses 2,517,180 16 2,684,352 19
Research and development expenses 1,936,382 13 1,847,108 13
Total operating expenses 5,182,029 34 5,059,958 36
INCOME FROM OPERATIONS 1,102,387 7 60,588 -
NON-OPERATING INCOME AND EXPENSES
(Note 4)
Interest income (Note 30) 90,819 - 74,546 -
Royalty income 2,606,703 17 2,254,572 16
Dividend income 100,951 1 74,702 -
Other income (Note 30) 99,243 1 75,260 1
Interest expense (Note 15) (24,895) - (29,677) -
Net gain on disposal of property, plant and
equipment 50,317 - 26,427 -
Net gain (loss) on foreign currency exchange
(Note 33) (728,477) (5) 105,185 1
Net gain on fair value change of financial assets at
fair value through profit or loss 101,591 1 268 -
Impairment loss (Notes 15 and 30) (21,672) - (178,170) (1)
Other expenses (38,956) - (55,177) -
Total non-operating income and expenses 2,235,624 15 2,347,936 17
INCOME BEFORE INCOME TAX FROM
CONTINUING OPERATIONS 3,338,011 22 2,408,524 17
INCOME TAX EXPENSE (Notes 4 and 23) (405,713) (3) (350,615) (2)
NET INCOME FROM CONTINUING OPERATIONS 2,932,298 19 2,057,909 15
LOSS FROM DISCONTINUED OPERATIONS
(Notes 4 and 13) (849,968) (5) (64,588) (1)
NET INCOME FOR THE YEAR 2,082,330 14 1,993,321 14
(Continued)

- 9 -
E INK HOLDINGS INC. AND SUBSIDIARIES
CONSOLIDATED STATEMENTS OF COMPREHENSIVE INCOME
FOR THE YEARS ENDED DECEMBER 31, 2017 AND 2016
(In Thousands of New Taiwan Dollars, Except Earnings Per Share)
2017 2016
Amount % Amount %
OTHER COMPREHENSIVE INCOME (LOSS)
Items that will not be reclassified subsequently to
profit or loss:
Remeasurement of defined benefit plans (Notes 4
and 20) $ (7,076) - $ (10,787) -
Income tax relating to items that will not be
reclassified subsequently to profit or loss
(Notes 4 and 23) 1,165 - 1,353 -
(5,911) - (9,434) -
Items that may be reclassified subsequently to profit
or loss:
Exchange differences on translating foreign
operations (482,418) (3) (689,513) (5)
Unrealized gain on available-for-sale financial
assets 122,316 - 112,699 1
Share of the other comprehensive loss of
associates and joint ventures accounted for
using the equity method (2,102) - (5,085) -
(362,204) (3) (581,899) (4)
Other comprehensive loss for the year, net of
income tax (368,115) (3) (591,333) (4)
TOTAL COMPREHENSIVE INCOME FOR THE
YEAR $ 1,714,215 11 $ 1,401,988 10
NET INCOME ATTRIBUTABLE TO:
Owners of the Company $ 2,078,065 14 $ 1,907,939 14
Non-controlling interests 4,265 - 85,382 -
$ 2,082,330 14 $ 1,993,321 14
TOTAL COMPREHENSIVE INCOME
ATTRIBUTABLE TO:
Owners of the Company $ 1,690,155 11 $ 1,306,583 9
Non-controlling interests 24,060 - 95,405 1
$ 1,714,215 11 $ 1,401,988 10
(Continued)

- 10 -
E INK HOLDINGS INC. AND SUBSIDIARIES
CONSOLIDATED STATEMENTS OF COMPREHENSIVE INCOME
FOR THE YEARS ENDED DECEMBER 31, 2017 AND 2016
(In Thousands of New Taiwan Dollars, Except Earnings Per Share)
2017 2016
Amount % Amount %
EARNINGS PER SHARE (Note 24)
From continuing and discontinued operations
Basic $1.85 $1.69
Diluted $1.85 $1.69
From continuing operations
Basic $2.57 $1.74
Diluted $2.56 $1.74
The accompanying notes are an integral part of the consolidated financial statements. (Concluded)

- 11 -
E INK HOLDINGS INC. AND SUBSIDIARIES
CONSOLIDATED STATEMENTS OF CHANGES IN EQUITY
FOR THE YEARS ENDED DECEMBER 31, 2017 AND 2016
(In Thousands of New Taiwan Dollars)
Equity Attributable to Owners of the Company
Other Equity
Exchange Unrealized
Differences on Gain on
Share Capital Retained Earnings Translating Available-for-
Shares Unappropriated Foreign sale Financial Treasury Non-controlling
(In Thousands) Amount Capital Surplus Legal Reserve Special Reserve Earnings Operations Assets Shares Total Interests Total Equity
BALANCE AT JANUARY 1, 2016 1,140,468 $ 11,404,677 $ 10,071,578 $ 1,059,754 $ 70,678 $ 2,992,433 $ 966,474 $ 114,217 $ - $ 26,679,811 $ (96,281) $ 26,583,530
Appropriation of 2015 earnings
Legal reserve - - - 53,933 - (53,933) - - - - - -
Cash dividends - - - - - (536,020) - - - (536,020) - (536,020)
Changes in equity from investments in associates accounted for
using the equity method - - 105 - - - - - - 105 - 105
Net income for the year ended December 31, 2016 - - - - - 1,907,939 - - - 1,907,939 85,382 1,993,321
Other comprehensive loss for the year ended December 31, 2016,
net of income tax - - - - - (9,285) (704,770) 112,699 - (601,356) 10,023 (591,333)
Total comprehensive income for the year ended December 31,
2016 - - - - - 1,898,654 (704,770) 112,699 - 1,306,583 95,405 1,401,988
Acquisition of treasury shares - 20,000 thousand shares - - - - - - - - (360,464) (360,464) - (360,464)
BALANCE AT DECEMBER 31, 2016 1,140,468 11,404,677 10,071,683 1,113,687 70,678 4,301,134 261,704 226,916 (360,464) 27,090,015 (876) 27,089,139
Appropriation of 2016 earnings
Legal reserve - - - 190,794 - (190,794) - - - - - -
Cash dividends - - - - - (1,680,702) - - - (1,680,702) - (1,680,702)
Net income for the year ended December 31, 2017 - - - - - 2,078,065 - - - 2,078,065 4,265 2,082,330
Other comprehensive loss for the year ended December 31, 2017,
net of income tax - - - - - (5,899) (504,327) 122,316 - (387,910) 19,795 (368,115)
Total comprehensive income for the year ended December 31,
2017 - - - - - 2,072,166 (504,327) 122,316 - 1,690,155 24,060 1,714,215
Difference between actual consideration paid and carrying amount
of subsidiaries acquired - - (2,223) - - (255,601) - - - (257,824) 191,413 (66,411)
Share-based payments - - 38,825 - - - - - - 38,825 - 38,825
Changes in non-controlling interests - - - - - - - - - - 79,800 79,800
Treasury shares transferred to employees - 2,896 thousand shares - - (166) - - - - - 52,195 52,029 - 52,029
BALANCE AT DECEMBER 31, 2017 1,140,468 $ 11,404,677 $ 10,108,119 $ 1,304,481 $ 70,678 $ 4,246,203 $ (242,623) $ 349,232 $ (308,269) $ 26,932,498 $ 294,397 $ 27,226,895
The accompanying notes are an integral part of the consolidated financial statements.

- 12 -
E INK HOLDINGS INC. AND SUBSIDIARIES
CONSOLIDATED STATEMENTS OF CASH FLOWS
FOR THE YEARS ENDED DECEMBER 31, 2017 AND 2016
(In Thousands of New Taiwan Dollars)
2017 2016
CASH FLOWS FROM OPERATING ACTIVITIES
Income before income tax from continuing operations $ 3,338,011 $ 2,408,524
Loss before income tax from discontinued operations (695,735) (384,150)
Income before income tax 2,642,276 2,024,374
Adjustments for:
Depreciation expenses 760,250 893,220
Amortization expenses 406,647 417,554
Reversal of impairment loss recognized on accounts receivable (10,107) (11,245)
Net gain on fair value change of financial assets at fair value through
profit or loss (101,591) (268)
Interest expense 24,895 29,677
Interest income (90,819) (74,546)
Dividend income (100,951) (74,702)
Share-based payments 38,825 -
Share of loss of associates and joint ventures 9,333 10,800
Net gain on disposal of property, plant and equipment (50,317) (26,427)
Net gain on disposal of non-current assets held for sale (7,280) (5,808)
Net loss (gain) on disposal of investments (2,775) 4,202
Impairment loss recognized on non-financial assets 181,060 328,046
Reversal of write-down of inventories (246,721) (232,336)
Net unrealized gain on foreign currency exchange (16,992) (17,498)
Changes in operating assets and liabilities
Financial assets held for trading 115,789 -
Accounts receivable (453,004) (34,334)
Other receivables 266,000 832,097
Inventories (585,945) 170,737
Prepayments 10,373 (59,783)
Other current assets 146,036 (93,460)
Notes and accounts payable 1,119,507 108,084
Other payables 394,143 56,562
Provisions 136,062 (231,888)
Receipts in advance 1,082,400 1,343,318
Other current liabilities (37,043) 19,936
Net defined benefit liabilities (1,654) (25,997)
Cash generated from operations 5,628,397 5,350,315
Income tax paid (113,125) (521,847)
Net cash generated from operating activities 5,515,272 4,828,468
CASH FLOWS FROM INVESTING ACTIVITIES
Purchase of available-for-sale financial assets (839,986) -
Purchase of debt investments with no active market (1,571,696) (435,596)
Proceeds from repayments of debt investments with no active market 1,479,431 600,000
Purchase of financial assets measured at cost - (191,470)
Proceeds from disposal of financial assets measured at cost 25,080 -
(Continued)

- 13 -
E INK HOLDINGS INC. AND SUBSIDIARIES
CONSOLIDATED STATEMENTS OF CASH FLOWS
FOR THE YEARS ENDED DECEMBER 31, 2017 AND 2016
(In Thousands of New Taiwan Dollars)
2017 2016
Acquisitions of associates and joint ventures $ - $ (83,697)
Proceed from disposal of non-current assets held for sale 815,316 6,003
Payments for property, plant and equipment (332,067) (303,217)
Proceeds from disposal of property, plant and equipment 63,378 180,527
Payments for other intangible assets (111,594) (196,721)
Decrease (increase) in other financial assets (180,145) 333,740
Decrease in other non-current assets 40,124 15,350
Interest received 88,871 78,769
Dividend received 100,951 74,702
Net cash generated from (used in) investing activities (422,337) 78,390
CASH FLOWS FROM FINANCING ACTIVITIES
Increase (decrease) in short-term borrowings (45,088) 351,682
Repayments of long-term borrowings (122,700) (2,093,750)
Increase in other non-current liabilities 5,109 11,186
Cash dividends (1,680,702) (536,020)
Cash paid for acquisition of treasury shares - (360,464)
Proceeds from treasury shares transferred to employees 52,029 -
Interest paid (24,322) (30,038)
Changes in non-controlling interests 13,389 -
Net cash used in financing activities (1,802,285) (2,657,404)
EFFECTS OF EXCHANGE RATE CHANGES ON THE BALANCE
OF CASH AND CASH EQUIVALENTS HELD IN FOREIGN
CURRENCIES 23,250 (266,880)
NET INCREASE IN CASH AND CASH EQUIVALENTS 3,313,900 1,982,574
CASH AND CASH EQUIVALENTS AT THE BEGINNING OF THE
YEAR 8,564,749 6,582,175
CASH AND CASH EQUIVALENTS AT THE END OF THE YEAR $ 11,878,649 $ 8,564,749
The accompanying notes are an integral part of the consolidated financial statements. (Concluded)
- 14 -
E INK HOLDINGS INC. AND SUBSIDIARIES
NOTES TO CONSOLIDATED FINANCIAL STATEMENTS
FOR THE YEARS ENDED DECEMBER 31, 2017 AND 2016
(In Thousands of New Taiwan Dollars, Unless Stated Otherwise)
1. GENERAL INFORMATION
E Ink Holdings Inc. (the Company) was incorporated in June 1992 in the Hsin-Chu Science-based
Industrial Park. The Company’s shares have been listed on the Taipei Exchange (TPEx) Mainboard since
March 30, 2004. The Company mainly researches, develops, manufactures and sells electronic paper
display panels.
The consolidated financial statements of the Company and its subsidiaries, collectively referred to as the
Group, are presented in New Taiwan dollars, the functional currency of the Company.
2. APPROVAL OF FINANCIAL STATEMENTS
The consolidated financial statements were approved by the Company’s board of directors on March 27,
2018.
3. APPLICATION OF NEW, AMENDED AND REVISED STANDARDS AND INTERPRETATIONS
a. Initial application of the amendments to the Regulations Governing the Preparation of Financial Reports
by Securities Issuers and the International Financial Reporting Standards (IFRS), International
Accounting Standards (IAS), Interpretations of IFRS (IFRIC), and Interpretations of IAS (SIC)
(collectively, the “IFRSs”) endorsed and issued into effect by the Financial Supervisory Commission
(FSC)
Except for the following, whenever applied, the initial application of the amendments to the
Regulations Governing the Preparation of Financial Reports by Securities Issuers and the IFRSs
endorsed and issued into effect by the FSC would not have any material impact on the Group’s
accounting policies:
IAS 36 “Recoverable Amount Disclosures for Non-financial Assets”
The amendments clarify that the recoverable amount of an asset or a cash-generating unit is disclosed
only when an impairment loss on the asset has been recognized or reversed during the period.
Furthermore, if the recoverable amount of an item of property, plant and equipment for which
impairment loss has been recognized or reversed is the fair value less costs of disposal, the Group is
required to disclose the fair value hierarchy. If the fair value measurements are categorized within
Levels 2 and 3, the valuation technique and key assumptions used to measure the fair value are
disclosed. The discount rate used is disclosed if such fair value less costs of disposal is measured by
using the present value technique. The amendments should be applied retrospectively starting from
January 1, 2017. Refer to Note 13 for related disclosures.
Amendments to the Regulations Governing the Preparation of Financial Reports by Securities Issuers
The amendments include additions of several accounting items and requirements for disclosures of
impairment of non-financial assets as a consequence of the IFRSs endorsed and issued into effect by the
FSC. In addition, as a result of the post implementation review of IFRSs in Taiwan, the amendments
also include an emphasis on certain recognition and measurement considerations and add requirements
for disclosures of related party transactions and goodwill.

- 15 -
The amendments stipulate that other companies or institutions of which the chairman of the board of
directors or president serves as the chairman of the board of directors or the president of the Group, or
is the spouse or second immediate family of the chairman of the board of directors or president of the
Group are deemed to have a substantive related party relationship, unless it can be demonstrated that no
control, joint control or significant influence exists. Furthermore, the amendments require the
disclosure of the names of the related parties and the relationships with whom the Group has significant
transactions. If the transaction amount or balance with a specific related party is 10% or more of the
Group’s respective total transaction amount or balance, such transactions should be separately disclosed
by the name of each related party.
When the amendments are applied retrospectively from January 1, 2017, the disclosures of related party
transactions are enhanced. Refer to Note 30 for the related disclosures.
b. The Regulations Governing the Preparation of Financial Reports by Securities Issuers and the IFRSs
endorsed by the FSC for application starting from 2018
New, Revised or Amended Standards and Interpretations (“New
IFRSs”)
Effective Date
Announced by IASB (Note 1)
Annual Improvements to IFRSs 2014-2016 Cycle Note 2
Amendments to IFRS 2 “Classification and Measurement of
Share-based Payment Transactions”
January 1, 2018
Amendments to IFRS 4 “Applying IFRS 9 Financial Instruments with
IFRS 4 Insurance Contracts”
January 1, 2018
IFRS 9 “Financial Instruments” January 1, 2018
Amendments to IFRS 9 and IFRS 7 “Mandatory Effective Date of
IFRS 9 and Transition Disclosures”
January 1, 2018
IFRS 15 “Revenue from Contracts with Customers” January 1, 2018
Amendments to IFRS 15 “Clarifications to IFRS 15 Revenue from
Contracts with Customers”
January 1, 2018
Amendment to IAS 7 “Disclosure Initiative” January 1, 2017
Amendments to IAS 12 “Recognition of Deferred Tax Assets for
Unrealized Losses”
January 1, 2017
Amendments to IAS 40 “Transfers of Investment Property” January 1, 2018
IFRIC 22 “Foreign Currency Transactions and Advance
Consideration”
January 1, 2018
Note 1: Unless stated otherwise, the above New IFRSs are effective for annual periods beginning on
or after their respective effective dates.
Note 2: The amendment to IFRS 12 is retrospectively applied for annual periods beginning on or after
January 1, 2017; the amendments to IAS 28 are retrospectively applied for annual periods
beginning on or after January 1, 2018.

- 16 -
1) IFRS 9 “Financial Instruments” and related amendments
Classification, measurement and impairment of financial assets
With regard to financial assets, all recognized financial assets that are within the scope of IAS 39
“Financial Instruments: Recognition and Measurement” are subsequently measured at amortized
cost or fair value. Under IFRS 9, the requirement for the classification of financial assets is stated
below.
For the Group’s debt instruments that have contractual cash flows that are solely payments of
principal and interest on the principal amount outstanding, their classification and measurement are
as follows:
a) For debt instruments, if they are held within a business model whose objective is to collect
contractual cash flows, the financial assets are measured at amortized cost and are assessed for
impairment continuously with any impairment loss recognized in profit or loss. Interest
income is recognized in profit or loss by using the effective interest method; and
b) For debt instruments, if they are held within a business model whose objective is achieved by
both collecting contractual cash flows and selling financial assets, the financial assets are
measured at fair value through other comprehensive income (FVTOCI) and are assessed for
impairment. Interest income is recognized in profit or loss by using the effective interest
method, and other gains or losses shall be recognized in other comprehensive income, except for
impairment gains or losses and foreign exchange gains and losses. When the debt instruments
are derecognized or reclassified, the cumulative gain or loss previously recognized in other
comprehensive income is reclassified from equity to profit or loss.
Except for the above, all other financial assets are measured at fair value through profit or loss.
However, the Group may make an irrevocable election to present subsequent changes in the fair
value of an equity investment (that is not held for trading) in other comprehensive income, with
only dividend income generally recognized in profit or loss. No subsequent impairment
assessment is required, and the cumulative gain or loss previously recognized in other
comprehensive income cannot be reclassified from equity to profit or loss.
The Group analyzed the facts and circumstances of its financial assets that exist at December 31,
2017 and performed an assessment of the impact of IFRS 9 on the classification and measurement
of financial assets. Under IFRS 9:
a) Listed shares classified as available-for-sale will be designated as at fair value through other
comprehensive income and the fair value gains or losses accumulated in other equity will be
transferred directly to retained earnings instead of being reclassified to profit or loss on disposal.
Besides this, unlisted shares measured at cost will be measured at fair value instead; and
b) Debt investments classified as debt investments with no active market and measured at
amortized cost will be classified as measured at amortized cost because, on initial recognition,
the contractual cash flows that are solely payments of principal and interest on the principal
outstanding and these investments are held within a business model whose objective is to collect
contractual cash flows.
IFRS 9 requires impairment loss on financial assets to be recognized by using the “Expected Credit
Losses Model”. A loss allowance is required for financial assets measured at amortized cost,
investments in debt instruments measured at FVTOCI, lease receivables, contract assets arising
from IFRS 15 “Revenue from Contracts with Customers”, certain written loan commitments and
financial guarantee contracts. A loss allowance for 12-month expected credit losses is required for
a financial asset if its credit risk has not increased significantly since initial recognition. A loss
allowance for full-lifetime expected credit losses is required for a financial asset if its credit risk has

- 17 -
increased significantly since initial recognition and is not low. However, a loss allowance for
full-lifetime expected credit losses is required for trade receivables that do not constitute a financing
transaction.
For originated credit-impaired financial assets, the Group takes into account the expected credit
losses on initial recognition in calculating the credit-adjusted effective interest rate. Subsequently,
any changes in expected losses are recognized as a loss allowance with a corresponding gain or loss
recognized in profit or loss.
The Group has performed a preliminary assessment in which it will apply the simplified approach to
recognize full-lifetime expected credit losses for accounts receivable, contract assets and lease
receivables. In relation to debt instrument investments, the Group will assess whether there has
been a significant increase in credit risk to determine whether to recognize 12-month or full-lifetime
expected credit losses. In general, the Group anticipates that the application of the expected credit
losses model of IFRS 9 will result in an earlier recognition of credit losses for financial assets.
The Group elects not to restate prior reporting periods when applying the requirements for the
classification, measurement and impairment of financial assets under IFRS 9 with the cumulative
effect of the initial application recognized at the date of initial application and will provide the
disclosures related to the classification and the adjustment information upon initial application of
IFRS 9.
The anticipated impact on assets, liabilities and equity of retrospective application of the
requirements for the classification, measurement and impairment of financial assets as of January 1,
2018 is set out below:
Carrying
Amount as of
December 31,
2017
Adjustments
Arising from
Initial
Application
Adjusted
Carrying
Amount as of
January 1, 2018
Impact on assets and equity
Assets
Financial assets measured at amortized
cost - current $ - $ 718,600 $ 718,600
Debt investments with no active market
- current 519,209 (519,209) -
Other financial assets - current 199,391 (199,391) -
Financial assets at fair value through
other comprehensive income -
current - 3,086,572 3,086,572
Available-for-sale financial assets -
non-current 2,749,317 (2,749,317) -
Financial assets measured at cost -
non-current 267,981 (267,981) -
$ 3,735,898 $ 69,274 $ 3,805,172
Equity
Retained earnings $ 5,621,362 $ 41,607 $ 5,662,969
Other equity 106,609 27,667 134,276
$ 5,727,971 $ 69,274 $ 5,797,245

- 18 -
2) IFRS 15 “Revenue from Contracts with Customers” and related amendments
IFRS 15 establishes principles for recognizing revenue that apply to all contracts with customers
and will supersede IAS 18 “Revenue”, IAS 11 “Construction Contracts” and a number of
revenue-related interpretations.
When applying IFRS 15, the Group recognizes revenue by applying the following steps:
Identify the contract with the customer;
Identify the performance obligations in the contract;
Determine the transaction price;
Allocate the transaction price to the performance obligations in the contract; and
Recognize revenue when the Group satisfies a performance obligation.
IFRS 15 and the related amendments require that when the nature of the Group’s promise in
granting a license is to provide a right to access the Group’s intellectual property, revenue is
recognized over time if all of the following criteria are met. Otherwise, the promise is to provide a
right to use the Group’s intellectual property as it exists at the point in time at which the license is
granted and revenue is recognized when the license is transferred.
a) The contract requires, or the customer reasonably expects, the Group to undertake activities that
significantly affect the intellectual property to which the customer has rights.
b) The rights granted by the license directly expose the customer to any positive or negative effects
of the above activities.
c) Those activities do not result in the transfer of a good or a service to the customer as the
activities occur.
The Group’s activities significantly affect the intellectual property to which the customer has rights
if those activities are expected to significantly change the form or the functionality of the
intellectual property, or if the ability of the customer to obtain benefit from the intellectual property
is substantially derived from, or dependent upon, those activities.
Some of the patented technology licensed by the Group can remain functional without any updates
or technical support. Furthermore, the Group is not obliged to undertake activities that will change
the functionality of the patented technology. The patented technology to which the license relates
has significant stand-alone functionality and, under IFRS 15, the Group will recognize royalty
income when the patented technology is licensed. Currently, royalty income is recognized on a
straight-line basis over the license period of the agreement.
The Group elects to retrospectively apply IFRS 15 to contracts that are not complete as of January
1, 2018 and recognizes the cumulative effect of the changes in retained earnings on January 1, 2018.
In addition, the Group will disclose the difference between the amount that results from applying
IFRS 15 and the amount that results from applying current standards for 2018.

- 19 -
The anticipated impact on assets, liabilities and equity when retrospectively applying IFRS 15 as of
January 1, 2018 is detailed below:
Carrying
Amount as of
December 31,
2017
Adjustments
Arising from
Initial
Application
Adjusted
Carrying
Amount as of
January 1, 2018
Impact on assets, liabilities and equity
Assets
Contract assets - current $ - $ 117,872 $ 117,872
Contract assets - non-current - 117,872 117,872
$ - $ 235,744 $ 235,744
Liabilities
Contract liabilities - current $ - $ 1,652,850 $ 1,652,850
Receipts in advance 1,701,659 (1,701,659) -
Contract liabilities - non-current - 1,481,910 1,481,910
Deferred revenue - non-current 1,607,917 (1,607,917) -
$ 3,309,576 $ (174,816) $ 3,134,760
Equity
Retained earnings $ 5,621,362 $ 388,923 $ 6,010,285
Non-controlling interests 294,397 21,637 316,034
$ 5,915,759 $ 410,560 $ 6,326,319
Except for the above impact, as of the date the consolidated financial statements were authorized for
issue, the Group assesses the application of other standards and interpretations will have no material
impact on the Group’s consolidated financial position and financial performance.
c. New IFRSs in issue but not yet endorsed and issued into effect by the FSC
New IFRSs
Effective Date
Announced by IASB (Note 1)
Annual Improvements to IFRSs 2015-2017 Cycle January 1, 2019
Amendments to IFRS 9 “Prepayment Features with Negative
Compensation”
January 1, 2019 (Note 2)
Amendments to IFRS 10 and IAS 28 “Sale or Contribution of Assets
between an Investor and its Associate or Joint Venture”
To be determined by IASB
IFRS 16 “Leases” January 1, 2019 (Note 3)
IFRS 17 “Insurance Contracts” January 1, 2021
Amendments to IAS 19 “Plan Amendment, Curtailment or
Settlement”
January 1, 2019 (Note 4)
Amendments to IAS 28 “Long-term Interests in Associates and Joint
Ventures”
January 1, 2019
IFRIC 23 “Uncertainty Over Income Tax Treatments” January 1, 2019
Note 1: Unless stated otherwise, the above New IFRSs are effective for annual periods beginning on
or after their respective effective dates.

- 20 -
Note 2: The FSC permits the election for early adoption of the amendments starting from 2018.
Note 3: On December 19, 2017, the FSC announced that IFRS 16 will take effect starting from
January 1, 2019.
Note 4: The Group shall apply these amendments to plan amendments, curtailments or settlements
occurring on or after January 1, 2019.
Expect for the following, whenever applied, the above standards and interpretations would not have any
material impact on the Group’s accounting policies:
IFRS 16 “Leases”
IFRS 16 sets out the accounting standards for leases that will supersede IAS 17 and a number of related
interpretations.
Under IFRS 16, if the Group is a lessee, it shall recognize right-of-use assets and lease liabilities for all
leases on the consolidated balance sheets except for low-value and short-term leases. The Group may
elect to apply the accounting method similar to the accounting for operating leases under IAS 17 to
low-value and short-term leases. On the consolidated statements of comprehensive income, the Group
should present the depreciation expense charged on right-of-use assets separately from the interest
expense accrued on lease liabilities; interest is computed by using the effective interest method. On
the consolidated statements of cash flows, cash payments for the principal portion of lease liabilities are
classified within financing activities; cash payments for the interest portion are classified within
financing activities.
The application of IFRS 16 is not expected to have a material impact on the accounting of the Group as
lessor.
When IFRS 16 becomes effective, the Group may elect to apply this standard either retrospectively to
each prior reporting period presented or retrospectively with the cumulative effect of the initial
application of this standard recognized at the date of initial application.
Except for the above impact, as of the date the consolidated financial statements were authorized for
issue, the Group is continuously assessing the possible impact that the application of other standards
and interpretations will have on the Group’s consolidated financial position and financial performance
and will disclose the relevant impact when the assessment is completed.
4. SUMMARY OF SIGNIFICANT ACCOUNTING POLICIES
a. Statement of compliance
The consolidated financial statements have been prepared in accordance with the Regulations
Governing the Preparation of Financial Reports by Securities Issuers and IFRSs as endorsed and issued
into effect by the FSC.
b. Basis of preparation
The consolidated financial statements have been prepared on the historical cost basis except for
financial instruments which are measured at fair value.
- 21 -
The fair value measurements, which are grouped into Levels 1 to 3 based on the degree to which the
fair value measurement inputs are observable and based on the significance of the inputs to the fair
value measurement in its entirety, are described as follows:
1) Level 1 inputs are quoted prices (unadjusted) in active markets for identical assets or liabilities;
2) Level 2 inputs are inputs other than quoted prices included within Level 1 that are observable for an
asset or liability, either directly (i.e. as prices) or indirectly (i.e. derived from prices); and
3) Level 3 inputs are unobservable inputs for an asset or liability.
c. Classification of current and non-current assets and liabilities
Current assets include:
1) Assets held primarily for the purpose of trading;
2) Assets expected to be realized within 12 months after the reporting period; and
3) Cash and cash equivalents unless the asset is restricted from being exchanged or used to settle a
liability for at least 12 months after the reporting period.
Current liabilities include:
1) Liabilities held primarily for the purpose of trading;
2) Liabilities due to be settled within 12 months after the reporting period; and
3) Liabilities for which the Group does not have an unconditional right to defer settlement for at least
12 months after the reporting period.
Assets and liabilities that are not classified as current are classified as non-current.
d. Basis of consolidation
The consolidated financial statements incorporate the financial statements of the Company and the
entities controlled by the Company (i.e. its subsidiaries).
Income and expenses of subsidiaries acquired or disposed of during the year are included in the
consolidated statement of comprehensive income from the effective date of acquisition up to the
effective date of disposal, as appropriate.
When necessary, adjustments are made to the financial statements of subsidiaries to bring their
accounting policies into line with those used by the Company.
All intra-group transactions, balances, income and expenses are eliminated in full upon consolidation.
Total comprehensive income of subsidiaries is attributed to the owners of the Company and to the
non-controlling interests even if this results in the non-controlling interests having a deficit balance.
Changes in the Group’s ownership interests in subsidiaries that do not result in the Group losing control
over the subsidiaries are accounted for as equity transactions. The carrying amounts of the Group’s
interests and the non-controlling interests are adjusted to reflect the changes in their relative interests in
the subsidiaries. Any difference between the amount by which the non-controlling interests are
adjusted and the fair value of the consideration paid or received is recognized directly in equity and
attributed to the owners of the Company.

- 22 -
When the Group loses control of a subsidiary, a gain or loss is recognized in profit or loss and is
calculated as the difference between (i) the aggregate of the fair value of the consideration received and
any investment retained in the former subsidiary at its fair value at the date when control is lost and (ii)
the assets and liabilities and any non-controlling interests of the former subsidiary at their carrying
amounts at the date when control is lost. The Group accounts for all amounts recognized in other
comprehensive income in relation to that subsidiary on the same basis as would be required if the Group
had directly disposed of the related assets or liabilities.
See Note 14 and Tables 7 and 8 for detailed information on subsidiaries (including the percentages of
ownership and main businesses).
e. Business combinations
Acquisitions of businesses are accounted for using the acquisition method. Acquisition-related costs
are generally recognized as expenses as they are incurred.
Goodwill is measured as the excess of the sum of the consideration transferred, the amount of any
non-controlling interests in the acquiree, and the fair value of the acquirer’s previously held equity
interest in the acquiree over the net of the acquisition-date amounts of the identifiable assets acquired
and the liabilities assumed.
Non-controlling interests that are present ownership interests and entitle their holders to a proportionate
share of the entity’s net assets in the event of liquidation may be initially measured either at fair value
or at the non-controlling interests’ proportionate share of the recognized amounts of the acquiree’s
identifiable net assets. The choice of the measurement basis is made on a transaction-by-transaction
basis. Other types of non-controlling interests are measured at fair value.
f. Foreign currencies
In preparing the financial statements of each individual group entity, transactions in currencies other
than the entity’s functional currency (i.e. foreign currencies) are recognized at the rates of exchange
prevailing at the dates of the transactions.
At the end of each reporting period, monetary items denominated in foreign currencies are retranslated
at the rates prevailing at that date. Exchange differences on monetary items arising from settlement or
translation are recognized in profit or loss in the year in which they arise.
Non-monetary items measured at fair value that are denominated in foreign currencies are retranslated
at the rates prevailing at the date when the fair value was determined. Exchange differences arising
from the retranslation of non-monetary items are included in profit or loss for the year except for
exchange differences arising from the retranslation of non-monetary items in respect of which gains and
losses are recognized directly in other comprehensive income, in which cases, the exchange differences
are also recognized directly in other comprehensive income.
Non-monetary items that are measured at historical cost in a foreign currency are translated using the
exchange rate at the date of the transaction.
For the purposes of presenting consolidated financial statements, the functional currencies of the Group
and enties under its control (including subsidiaries, associates and joint ventures in other countries that
use currencies that are different from the currency of the Company) are translated into the presentation
currency, the New Taiwan dollars, as follows: Assets and liabilities are translated at the exchange
rates prevailing at the end of the reporting period; and income and expense items are translated at the
average exchange rates for the year. Exchange differences are recognized in other comprehensive
income and attributed to the owners of the Company and non-controlling interests as appropriate.

- 23 -
On a disposal of the Group’s entire interest in a foreign operation or a disposal involving the loss of
control over a subsidiary that includes a foreign operation, all of the exchange differences accumulated
in equity in respect of that operation attributable to the owners of the Company are reclassified to profit
or loss.
g. Inventories
Inventories consist of raw materials, semi-finished goods, finished goods and work in progress and are
stated at the lower of cost or net realizable value. Inventory write-downs are made by item, except
where it may be appropriate to group similar or related items. The net realizable value is the estimated
selling price of inventories less all estimated costs of completion and costs necessary to make the sale.
Inventories are recorded at the weighted-average cost on the balance sheet date.
h. Investment in associates and joint ventures
An associate is an entity over which the Group has significant influence and which is neither a
subsidiary nor an interest in a joint venture. A joint venture is a joint arrangement whereby the Group
and other parties that have joint control of the arrangement have rights to the net assets of the
arrangement.
The Group uses the equity method to account for its investments in associates and joint ventures.
Under the equity method, investments in an associate and a joint venture are initially recognized at cost
and adjusted thereafter to recognize the Group’s share of the profit or loss and other comprehensive
income of the associate and joint venture. The Group also recognizes the changes in the Group’s share
of equity of associates and joint ventures attributable to the Group.
Any excess of the cost of acquisition over the Group’s share of the net fair value of the identifiable
assets and liabilities of an associate or a joint venture at the date of acquisition is recognized as
goodwill, which is included within the carrying amount of the investment and is not amortized.
When the Group subscribes for additional new shares of an associate and joint venture at a percentage
different from its existing ownership percentage, the resulting carrying amount of the investment differs
from the amount of the Group’s proportionate interest in the associate and joint venture. The Group
records such a difference as an adjustment to investments with the corresponding amount charged or
credited to capital surplus - changes in equity of associates and joint ventures accounted for using the
equity method and investments accounted for using the equity method. If the Group’s ownership
interest is reduced due to the additional subscription of the new shares of the associate and joint
venture, the proportionate amount of the gains or losses previously recognized in other comprehensive
income in relation to that associate and joint venture is reclassified to profit or loss on the same basis as
would be required if the investee had directly disposed of the related assets or liabilities. When the
adjustment should be debited to capital surplus, but the capital surplus recognized from investments
accounted for using the equity method is insufficient, the shortage is debited to retained earnings.
When the Group’s share of losses of an associate and a joint venture equals or exceeds its interest in
that associate and joint venture, the Group discontinues recognizing its share of further losses.
Additional losses and liabilities are recognized only to the extent that the Group has incurred legal
obligations, or constructive obligations, or made payments on behalf of that associate and joint venture.
The entire carrying amount of the investment (including goodwill) is tested for impairment as a single
asset by comparing its recoverable amount with its carrying amount. Any impairment loss recognized
forms part of the carrying amount of the investment. Any reversal of that impairment loss is
recognized to the extent that the recoverable amount of the investment subsequently increases.

- 24 -
The Group discontinues the use of the equity method from the date on which its investment ceases to be
an associate and a joint venture. Any retained investment is measured at fair value at that date and the
fair value is regarded as its fair value on initial recognition as a financial asset. The difference
between the previous carrying amount of the associate and the joint venture attributable to the retained
interest and its fair value is included in the determination of the gain or loss on disposal of the associate
and the joint venture. The Group accounts for all amounts previously recognized in other
comprehensive income in relation to that associate and joint venture on the same basis as would be
required if that associate and joint venture had directly disposed of the related assets or liabilities.
When the Group transacts with its associate and joint venture, profits and losses resulting from the
transactions with the associate and joint venture are recognized in the Group’s consolidated financial
statements only to the extent of interests in the associate and the joint venture that are not related to the
Group.
i. Property, plant and equipment
Property, plant and equipment are stated at cost less accumulated depreciation and accumulated
impairment loss.
Property, plant and equipment in the course of construction are carried at cost less any recognized
impairment loss. Cost includes professional fees and borrowing costs eligible for capitalization.
Such assets are depreciated and classified to the appropriate categories of property, plant and equipment
when completed and ready for their intended use.
Depreciation on property, plant and equipment is recognized using the straight-line method. Each
significant part is depreciated separately. The estimated useful lives, residual values and depreciation
methods are reviewed at the end of each year, with the effects of any changes in the estimates accounted
for on a prospective basis.
On derecognition of an item of property, plant and equipment, the difference between the sales proceeds
and the carrying amount of the asset is recognized in profit or loss.
j. Goodwill
Goodwill arising from the acquisition of a business is carried at cost as established at the date of
acquisition of the business less accumulated impairment loss.
For the purpose of impairment testing, goodwill is allocated to each of the Group’s cash-generating
units or groups of cash-generating units (referred to as cash-generating units) that is expected to benefit
from the synergies of the combination.
A cash-generating unit to which goodwill has been allocated is tested for impairment annually, or more
frequently when there is an indication that the unit may be impaired, by comparing its carrying amount,
including the attributed goodwill, with its recoverable amount. However, if the goodwill allocated to a
cash-generating unit was acquired in a business combination during the current annual period, that unit
shall be tested for impairment before the end of the current annual period. If the recoverable amount
of the cash-generating unit is less than its carrying amount, the impairment loss is allocated first to
reduce the carrying amount of any goodwill allocated to the unit and then to the other assets of the unit
pro rata based on the carrying amount of each asset in the unit. Any impairment loss is recognized
directly in profit or loss. An impairment loss recognized for goodwill is not reversed in subsequent
periods.
If goodwill has been allocated to a cash-generating unit and the entity disposes of an operation within
that unit, the goodwill associated with the operation disposed of is included in the carrying amount of
the operation when determining the gain or loss on disposal and is measured on the basis of the relative
values of the operation disposed of and the portion of the cash-generating unit retained.

- 25 -
k. Intangible assets
1) Intangible assets acquired separately
Intangible assets with finite useful lives that are acquired separately are initially measured at cost
and subsequently measured at cost less accumulated amortization and accumulated impairment loss.
Amortization is recognized on a straight-line basis. The estimated useful lives, residual values,
and amortization methods are reviewed at the end of each year, with the effects of any changes in
the estimates accounted for on a prospective basis.
2) Internally-generated intangible assets - research and development expenditures
Expenditures on research activities are recognized as expenses in the period in which they are
incurred.
An internally-generated intangible asset arising from the development phase of an internal project is
recognized if, and only if, all of the following have been demonstrated:
a) The technical feasibility of completing the intangible asset so that it will be available for use or
sale;
b) The intention to complete the intangible asset and use or sell it;
c) The ability to use or sell the intangible asset;
d) How the intangible asset will generate probable future economic benefits;
e) The availability of adequate technical, financial and other resources to complete the
development and to use or sell the intangible asset; and
f) The ability to measure reliably the expenditures attributable to the intangible asset during its
development.
The amount initially recognized for internally-generated intangible assets is the sum of the
expenditures incurred from the date when such an intangible asset first meets the recognition
criteria listed above. Subsequent to initial recognition, such intangible assets are measured on the
same basis as intangible assets that are acquired separately.
3) Intangible assets acquired in a business combination
Intangible assets acquired in a business combination and recognized separately from goodwill are
initially recognized at their fair value at the acquisition date. Subsequent to initial recognition,
they are measured on the same basis as intangible assets that are acquired separately.
4) Derecognition of intangible assets
On derecognition of an intangible asset, the difference between the net disposal proceeds and the
carrying amount of the asset is recognized in profit or loss.

- 26 -
l. Impairment of tangible and intangible assets other than goodwill
At the end of each reporting period, the Group reviews the carrying amounts of its tangible and
intangible assets, excluding goodwill, to determine whether there is any indication that those assets
have suffered an impairment loss. If any such indication exists, the recoverable amount of the asset is
estimated in order to determine the extent of the impairment loss. When it is not possible to estimate
the recoverable amount of an individual asset, the Group estimates the recoverable amount of the
cash-generating unit to which the asset belongs. Corporate assets are allocated to the smallest group of
cash-generating units on a reasonable and consistent basis of allocation.
The recoverable amount is the higher of fair value less costs to sell and value in use. If the recoverable
amount of an asset or cash-generating unit is estimated to be less than its carrying amount, the carrying
amount of the asset or cash-generating unit is reduced to its recoverable amount, with the resulting
impairment loss recognized in profit or loss.
When an impairment loss is subsequently reversed, the carrying amount of the corresponding asset or
cash-generating unit is increased to the revised estimate of its recoverable amount, but only to the extent
of the carrying amount (net of amortization or depreciation) that would have been determined had no
impairment loss been recognized for the asset or cash-generating unit in prior years. A reversal of an
impairment loss is recognized in profit or loss.
m. Non-current assets held for sale
Non-current assets are classified as held for sale if their carrying amounts will be recovered principally
through a sale transaction rather than through continuing use. This condition is regarded as met only
when the sale is highly probable and the non-current asset is available for immediate sale in its present
condition. To meet the criteria for the sale being highly probable, the appropriate level of
management must be committed to the sale, which should be expected to qualify for recognition as a
completed sale within 1 year from the date of classification.
Non-current assets classified as held-for-sale are measured at the lower of their previous carrying
amount and fair value less cost to sell. Recognition of depreciation of those assets shall cease.
n. Financial instruments
Financial assets and financial liabilities are recognized when a group entity becomes a party to the
contractual provisions of the instruments.
Financial assets and financial liabilities are initially measured at fair value. Transaction costs that are
directly attributable to an acquisition or issuance of financial assets and financial liabilities (other than
financial assets and financial liabilities at fair value through profit or loss) are added to or deducted
from the fair value of the financial assets or financial liabilities, as appropriate, on initial recognition.
Transaction costs directly attributable to the acquisition of financial assets or financial liabilities at fair
value through profit or loss are recognized immediately in profit or loss.
1) Financial assets
All regular way purchases or sales of financial assets are recognized and derecognized on a trade
date basis.
a) Measurement category
Financial assets are classified into the following categories: Financial assets at fair value
through profit or loss, available-for-sale financial assets and loans and receivables.

- 27 -
i. Financial assets at fair value through profit or loss
Financial assets are classified as at fair value through profit or loss when the financial asset
is either held for trading or designated as at fair value through profit or loss.
A financial asset may be designated as at fair value through profit or loss upon initial
recognition if:
i) Such designation eliminates or significantly reduces a measurement or recognition
inconsistency that would otherwise arise; or
ii) The financial asset forms part of a group of financial assets or financial liabilities or
both, which is managed and has performance evaluated on a fair value basis, in
accordance with the Group’s documented risk management or investment strategy, and
information about the grouping is provided internally on that basis; or
iii) The contract contains one or more embedded derivatives so that the entire hybrid
(combined) contract can be designated as at fair value through profit or loss.
Financial assets at fair value through profit or loss are stated at fair value, with any gains or
losses arising on remeasurement recognized in profit or loss.
Fair value is determined in the manner described in Note 29.
ii. Available-for-sale financial assets
Available-for-sale financial assets are non-derivatives that are either designated as
available-for-sale or are not classified as loans and receivables, held-to-maturity investments
or financial assets at fair value through profit or loss.
Available-for-sale financial assets are measured at fair value. Dividends on
available-for-sale equity investments are recognized in profit or loss. Other changes in the
carrying amount of available-for-sale financial assets are recognized in other comprehensive
income and will be reclassified to profit or loss when the investment is disposed of or is
determined to be impaired.
Dividends on available-for-sale equity instruments are recognized in profit or loss when the
Group’s right to receive the dividends is established.
Available-for-sale equity investments that do not have a quoted market price in an active
market and whose fair value cannot be reliably measured and derivatives that are linked to
and must be settled by delivery of such unquoted equity investments are measured at cost
less any identified impairment loss at the end of each reporting period and are presented in a
separate line item as financial assets measured at cost. If, in a subsequent period, the fair
value of the financial assets can be reliably measured, the financial assets are remeasured at
fair value. The difference between the carrying amount and the fair value is recognized in
other comprehensive income on the financial assets. Any impairment loss is recognized in
profit and loss.
iii. Loans and receivables
Loans and receivables (including cash and cash equivalents, debt investments with no active
market, accounts receivable, other receivables and other financial assets) are measured using
the effective interest method at amortized cost less any impairment, except for short-term
receivables when the effect of discounting is immaterial.

- 28 -
Cash equivalents include time deposits and repurchase agreements collateralized by bonds
with original maturities within 3 months from the date of acquisition, which are highly
liquid, readily convertible to a known amount of cash and are subject to an insignificant risk
of changes in value. These cash equivalents are held for the purpose of meeting short-term
cash commitments.
b) Impairment of financial assets
Financial assets, other than those at fair value through profit or loss, are assessed for indicators
of impairment at the end of each reporting period. Financial assets are considered to be
impaired when there is objective evidence, as a result of one or more events that occurred after
the initial recognition of the financial asset, that the estimated future cash flows of the
investment have been affected.
For financial assets measured at amortized cost, such as accounts receivable, such assets are
assessed for impairment on a collective basis even if they were assessed not to be impaired
individually. Objective evidence of impairment for a portfolio of receivables could include the
Group’s past experience with collecting payments, an increase in the number of delayed
payments in the portfolio, as well as observable changes in national or local economic
conditions that correlate with defaults on receivables.
For a financial asset measured at amortized cost, the amount of the impairment loss recognized
is the difference between such an asset’s carrying amount and the present value of its estimated
future cash flows, discounted at the financial asset’s original effective interest rate.
For financial assets measured at amortized cost, if, in a subsequent period, the amount of the
impairment loss decreases and the decrease can be related objectively to an event occurring after
the impairment was recognized, the previously recognized impairment loss is reversed through
profit or loss to the extent that the carrying amount of the investment (at the date the impairment
is reversed) does not exceed what the amortized cost would have been had the impairment not
been recognized.
For available-for-sale equity investments, a significant or prolonged decline in the fair value of
the security below its cost is considered to be objective evidence of impairment.
For all other financial assets, objective evidence of impairment could include significant
financial difficulty of the issuer or counterparty, breach of contract such as a default or
delinquency in interest or principal payments, it becoming probable that the borrower will enter
bankruptcy or financial re-organization, or the disappearance of an active market for that
financial asset because of financial difficulties.
When an available-for-sale financial asset is considered to be impaired, cumulative losses
previously recognized in other comprehensive income are reclassified to profit or loss in the
period.
In respect of available-for-sale equity securities, impairment loss previously recognized in profit
or loss is not reversed through profit or loss. Any increase in fair value subsequent to an
impairment loss is recognized in other comprehensive income.
For financial assets that are measured at cost, the amount of the impairment loss is measured as
the difference between such an asset’s carrying amount and the present value of its estimated
future cash flows discounted at the current market rate of return for a similar financial asset.
Such impairment loss will not be reversed in subsequent periods.

- 29 -
The carrying amount of a financial asset is reduced by the impairment loss directly for all
financial assets with the exception of accounts receivable where the carrying amount is reduced
through the use of an allowance account. When accounts receivable are considered
uncollectible, they are written off against the allowance account. Subsequent recoveries of
amounts previously written off are credited against the allowance account. Changes in the
carrying amount of the allowance account are recognized in profit or loss except for
uncollectible accounts receivable that are written off against the allowance account.
c) Derecognition of financial assets
The Group derecognizes a financial asset only when the contractual rights to the cash flows
from the asset expire or when it transfers the financial asset and substantially all the risks and
rewards of ownership of the asset to another party.
On derecognition of a financial asset in its entirety, the difference between the asset’s carrying
amount and the sum of the consideration received and receivable and the cumulative gain or
loss that had been recognized in other comprehensive income is recognized in profit or loss.
2) Equity instruments
The repurchase of the Company’s own equity instruments is recognized in and deducted directly
from equity. No gain or loss is recognized in profit or loss on the purchase, sale, issuance or
cancellation of the Company’s own equity instruments.
3) Financial liabilities
All financial liabilities are measured at amortized cost using the effective interest method. On
derecognition of a financial liability, the difference between the carrying amount of a financial
liability derecognized and the consideration paid is recognized in profit or loss.
4) Derivative financial instruments
Derivatives are initially recognized at fair value at the date the derivative contracts are entered into
and are subsequently remeasured to their fair value at the end of each reporting period. The
resulting gain or loss is recognized in profit or loss immediately. When the fair value of a
derivative financial instrument is positive, the derivative is recognized as a financial asset; when the
fair value of a derivative financial instrument is negative, the derivative is recognized as a financial
liability.
o. Provisions
Provisions are measured at the best estimate of the discounted cash flows of the consideration required
to settle the present obligation at the end of the reporting period, taking into account the risks and
uncertainties surrounding the obligation.
1) Onerous contracts
Onerous contracts are those in which the Group’s unavoidable costs of meeting the contractual
obligations exceed the economic benefits expect to be received from the contract. The present
obligations arising under onerous contracts are recognized and measured as provisions.
2) Restructurings
A restructuring provision is recognized when the Group has developed a detailed formal plan for the
restructuring and has started to implement the plan or announced its main features. The
measurement of a restructuring provision includes only the direct expenditures arising from the

- 30 -
restructuring, which are those amounts that are both necessarily entailed by the restructuring and not
associated with the ongoing activities of the entity.
3) Warranties
Provisions for the expected cost of warranty obligations are recognized at the date of sale of the
relevant products at the best estimate by the management of the Group of the expenditures required
to settle the Group’s obligations.
p. Revenue recognition
Revenue is measured at the fair value of the consideration received or receivable. Revenue is reduced
for estimated customer returns, rebates and other similar allowances. Allowances for sales returns are
recognized at the time of sale based on the seller’s reliable estimate of future returns and based on past
experience and other relevant factors.
1) Sale of goods
Revenue from the sale of goods is recognized when all the following conditions are satisfied:
a) The Group has transferred to the buyer the significant risks and rewards of ownership of the
goods;
b) The Group retains neither continuing managerial involvement to the degree usually associated
with ownership nor effective control over the goods sold;
c) The amount of revenue can be measured reliably;
d) It is probable that the economic benefits associated with the transaction will flow to the Group;
and
e) The costs incurred or to be incurred in respect of the transaction can be measured reliably.
The Group does not recognize sales revenue on materials delivered to subcontractors because this
delivery does not involve a transfer of risks and rewards of material ownership.
2) Royalties
Royalty revenue is recognized on an accrual basis in accordance with the substance of the relevant
agreement provided that it is probable that the economic benefits will flow to the Group and the
amount of revenue can be measured reliably. Royalties determined on a time basis are recognized
on a straight-line basis over the period of the agreement. Royalty arrangements that are based on
sales are recognized by reference to the underlying arrangement. Proceeds of royalties received
but which have not met the condition of revenue recognition are recognized as receipts in advance -
current and deferred revenue - non-current, respectively, based on the remaining contract period.
3) Dividend and interest income
Dividend income from investments is recognized when a shareholder’s right to receive payment has
been established provided that it is probable that the economic benefits will flow to the Group and
the amount of income can be measured reliably.
Interest income from a financial asset is recognized when it is probable that the economic benefits
will flow to the Group and the amount of income can be measured reliably. Interest income is
accrued on a time basis, by reference to the principal outstanding and at the applicable effective
interest rate.

- 31 -
q. Leasing
Leases are classified as finance leases whenever the terms of a lease transfer substantially all the risks
and rewards of ownership to the lessee. All other leases are classified as operating leases.
Rental income from operating leases is recognized on a straight-line basis over the term of the relevant
lease. Operating lease payments are recognized as expenses on a straight-line basis over the lease
term.
r. Borrowing costs
Borrowing costs directly attributable to an acquisition, construction or production of qualifying assets
are added to the cost of those assets, until such time as the assets are substantially ready for their
intended use or sale.
Other than that which is stated above, all other borrowing costs are recognized in profit or loss in the
year in which they are incurred.
s. Employee benefits
1) Short-term employee benefits
Liabilities recognized in respect of short-term employee benefits are measured at the undiscounted
amount of the benefits expected to be paid in exchange for the related services.
2) Retirement benefits
Payments to defined contribution retirement benefit plans are recognized as expenses when
employees have rendered services entitling them to the contributions.
Defined benefit costs (including service cost, net interest and remeasurement) under the defined
benefit retirement benefit plans are determined using the projected unit credit method. Service
cost (including current service cost and past service cost) and net interest on the net defined benefit
liabilities are recognized as employee benefits expense in the period in which they occur.
Remeasurement, comprising actuarial gains and losses and the return on plan assets (excluding
interest), is recognized in other comprehensive income in the period in which it occurs.
Remeasurement recognized in other comprehensive income is reflected immediately in retained
earnings and will not be reclassified to profit or loss.
Net defined benefit liabilities represent the actual deficit in the Group’s defined benefit plans.
3) Termination benefits
A liability for a termination benefit is recognized at the earlier of when the Group can no longer
withdraw the offer of the termination benefit or when the Group recognizes any related
restructuring costs.
t. Share-based payment arrangements
The fair value at the grant date of share-based payments is expensed on a straight-line basis over the
vesting period, based on the Group’s best estimates of the number of shares or options that are expected
to ultimately vest, with a corresponding increase in capital surplus - employee share options. It is
recognized as an expense in full at the grant date if vested immediately.

- 32 -
At the end of each reporting period, the Group revises its estimate of the number of equity instruments
expected to vest. The impact of the revision of the original estimates is recognized in profit or loss
such that the cumulative expenses reflect the revised estimate, with a corresponding adjustment to
capital surplus - employee share options.
u. Taxation
Income tax expense represents the sum of the tax currently payable and deferred tax. Current and
deferred taxes are recognized in profit or loss, except when they relate to items that are recognized in
other comprehensive income, in which case, the current and deferred taxes are also recognized in other
comprehensive income.
1) Current tax
According to the Income Tax Law, an additional tax at 10% of unappropriated earnings is provided
for as income tax in the year that the shareholders approve to retain earnings.
Adjustments of prior years’ tax liabilities are added to or deducted from the current year’s tax
provision.
2) Deferred tax
Deferred tax is recognized on temporary differences between the carrying amounts of assets and
liabilities and the corresponding tax bases used in the computation of taxable profit.
Deferred tax liabilities are generally recognized for all taxable temporary differences. Deferred tax
assets are generally recognized for all deductible temporary differences and unused loss
carryforwards to the extent that it is probable that taxable profit will be available against which
those deductible temporary differences can be utilized.
Deferred tax liabilities are recognized for taxable temporary differences associated with investments
in subsidiaries and associates, except where the Group is able to control the reversal of the
temporary difference and it is probable that the temporary difference will not reverse in the
foreseeable future. Deferred tax assets arising from deductible temporary differences associated
with such investments are only recognized to the extent that it is probable that there will be
sufficient taxable profit against which to utilize the benefits of the temporary differences and they
are expected to reverse in the foreseeable future.
The carrying amount of deferred tax assets is reviewed at the end of each reporting period and
reduced to the extent that it is no longer probable that sufficient taxable profit will be available to
allow all or part of the assets to be recovered. A previously unrecognized deferred tax asset is also
reviewed at the end of each reporting period and recognized to the extent that it has become
probable that future taxable profit will allow the deferred tax asset to be recovered.
Deferred tax liabilities and assets are measured at the tax rates that are expected to apply in the year
in which the liabilities are settled or the assets are realized, based on tax rates and tax laws that have
been enacted or substantively enacted by the end of the reporting period. The measurement of
deferred tax liabilities and assets reflects the tax consequences that would follow from the manner
in which the Group expects, at the end of the reporting period, to recover or settle the carrying
amount of its assets and liabilities.

- 33 -
5. CRITICAL ACCOUNTING JUDGMENTS AND KEY SOURCES OF ESTIMATION
UNCERTAINTY
In the application of the Group’s accounting policies, management is required to make judgments,
estimations and assumptions about the carrying amounts of assets and liabilities that are not readily
apparent from other sources. The estimations and associated assumptions are based on historical
experience and other factors that are considered relevant. Actual results may differ from these
estimations.
The estimations and underlying assumptions are reviewed on an ongoing basis. Revisions to accounting
estimations are recognized in the year in which the estimations are revised if the revisions affect only that
year or in the year of the revisions and future years if the revisions affect both current and future years.
a. Impairment of goodwill
Determining whether goodwill is impaired requires an estimation of the value in use of the
cash-generating units to which goodwill has been allocated. The calculation of the value in use
requires management to estimate the future cash flows expected to arise from the cash-generating unit
and a suitable discount rate in order to calculate the present value. Where the actual future cash flows
are less than expected, a material impairment loss may arise.
b. Impairment of inventories
The net realizable value of inventory is the estimated selling price in the ordinary course of business
less the estimated costs of completion and the estimated costs necessary to make the sale. The
estimation of the net realizable value is based on current market conditions and historical experience
with products sales of a similar nature. Certain rates of impairment loss may be estimated if there is
no changes in the stock of inventory over a certain period of time. Changes in market conditions may
have a material impact on the estimation of the net realizable value.
6. CASH AND CASH EQUIVALENTS
December 31
2017 2016
Cash on hand $ 1,541 $ 1,300
Checking accounts and demand deposits 7,967,839 3,960,960
Cash equivalents (investments with original maturities of less than 3
months)
Time deposits 3,803,487 3,190,074
Repurchase agreements collateralized by bonds 105,782 1,412,415
$ 11,878,649 $ 8,564,749
The market rate intervals of demand deposits, time deposits and repurchase agreements collateralized by
bonds at the end of the reporting period were as follows:
December 31
2017 2016
Demand deposits 0.01-1.15% 0.01-1.15%
Time deposits 0.2-3.2% 0.25-1.6%
Repurchase agreements collateralized by bonds 0.4-1.7% 0.4-1.25%

- 34 -
Time deposits with original maturities of more than 3 months, which were recorded as other financial
assets, were $199,391 thousand and $23,244 thousand, respectively, as of December 31, 2017 and 2016.
7. FINANCIAL ASSETS AT FAIR VALUE THROUGH PROFIT OR LOSS
December 31
2017 2016
Derivative financial assets
Financial assets designated as at FVTPL - exchangeable bonds $ - $ 289,860
Non-derivative financial assets
Financial assets held for trading - mutual funds - 115,465
$ - $ 405,325
The Group signed a supplemental agreement with the issuing company of the exchangeable bonds on
January 24, 2017. Both parties agreed that if the Group fails to exercise its exchange rights when
exchangeable bonds are due in June 2017, the issuing company should redeem the bonds and pay the Group
the principal plus the agreed rate of return.
The exchangeable bonds were due on June 20, 2017. The Group agreed to have the issuing company
redeem the bonds and extend the relevant payment schedule based on the negotiation. The Group received
the principal and the related interest according to the agreement totaling US$12,393 thousand on August 11,
2017.
8. AVAILABLE-FOR-SALE FINANCIAL ASSETS
December 31
2017 2016
Domestic investments
Listed shares $ 2,749,317 $ 1,787,015
9. FINANCIAL ASSETS MEASURED AT COST
December 31
2017 2016
Overseas unlisted ordinary shares $ 170,793 $ 174,331
Domestic emerging ordinary shares 59,218 81,523
Domestic unlisted ordinary shares 37,970 44,401
$ 267,981 $ 300,255
Financial assets measured at cost were classified as available-for-sale financial assets according to the
measurement categories.

- 35 -
Management believed that the above unlisted equity investments held by the Group had fair values which
could not be reliably measured because the range of reasonable fair value estimates was so significant.
Therefore, they were measured at cost less impairment at the end of the reporting period.
10. DEBT INVESTMENTS WITH NO ACTIVE MARKET
December 31
2017 2016
Principal guarantee notes $ 519,209 $ 435,596
Principal guarantee notes bought from banks by the Group were measured at cost and may not be redeemed
in advance during the term of the contract. The range of expected rates of return were 4.25-4.5% and
2.8-3.6% per annum, respectively, as of December 31, 2017 and 2016.
11. ACCOUNTS RECEIVABLE
December 31
2017 2016
Accounts receivables from related parties (Note 30) $ 248,685 $ 43,143
Accounts receivable 1,789,726 1,621,118
Less: Allowance for impairment loss 28,611 38,545
1,761,115 1,582,573
$ 2,009,800 $ 1,625,716
In determining the recoverability of accounts receivable, the Group considered any change in the credit
quality of the respective accounts receivable since the date credit was initially granted to the end of the
reporting period. Due to insignificant risks on the recoverability of the Group’s accounts receivable
historically, an allowance for impairment loss was recognized based on the estimated irrecoverable amounts
determined by reference to past default experience with the counterparties and an analysis of their
respective current financial positions.
Before accepting a new customer, the Group evaluates the credit quality of a potential customer through an
internal credit rating system or an external credit rating agency and sets the credit line of the customer.
The Group checks its customers’ credit lines and ratings regularly.
For the accounts receivable balances that were past due at the end of the reporting period, the Group did not
recognize an allowance for impairment loss, because there was no significant change in credit quality and
the amounts were still considered recoverable.
The aging of accounts receivable was as follows:
December 31
2017 2016
Not past due $ 1,625,121 $ 1,547,280
Past due in 1-90 days 114,430 32,021
Past due more than 90 days 50,175 41,817
$ 1,789,726 $ 1,621,118
- 36 -
The above aging schedule was based on the number of past due days from the end of the credit term.
The aging of accounts receivable that were past due but not impaired was as follows:
December 31
2017 2016
1-90 days $ 114,430 $ 29,259
More than 90 days 21,565 5
$ 135,995 $ 29,264
The above aging schedule was based on the number of past due days from the end of the credit term.
The movements of the allowance for doubtful accounts receivable were as follows:
Individually
Assessed for
Impairment
Collectively
Assessed for
Impairment Total
Balance at January 1, 2016 $ 43,744 $ 10,600 $ 54,344
Impairment losses reversed (645) (10,600) (11,245)
Amounts written off during the year as
uncollectible (2,743) - (2,743)
Foreign exchange translation gains and losses (1,811) - (1,811)
Balance at December 31, 2016 38,545 - 38,545
Impairment losses reversed (10,107) - (10,107)
Foreign exchange translation gains and losses 173 - 173
Balance at December 31, 2017 $ 28,611 $ - $ 28,611
Accounts receivable of the Group were mainly concentrated to Customer A. The accounts receivable
from Customer A were $527,455 thousand and $774,523 thousand as of December 31, 2017 and 2016,
respectively.
12. INVENTORIES
December 31
2017 2016
Finished goods $ 814,904 $ 309,145
Semi-finished goods 218,500 130,969
Work in progress 4,940 28,704
Raw materials 1,105,015 992,525
$ 2,143,359 $ 1,461,343
The cost of inventories recognized as cost of goods sold for the years ended December 31, 2017 and 2016
included reversals of write-downs of inventories of $246,721 thousand and $232,336 thousand,
respectively. Previous write-downs were reversed as a result of the disposals of obsolete inventories.

- 37 -
13. NON-CURRENT ASSETS HELD FOR SALE
a. Discontinued operations
The board of directors of the subsidiary, Hydis Technologies Co., Ltd., resolved on January 6, 2015 to
shut down its display panel production line in order to focus on researching and developing patents and
licensing businesses. Therefore, the Group classified operations related to the production line as
discontinued operations.
The details of loss from discontinued operations and the related cash flow information are as follows:
For the Year Ended December 31
2017 2016
Operating revenue $ 133,081 $ 188,652
Operating costs (128,575) (272,851)
Gross profit (loss) 4,506 (84,199)
Operating expenses (452,088) (190,194)
Loss from operations (447,582) (274,393)
Impairment loss (159,388) (149,876)
Non-operating income and expenses (88,765) 40,119
Loss before tax (695,735) (384,150)
Income tax benefit (expense) (154,233) 319,562
Net loss for the year $ (849,968) $ (64,588)
Loss from discontinued operations attributable to:
Owners of the Company $ (805,175) $ (61,184)
Non-controlling interests (44,793) (3,404)
$ (849,968) $ (64,588)
Net cash used in operating activities $ (395,714) $ (514,471)
Net cash generated from investing activities 829,077 6,289
Net cash inflows (outflows) $ 433,363 $ (508,182)
b. Non-current assets held for sale
December 31
2017 2016
Property, plant and equipment held for sale $ - $ 973,212
Liabilities directly associated with non-current assets classified
as held for sale (included in provisions) $ - $ 179,053
The board of directors of the subsidiary, Hydis Technologies Co., Ltd., resolved to dispose of the
aforementioned property, plant and equipment of the discontinued operations in October 2015 and
reclassified the property, plant and equipment to non-current assets held for sale, which were presented
separately in the consolidated balance sheets. The board of directors of Hydis Technologies Co., Ltd.
resolved to sell the above property, plant and equipment to a non-related party in August 2017.
The Group determined the recoverable amount of the assets on the basis of their fair value less costs of
disposal, and the fair value of the recoverable amount was categorized as a Level 1 measurement. The
recoverable amount of KRW30,000,000 thousand was lower than the carrying amount. Therefore, an

- 38 -
impairment loss of $159,388 thousand was recognized as a loss from discontinued operations. The
Group has completed the related disposal procedures as of December 31, 2017.
The Group recognized an impairment loss of $149,876 thousand as a loss from discontinued operations
based on the future recoverable amount.
14. SUBSIDIARIES
Subsidiaries included in the consolidated financial statements are as follows:
Proportion of Ownership
(%)
December 31
Investor Investee Main Business 2017 2016 Remark
E Ink Holdings Inc. PVI Global Corp. Investment 100.00 100.00
E Ink Corporation Manufacture and sale of
electronic ink
45.31 45.31
Yuen Yu Investment Co.,
Ltd.
Investment 100.00 100.00
New Field e-Paper Co., Ltd. Wholesale and sale of
electronic parts
100.00 100.00
SiPix Technology, Inc. Manufacture and sale of
electronic ink
100.00 100.00
Dream Universe Ltd. Trading 100.00 100.00
Prime View
Communications Ltd.
Trading 100.00 100.00
Tech Smart Logistics Ltd. Trading 0.09 0.09
Hot Tracks International
Ltd.
Trading 100.00 100.00
New Field e-Paper
Co., Ltd.
E Ink Corporation Manufacture and sale of
electronic ink
12.88 12.88
Tech Smart Logistics Ltd. Trading 99.91 99.91
Yuen Yu Investment Lucky Joy Holdings Ltd. Investment 100.00 100.00
Co., Ltd. Linfiny Corporation Research, development and
sale of electronic ink
77.00 - a
YuanHan Materials Inc. Manufacture and sale of
electronic parts
100.00 - b
SiPix Technology,
Inc.
Linfiny Corporation Research, development and
sale of electronic ink
4.00 - a
Linfiny Corporation Linfiny Japan Inc. Research, development and
sale of electronic ink
100.00 - a
E Ink Corporation E Ink California, LLC Research, development and
sale of electronic ink
100.00 100.00
E Ink Japan Inc. Development of electronic ink
products
100.00 100.00
E Ink Systems, LLC Research and development of
application software
100.00 100.00
PVI Global Corp. PVI International Corp. Trading 100.00 100.00
Ruby Lustre Ltd. Investment 100.00 100.00
Dream Pacific International
Corp.
Sale of LCD monitor products 100.00 100.00
Transyork Technology
Yangzhou Ltd.
Assembly of LCD flat panels 55.61 55.61
Transmart Electronics
(Yangzhou) Ltd.
Research, development and
sale of LCD monitors
66.66 66.66
Tech Smart Logistics
Ltd.
E Ink Corporation Manufacture and sale of
electronic ink
41.81 41.81
Dream Universe Ltd. Transyang Electronics
(Yangzhou) Ltd.
Assembly of LCD flat panels 100.00 100.00
PVI International
Corp.
Transcend Optronics
(Yangzhou) Co., Ltd.
Assembly of LCD flat panels 100.00 100.00
(Continued)

- 39 -
Proportion of Ownership
(%)
December 31
Investor Investee Main Business 2017 2016 Remark
Ruby Lustre Ltd. Rich Optronics (Yangzhou)
Co., Ltd.
Assembly of LCD flat panels 100.00 100.00
Dream Pacific
International Corp.
Hydis Technologies Co.,
Ltd.
Research, development and
sale of LCD monitors
94.73 94.73
Yangzhou Huaxia Integrated
O/E System Co., Ltd.
Manufacture and sale of LED
products
24.19 - c
Hydis Technologies
Co., Ltd.
Hydis Taiwan Inc. Sale of LCD monitor products 100.00
100.00
Hydis Shenzhen Ltd. Sale of LCD monitor products 100.00 100.00
Transcend Optronics
(Yangzhou) Co.,
Yangzhou Huaxia Integrated
O/E System Co., Ltd.
Manufacture and sale of LED
products
75.81 75.81
Ltd. Transyork Technology
Yanzhou Ltd.
Assembly of LCD flat panels 44.39 44.39
Transmart Electronics
(Yangzhou) Ltd.
Research, development and
sale of LCD monitors
33.34 33.34
(Concluded)
a. The Group incorporated Linfiny Corporation and its subsidiary, Linfiny Japan Inc., in April 2017 to
expand the market of electronic paper products. The Group originally held 100% of both entities.
The Group had a joint venture partnership with Sony Semiconductor Solutions in September 2017 and
participated in the capital increase of Linfiny Corporation. The investment structure adjusted the
shareholding of the Group’s subsidiaries, Yuen Yu Investment Co., Ltd. and SiPix Technology, Inc., in
Linfiny Corporation to 77% and 4%, respectively. Therefore, the Group held 81% of Linfiny
Corporation after the joint venture. Refer to Note 21 for the related information.
b. The Group incorporated YuanHan Materials Inc. in August 2017 whose main business is the
manufacture and sale of related electronic paper display panel parts.
c. The Group’s subsidiary, Dream Pacific International Corp., acquired 24.19% of Yangzhou Huaxia
Integrated O/E System Co., Ltd. in the second quarter of 2017. Refer to Note 26 for the related
information.
15. PROPERTY, PLANT AND EQUIPMENT
Buildings Machinery
Other
Equipment
Construction
in Progress
and
Prepayments
for
Equipment Total
Cost
Balance at January 1, 2016 $ 4,500,823 $ 10,386,796 $ 5,538,549 $ 166,622 $ 20,592,790
Additions 342 87,010 154,246 62,482 304,080
Disposals (318,714) (483,095) (255,172) - (1,056,981)
Reclassifications (3,423) - - (790) (4,213)
Effects of foreign currency exchange
differences (154,753) (334,660) (215,399) (2,888) (707,700)
Balance at December 31, 2016 $ 4,024,275 $ 9,656,051 $ 5,222,224 $ 225,426 $ 19,127,976
(Continued)
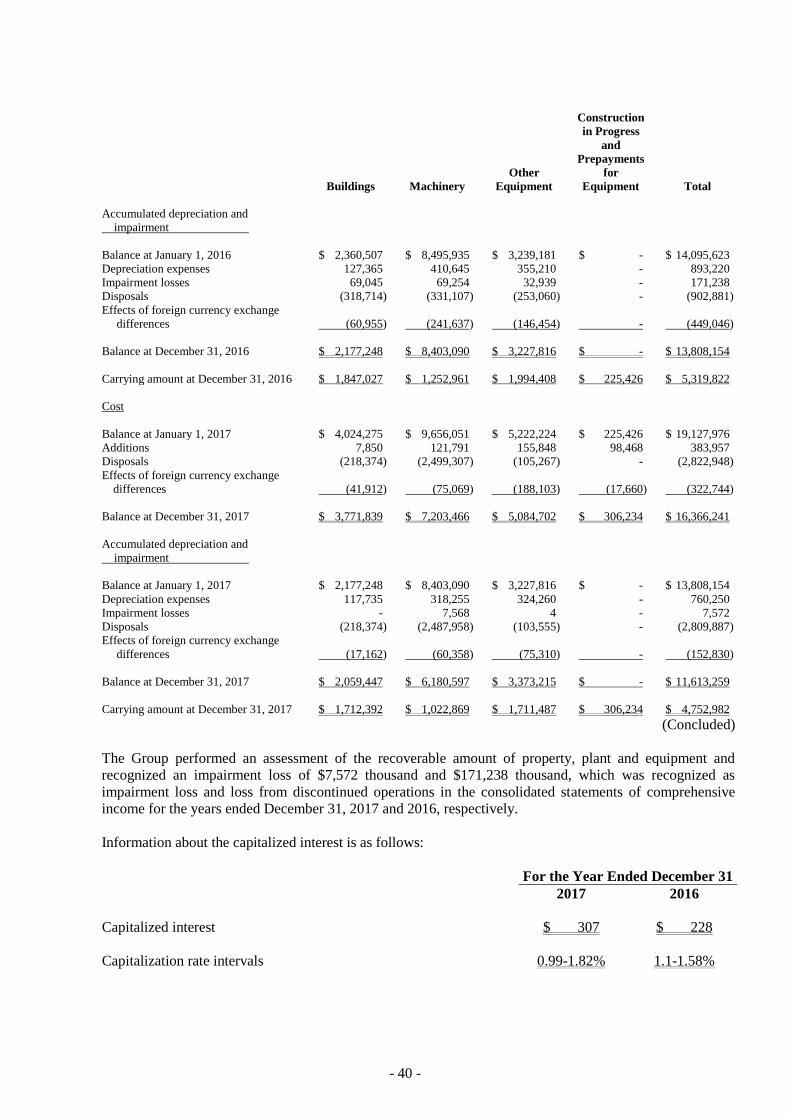
- 40 -
Buildings Machinery
Other
Equipment
Construction
in Progress
and
Prepayments
for
Equipment Total
Accumulated depreciation and
impairment
Balance at January 1, 2016 $ 2,360,507 $ 8,495,935 $ 3,239,181 $ - $ 14,095,623
Depreciation expenses 127,365 410,645 355,210 - 893,220
Impairment losses 69,045 69,254 32,939 - 171,238
Disposals (318,714) (331,107) (253,060) - (902,881)
Effects of foreign currency exchange
differences (60,955) (241,637) (146,454) - (449,046)
Balance at December 31, 2016 $ 2,177,248 $ 8,403,090 $ 3,227,816 $ - $ 13,808,154
Carrying amount at December 31, 2016 $ 1,847,027 $ 1,252,961 $ 1,994,408 $ 225,426 $ 5,319,822
Cost
Balance at January 1, 2017 $ 4,024,275 $ 9,656,051 $ 5,222,224 $ 225,426 $ 19,127,976
Additions 7,850 121,791 155,848 98,468 383,957
Disposals (218,374) (2,499,307) (105,267) - (2,822,948)
Effects of foreign currency exchange
differences (41,912) (75,069) (188,103) (17,660) (322,744)
Balance at December 31, 2017 $ 3,771,839 $ 7,203,466 $ 5,084,702 $ 306,234 $ 16,366,241
Accumulated depreciation and
impairment
Balance at January 1, 2017 $ 2,177,248 $ 8,403,090 $ 3,227,816 $ - $ 13,808,154
Depreciation expenses 117,735 318,255 324,260 - 760,250
Impairment losses - 7,568 4 - 7,572
Disposals (218,374) (2,487,958) (103,555) - (2,809,887)
Effects of foreign currency exchange
differences (17,162) (60,358) (75,310) - (152,830)
Balance at December 31, 2017 $ 2,059,447 $ 6,180,597 $ 3,373,215 $ - $ 11,613,259
Carrying amount at December 31, 2017 $ 1,712,392 $ 1,022,869 $ 1,711,487 $ 306,234 $ 4,752,982
(Concluded)
The Group performed an assessment of the recoverable amount of property, plant and equipment and
recognized an impairment loss of $7,572 thousand and $171,238 thousand, which was recognized as
impairment loss and loss from discontinued operations in the consolidated statements of comprehensive
income for the years ended December 31, 2017 and 2016, respectively.
Information about the capitalized interest is as follows:
For the Year Ended December 31
2017 2016
Capitalized interest $ 307 $ 228
Capitalization rate intervals 0.99-1.82% 1.1-1.58%

- 41 -
The above items of property, plant and equipment are depreciated on a straight-line basis over their
estimated useful lives as follows:
Buildings
Main buildings 20-56 years
Clean rooms and plumbing construction 25-36 years
Employee dormitories 20 years
Others 2-16 years
Machinery 1-10 years
Other equipment 1-26 years
16. GOODWILL AND OTHER INTANGIBLE ASSETS
December 31
2017 2016
Goodwill $ 6,702,636 $ 6,907,594
Other intangible assets
Patents 1,864,507 2,243,961
Others 24,646 26,920
1,889,153 2,270,881
$ 8,591,789 $ 9,178,475
Goodwill Patents Others Total
Balance at January 1, 2016 $ 6,954,923 $ 2,475,289 $ 31,618 $ 9,461,830
Additions - 185,850 10,871 196,721
Amortization expenses - (392,942) (14,196) (407,138)
Effects of foreign currency
exchange differences (47,329) (24,236) (1,373) (72,938)
Balance at December 31, 2016 6,907,594 2,243,961 26,920 9,178,475
Additions - 99,533 12,061 111,594
Amortization expenses - (392,847) (13,788) (406,635)
Effects of foreign currency
exchange differences (204,958) (86,140) (547) (291,645)
Balance at December 31, 2017 $ 6,702,636 $ 1,864,507 $ 24,646 $ 8,591,789
Other intangible assets were amortized on a straight-line basis over their estimated useful lives as follows:
Other intangible assets
Patents 6-17 years
Others 2-6 years

- 42 -
17. BORROWINGS
a. Short-term borrowings
December 31
2017 2016
Line of credit borrowings $ 377,600 $ 451,500
Foreign currency included (in thousands of USD) $ 10,000 $ 14,000
Interest rate intervals 0.98-2.08% 1.29-1.35%
b. Long-term borrowings
December 31
2017 2016
Long-term payables $ 163,538 $ 299,981
Less: Current portions 117,993 129,000
Long-term borrowings $ 45,545 $ 170,981
Long-term payables included interest-free infrastructure funds lent from the Yangzhou Economic and
Technological Development Zone Development Corporation to Yangzhou Huaxia Integrated O/E
System Co., Ltd. and redemption of unsecured corporate bonds issued by the subsidary, Hydis
Technologies Co., Ltd.
Hydis Technologies Co., Ltd. issued unsecured corporate bonds in the amount of KRW22,880,000
thousand in May 2008 and were acquired in equal parts by ALCO Electronics Limited and Varitronix
International Limited with a coupon rate of 4% and quarterly-paid interest. The corporate bonds
originally expired in May 2013. However, after several resolutions by the board of directors and
creditors, the expiration of the corporate bonds was extended to January 2014 and the coupon rate was
lowered to 3%. The corporate bonds were then redeemed by the subsidiaries, PVI Global Corp. and
Dream Pacific International Corp., on December 31, 2013 at the price of US$20,000 thousand. They
are expected to be paid off in July 2018, in principle with no interest, paid evenly over 5 years
beginning from July 2014. As of December 31, 2017 and 2016, the above payables included in the
current portion of long-term borrowings and in long-term payables were $117,993 thousand, $0,
$129,000 thousand and $124,493 thousand, respectively.
18. OTHER PAYABLES
December 31
2017 2016
Payables for salaries or bonuses $ 808,450 $ 759,601
Payables for utilities 136,150 67,771
Payable for professional service fees 130,935 95,248
Payables for construction and equipment 86,466 35,819
Others 479,419 306,025
$ 1,641,420 $ 1,264,464

- 43 -
19. PROVISIONS
December 31
2017 2016
Litigation provisions (a) $ 616,849 $ 13,545
Warranties (b) 20,932 26,760
Employee benefits (c) - 262,830
Onerous leases (d) - 179,053
$ 637,781 $ 482,188
a. Litigation provisions are estimated by the Group’s management based on the expected highly probable
outcomes of related litigations.
b. The provision for warranty claims represents the present value of the Group’s management’s best
estimate of the future outflow of the economic benefits based on historical experience which will be
required under the Group’s obligations for warranties under the local legislation for the sale of goods.
c. Employee benefits are the estimated payables in accordance with employee early retirement plans and
related regulations.
d. The provision for onerous lease contracts represents the present value of the future lease payments that
the Group is presently obligated to make under non-cancellable onerous operating lease contracts less
revenue expected to be earned on the leases, where applicable. The estimate may vary as a result of
changes in the utilization of the leased premises and sub-lease arrangements, where applicable.
20. RETIREMENT BENEFIT PLANS
a. Defined contribution plans
The Company and its subsidiaries, SiPix Technology Inc., Linfiny Corporation, YuanHan Materials Inc.
and Hydis Taiwan Inc., adopted a pension plan under the Labor Pension Act (the “LPA”), which is a
state-managed defined contribution plan. Under the LPA, each entity makes monthly contributions to
employees’ individual pension accounts at 6% of monthly salaries and wages.
The employees of the Group’s subsidiaries in China are members of a state-managed retirement benefit
plan operated by the government of China.
b. Defined benefit plans
The defined benefit plan adopted by the Company in accordance with the Labor Standards Law is
operated by the government of the ROC. Pension benefits are calculated on the basis of the length of
service and average monthly salaries of the 6 months before retirement. The Company contributes
amounts equal to 2% of total monthly salaries and wages to a pension fund administered by the pension
fund monitoring committee. Pension contributions are deposited in the Bank of Taiwan in the
committee’s name. Before the end of each year, the Company assesses the balance in the pension
fund. If the amount of the balance in the pension fund is inadequate to pay retirement benefits for
employees who conform to retirement requirements in the next year, the Company is required to fund
the difference in one appropriation that should be made before the end of March of the next year. The
pension fund is managed by the Bureau of Labor Funds, Ministry of Labor (“the Bureau”); the
Company has no right to influence the investment policy and strategy.
The defined benefit plan adopted by Hydis Technologies Co., Ltd. in accordance with the law is
operated by the government of South Korea.
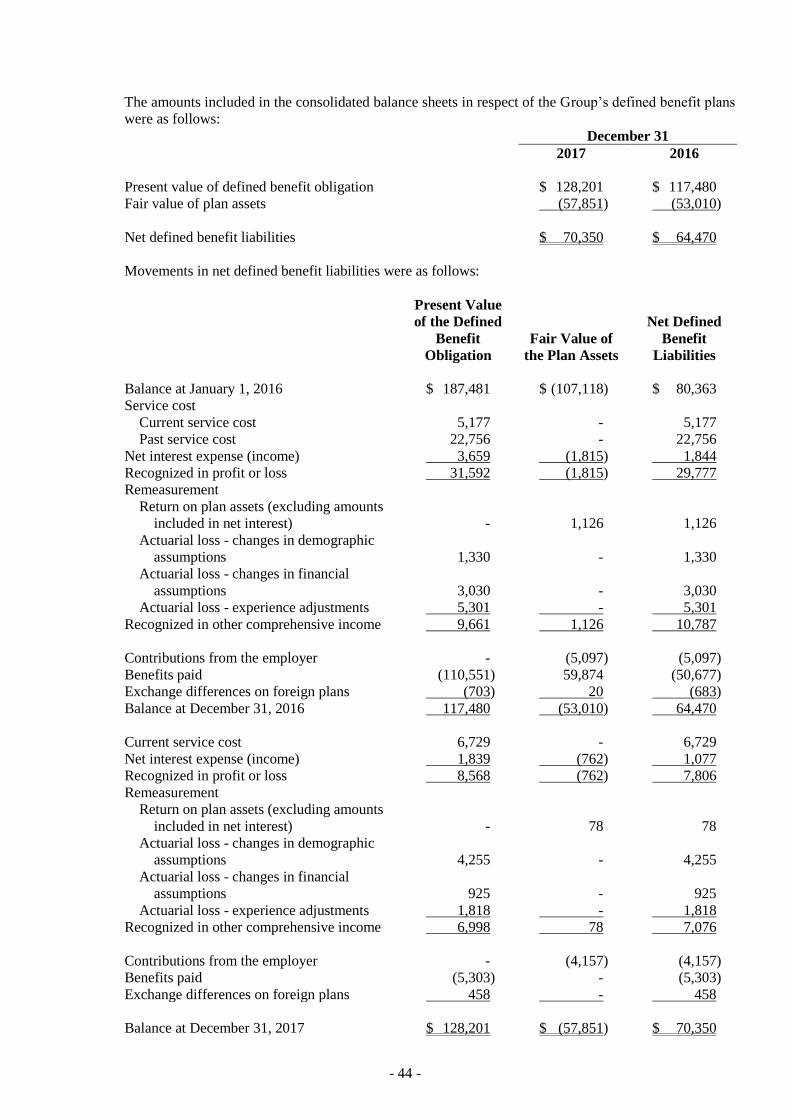
- 44 -
The amounts included in the consolidated balance sheets in respect of the Group’s defined benefit plans
were as follows:
December 31
2017 2016
Present value of defined benefit obligation $ 128,201 $ 117,480
Fair value of plan assets (57,851) (53,010)
Net defined benefit liabilities $ 70,350 $ 64,470
Movements in net defined benefit liabilities were as follows:
Present Value
of the Defined
Benefit
Obligation
Fair Value of
the Plan Assets
Net Defined
Benefit
Liabilities
Balance at January 1, 2016 $ 187,481 $ (107,118) $ 80,363
Service cost
Current service cost 5,177 - 5,177
Past service cost 22,756 - 22,756
Net interest expense (income) 3,659 (1,815) 1,844
Recognized in profit or loss 31,592 (1,815) 29,777
Remeasurement
Return on plan assets (excluding amounts
included in net interest) - 1,126 1,126
Actuarial loss - changes in demographic
assumptions 1,330 - 1,330
Actuarial loss - changes in financial
assumptions 3,030 - 3,030
Actuarial loss - experience adjustments 5,301 - 5,301
Recognized in other comprehensive income 9,661 1,126 10,787
Contributions from the employer - (5,097) (5,097)
Benefits paid (110,551) 59,874 (50,677)
Exchange differences on foreign plans (703) 20 (683)
Balance at December 31, 2016 117,480 (53,010) 64,470
Current service cost 6,729 - 6,729
Net interest expense (income) 1,839 (762) 1,077
Recognized in profit or loss 8,568 (762) 7,806
Remeasurement
Return on plan assets (excluding amounts
included in net interest) - 78 78
Actuarial loss - changes in demographic
assumptions 4,255 - 4,255
Actuarial loss - changes in financial
assumptions 925 - 925
Actuarial loss - experience adjustments 1,818 - 1,818
Recognized in other comprehensive income 6,998 78 7,076
Contributions from the employer - (4,157) (4,157)
Benefits paid (5,303) - (5,303)
Exchange differences on foreign plans 458 - 458
Balance at December 31, 2017 $ 128,201 $ (57,851) $ 70,350

- 45 -
Through the defined benefit plans under the Labor Standards Law, the Group is exposed to the
following risks:
1) Investment risk: The plan assets are invested in domestic and foreign equity and debt securities,
bank deposits, etc. The investment is conducted at the discretion of the Bureau or under the
mandated management. However, in accordance with relevant regulations, the return generated by
plan assets should not be below the interest rate for a 2-year time deposit with local banks.
2) Interest risk: A decrease in the government and corporate bond interest rates will increase the
present value of the defined benefit obligation; however, this will be partially offset by an increase
in the return on the plans’ debt investments.
3) Salary risk: The present value of the defined benefit obligation is calculated by reference to the
future salaries of plan participants. As such, an increase in the salaries of the plan participants will
increase the present value of the defined benefit obligation.
The actuarial valuations of the present value of the defined benefit obligation were carried out by
qualified actuaries. The significant assumptions used for the purposes of the actuarial valuations were
as follows:
December 31
2017 2016
Discount rates 1.4-3.6% 1.4-3.2%
Expected rates of salary increase 2.8-3.3% 2.8-3.0%
If possible reasonable changes in each of the significant actuarial assumptions will occur and all other
assumptions will remain constant, the present value of the defined benefit obligation would
decrease/increase as follows:
December 31
2017 2016
Discount rates
0.25-1% increase $ (4,154) $ (4,014)
0.25-1% decrease $ 4,378 $ 4,226
Expected rates of salary increase
0.25-1% increase $ 4,269 $ 4,133
0.25-1% decrease $ (4,079) $ (3,954)
The sensitivity analysis presented above may not be representative of the actual changes in the present
value of the defined benefit obligation as it is unlikely that changes in assumptions would occur in
isolation of one another as some of the assumptions may be correlated.
December 31
2017 2016
Expected contributions to the plans for the next year $ 4,134 $ 4,787
Average duration of the defined benefit obligation 3-13 years 4-13 years

- 46 -
21. EQUITY
a. Ordinary shares
December 31
2017 2016
Number of shares authorized (in thousands) 2,000,000 2,000,000
Amount of shares authorized $ 20,000,000 $ 20,000,000
Number of shares issued and fully paid (in thousands) 1,140,468 1,140,468
Amount of shares issued $ 11,404,677 $ 11,404,677
b. Capital surplus
December 31
2017 2016
May be used to offset a deficit, distributed as cash dividends or
transferred to share capital (1)
Issuance of shares $ 9,494,322 $ 9,494,322
Conversion of bonds 525,200 525,200
Treasury share transactions 20,106 -
The difference between consideration received or paid and the
carrying amount of the subsidiaries net assets during actual
disposals or acquisitions
- 2,223
May only be used to offset a deficit (2)
Changes in percentage of ownership interests in subsidiaries $ 49,840 $ 49,833
Share of changes in capital surplus of associates 105 105
May not be used for any purpose
Employee share options 18,546 -
$ 10,108,119 $ 10,071,683
Note 1: Such capital surplus may be used to offset a deficit; in addition, when the Company has no
deficit, such capital surplus may be distributed as cash dividends or transferred to share capital
(limited to a certain percentage of the Company’s capital surplus and once a year).
Note 2: Such capital surplus arises from the effects of changes in ownership interests in subsidiaries
resulting from equity transactions other than actual disposals or acquisitions, or from changes
in capital surplus of subsidiaries accounted for using the equity method.
c. Retained earnings and dividends policy
Under the dividends policy as set forth in the Company’s amended Articles of Incorporation, where the
Company made a profit in a fiscal year, the profit shall be first utilized for paying taxes, offsetting
losses of previous years, setting aside a legal reserve of 10% of the remaining profit, setting aside or
reversing a special reserve in accordance with the laws and regulations, and then any remaining profit
together with at least 50% of any undistributed retained earnings shall be used by the Company’s board
of directors as the basis for proposing a distribution plan, which should be resolved in the shareholders’
meeting for the distribution of dividends and bonuses to shareholders. For the policies on the

- 47 -
distribution of employees’ compensation and remuneration of directors after the amendment, refer to
Note 22.
The Company’s Articles of Incorporation also stipulate a dividends policy whereby the issuance of
share dividends takes precedence over the payment of cash dividends. In principle, cash dividends
should be at least 10% of the total dividends distributed.
The appropriation of earnings to a legal reserve shall be made until the legal reserve equals the
Company’s paid-in capital. The legal reserve may be used to offset deficits. If the Company has no
deficits and the legal reserve has exceeded 25% of the Company’s paid-in capital, the excess may be
transferred to capital or distributed in cash.
Items referred to under Rule No. 1010012865 issued by the FSC and in the directive titled “Questions
and Answers for Special Reserves Appropriated Following Adoption of IFRSs” should be appropriated
to or reversed from a special reserve by the Company.
Except for non-ROC resident shareholders, all shareholders receiving dividends are allowed a tax credit
equal to their proportionate share of the income tax paid by the Company.
The appropriations of earnings for 2016 and 2015 approved in the shareholders’ meetings on June 20,
2017 and June 22, 2016, respectively, and the dividends per share were as follows:
Appropriation of Earnings Dividends Per Share (NT$)
For the Year Ended
December 31
For the Year Ended
December 31
2016 2015 2016 2015
Legal reserve $ 190,794 $ 53,933
Cash dividends 1,680,702 536,020 $ 1.50 $ 0.47
The appropriation of earnings for 2017 were proposed by the Company’s board of directors on March
27, 2018. The appropriation and dividends per share were as follows:
Appropriation
of Earnings
Dividends Per
Share (NT$)
Legal reserve $ 207,806
Cash dividends 1,853,550 $1.65
The appropriation of earnings for 2017 is subject to resolution in the shareholders meeting to be held on
June 22, 2018.
d. Special reserve
If the special reserve appropriated on the first-time adoption of IFRSs relates to exchange differences on
translating the financial statements of foreign operations, the special reserve will be reversed on the
Company’s disposal of the foreign operations; on the Company’s loss of significant influence, however,
the entire special reserve will be reversed. An additional special reserve should be appropriated for the
amount equal to the difference between the net debit balance of the reserves and the special reserve
appropriated on the first-time adoption of IFRSs. Any special reserve appropriated may be reversed to
the extent that the net debit balance reverses and may thereafter be distributed.

- 48 -
e. Other equity items
1) Exchange differences on translating foreign operations
For the Year Ended December 31
2017 2016
Balance at January 1 $ 261,704 $ 966,474
Exchange differences on translating foreign operations (502,225) (703,887)
Gain on disposal of foreign operations reclassified to profit or
loss - 4,202
Share of exchange difference of associates and join ventures
accounted for using the equity method (2,102) (5,085)
Balance at December 31 $ (242,623) $ 261,704
2) Unrealized gain on available-for-sale financial assets
For the Year Ended December 31
2017 2016
Balance at January 1 $ 226,916 $ 114,217
Unrealized gain on available-for-sale financial assets 122,316 112,699
Balance at December 31 $ 349,232 $ 226,916
f. Non-controlling interests
For the Year Ended December 31
2017 2016
Balance at January 1 $ (876) $ (96,281)
Attributable to non-controlling interests:
Share of profit for the year 4,265 85,382
Remeasurement of defined benefit plans (12) (149)
Exchange differences on translating foreign operations 19,807 10,172
Acquisition of non-controlling interests in subsidiaries
(Note 26) 191,413 -
Others (Note) 79,800 -
Balance at December 31 $ 294,397 $ (876)
Note: The Group had a joint venture partnership with Sony Semiconductor Solutions in September
2017 to increase its shareholding in Linfiny Corporation. The Group’s shareholding of
Linfiny Corporation went from 100% to 81%, which led to an increase in non-controlling
interests.
g. Treasury shares
For the Year Ended December 31
2017 2016
Number of shares at January 1 (in thousands) 20,000 -
Acquisition of treasury shares (in thousands) - 20,000
Number of shares transferred to employees (in thousands) (2,896) -
Number of shares at December 31 (in thousands) 17,104 20,000

- 49 -
The board of directors of the Company resolved to repurchase 20,000 thousand shares of treasury
shares on June 13, 2016, which was completed in August 2016 and will be transferred to employees.
Under the Securities and Exchange Act, the Company shall neither pledge treasury shares nor exercise
shareholders’ rights on these shares, such as the rights to dividends and to vote.
22. DEPRECIATION AND AMORTIZATION AND EMPLOYEE BENEFITS EXPENSE FROM
CONTINUING OPERATIONS
a. Depreciation and amortization
For the Year Ended December 31
2017 2016
Property, plant and equipment $ 760,250 $ 893,220
Other intangible assets 406,529 406,969
Other non-current assets 12 10,416
$ 1,166,791 $ 1,310,605
An analysis of depreciation by function
Operating costs $ 424,332 $ 580,336
Operating expenses 335,918 312,884
$ 760,250 $ 893,220
An analysis of amortization by function
Operating costs $ 2,502 $ 2,806
Operating expenses 404,039 414,579
$ 406,541 $ 417,385
b. Employee benefits expense
For the Year Ended December 31
2017 2016
Post-employment benefits (Note 20)
Defined contribution plans $ 67,279 $ 81,410
Defined benefit plans 5,512 25,825
72,791 107,235
Share-based payments
Equity-settled 38,825 -
Other employee benefits 3,256,795 3,394,566
Total employee benefits expense $ 3,368,411 $ 3,501,801
An analysis of employee benefits expense by function
Operating costs $ 953,727 $ 1,261,886
Operating expenses 2,414,684 2,239,915
$ 3,368,411 $ 3,501,801

- 50 -
c. Employees’ compensation and remuneration of directors
The Company accrued employees’ compensation and remuneration of directors at the rates of no less
than 1% and no higher than 10% and no higher than 1%, respectively, of net profit before income tax,
employees’ compensation and remuneration of directors. The employees’ compensation and
remuneration of directors for the years ended December 31, 2017 and 2016, which have been approved
by the Company’s board of directors on March 27, 2018 and March 22, 2017, respectively, were as
follows:
For the Year Ended December 31
2017 2016
Employees’ compensation $ 23,000 $ 20,000
Remuneration of directors $ 13,000 $ 8,600
If there is a change in the amounts after the annual consolidated financial statements were authorized
for issue, the differences are recorded as a change in the accounting estimate in the following year.
There was no difference between the actual amounts of employees’ compensation and remuneration of
directors paid and the amounts recognized in the consolidated financial statements for the years ended
December 31, 2016 and 2015.
Information on the appropriation of earnings proposed and employees’ compensation and remuneration
of directors resolved by the Company’s board of directors and the appropriation of earnings and the
employees’ compensation and remuneration of directors resolved in the shareholders’ meetings is
available at the Market Observation Post System website of the Taiwan Stock Exchange.
23. INCOME TAX RELATING TO CONTINUING OPERATIONS
a. Income tax recognized in profit or loss
The major components of income tax expense were as follows:
For the Year Ended December 31
2017 2016
Current tax
In respect of the current year $ 327,955 $ 195,497
Adjustments for the prior years (20,454) 18,726
307,501 214,223
Deffered tax
Deferred tax in respect of the current year (38,519) 136,392
Effect of tax rate changes 136,731 -
98,212 136,392
Income tax expense recognized in profit or loss $ 405,713 $ 350,615

- 51 -
A reconciliation of accounting profit and income tax expense is as follows:
For the Year Ended December 31
2017 2016
Profit before tax from continuing operations $ 3,338,011 $ 2,408,524
Income tax expense calculated at the statutory rate $ 567,462 $ 409,449
Nondeductible expenses in determining taxable income 120,071 95,285
Tax-exempt income (23,676) (34,066)
Unrecognized loss carryforwards, deductible temporary
differences and investment credits (564,184) (394,959)
Tax rate exchange 136,731 -
Effect of different tax rates of group entities operating in other
jurisdictions 63,934 112,776
Adjustments for prior years’ tax (20,454) 18,726
Others 125,829 143,404
Income tax expense recognized in profit or loss $ 405,713 $ 350,615
The applicable corporate income tax rate used by the group entities in the ROC is 17%, while the
applicable tax rate used by subsidiaries in China is 25%. Tax rates used by other group entities
operating in other jurisdictions are based on the tax laws in those jurisdictions.
In February 2018, it was announced that the Income Tax Act in the ROC was amended and, starting
from 2018, the corporate income tax rate will be adjusted from 17% to 20%. In addition, the rate of
the corporate surtax applicable to the 2018 unappropriated earnings will be reduced from 10% to 5%.
In December 2017, the US amended the Income Tax Law, which reduces a profit-seeking enterprise’s
income tax rate from 35% to 21%, effective in 2018. Deferred tax assets and deferred tax liabilities
recognized as at December 31, 2017 are expected to be adjusted and increase by $36,119 thousand and
$3,068 thousand, respectively, in 2018.
As the status of the 2018 appropriation of earnings is uncertain, the potential income tax consequences
of the 2017 unappropriated earnings are not reliably determinable.
b. Current tax assets and liabilities
December 31
2017 2016
Current tax assets
Prepaid income tax $ 309,128 $ 415,676
Tax refund receivable 6,101 10,159
$ 315,229 $ 425,835
Current tax liabilities
Income tax payable $ 153,649 $ 74,052

- 52 -
c. Deferred tax assets and liabilities
The movements of deferred tax assets and deferred tax liabilities (included in non-current liabilities)
were as follows:
For the year ended December 31, 2017
Opening
Balance
Recognized in
Profit or Loss
Recognized for
Discontinuing
Operations
Recognized in
Other
Comprehensive
Income
Exchange
Differences Closing Balance
Deferred tax assets
Temporary differences
Property, plant and equipment $ 424,892 $ 122,388 $ (305,239 ) $ - $ (208 ) $ 241,833
Other payables 266,902 (82,012 ) 45,306 - (7,255 ) 222,941
Inventories 276,429 (122,459 ) - - (5,723 ) 148,247
Deferred revenue 4,246 38,944 - - 190 43,380
Defined benefit plans 10,248 - - 1,165 - 11,413
Others 32,373 (12,926 ) - - (92 ) 19,355
1,015,090 (56,065 ) (259,933 ) 1,165 (13,088 ) 687,169
Loss carryforwards 494,294 (98,518 ) 105,700 - 3,547 505,023
Investment credits 179,894 68,566 - - (15,403 ) 233,057
$ 1,689,278 $ (86,017 ) $ (154,233 ) $ 1,165 $ (24,944 ) $ 1,425,249
Deferred tax liabilities
Temporary differences
Others $ 16,135 $ 12,195 $ - $ - $ - $ 28,330
For the year ended December 31, 2016
Opening
Balance
Recognized in
Profit or Loss
Recognized for
Discontinuing
Operations
Recognized in
Other
Comprehensive
Income
Exchange
Differences Closing Balance
Deferred tax assets
Temporary differences
Property, plant and equipment $ 713,950 $ (269,365 ) $ - $ - $ (19,693 ) $ 424,892
Inventories 282,587 (4,447 ) - - (1,711 ) 276,429
Other payables 318,313 (43,185 ) - - (8,226 ) 266,902
Defined benefit plans 8,895 - - 1,353 - 10,248
Others 43,592 (6,264 ) - - (709 ) 36,619
1,367,337 (323,261 ) - 1,353 (30,339 ) 1,015,090
Loss carryforwards 21,833 154,564 319,562 - (1,665 ) 494,294
Investment credits 139,586 42,771 - - (2,463 ) 179,894
$ 1,528,756 $ (125,926 ) $ 319,562 $ 1,353 $ (34,467 ) $ 1,689,278
Deferred tax liabilities
Temporary differences
Others $ 5,670 $ 10,466 $ - $ - $ (1 ) $ 16,135
d. Deductible temporary differences and unused loss carryforwards for which no deferred tax assets have
been recognized in the consolidated balance sheets
December 31
2017 2016
Loss carryforwards
Expire in 2017 $ - $ 498,482
Expire in 2018 120,247 213,380
Expire in 2019 85,894 154,081
Expire in 2020 1,079,321 1,163,779
Expire in 2021 53,159 424,751
(Continued)

- 53 -
December 31
2017 2016
Expire in 2022 $ 976,666 $ 1,420,063
Expire in 2023 461,982 1,526,109
Expire in 2024 12,087 252,125
Expire in 2025 1,060,500 51,133
Expire in 2026 23,137 51,733
Expire in 2027 449,442 28,332
Expire in 2028 - 28,332
Expire in 2029 446 28,332
Expire in 2030 26,145 28,332
$ 4,399,026 $ 5,868,964
Deductible temporary differences $ 2,523,786 $ 2,133,074
(Concluded)
e. Information about unused loss carryforwards
Loss carryforwards as of December 31, 2017 comprised:
Expiry Year
Unused Amount
$ 162,634 2018
128,281 2019
1,186,063 2020
95,546 2021
1,019,053 2022
1,813,676 2023
54,474 2024
1,842,802 2025
49,282 2026
525,587 2027
26,145 2028
26,145 2029
26,145 2030
$ 6,955,833
f. The aggregate amount of temporary difference associated with investments for which deferred tax
liabilities have not been recognized
As of December 31, 2017 and 2016, the taxable temporary differences associated with investments in
subsidiaries for which no deferred tax liabilities have been recognized were $6,466,056 thousand and
$6,161,086 thousand, respectively.

- 54 -
g. Integrated income tax
December 31
2017 2016
Unappropriated earnings $ 4,246,203 $ 4,301,134
Generated on and after January 1, 1998 (Note)
Shareholder-imputed credit amounts (“ICA”) $ 247,457 $ 447,942
(Note)
For the Year Ended December 31
2017 2016
Creditable ratio for distribution of earnings (Note) 11.05%
Note: Since the amended Income Tax Act announced in February 2018 abolished the imputation tax
system, no creditable ratio for the distribution of earnings in 2017 is expected.
h. Income tax assessments
Income tax assessments of the Group were as follows:
Company
Latest
Assessment
Year
The Company 2015
Yuen Yu Investment Co., Ltd. 2015
New Field e-Paper Co., Ltd. 2015
SiPix Technology, Inc. 2015
Hydis Taiwan Inc. 2017 (Note)
Note: Assessment of dissolution and liquidation.
24. EARNINGS PER SHARE
Unit: NT$ Per Share
For the Year Ended December 31
2017 2016
Basic earnings per share
For continuing operations $ 2.57 $ 1.74
For discontinued operations (0.72) (0.05)
$ 1.85 $ 1.69
Diluted earnings per share
For continuing operations $ 2.56 $ 1.74
For discontinued operations (0.71) (0.05)
$ 1.85 $ 1.69

- 55 -
The earnings and weighted average number of ordinary shares outstanding in the computation of earnings
per share were as follows:
Net Profit (Loss) for the Year
For the Year Ended December 31
2017 2016
Profit for the year attributable to owners of the Company $ 2,883,240 $ 1,969,123
Loss for the year from discontinued operations (805,175) (61,184)
Earnings used in the computation of diluted earnings per share $ 2,078,065 $ 1,907,939
Weighted Average Number of Ordinary Shares Outstanding
(In Thousand Shares)
For the Year Ended December 31
2017 2016
Weighted average number of ordinary shares in computation of basic
earnings per share 1,121,916 1,130,865
Effect of potentially dilutive ordinary shares
Employees’ compensation 656 952
Employees’ share options 1,660 -
Weighted average number of ordinary shares used in the
computation of diluted earnings per share 1,124,232 1,131,817
If the Group offered to settle compensation or bonuses paid to employees in cash or shares, the Group
assumed the entire amount of the compensation or bonuses will be settled in shares and the resulting
potential shares were included in the weighted average number of shares outstanding used in the
computation of diluted earnings per share, as the effect is dilutive. Such dilutive effect of the potential
shares was included in the computation of diluted earnings per share until the number of shares to be
distributed to employees is resolved in the following year.
Since the exercise price of the options or warrants issued by the Company exceeded the average market
price of the shares during 2016, they were anti-dilutive and excluded from the computation of diluted
earnings per share.
25. EMPLOYEE SHARE OPTIONS
Qualified employees of the Company and its subsidiaries were granted 4,500 options in July 2010. Each
option entitles the holder to subscribe for one thousand ordinary shares of the Company. The options
granted are valid for 6 years, expired in July 2016, and were exercisable at certain percentages after the
second or third anniversary from the grant date. The options were granted at an exercise price equal to
70% of the closing price of the Company’s ordinary shares listed the day before the grant date. For any
subsequent changes in the Company’s shares, such as share issuances for cash, retained earnings transferred
to capital and capital surplus transferred to capital, the exercise price is adjusted accordingly.
The board of directors resolved on March 22, 2017 to transfer 7,289 thousand treasury shares to qualified
employees of the Company and its subsidiaries. In compliance with the Corporation’s Article of
Incorporation, the transfer price is the average of the actual buy back price.
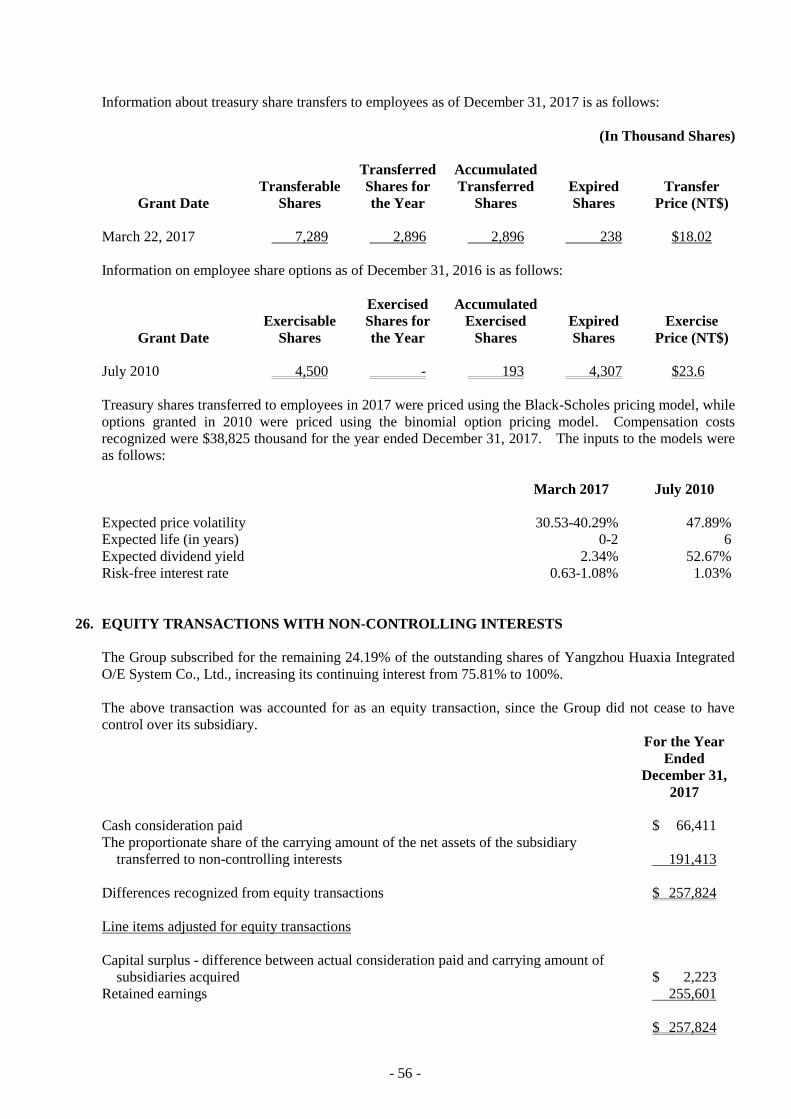
- 56 -
Information about treasury share transfers to employees as of December 31, 2017 is as follows:
(In Thousand Shares)
Grant Date
Transferable
Shares
Transferred
Shares for
the Year
Accumulated
Transferred
Shares
Expired
Shares
Transfer
Price (NT$)
March 22, 2017 7,289 2,896 2,896 238 $18.02
Information on employee share options as of December 31, 2016 is as follows:
Grant Date
Exercisable
Shares
Exercised
Shares for
the Year
Accumulated
Exercised
Shares
Expired
Shares
Exercise
Price (NT$)
July 2010 4,500 - 193 4,307 $23.6
Treasury shares transferred to employees in 2017 were priced using the Black-Scholes pricing model, while
options granted in 2010 were priced using the binomial option pricing model. Compensation costs
recognized were $38,825 thousand for the year ended December 31, 2017. The inputs to the models were
as follows:
March 2017 July 2010
Expected price volatility 30.53-40.29% 47.89%
Expected life (in years) 0-2 6
Expected dividend yield 2.34% 52.67%
Risk-free interest rate 0.63-1.08% 1.03%
26. EQUITY TRANSACTIONS WITH NON-CONTROLLING INTERESTS
The Group subscribed for the remaining 24.19% of the outstanding shares of Yangzhou Huaxia Integrated
O/E System Co., Ltd., increasing its continuing interest from 75.81% to 100%.
The above transaction was accounted for as an equity transaction, since the Group did not cease to have
control over its subsidiary.
For the Year
Ended
December 31,
2017
Cash consideration paid $ 66,411
The proportionate share of the carrying amount of the net assets of the subsidiary
transferred to non-controlling interests 191,413
Differences recognized from equity transactions $ 257,824
Line items adjusted for equity transactions
Capital surplus - difference between actual consideration paid and carrying amount of
subsidiaries acquired $ 2,223
Retained earnings 255,601
$ 257,824
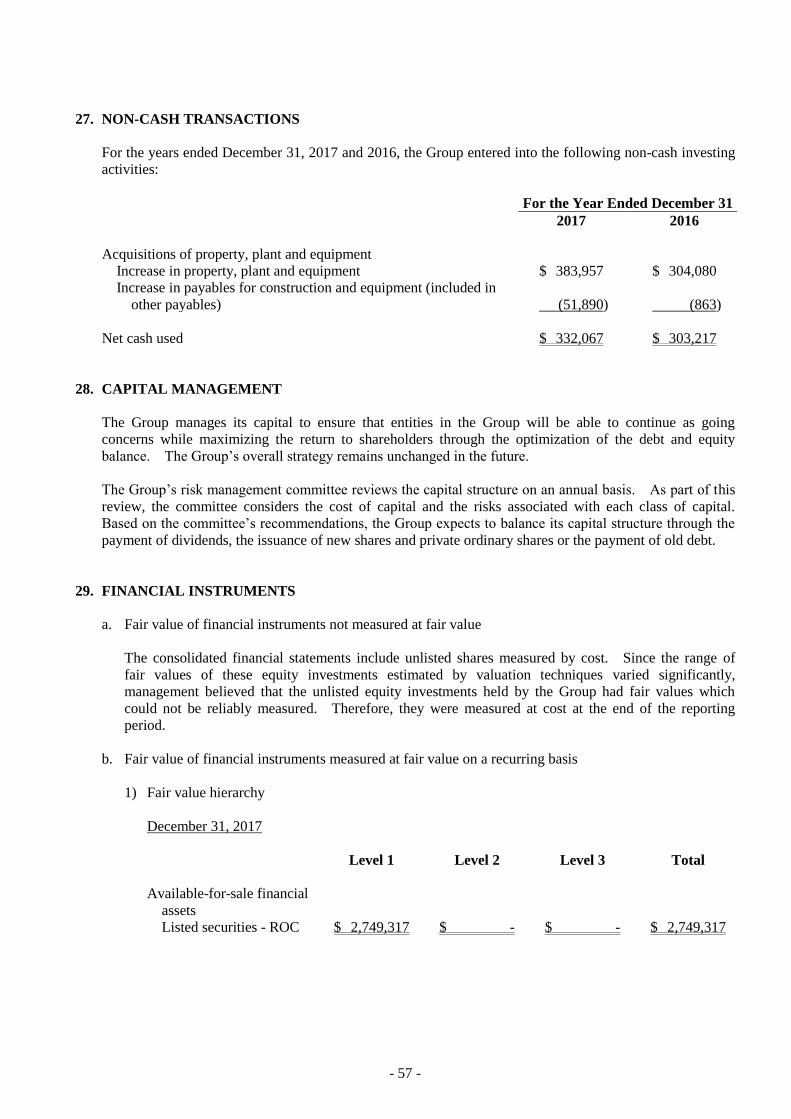
- 57 -
27. NON-CASH TRANSACTIONS
For the years ended December 31, 2017 and 2016, the Group entered into the following non-cash investing
activities:
For the Year Ended December 31
2017 2016
Acquisitions of property, plant and equipment
Increase in property, plant and equipment $ 383,957 $ 304,080
Increase in payables for construction and equipment (included in
other payables) (51,890) (863)
Net cash used $ 332,067 $ 303,217
28. CAPITAL MANAGEMENT
The Group manages its capital to ensure that entities in the Group will be able to continue as going
concerns while maximizing the return to shareholders through the optimization of the debt and equity
balance. The Group’s overall strategy remains unchanged in the future.
The Group’s risk management committee reviews the capital structure on an annual basis. As part of this
review, the committee considers the cost of capital and the risks associated with each class of capital.
Based on the committee’s recommendations, the Group expects to balance its capital structure through the
payment of dividends, the issuance of new shares and private ordinary shares or the payment of old debt.
29. FINANCIAL INSTRUMENTS
a. Fair value of financial instruments not measured at fair value
The consolidated financial statements include unlisted shares measured by cost. Since the range of
fair values of these equity investments estimated by valuation techniques varied significantly,
management believed that the unlisted equity investments held by the Group had fair values which
could not be reliably measured. Therefore, they were measured at cost at the end of the reporting
period.
b. Fair value of financial instruments measured at fair value on a recurring basis
1) Fair value hierarchy
December 31, 2017
Level 1 Level 2 Level 3 Total
Available-for-sale financial
assets
Listed securities - ROC $ 2,749,317 $ - $ - $ 2,749,317

- 58 -
December 31, 2016
Level 1 Level 2 Level 3 Total
Financial assets at FVTPL
Derivative financial
instruments -
convertible bonds $ - $ - $ 289,860 $ 289,860
Non-derivative financial
instruments - mutual
funds 115,465 - - 115,465
$ 115,465 $ - $ 289,860 $ 405,325
Available-for-sale financial
assets
Listed securities - ROC $ 1,787,015 $ - $ - $ 1,787,015
There were no transfers between Levels 1 and 2 in the current and prior periods.
2) Reconciliation of Level 3 fair value measurements of financial instruments
For the year ended December 31, 2017
Financial Assets
at FVTPL
Financial Assets
Convertible
Bonds
Balance at January 1 $ 289,860
Recognized in profit or loss 101,268
Recognized in other comprehensive loss (17,083)
Repayments (374,045)
Balance at December 31 $ -
For the year ended December 31, 2016
Financial Assets
at FVTPL
Available-for-
sale Financial
Assets
Financial Assets
Convertible
Bonds
Equity
Instruments Total
Balance at January 1 $ 295,084 $ 26 $ 295,110
Recognized in profit or loss (65) (25) (90)
Recognized in other comprehensive loss (5,159) (1) (5,160)
Balance at December 31 $ 289,860 $ - $ 289,860

- 59 -
3) Valuation techniques and inputs applied for Level 3 fair value measurement
Financial Instruments Valuation Techniques and Inputs
Derivatives - convertible bonds Fair values are determined according to the calculation of the
evaluation model and relevant value analysis report by
financial institutions. Significant unobservable input
changes are as follows. When net value per share increases,
volatility decreases, risk-free interest rate decreases, risk
premium decreases or liquidity discount decreases, and the
fair value of such investment increases.
c. Categories of financial instruments
December 31
2017 2016
Financial assets
Fair value through profit or loss (FVTPL) $ - $ 405,325
Loans and receivables (Note 1) 14,932,789 10,892,674
Available-for-sale financial assets (Note 2) 3,017,298 2,087,270
Financial liabilities
Financial liabilities measured at amortized cost (Note 3) 4,383,674 3,152,339
Note 1: The balances included cash and cash equivalents, debt investments with no active market,
accounts receivable, other receivables and other financial assets.
Note 2: The balances included available-for-sale financial assets measured at cost.
Note 3: The balances included short-term borrowings, notes and accounts payable, other payables and
long-term borrowings (current portion included).
d. Financial risk management objectives and policies
The Group’s major financial instruments include equity and debt investments, trade receivables, trade
payables and borrowings. The Group’s Corporate Treasury function provides services to the business
and monitors and manages the financial risks relating to the operations of the Group through internal
risk reports which analyze exposures by degree and magnitude of risks. These risks include market
risk, credit risk and liquidity risk.
1) Market risk
The Group’s activities exposed it primarily to the financial risks of changes in foreign currency
exchange rates, interest rates and other market-related factors.
There have been no changes to the Group’s exposure to market risks or the manner in which these
risks were managed and measured.
a) Foreign currency risk
Several subsidiaries of the Company had foreign-currency-denominated sales and purchases,
which exposed the Group to foreign currency risk. Exchange rate exposures were managed
within approved policy parameters and by utilizing forward foreign exchange contracts.

- 60 -
The carrying amounts of the Group’s foreign-currency-denominated monetary assets and
monetary liabilities (including those eliminated on consolidation) at the end of the reporting
period are set out in Note 33.
Sensitivity analysis
The Group was mainly exposed to the U.S. dollar (USD).
The following table details the Group’s sensitivity to a 1% increase and decrease in the New
Taiwan dollar (NTD), Renminbi (RMB), and South Korean Won (KRW) against the U.S. dollar
(USD). The sensitivity analysis included only outstanding foreign-currency-denominated
monetary items and adjusts their translation at the end of the reporting period for a 1% change
in foreign currency rates. For a 1% strengthening of the New Taiwan dollar (NTD), Renminbi
(RMB) and South Korean Won (KRW) against the U.S. dollar (USD), there would be an equal
and opposite impact on pre-tax profit and the balances below would be negative.
NTD to USD RMB to USD KRW to USD
For the Year Ended
December 31
For the Year Ended
December 31
For the Year Ended
December 31
2017 2016 2017 2016 2017 2016
Profit or loss $ 5,529 $ 5,063 $ (1,576) $ (14,429) $ (66,889) $ (44,896)
b) Interest rate risk
The carrying amount of the Group’s financial assets with exposure to interest rates at the end of
the reporting period were as follows:
December 31
2017 2016
Cash flow interest rate risk
Financial assets $ 7,967,839 $ 3,960,960
Sensitivity analysis
The sensitivity analysis below was determined based on the Group’s exposure to interest rates
for non-derivative instruments at the end of the reporting period. A 50-basis point increase or
decrease was used when reporting interest rate risk internally to key management personnel and
represents management’s assessment of the reasonably possible change in interest rates. When
the market rate of floating rate financial assets change from the effective rate, the estimated
future cash flows also change with it.
If interest rates had been 50 basis points higher, the Group’s pre-tax profit for the years ended
December 31, 2017 and 2016 would be $39,839 thousand and $19,805 thousand, respectively,
which would be attributable to the Group’s exposure to interest rates on its financial assets. If
interest rates had been 50 basis points lower, there would be an equal and opposite impact on
pre-tax profit, and the balances would be negative.
c) Other price risk
The Group was exposed to equity price risk through its investments in listed equity securities.
Equity investments are held for strategic rather than trading purposes. The Group does not
actively trade these investments.

- 61 -
Sensitivity analysis
The sensitivity analysis was determined based on the exposure to equity price risk in listed
equity securities at the end of the reporting period. If equity prices had been 5% higher/lower,
the other comprehensive income (loss) for the years ended December 31, 2017 and 2016 would
have increased/decreased by $137,466 thousand and $89,351 thousand, respectively.
2) Credit risk
Credit risk refers to the risk that a counterparty will default on its contractual obligations resulting
in a financial loss to the Group. As of the end of the reporting period, the Group’s maximum
exposure to credit risk, which would cause a financial loss to the Group due to failure of
counterparties to discharge an obligation and financial guarantees provided by the Group, could
arise from:
a) The carrying amount of the respective recognized financial assets as stated in the balance sheets;
and
b) The amount of contingent liabilities in relation to financial guarantees issued by the Group.
The Group adopted a policy of only dealing with creditworthy counterparties, evaluated potential
customers through an internal credit rating system and set the credit limit of customers to grasp the
credit status of the counterparties and effectively control the credit exposure.
3) Liquidity risk
The Group manages liquidity risk by monitoring and maintaining a level of cash and cash
equivalents deemed adequate to finance the Group’s operations and mitigate the effects of
fluctuations in cash flows. In addition, management monitors the utilization of bank borrowings
and ensures compliance with loan covenants.
The Group relies on bank borrowings as a significant source of liquidity. As of December 31,
2017 and 2016, the Group had available unutilized short-term bank loans amounting to $2,939,890
thousand $3,531,806 thousand, respectively.
The following table details the Group’s remaining contractual maturity for its non-derivative
financial liabilities with agreed repayment periods. The table was drawn up based on the
undiscounted cash flows of financial liabilities from the earliest date on which the Group can be
required to pay. The table includes both interest and principal cash flows.
December 31, 2017
On Demand
or Less than
1 Month 1-3 Months
3 Months to
1 Year 1-5 Years 5+ Years
Non-derivative
financial liabilities
Fixed interest rate
liabilities $ 229,097 $ - $ 150,347 $ - $ -
Non-interest bearing
liabilities - - 117,993 - 45,545
$ 229,097 $ - $ 268,340 $ - $ 45,545

- 62 -
December 31, 2016
On Demand
or Less than
1 Month 1-3 Months
3 Months to
1 Year 1-5 Years 5+ Years
Non-derivative
financial liabilities
Fixed interest rate
liabilities $ 452,072 $ - $ - $ - $ -
Non-interest bearing
liabilities - - 129,000 124,493 46,488
$ 452,072 $ - $ 129,000 $ 124,493 $ 46,488
30. TRANSACTIONS WITH RELATED PARTIES
Balances and transactions between the Company and its subsidiaries, which are related parties of the
Company, have been eliminated on consolidation and are not disclosed in this note. Details of
transactions between the Group and other related parties are disclosed below.
a. Names and categories of related parties
Name Related-party Categories
NTX Electronics Yangzhou Co., Ltd. Associate
Dihao Electronics (Yangzhou) Co., Ltd. Associate
Yuen Foong Yu Biotech Co., Ltd. Associate
YFY Inc. Investor with significant influence over the
Group
YFY Investment Co., Ltd. Subsidiary of investor with significant
influence over the Group
Eihoyo Shoji Co., Ltd. Subsidiary of investor with significant
influence over the Group
Yuen Foong Paper Co., Ltd. (Nanjing) Subsidiary of investor with significant
influence over the Group
Yuen Foong Yu Paper Mfg. Co., Ltd. (Yangzhou) Subsidiary of investor with significant
influence over the Group
Yuen Foong Yu Paper Enterprise (Kunshan) Co., Ltd. Subsidiary of investor with significant
influence over the Group
Arizon RFID Technology (Yangzhou) Co., Ltd. Subsidiary of investor with significant
influence over the Group
YFY Packaging Inc. Subsidiary of investor with significant
influence over the Group
Yuen Foong Yu Consumer Products Co., Ltd. Subsidiary of investor with significant
influence over the Group
Yuen Foong Precision Electronics (Yangzhou) Co., Ltd. Subsidiary of investor with significant
influence over the Group
YFY Holding Management Co., Ltd. Subsidiary of investor with significant
influence over the Group
Chung Hwa Pulp Corporation Subsidiary of investor with significant
influence over the Group
(Continued)

- 63 -
Name Related-party Categories
Yuen Foong Yu Consumer Products (Yangzhou) Co., Ltd. Subsidiary of investor with significant
influence over the Group
Yuen Foong Yu Blue Economy Natural Resources
(Yangzhou) Co., Ltd.
Subsidiary of investor with significant
influence over the Group
Yeon Technologies Co., Ltd. Subsidiary of investor with significant
influence over the Group
Yeon Technologies (Yangzhou) Co., Ltd. Subsidiary of investor with significant
influence over the Group
China Color Printing Co., Ltd. Subsidiary of investor with significant
influence over the Group
LiVEBRiCKS Inc. Subsidiary of investor with significant
influence over the Group
YFY Jupiter Ltd. Subsidiary of investor with significant
influence over the Group
Yuen Foong Shop Co., Ltd. Subsidiary of investor with significant
influence over the Group
Syntax Communication (H.K.) Ltd. Subsidiary of investor with significant
influence over the Group
YFY Jupiter US, Inc. Subsidiary of investor with significant
influence over the Group
Jupiter Prestige Group North America Inc. Subsidiary of investor with significant
influence over the Group
Spectiv Brands, LLC Subsidiary of investor with significant
influence over the Group
Johnson Lee Key management personnel
Yuen Foong Yu Biotech (Kunshan) Co., Ltd. Substantive related party
Yuen Foong Paper Co., Ltd. Substantive related party
SinoPac Securities Corp. Substantive related party
Bank SinoPac Co., Ltd. Substantive related party
Hsin Yi Enterprise Co., Ltd. Substantive related party
TGKW Management Limited Substantive related party
Foongtone Technology Co., Ltd. Substantive related party
Shen’s Art Print Co., Ltd. Substantive related party
(Concluded)
b. Sales of goods
For the Year Ended December 31
Related Party Categories 2017 2016
Investor and its subsidiaries with significant influence over the
Group $ 1,106 $ 77,529
Associates - 28
$ 1,106 $ 77,557

- 64 -
c. Purchases of goods
For the Year Ended December 31
Related Party Categories 2017 2016
Associates $ 534,123 $ 304,201
Investor and its subsidiaries with significant influence over the
Group 7,348 21,009
Substantive related parties 16 49
$ 541,487 $ 325,259
d. Manufacturing costs
For the Year Ended December 31
Related Party Categories 2017 2016
Substantive related parties $ 64,503 $ 78,622
Associates 155 -
Investor and its subsidiaries with significant influence over the
Group
83 -
$ 64,741 $ 78,622
e. Operating expenses
For the Year Ended December 31
Related Party Categories 2017 2016
Substantive related parties $ 26,996 $ 16,633
Investor and its subsidiaries with significant influence over the
Group 16,925 2,190
Associates 8,076 4,310
$ 51,997 $ 23,133
f. Non-operating income - other income
For the Year Ended December 31
Related Party Categories 2017 2016
Investor and its subsidiaries with significant influence over the
Group
$ 12,387 $ 10,116
Associates 6,529 5,738
Substantive related parties 54 55
$ 18,970 $ 15,909

- 65 -
g. Accounts receivable from related parties (included in accounts receivable)
December 31
Related Party Categories/Names 2017 2016
Associates
NTX Electronics Yangzhou Co., Ltd. $ 230,698 $ 28,535
Others 91 93
230,789 28,628
Investor and its subsidiaries with significant influence over the
Group 17,839 14,456
Substantive related parties 57 59
$ 248,685 $ 43,143
The outstanding accounts receivable from related parties were unsecured. For the years ended
December 31, 2017 and 2016, no impairment losses was recognized for accounts receivable from
related parties.
h. Loans from related parties
Interest income from investor and its subsidiaries with significant influence over the Group was $409
thousand for the year ended December 31, 2017.
i. Accounts payable to related parties (included in notes and accounts payable)
December 31
Related Party Categories 2017 2016
Associates $ 104,978 $ 245
Substantive related parties 5,894 5,936
Investor and its subsidiaries with significant influence over the
Group 4,608 4,498
$ 115,480 $ 10,679
The outstanding accounts payable to related parties were unsecured.
j. Prepayments
December 31
Related Party Categories 2017 2016
Investor and its subsidiaries with significant influence over the
Group $ 1,679 $ -
k. Refundable deposits (included in other non-current assets)
December 31
Related Party Categories/Names 2017 2016
Substantive related parties
Yuen Foong Yu Biotech (Kunshan) Co., Ltd. $ 51,374 $ 104,599

- 66 -
l. Guaratee deposits received (included in other non-current liabilities)
December 31
Related Party Categories 2017 2016
Key management personnel $ 1,050 $ -
Investor with significant influence over the Group 215 -
Associates 3 -
$ 1,268 $ -
m. Other transactions with related parties
At the end of June 2016, the Group prepaid its investment of $36,000 thousand (included in other
non-current assets) in Yuen Foong Yu Biotech Co., Ltd. which increased the share capital issued. Due
to the Group’s significant influence, Yuen Foong Yu Biotech Co., Ltd was reclassified as an investment
accounted for using the equity method when it completed the registration of shares in August 2016.
The Group performed an assessment of the recoverable amount of Yuen Foong Yu Biotech Co., Ltd.
and recognized an impairment loss of $14,100 thousand in 2017.
n. Compensation of key management personnel
For the Year Ended December 31
2017 2016
Short-term employee benefits $ 128,766 $ 118,286
Post-employment benefits 1,296 1,328
Share-based payments 10,075 -
$ 140,137 $ 119,614
The remuneration of directors and key executives was determined by the remuneration committee based
on the performance of individuals and market trends.
31. ASSETS PLEDGED AS COLLATERAL
Assets amounting to $139,629 thousand and $311,329 thousand (included in other current assets and
non-current assets) as of December 31, 2017 and 2016, respectively, were provided as collateral for
transaction lines of credit of derivative instruments, guarantees of tariffs of imported goods, tenancy
deposits for renting plants and land and deposits for the application for provisional attachment.
32. SIGNIFICANT CONTINGENT LIABILITIES AND UNRECOGNIZED COMMITMENTS
Loan note guarantees issued due to long-term and short-term borrowings and transaction lines of credit of
derivative instruments were $3,770,000 thousand and $3,850,000 thousand as of December 31, 2017 and
2016, respectively.
Letters of bank guarantees issued due to customs import cargo guarantees were $91,090 thousand as of
December 31, 2017.

- 67 -
The Group expected to file patent infringement actions against infringers for the purpose of safeguarding
the intellectual property rights of its patented technology. As of December 31, 2017, since the infringers
have filed patent infringement action against the Group, the Group will continue to take active defense to
safeguard its rights and interests.
33. SIGNIFICANT ASSETS AND LIABILITIES DENOMINATED IN FOREIGN CURRENCIES
The following information was aggregated by the foreign currencies other than functional currencies of the
group entities, and the exchange rates between foreign currencies and respective functional currencies are
disclosed. The significant assets and liabilities denominated in foreign currencies are as follows:
December 31, 2017
Foreign
Currencies
(In Thousands) Exchange Rate Carrying
Amount
Foreign currency assets
Monetary items
USD $ 202,455 29.76 (USD:NTD) $ 6,025,061
USD 132,541 6.534 (USD:RMB) 3,944,420
USD 224,763 1,058.321 (USD:KRW) 6,688,947
USD 30,892 7.817 (USD:HKD) 919,346
$ 17,577,774
Foreign currency liabilities
Monetary items
USD 221,034 29.76 (USD:NTD) $ 6,577,972
USD 127,244 6.534 (USD:RMB) 3,786,781
USD 29,951 7.817 USD:HKD) 891,342
$ 11,256,095
December 31, 2016
Foreign
Currencies
(In Thousands) Exchange Rate Carrying
Amount
Foreign currency assets
Monetary items
USD $ 149,088 32.25 (USD:NTD) $ 4,808,088
USD 133,019 6.937 (USD:RMB) 4,289,863
USD 139,213 1,194.002 (USD:KRW) 4,489,652
USD 31,790 7.756 (USD:HKD) 1,025,228
$ 14,612,831
(Continued)

- 68 -
Foreign
Currencies
(In Thousands) Exchange Rate Carrying
Amount
Foreign currency liabilities
Monetary items
USD $ 164,786 32.25 (USD:NTD) $ 5,314,349
USD 88,278 6.937 (USD:RMB) 2,846,966
USD 30,835 7.756 (USD:HKD) 994,429
$ 9,155,744
(Concluded)
For the years ended December 31, 2017 and 2016, net foreign exchange gains and losses (realized and
unrealized) were losses of $(728,477) thousand and gains of $105,185 thousand, respectively. It is
impractical to disclose net foreign exchange gains (losses) by each significant foreign currency due to the
variety of the foreign currency transactions.
34. SEPARATELY DISCLOSED ITEMS
a. Information about significant transactions and investees
1) Financing provided to others (Table 1)
2) Endorsements/guarantees provided (Table 2)
3) Marketable securities held (excluding investment in subsidiaries, associates and joint ventures)
(Table 3)
4) Marketable securities acquired and disposed of at costs or prices of at least NT$300 million or 20%
of the paid-in capital (Table 4)
5) Acquisitions of individual real estate at costs of at least NT$300 million or 20% of the paid-in
capital (None)
6) Disposals of individual real estate at prices of at least NT$300 million or 20% of the paid-in capital
(None)
7) Total purchases from or sales to related parties amounting to at least NT$100 million or 20% of the
paid-in capital (Table 5)
8) Receivables from related parties amounting to at least NT$100 million or 20% of the paid-in capital
(Table 6)
9) Trading in derivative instruments (Note 7)
10) Intercompany relationships and significant intercompany transactions (Table 9)
11) Information on investees (Table 7)

- 69 -
b. Information on investments in mainland China (Table 8)
1) Information on any investee company in mainland China, showing the name, principal business
activities, paid-in capital, method of investment, inward and outward remittance of funds,
ownership percentage, investment income or loss, carrying amount of the investment at the end of
the period, repatriations of investment income, and limit on the amount of investment in the
mainland China area
2) Any of the following significant transactions with investee companies in mainland China, either
directly or indirectly through a third party, and their prices, payment terms, and unrealized gains or
losses:
a) The amount and percentage of purchases and the balance and percentage of the related payables
at the end of the period
b) The amount and percentage of sales and the balance and percentage of the related receivables at
the end of the period
c) The amount of property transactions and the amount of the resultant gains or losses
d) The balance of negotiable instrument endorsements or guarantees or pledges of collateral at the
end of the period and the purposes
e) The highest period balance, the end of period balance, the interest rate range, and total current
period interest with respect to financing of funds
f) Other transactions that have a material effect on the profit or loss for the period or on the
financial position, such as the rendering or receipt of services
35. SEGMENT INFORMATION
Information reported to the chief operating decision maker for the purpose of resource allocation and
assessment of segment performance focuses on the geographical areas of goods or services delivered or
provided. Specifically, the Group’s reportable segments were the ROC, Asia and the Americas.
The Group measured segment profit or loss for the purpose of assessment of segment performance. On
the other hand, there were no significant differences between the accounting standards applied by the
segments and the summary of significant accounting policies as disclosed in Note 4.
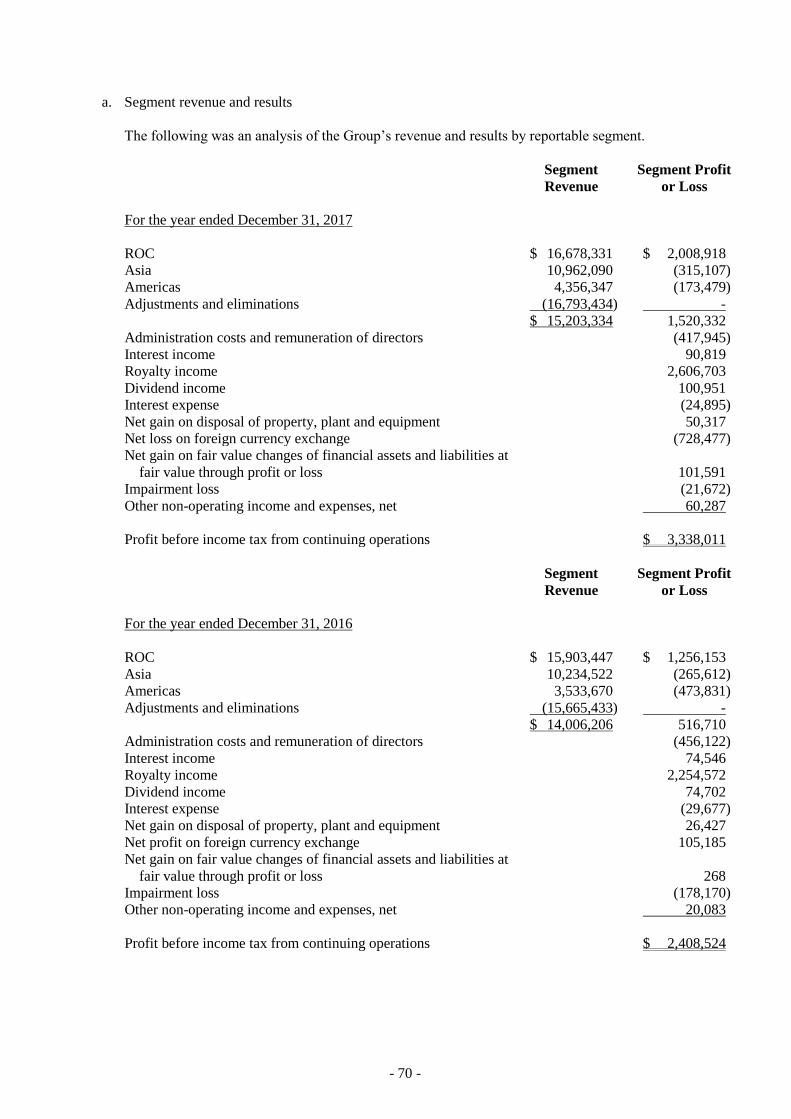
- 70 -
a. Segment revenue and results
The following was an analysis of the Group’s revenue and results by reportable segment.
Segment
Revenue
Segment Profit
or Loss
For the year ended December 31, 2017
ROC $ 16,678,331 $ 2,008,918
Asia 10,962,090 (315,107)
Americas 4,356,347 (173,479)
Adjustments and eliminations (16,793,434) -
$ 15,203,334 1,520,332
Administration costs and remuneration of directors (417,945)
Interest income 90,819
Royalty income 2,606,703
Dividend income 100,951
Interest expense (24,895)
Net gain on disposal of property, plant and equipment 50,317
Net loss on foreign currency exchange (728,477)
Net gain on fair value changes of financial assets and liabilities at
fair value through profit or loss 101,591
Impairment loss (21,672)
Other non-operating income and expenses, net 60,287
Profit before income tax from continuing operations $ 3,338,011
Segment
Revenue
Segment Profit
or Loss
For the year ended December 31, 2016
ROC $ 15,903,447 $ 1,256,153
Asia 10,234,522 (265,612)
Americas 3,533,670 (473,831)
Adjustments and eliminations (15,665,433) -
$ 14,006,206 516,710
Administration costs and remuneration of directors (456,122)
Interest income 74,546
Royalty income 2,254,572
Dividend income 74,702
Interest expense (29,677)
Net gain on disposal of property, plant and equipment 26,427
Net profit on foreign currency exchange 105,185
Net gain on fair value changes of financial assets and liabilities at
fair value through profit or loss 268
Impairment loss (178,170)
Other non-operating income and expenses, net 20,083
Profit before income tax from continuing operations $ 2,408,524

- 71 -
Segment profit represented the profit before income tax earned by each segment without allocation of
central administration costs and remuneration of directors, interest income, royalty income, dividend
income, interest expense, net gain on disposal of property, plant and equipment, net gain (loss) on
foreign currency exchange, net gain on fair value changes of financial assets and liabilities at fair value
through profit or loss, impairment loss, other non-operating income and expenses, net and income tax
expense.
b. Revenue from major products and services
The following is an analysis of the Group’s revenue from continuing operations from its major products
and services.
For the Year Ended December 31
2017 2016
Monitors $ 11,868,586 $ 11,410,193
Electronic tags 3,055,711 2,440,927
Others 279,037 155,086
$ 15,203,334 $ 14,006,206
c. Geographical information
The Group operates in three principal geographical areas - the ROC, Asia and the Americas.
The Group’s information about its non-current assets by location of assets is detailed below.
Non-current Assets
December 31
2017 2016
ROC $ 1,707,310 $ 1,769,473
Asia 2,002,315 2,364,612
Americas 9,887,252 10,681,417
$ 13,596,877 $ 14,815,502
Non-current assets include property, plant and equipment, goodwill, other intangible assets and other
non-current assets and exclude non-current assets classified as held for sale, financial instruments and
deferred tax assets.
d. Information about major customers
Customers who contributed 10% or more to the Group’s revenue, mainly from display panels, were as
follows:
For the Year Ended December 31
2017 2016
Customer A $ 4,961,278 $ 5,700,119
Customer B 2,902,624 1,983,575
Customer C 1,698,101 1,249,486
$ 9,562,003 $ 8,933,180

- 72 -
TABLE 1
E INK HOLDINGS INC. AND SUBSIDIARIES
FINANCING PROVIDED TO OTHERS
FOR THE YEAR ENDED DECEMBER 31, 2017
(In Thousands of New Taiwan Dollars, Unless Stated Otherwise)
No. Lender Borrower
Financial
Statement
Account
Related
Parties
Highest Balance
for the Period
(Note 1)
Ending Balance
(Note 1)
Actual Borrowing
Amount
(Note 1)
Interest Rate Nature of
Financing
Business
Transaction
Amount
Reasons for
Short-term
Financing
Allowance for
Impairment Loss
Collateral Financing Limit
for Each
Borrower
(Note 2)
Aggregate
Financing Limit
(Note 2) Item Value
1 Transcend Optronics
(Yangzhou) Co., Ltd.
Yangzhou Huaxia Integrated
O/E System Co., Ltd.
(Note 3)
Other receivables Yes $ 928,308
(RMB 203,822
thousand )
$ 928,308
(RMB 203,822
thousand )
$ 928,308
(RMB 203,822
thousand )
3.915 Short-term
financing
$ - Working capital $ - Right-of-use land
and building
$ 464,971
(RMB 102,090
thousand )
$ 1,296,269
(RMB 284,613
thousand )
$ 1,296,269
(RMB 284,613
thousand )
2 Rich Optronics
(Yangzhou) Co., Ltd.
Yuen Foong Yu Paper Mfg.
Co., Ltd. (Yangzhou)
Other receivables Yes 81,981
(RMB 18,000 thousand )
81,981
(RMB 18,000 thousand )
- - Short-term
financing
- Working capital - - - 321,874
(RMB 70,672 thousand )
321,874
(RMB 70,672 thousand )
Note 1: Translated at the exchange rate on December 31, 2017, RMB1=NT$4.5545.
Note 2: The amount is at most 40% of the net equity of the latest financial statements of the borrower.
Note 3: All intercompany financing loans have been eliminated upon consolidation.

- 73 -
TABLE 2
E INK HOLDINGS INC. AND SUBSIDIARIES
ENDORSEMENTS/GUARANTEES PROVIDED
FOR THE YEAR ENDED DECEMBER 31, 2017
(In Thousands of New Taiwan Dollars, Unless Stated Otherwise)
No. Endorser/Guarantor
Endorsee/Guarantee
Limit on
Endorsement/
Guarantee Given
on Behalf of
Each Party
(Note 2)
Maximum
Amount
Endorsed/Guara
nteed During the
Period
(Note 3)
Outstanding
Endorsement/
Guarantee at the
End of the Period
(Note 3)
Actual
Borrowing
Amount
(Note 3)
Amount
Endorsed/
Guaranteed by
Collateral
Ratio of
Accumulated
Endorsement/
Guarantee to Net
Equity in Latest
Financial
Statements
(%)
Aggregate
Endorsement/
Guarantee Limit
(Note 4)
Endorsement/
Guarantee Given
by Parent on
Behalf of
Subsidiaries
Endorsement/
Guarantee Given
by Subsidiaries
on Behalf of
Parent
Endorsement/
Guarantee Given
on Behalf of
Companies in
Mainland China
Name Relationship
0 E Ink Holdings Inc. E Ink Corporation (Note 1) $ 6,733,125 $ 1,279,680
(US$ 43,000
thousand)
$ 1,279,680
(US$ 43,000
thousand)
$ 148,800
(RMB 5,000
thousand)
$ - 4.75 $ 26,932,498 Yes No No
Dream Pacific International Corp. (Note 1) 6,733,125 119,040
(US$ 4,000
thousand)
59,520
(US$ 2,000
thousand)
59,520
(RMB 2,000
thousand)
- 0.22 26,932,498 Yes No No
PVI Global Corp. (Note 1) 6,733,125 119,040
(US$ 4,000
thousand)
59,520
(US$ 2,000
thousand)
59,520
(RMB 2,000
thousand)
- 0.22 26,932,498 Yes No No
Note 1: Subsidiary.
Note 2: At most 25% of the Company’s net equity.
Note 3: At the exchange rate on December 31, 2017, US$1=NT$29.76.
Note 4: At most 100% of the Company’s net equity.

- 74 -
TABLE 3
E INK HOLDINGS INC. AND SUBSIDIARIES
MARKETABLE SECURITIES HELD
DECEMBER 31, 2017
(In Thousands of New Taiwan Dollars, Unless Stated Otherwise)
Holding Company Name Type and Name of Marketable Securities Relationship with the
Holding Company Financial Statement Account
December 31, 2017
Note Shares (In
Thousands)
Carrying
Amount
Percentage of
Ownership (%) Fair Value
E Ink Holdings Inc. Shares
SinoPac Financial Holding Company Limited Substantive related party Available-for-sale financial assets 88,678 $ 857,516 0.80 $ 857,516
YFY Inc. Investments accounted for
using the equity method
Available-for-sale financial assets 7,814 109,005 0.47 109,005
Ultra Chip, Inc. Corporate director Available-for-sale financial assets 2,863 111,357 4.51 111,357
Ignis Innovation Inc. - Financial assets measured at cost 388 - 0.22 -
New Medical Imaging (NMI) - Financial assets measured at cost 109 - 2.37 -
Yuen Yu Investment Co., Ltd. Shares
SinoPac Financial Holding Company Limited Substantive related party Available-for-sale financial assets 112,750 1,090,295 1.02 1,090,295
YFY Inc. Investments in parent
company accounted for
using the equity method
Available-for-sale financial assets 16 223 - 223
Netronix, Inc. Corporate director Available-for-sale financial assets 5,309 282,980 6.38 282,980
Fitipower Integrated Technology Inc. - Financial assets measured at cost 2,689 59,218 1.90 47,095
Formolight Technologies, Inc. - Financial assets measured at cost 2,228 27,801 10.93 18,950
Echem Solutions Corp. - Financial assets measured at cost 643 10,169 2.5 17,148
SiPix Technology, Inc. Shares
SinoPac Financial Holding Company Limited Substantive related party Available-for-sale financial assets 30,811 297,941 0.28 297,941
Transcend Optronics (Yangzhou) Co., Ltd. Shares
Wuxi Vision Peak Technology Corporation Limited - Financial assets measured at cost - RMB 37,500
thousand
10.00 RMB 50,149
thousand
Note: Refer to Tables 7 and 8 for information on investments in subsidiaries and associates.

- 75 -
TABLE 4
E INK HOLDINGS INC. AND SUBSIDIARIES
MARKETABLE SECURITIES ACQUIRED AND DISPOSED OF AT COSTS OR PRICES OF AT LEAST NT$300 MILLION OR 20% OF THE PAID-IN CAPITAL
FOR THE YEAR ENDED DECEMBER 31, 2017
(In Thousands of New Taiwan Dollars, Unless Stated Otherwise)
Company Name Type and Name of
Marketable Securities
Financial Statement
Account Counterparty Relationship
Beginning Balance Acquisition Disposal Other
Adjustments
(Note 2)
Ending Balance
Shares (In
Thousands) Amount
Shares (In
Thousands) Amount
Shares (In
Thousands) Amount Carrying Amount Gain on Disposal
Shares (In
Thousands) Amount
Yuen Yu Investment Shares Co., Ltd. Linfiny Corporation Investments accounted for
using the equity method
Note 1 Subsidiary - $ - 32,340 $ 323,400 - $ - $ - $ - $ (116,866 ) 32,340 $ 206,534
Rich Optronics Principal guarantee note
(Yangzhou) Co., Ltd. Jubao cai fu wen ying
No.2
Debt investments with no
active market
- - - RMB 33,200
thousand
- RMB 257,800
thousand
- RMB 262,202
thousand
RMB 260,000
thousand
RMB 2,202
thousand (Note 3)
- - RMB 31,000
thousand
Note 1: Participant in capital increase of Linfiny Corporation.
Note 2: Including share of profit or loss of subsidiaries accounted for using the equity method and exchange differences on translating foreign operations.
Note 3: Included in interest income.

- 76 -
TABLE 5
E INK HOLDINGS INC. AND SUBSIDIARIES
TOTAL PURCHASES FROM OR SALES TO RELATED PARTIES AMOUNTING TO AT LEAST NT$100 MILLION OR 20% OF THE PAID-IN CAPITAL
FOR THE YEAR ENDED DECEMBER 31, 2017
(In Thousands of New Taiwan Dollars)
Buyer Related Party Relationship
Transaction Details Abnormal Transaction Notes/Accounts Receivable
(Payable)
Note Purchase/
Sale Amount
% of
Total Payment Terms Unit Price Payment Terms Ending Balance
% of
Total
(Note)
E Ink Holdings Inc. Prime View Communications Ltd. Subsidiary Sale $ (4,962,180) (36) Payment terms were based on
agreements
$ - - $ 891,061 21
PVI International Corp. Subsidiary Sale (2,929,151) (21) Payment terms were based on
agreements
- - 313,451 7
E Ink Corporation Subsidiary Purchase 3,812,117 33 Payment terms were based on
agreements
- - (467,067) (12)
SiPix Technology, Inc. Subsidiary Sale (1,501,343) (11) Payment terms were based on
agreements
- - 350,167 8
Transyork Technology Yangzhou Ltd. Subsidiary Purchase 1,626,121 14 Payment terms were based on
agreements
- - (2,810,857) (69)
NTX Electronics Yangzhou Co., Ltd. Associate Purchase 427,035 4 Payment terms were based on
agreements
- - - -
SiPix Technology, Inc. E Ink Holdings Inc. Parent company Purchase 1,501,343 86 Payment terms were based on
agreements
- - (350,167) (83)
E Ink Corporation Same ultimate parent
company
Purchase 184,584 11 Payment terms were based on
agreements
- - (70,242) (17)
Linfiny Corporation Linfiny Japan Inc. Subsidiary Purchase 148,583 59 Payment terms were based on
agreements
- - (148,583) (56)
Linfiny Japan Inc. Linfiny Corporation Parent company Sale (148,583) 100 Payment terms were based on
agreements
- - 148,583 100
Prime View Communications Ltd. E Ink Holdings Inc. Parent company Purchase 4,962,180 100 Payment terms were based on
agreements
- - (891,061) (100)
PVI International Corp. E Ink Holdings Inc. Parent company Purchase 2,929,151 100 Payment terms were based on
agreements
- - (313,451) (100)
Transyork Technology Yangzhou Ltd. E Ink Holdings Inc. Parent company Sale (1,626,121) (100) Payment terms were based on
agreements
- - 2,810,857 100
E Ink Corporation E Ink Holdings Inc. Parent company Sale (3,812,117) (93) Payment terms were based on
agreements
- - 467,067 80
SiPix Technology, Inc. Same ultimate parent
company
Sale (184,584) (5) Payment terms were based on
agreements
- - 70,242 12
E Ink California, LLC Subsidiary Purchase 371,984 29 Payment terms were based on
agreements
- - (272,588) (55)
E Ink California, LLC E Ink Corporation Parent company Sale (371,984) (100) Payment terms were based on
agreements
- - 272,588 100
Note 1: The proportion of the individual company’s total receivables (payables).
Note 2: Intercompany transactions eliminated upon consolidation, except NTX Electronics Yangzhou Co., Ltd.

- 77 -
TABLE 6
E INK HOLDINGS INC. AND SUBSIDIARIES
RECEIVABLES FROM RELATED PARTIES AMOUNTING TO AT LEAST NT$100 MILLION OR 20% OF THE PAID-IN CAPITAL
DECEMBER 31, 2017
(In Thousands of New Taiwan Dollars)
Company Name Related Party Relationship Ending Balance Turnover Rate
Overdue Amount Received
in Subsequent
Period
Allowance for
Impairment Loss Amount Actions Taken
E Ink Holdings Inc. Prime View Communications Ltd. Subsidiary $ 891,061 5.27 $ - - $ 863,164 $ -
PVI International Corp. Subsidiary 313,451 14.30 - - 313,451 -
SiPix Technology, Inc. Subsidiary 350,167 5.58 58,235 Collected 188,497 -
Transyork Technology Yangzhou Ltd. Subsidiary 2,275,283 (Note 1) 558,874 Collected 1,616,288 -
E Ink Corporation Subsidiary 200,895 0.56 4,203 In the process of collection - -
NTX Electronics Yangzhou Co., Ltd. Associate 229,618 (Note 1) 188,153 In the process of collection 150,240 -
Tech Smart Logistics Ltd. E Ink Holdings Inc. Parent company 731,646 (Note 1) 731,646 In the process of collection 15,035 -
Dream Pacific International Corp. Tech Smart Logistics Ltd. Same ultimate parent company 262,088 (Note 1) 262,088 In the process of collection 14,901 -
PVI Global Corp. Dream Pacific International Corp. Subsidiary 267,840 (Note 2) 267,840 In the process of collection 11,904 -
Linfiny Japan Inc. Linfiny Corporation Parent company 148,583 2.00 - - - -
Transyork Technology Yangzhou Ltd. E Ink Holdings Inc. Parent company 2,810,857 (Note 1) 522,233 Collected 1,815,534 -
E Ink Corporation E Ink Holdings Inc. Parent company 467,067 10.36 360,065 Collected 467,067 -
E Ink California, LLC E Ink Corporation Parent company 272,588 1.35 181,172 In the process of collection 59,825 -
Note 1: Other receivables from goods processed.
Note 2: Receivables from cash dividends.
Note 3: Intercompany transactions eliminated upon consolidation, except NTX Electronics Yangzhou Co., Ltd.

- 78 -
TABLE 7
E INK HOLDINGS INC. AND SUBSIDIARIES
INFORMATION ON INVESTEES
FOR THE YEAR ENDED DECEMBER 31, 2017
(In Thousands of New Taiwan Dollars, Unless Stated Otherwise)
Investor Company Investee Company Location Main Businesses and Products
Original Investment Amount As of December 31, 2017 Net Profit
(Loss) of the
Investee
Share of Profit
(Loss) Note December 31,
2017
December 31,
2016
Shares (In
Thousands) %
Carrying
Amount
E Ink Holdings Inc. PVI Global Corp. British Virgin Islands Investment $ 3,090,254 $ 3,090,254 99,413 100.00 $ 9,421,361 $ 534,266 $ 534,266 New Field e-Paper Co., Ltd. Taoyuan, Taiwan Wholesale and sale of electronics parts 6,394,455 6,394,455 671,032 100.00 5,614,948 (159,455 ) (159,455 )
E Ink Corporation Boston, Massachusetts,
USA
Manufacture and sale of electronic ink 4,911,303 4,911,303 1 45.31 4,322,539 (50,662 ) (152,320 )
Yuen Yu Investment Co., Ltd. Taipei, Taiwan Investment 5,015,000 5,015,000 152,433 100.00 2,282,800 (97,334 ) (97,334 )
SiPix Technology, Inc. Taoyuan, Taiwan Manufacture and sale of electronic ink 1,405,230 1,405,230 - 100.00 1,966,524 829,102 852,821
Dream Universe Ltd. Mauritius Trading 128,710 128,710 4,050 100.00 353,281 28,142 28,142 Prime View Communications Ltd. Hong Kong Trading 18,988 18,988 3,570 100.00 26,700 586 586
Entte K Co., Ltd. Taichung, Taiwan Manufacture and sale of consumer audio-visual systems 34,547 34,547 2,203 47.07 - - - Under liquidation
Tech Smart Logistics Ltd. British Virgin Islands Trading 49,267 49,267 1,550 0.09 3,950 (115,855 ) (104 ) Hot Tracks International Ltd. British Virgin Islands Trading 1,735 1,735 50 100.00 20 10 10
New Field e-Paper Co., Ltd. Tech Smart Logistics Ltd. British Virgin Islands Trading 4,865,850 4,865,850 1,748,252 99.91 4,384,859 (115,855 ) (115,751 ) E Ink Corporation Boston, Massachusetts,
USA
Manufacture and sale of electronic ink 1,618,500 1,618,500 - 12.88 1,228,742 (50,662 ) (43,299 )
Yuen Yu Investment Co., Ltd. Lucky Joy Holdings Ltd. Samoa Investment 36,117 36,117 1,098 100.00 12 37 37
Yuen Foong Yu Biotech Co., Ltd. Taipei, Taiwan Cultivation, processing and sale of agriculture and restaurant management 36,000 36,000 3,600 36.00 - (56,903 ) (24,680 )
Kyontsu Optronics Co., Ltd. Taipei, Taiwan Technology development, transfer and licensing of flat panels 18,860 18,860 1,050 25.65 - - - Under liquidation Linfiny Corporation Taoyuan, Taiwan Research, development and sale of electronic ink 323,400 - 32,340 77.00 206,534 (153,758 ) (118,394 )
YuanHan Materials Inc. Taoyuan, Taiwan Manufacture and sale of electronics parts 24,000 - 2,400 100.00 10,628 (13,365 ) (13,372 )
SiPix Technology, Inc. Linfiny Corporation Taoyuan, Taiwan Research, development and sale of electronic ink 16,800 - 1,680 4.00 10,729 (153,758 ) (6,150 )
Linfiny Corporation Linfiny Japan Inc. Tokyo, Japan Research, development and sale of electronic ink 11,088 - 4 100.00 15,180 2,108 2,108
E Ink Corporation E Ink California, LLC California, USA Research, development and sale of electronic ink US$ 29,100
thousand
US$ 29,100
thousand
27,400 100.00 US$ 28,031
thousand
US$ 2,881
thousand
US$ 685
thousand
E Ink Japan Inc. Tokyo, Japan Development of electronic ink products US$ 86
thousand
US$ 86
thousand
- 100.00 US$ 82
thousand
US$ (54 )
thousand
US$ (54 )
thousand
E Ink Systems, LLC California, USA Research and development of application software US$ 337 thousand
US$ 337 thousand
- 100.00 US$ 680 thousand
US$ 119 thousand
US$ 119 thousand
Tech Smart Logistics Ltd. E Ink Corporation Boston, Massachusetts, USA
Manufacture and sale of electronic ink US$ 152,875 thousand
US$ 152,875 thousand
1 41.81 US$ 131,692 thousand
US$ (1,589 ) thousand
US$ (4,582 ) thousand
PVI Global Corp. PVI International Corp. British Virgin Islands Trading US$ 151,300 thousand
US$ 151,300 thousand
151,300 100.00 US$ 109,069 thousand
US$ (5,048 ) thousand
US$ (5,048 ) thousand
Dream Pacific International Corp. British Virgin Islands Sale of LCD monitor products US$ 1,000
thousand
US$ 1,000
thousand
26,000 100.00 US$ 133,112
thousand
US$ 22,533
thousand
US$ 22,533
thousand
Ruby Lustre Ltd. British Virgin Islands Investment US$ 30,000
thousand
US$ 30,000
thousand
30,000 100.00 US$ 27,039
thousand
US$ (509 )
thousand
US$ (509 )
thousand
North Diamond International Co., Ltd. British Virgin Islands Investment US$ 1,750 thousand
US$ 1,750 thousand
1,750 35.00 - - -
Rock Pearl International Corp. British Virgin Islands Investment US$ 1,540
thousand
US$ 1,540
thousand
1,540 35.00 - - -
Dream Pacific International Corp. Hydis Technologies Co., Ltd. South Korea Research, development and sale of LCD monitors US$ 27,612
thousand
US$ 27,612
thousand
3,783 94.73 US$ 141,443
thousand
US$ 23,210
thousand
US$ 21,799
thousand
Hydis Technologies Co., Ltd. Hydis Taiwan Inc. Taoyuan, Taiwan Sale of LCD monitor products - - - 100.00 KRW 48,742 thousand
KRW 437,202 thousand
KRW 437,202 thousand
Under liquidation
Note: Intercompany transactions eliminated upon consolidation, except Entte K Co., Ltd., Kyontsu Optronics Co., Ltd., North Diamond International Co., Ltd., Yuen Foong Yu Biotech Co., Ltd. and Rock Pearl International Corp.

- 79 -
TABLE 8
E INK HOLDINGS INC. AND SUBSIDIARIES
INFORMATION ON INVESTMENTS IN MAINLAND CHINA
FOR THE YEAR ENDED DECEMBER 31, 2017
(In Thousands of New Taiwan Dollars, Unless Stated Otherwise)
Investee Company Main Businesses and
Products
Paid-in Capital
(Note 1) Method of Investment
Accumulated
Outward
Remittance for
Investment
from Taiwan
as of
January 1, 2017
(Note 1)
Remittance of Funds Accumulated
Outward
Remittance for
Investment
from Taiwan as
of December 31,
2017
(Note 1)
Net Profit
(Loss) of the
Investee
(Note 2)
% Ownership
of Direct or
Indirect
Investment
Investment
Gain (Loss)
(Notes 2 and 3)
Carrying
Amount as of
December 31,
2017 (Note 1)
Accumulated
Repatriation of
Investment
Income as of
December 31,
2017
Outward Inward
Transcend Optronics
(Yangzhou) Co., Ltd.
(Note 6)
Assembly of LCD flat
panels
$ 4,502,688
(US$ 151,300
thousand)
The Company indirectly owns the
investee through an investment
company registered in a third
region
$ 3,239,227
(US$ 108,845
thousand)
$ - $ - $ 3,239,227
(US$ 108,845
thousand)
$ (154,321)
(US$ (5,071)
thousand)
100.00 $ (154,321)
(US$ (5,071)
thousand)
$ 3,240,656
(US$ 108,893
thousand)
$ -
Rich Optronics (Yangzhou)
Co., Ltd. (Note 6)
Assembly of LCD flat
panels
892,800
(US$ 30,000
thousand)
The Company indirectly owns the
investee through an investment
company registered in a third
region
892,800
(US$ 30,000
thousand)
- - 892,800
(US$ 30,000
thousand)
(15,490)
(US$ (509)
thousand)
100.00 (15,490)
(US$ (509)
thousand)
804,681
(US$ 27,039
thousand)
-
Transyork Technology
Yangzhou Ltd. (Note 6)
Assembly of LCD flat
panels
2,140,667
(US$ 71,931
thousand)
The Company indirectly owns the
investee through an investment
company registered in a third
region
- - - - 38,131
(US$ 1,253
thousand)
100.00 38,131
(US$ 1,253
thousand)
1,753,906
(US$ 58,935
thousand)
-
Transyang Electronics
(Yangzhou) Ltd. (Note 6)
Assembly of LCD flat
panels
119,040
(US$ 4,000
thousand)
The Company indirectly owns the
investee through an investment
company registered in a third
region
119,040
(US$ 4,000
thousand)
- - 119,040
(US$ 4,000
thousand)
(9,921)
(US$ (326)
thousand)
100.00 (9,921)
(US$ (326)
thousand)
106,898
(US$ 3,592
thousand)
-
Transmart Electronics
(Yangzhou) Ltd. (Note 6)
Research, development
and sale of LCD
monitors
295,100
(US$ 9,916
thousand)
The Company indirectly owns the
investee through an investment
company registered in a third
region
196,714
(US$ 6,610
thousand)
- - 196,714
(US$ 6,610
thousand)
1,126
(US$ 37
thousand)
100.00 1,126
(US$ 37
thousand)
25,415
(US$ 854
thousand)
-
Yangzhou Huaxia Integrated
O/E System Co., Ltd.
(Note 6)
Manufacture and sale of
LED products
553,536
(US$ 18,600
thousand)
The Company indirectly owns the
investee through an investment
company registered in a third
region
89,280
(US$ 3,000
thousand)
- - 89,280
(US$ 3,000
thousand)
(48,935)
(US$ (1,608)
thousand)
100.00 (45,401)
(US$ (1,492)
thousand)
(857,445)
(US$ (28,812)
thousand)
-
Ultraview Technology Ltd.
(under liquidation)
Assembly of automobile
LCD monitors
286,291
(US$ 9,620
thousand)
The Company indirectly owns the
investee through an investment
company registered in a third
region
32,676
(US$ 1,098
thousand)
- - 32,676
(US$ 1,098
thousand)
- (Note 4) - - -
Dihao Electronics
(Yangzhou) Co., Ltd.
Assembly of LCD
backlight board
display modules
148,800
(US$ 5,000
thousand)
The Company indirectly owns the
investee through an investment
company registered in a third
region
52,080
(US$ 1,750
thousand)
- - 52,080
(US$ 1,750
thousand)
- 35.00 - - -
(Continued)

- 80 -
Investee Company Main Businesses and
Products
Paid-in Capital
(Note 1) Method of Investment
Accumulated
Outward
Remittance for
Investment
from Taiwan
as of
January 1, 2017
(Note 1)
Remittance of Funds Accumulated
Outward
Remittance for
Investment
from Taiwan as
of December 31,
2017
(Note 1)
Net Profit
(Loss) of the
Investee
(Note 2)
% Ownership
of Direct or
Indirect
Investment
Investment
Gain (Loss)
(Notes 2 and 3)
Carrying
Amount as of
December 31,
2017 (Note 1)
Accumulated
Repatriation of
Investment
Income as of
December 31,
2017
Outward Inward
Hydis Shenzhen Ltd. (under
liquidation) (Note 6)
Sale of LCD monitor
products
$ 2,024
(US$ 68
thousand)
The Company indirectly owns the
investee through an investment
company registered in a third
region
$ - $ - $ - $ - $ 822
(KRW 30,294
thousand)
94.73 $ 779
(KRW 28,698
thousand)
$ (922)
(KRW (32,801)
thousand)
$ -
NTX Electronics Yangzhou
Co., Ltd.
Manufacture and sale of
flat panels
182,180
(RMB 40,000
thousand)
The Company indirectly owns the
investee through an investment
company registered in a third
region
- - - - 2,685
(RMB 596
thousand)
49.00 1,247
(RMB 292
thousand)
88,752
(RMB 19,487
thousand)
-
Accumulated Outward Remittance
for Investment in Mainland China
as of December 31, 2017
Investment Amount Authorized by
Investment Commission, MOEA
Upper Limit on the Amount of
Investment Stipulated by
Investment Commission, MOEA
$ 4,621,817
(US$ 155,303
thousand)
$ 8,035,527
(US$ 270,011
thousand)
$ 17,529,179
Note 1: The amounts are translated at the exchange rate on December 31, 2017, US$1=NT$29.76, RMB1=NT$4.5545, KRW1=NT$0.02812.
Note 2: The amounts are translated at the average exchange rate of the year ended December 31, 2017, US$1=NT$30.432, RMB1=NT$4.50531, KRW1=NT$0.02713.
Note 3: The carrying amount and related investment income of the equity investment were calculated based on audited financial statements of the corresponding year.
Note 4: The investee company was ruled bankrupt by the court in June 2014 and was assigned a bankruptcy manager. The Group eliminated its investment amount and reclassified it as financial assets measured at cost.
Note 5: Information on the prices, terms of payment and unrealized profit or loss of significant transactions of investee companies in mainland China are provided in Tables 1, 5 and 6.
Note 6: Except NTX Electronics Yangzhou Co., Ltd., intercompany transactions have been eliminated upon consolidation.
(Concluded)

- 81 -
TABLE 9
E INK HOLDINGS INC. AND SUBSIDIARIES
INTERCOMPANY RELATIONSHIPS AND SIGNIFICANT INTERCOMPANY TRANSACTIONS
FOR THE YEAR ENDED DECEMBER 31, 2017
(In Thousands of New Taiwan Dollars)
No. Company Name Related Party Relationship
Transaction Details
Financial Statement Account Amount Payment Terms % of Total
Sales or Assets
0 E Ink Holdings Inc. Prime View Communications Ltd. Subsidiary Trade receivables from related parties $ 891,061 The prices and payment terms were based
on agreements
2.5
Prime View Communications Ltd. Subsidiary Sales 4,962,180 The prices and payment terms were based
on agreements
32.6
PVI International Corp. Subsidiary Sales 2,929,151 The prices and payment terms were based
on agreements
19.3
Tech Smart Logistics Ltd. Subsidiary Notes and accounts payable to related parties 731,646 The prices and payment terms were based
on agreements
2.0
E Ink Corporation Subsidiary Cost of goods sold 3,812,117 The prices and payment terms were based
on agreements
25.1
SiPix Technology, Inc. Subsidiary Sales 1,501,343 The prices and payment terms were based
on agreements
9.9
Transyork Technology Yangzhou Ltd. Subsidiary Trade receivables from related parties 2,275,283 The prices and payment terms were based
on agreements
6.3
Transyork Technology Yangzhou Ltd. Subsidiary Notes and accounts payable to related parties 2,810,857 The prices and payment terms were based
on agreements
7.8
Transyork Technology Yangzhou Ltd. Subsidiary Cost of goods sold 1,626,121 The prices and payment terms were based
on agreements
10.7
1 Transcend Optronics (Yangzhou) Co., Ltd. Yangzhou Huaxia Integrated O/E System Co., Ltd. Subsidiary Other receivables from related parties 939,184 The prices and payment terms were based
on agreements
2.6
Note 1: The intercompany transactions have been eliminated upon consolidation.
Note 2: This table includes transactions for amounts over $500 million.

043
E INK HOLDINGS INC.Financial Statements for theYears Ended December 31, 2017 and 2016 andIndependent Auditors’ Report

- 1 -
INDEPENDENT AUDITORS’ REPORT
The Board of Directors and Shareholders
E Ink Holdings Inc.
Opinion
We have audited the accompanying financial statements of E Ink Holdings Inc. (the Company), which
comprise the balance sheets as of December 31, 2017 and 2016, and the statements of comprehensive
income, changes in equity and cash flows for the years then ended, and the notes to the financial
statements, including a summary of significant accounting policies.
In our opinion, the accompanying financial statements present fairly, in all material respects, the financial
position of the Company as of December 31, 2017 and 2016, and its financial performance and its cash
flows for the years then ended in accordance with the Regulations Governing the Preparation of Financial
Reports by Securities Issuers.
Basis for Opinion
We conducted our audits in accordance with the Regulations Governing Auditing and Attestation of
Financial Statements by Certified Public Accountants and auditing standards generally accepted in the
Republic of China. Our responsibilities under those standards are further described in the Auditors’
Responsibilities for the Audit of the Financial Statements section of our report. We are independent of
the Company in accordance with The Norm of Professional Ethics for Certified Public Accountant of the
Republic of China, and we have fulfilled our other ethical responsibilities in accordance with these
requirements. We believe that the audit evidence we have obtained is sufficient and appropriate to
provide a basis for our opinion.
Key Audit Matters
Key audit matters are those matters that, in our professional judgment, were of most significance in our
audit of the financial statements for the year ended December 31, 2017. These matters were addressed
in the context of our audit of the financial statements as a whole, and in forming our opinion thereon, and
we do not provide a separate opinion on these matters.
Key audit matters for the Company’s financial statements for the year ended December 31, 2017, are
stated as follows:
Impairment of Goodwill Included in the Investments in Subsidiaries Accounted for Using Equity Method
As disclosed in Notes 4 and 10 as well as Table 7 to the financial statements, investments accounted for
using equity method include acquiring subsidiaries to obtain electronic ink research and development and
manufacturing centers, as well as to integrate patents of ePaper techniques. Excess of the cost of
acquisition over the Company’s share of the net fair value of the identifiable assets and liabilities at the
date of acquisition was recorded as goodwill, which is material to the overall financial statements,
therefore, management annually accesses the impairment of the excess of the cost in accordance with the
International Accounting Standard 36 “Impairment of Assets”.
- 2 -
Management assesses the excess of the cost for any impairment by comparing the carrying amount with
the calculated recoverable amount as assessed based on the entire financial statements of the subsidiaries.
In order to perform the assessment, management needs to estimate future operating cash flows allocated
to the subsidiaries and determine their suitable discount rates to calculate the recoverable amount. When
determining future operating cash flows, management considers the forecasted growth rate of sales and
profit rate, etc. based on future operating perspective of the subsidiaries to calculate weighted average
cost of capital as their discount rates. Since the major assumptions are subject to management’s
judgement and may be variable to future market or prosperity of economy, which has its uncertainty, the
impairment of excess of the cost has been identified as a key audit matter.
Our key audit procedures performed in respective of the above area included the following:
1. Understood the related process and controls that management used to assess the impairment,
including basis of assumptions and source of the data used in evaluation.
2. Evaluated whether management has taken into account the Company’s recent operating performance
and its industry conditions when estimating future growth of sales and profit rate to assess their
achievability.
3. Evaluated the reasonableness of the discount rates that management used, and re-performed to check
the calculation.
Impairment of Inventories
As disclosed in Notes 4 and 9 to the financial statements, inventories of the Company are stated at the
lower of cost or net realizable value. Management estimates net realizable value based on current
market conditions and historical experience with product sales of a similar nature. Impairment is
recognized on inventories without any moving for certain periods. Rapid changes in the development of
technology and market conditions may have influence on the estimation, and results in obsolete and aged
inventories. Consequently, impairment of inventories has been identified as a key audit matter.
Our key audit procedures performed in respective of the above area included the following:
1. Understood management’s accounting policy and method of calculation of obsolete and aged
inventories, and inquired if there were significant issues in the current year that would impact the
accounting treatment.
2. Evaluated the process and basis on management’s decision on the impairment ratio of obsolete and
aged inventories, and examined the conditions of obsolete and aged inventories when performing
inventories physical counts, to confirm the reasonableness of impairment recognized on inventories.
3. Acquired inventory aging reports and, with the assistance of our internal computer audit specialists,
tested the consistency of inventories movement with management’s estimation.
Responsibilities of Management and Those Charged with Governance for the Financial Statements
Management is responsible for the preparation and fair presentation of the financial statements in
accordance with the Regulations Governing the Preparation of Financial Reports by Securities Issuers,
and for such internal control as management determines is necessary to enable the preparation of financial
statements that are free from material misstatement, whether due to fraud or error.

- 3 -
In preparing the financial statements, management is responsible for assessing the Company’s ability to
continue as a going concern, disclosing, as applicable, matters related to going concern and using the
going concern basis of accounting unless management either intends to liquidate the Company or to cease
operations, or has no realistic alternative but to do so.
Those charged with governance, including members of the audit committee, are responsible for
overseeing the Company’s financial reporting process.
Auditors’ Responsibilities for the Audit of the Financial Statements
Our objectives are to obtain reasonable assurance about whether the financial statements as a whole are
free from material misstatement, whether due to fraud or error, and to issue an auditors’ report that
includes our opinion. Reasonable assurance is a high level of assurance, but is not a guarantee that an
audit conducted in accordance with the auditing standards generally accepted in the Republic of China
will always detect a material misstatement when it exists. Misstatements can arise from fraud or error
and are considered material if, individually or in the aggregate, they could reasonably be expected to
influence the economic decisions of users taken on the basis of these financial statements.
As part of an audit in accordance with the auditing standards generally accepted in the Republic of China,
we exercise professional judgment and maintain professional skepticism throughout the audit. We also:
1. Identify and assess the risks of material misstatement of the financial statements, whether due to
fraud or error, design and perform audit procedures responsive to those risks, and obtain audit
evidence that is sufficient and appropriate to provide a basis for our opinion. The risk of not
detecting a material misstatement resulting from fraud is higher than for one resulting from error, as
fraud may involve collusion, forgery, intentional omissions, misrepresentations, or the override of
internal control.
2. Obtain an understanding of internal control relevant to the audit in order to design audit procedures
that are appropriate in the circumstances, but not for the purpose of expressing an opinion on the
effectiveness of the Company’s internal control.
3. Evaluate the appropriateness of accounting policies used and the reasonableness of accounting
estimates and related disclosures made by management.
4. Conclude on the appropriateness of management’s use of the going concern basis of accounting and,
based on the audit evidence obtained, whether a material uncertainty exists related to events or
conditions that may cast significant doubt on the Company’s ability to continue as a going concern.
If we conclude that a material uncertainty exists, we are required to draw attention in our auditors’
report to the related disclosures in the financial statements or, if such disclosures are inadequate, to
modify our opinion. Our conclusions are based on the audit evidence obtained up to the date of our
auditors’ report. However, future events or conditions may cause the Company to cease to continue
as a going concern.
5. Evaluate the overall presentation, structure and content of the financial statements, including the
disclosures, and whether the financial statements represent the underlying transactions and events in
a manner that achieves fair presentation.
6. Obtain sufficient and appropriate audit evidence regarding the financial information of the entities or
business activities within the Company to express an opinion on the financial statements. We are
responsible for the direction, supervision and performance of the audit. We remain solely
responsible for our audit opinion.

- 4 -
We communicate with those charged with governance regarding, among other matters, the planned scope
and timing of the audit and significant audit findings, including any significant deficiencies in internal
control that we identify during our audit.
We also provide those charged with governance with a statement that we have complied with relevant
ethical requirements regarding independence, and to communicate with them all relationships and other
matters that may reasonably be thought to bear on our independence, and where applicable, related
safeguards.
From the matters communicated with those charged with governance, we determine those matters that
were of most significance in the audit of the financial statements for the year ended December 31, 2017,
and are therefore the key audit matters. We describe these matters in our auditors’ report unless law or
regulation precludes public disclosure about the matter or when, in extremely rare circumstances, we
determine that a matter should not be communicated in our report because the adverse consequences of
doing so would reasonably be expected to outweigh the public interest benefits of such communication.
The engagement partners on the audit resulting in this independent auditors’ report are Ya-Ling Wong
and Chih-Ming Shao.
Deloitte & Touche
Taipei, Taiwan
Republic of China
March 27, 2018
Notice to Readers
The accompanying financial statements are intended only to present the financial position, financial
performance and cash flows in accordance with accounting principles and practices generally accepted
in the Republic of China and not those of any other jurisdictions. The standards, procedures and
practices to audit such financial statements are those generally applied in the Republic of China.
For the convenience of readers, the independent auditors’ report and the accompanying financial
statements have been translated into English from the original Chinese version prepared and used in the
Republic of China. If there is any conflict between the English version and the original Chinese version
or any difference in the interpretation of the two versions, the Chinese-language independent auditors’
report and financial statements shall prevail.

- 5 -
E INK HOLDINGS INC.
BALANCE SHEETS
DECEMBER 31, 2017 AND 2016
(In Thousands of New Taiwan Dollars)
2017 2016
ASSETS Amount % Amount %
CURRENT ASSETS
Cash and cash equivalents (Notes 4 and 6) $ 639,359 2 $ 873,221 3
Accounts receivable (Notes 4 and 8) 256,077 1 491,967 2
Accounts receivable from related parties (Notes 4 and 22) 4,262,113 12 3,306,359 10
Other receivables from related parties (Note 22) 29,526 - 82,533 -
Inventories (Notes 4 and 9) 1,913,792 6 916,313 3
Prepayments (Note 22) 101,863 - 94,356 -
Other current assets (Notes 4, 16 and 23) 56,587 - 46,926 -
Total current assets 7,259,317 21 5,811,675 18
NON-CURRENT ASSETS
Available-for-sale financial assets (Note 4) 1,077,878 3 700,166 2
Financial assets measured at cost (Notes 4 and 7) - - 22,305 -
Investments accounted for using the equity method (Notes 4 and 10) 23,992,123 70 24,288,540 74
Property, plant and equipment (Notes 4 and 11) 1,435,385 4 1,511,731 5
Other intangible assets (Note 4) 209,607 1 198,165 -
Deferred tax assets (Notes 4 and 16) 204,676 1 227,774 1
Other non-current assets 53,218 - 52,252 -
Total non-current assets 26,972,887 79 27,000,933 82
TOTAL $ 34,232,204 100 $ 32,812,608 100
LIABILITIES AND EQUITY
CURRENT LIABILITIES
Short-term borrowings (Note 12) $ 228,800 1 $ - -
Notes and accounts payable 1,810,318 5 985,728 3
Accounts payable to related parties (Note 22) 4,074,739 12 4,051,329 12
Other payables (Notes 19 and 22) 619,281 2 491,509 2
Current tax liabilities (Notes 4 and 16) 123,943 - 29,498 -
Receipts in advance (Notes 4 and 22) 301,798 1 75,465 -
Other current liabilities 35,776 - 32,686 -
Total current liabilities 7,194,655 21 5,666,215 17
NON-CURRENT LIABILITIES
Net defined benefit liabilities (Notes 4 and 13) 55,892 - 51,543 -
Other non-current liabilities (Notes 4, 16 and 22) 49,159 - 4,835 -
Total non-current liabilities 105,051 - 56,378 -
Total liabilities 7,299,706 21 5,722,593 17
EQUITY (Notes 13, 14 and 18)
Share capital 11,404,677 33 11,404,677 35
Capital surplus 10,108,119 30 10,071,683 31
Retained earnings
Legal reserve 1,304,481 4 1,113,687 4
Special reserve 70,678 - 70,678 -
Unappropriated earnings 4,246,203 13 4,301,134 13
Total retained earnings 5,621,362 17 5,485,499 17
Other equity 106,609 - 488,620 1
Treasury shares (308,269) (1) (360,464) (1)
Total equity 26,932,498 79 27,090,015 83
TOTAL $ 34,232,204 100 $ 32,812,608 100
The accompanying notes are an integral part of the financial statements.

- 6 -
E INK HOLDINGS INC.
STATEMENTS OF COMPREHENSIVE INCOME
FOR THE YEARS ENDED DECEMBER 31, 2017 AND 2016
(In Thousands of New Taiwan Dollars, Except Earnings Per Share)
2017 2016
Amount % Amount %
OPERATING REVENUE (Notes 4 and 22) $ 13,905,359 100 $ 13,112,855 100
OPERATING COSTS (Notes 9, 15 and 22) 11,256,560 81 11,372,610 87
GROSS PROFIT 2,648,799 19 1,740,245 13
UNREALIZED LOSS ON TRANSACTIONS WITH
SUBSIDIARIES (2,314) - - -
REALIZED GROSS PROFIT 2,646,485 19 1,740,245 13
OPERATING EXPENSES (Notes 15 and 22)
Selling and marketing expenses 264,124 2 184,341 1
General and administrative expenses 759,309 5 789,521 6
Research and development expenses 688,278 5 635,614 5
Total operating expenses 1,711,711 12 1,609,476 12
INCOME FROM OPERATIONS 934,774 7 130,769 1
NON-OPERATING INCOME AND EXPENSES
Interest income (Note 4) 6,499 - 12,808 -
Royalty income (Notes 4 and 22) 201,774 2 12,798 -
Dividend income (Note 4) 32,151 - 26,350 -
Other income (Notes 4 and 8) 45,586 - 24,905 -
Interest expense (Note 11) (9,984) - (16,340) -
Share of profit of subsidiaries 1,006,612 7 1,914,510 15
Net gain on disposal of property, plant and
equipment 42,842 - 98 -
Net loss on foreign currency exchange (Note 25) (28,301) - (15,644) -
Impairment loss (Notes 4 and 11) - - (128,699) (1)
Total non-operating income and expenses 1,297,179 9 1,830,786 14
INCOME BEFORE INCOME TAX 2,231,953 16 1,961,555 15
INCOME TAX EXPENSE (Notes 4 and 16) (153,888) (1) (53,616) -
NET INCOME FOR THE YEAR 2,078,065 15 1,907,939 15
(Continued)

- 7 -
E INK HOLDINGS INC.
STATEMENTS OF COMPREHENSIVE INCOME
FOR THE YEARS ENDED DECEMBER 31, 2017 AND 2016
(In Thousands of New Taiwan Dollars, Except Earnings Per Share)
2017 2016
Amount % Amount %
OTHER COMPREHENSIVE INCOME (LOSS)
Items that will not be reclassified subsequently to
profit or loss:
Remeasurement of defined benefit plans (Notes 4
and 13) $ (6,853) - $ (7,956) -
Share of the other comprehensive loss of
subsidiaries accounted for using the equity
method (211) - (2,682) -
Income tax relating to items that will not be
reclassified subsequently to profit or loss (Notes
4 and 16) 1,165 - 1,353 -
(5,899) - (9,285) -
Items that may be reclassified subsequently to profit
or loss:
Unrealized gain on available-for-sale financial
assets 97,714 1 41,419 -
Share of the other comprehensive loss of
subsidiaries accounted for using the equity
method (479,725) (4) (633,490) (5)
(382,011) (3) (592,071) (5)
Other comprehensive loss for the year, net of
income tax (387,910) (3) (601,356) (5)
TOTAL COMPREHENSIVE INCOME FOR THE
YEAR $ 1,690,155 12 $ 1,306,583 10
EARNINGS PER SHARE (Note 17)
Basic $1.85 $1.69
Diluted $1.85 $1.69
The accompanying notes are an integral part of the financial statements. (Concluded)

- 8 -
E INK HOLDINGS INC.
STATEMENTS OF CHANGES IN EQUITY
FOR THE YEARS ENDED DECEMBER 31, 2017 AND 2016
(In Thousands of New Taiwan Dollars)
Other Equity
Exchange Unrealized
Differences on Gain on
Share Capital Retained Earnings Translating Available-for-
Shares Unappropriated Foreign sale Financial Treasury
(In Thousands) Amount Capital Surplus Legal Reserve Special Reserve Earnings Operations Assets Shares Total Equity
BALANCE AT JANUARY 1, 2016 1,140,468 $ 11,404,677 $ 10,071,578 $ 1,059,754 $ 70,678 $ 2,992,433 $ 966,474 $ 114,217 $ - $ 26,679,811
Appropriation of 2015 earnings
Legal reserve - - - 53,933 - (53,933) - - - -
Cash dividends - - - - - (536,020) - - - (536,020)
Changes in equity from investments in associates
accounted for using the equity method - - 105 - - - - - - 105
Net income for the year ended December 31, 2016 - - - - - 1,907,939 - - - 1,907,939
Other comprehensive loss for the year ended December 31,
2016, net of income tax - - - - - (9,285) (704,770) 112,699 - (601,356)
Total comprehensive income for the year ended
December 31, 2016 - - - - - 1,898,654 (704,770) 112,699 - 1,306,583
Acquisition of treasury shares - 20,000 thousand shares - - - - - - - - (360,464) (360,464)
BALANCE AT DECEMBER 31, 2016 1,140,468 11,404,677 10,071,683 1,113,687 70,678 4,301,134 261,704 226,916 (360,464) 27,090,015
Appropriation of 2016 earnings
Legal reserve - - - 190,794 - (190,794) - - - -
Cash dividends - - - - - (1,680,702) - - - (1,680,702)
Net income for the year ended December 31, 2017 - - - - - 2,078,065 - - - 2,078,065
Other comprehensive loss for the year ended December 31,
2017, net of income tax - - - - - (5,899) (504,327) 122,316 - (387,910)
Total comprehensive income for the year ended December
31, 2017 - - - - - 2,072,166 (504,327) 122,316 - 1,690,155
Difference between actual consideration paid and carrying
amount of subsidiaries acquired - - (2,223) - - (255,601) - - - (257,824)
Share-based payments - - 38,825 - - - - - - 38,825
Treasury shares transferred to employees - 2,896 thousand
shares - - (166) - - - - - 52,195 52,029
BALANCE AT DECEMBER 31, 2017 1,140,468 $ 11,404,677 $ 10,108,119 $ 1,304,481 $ 70,678 $ 4,246,203 $ (242,623) $ 349,232 $ (308,269) $ 26,932,498
The accompanying notes are an integral part of the financial statements.

- 9 -
E INK HOLDINGS INC.
STATEMENTS OF CASH FLOWS
FOR THE YEARS ENDED DECEMBER 31, 2017 AND 2016
(In Thousands of New Taiwan Dollars)
2017 2016
CASH FLOWS FROM OPERATING ACTIVITIES
Income before income tax $ 2,231,953 $ 1,961,555
Adjustments for:
Depreciation expenses 240,562 267,257
Amortization expenses 25,735 29,888
Reversal of impairment loss on accounts receivable - (10,600)
Interest expenses 9,984 16,340
Interest income (6,499) (12,808)
Dividend income (32,151) (26,350)
Share-based payments 20,257 -
Share of profit of subsidiaries (1,006,612) (1,914,510)
Net gain on disposal of property, plant and equipment (42,842) (98)
Net gain on disposal of investments (2,775) -
Impairment loss recognized on non-financial assets - 128,699
Reversal of write-down of inventories (13,244) (150,398)
Unrealized loss on transactions with subsidiaries 2,314 -
Net unrealized gain on foreign currency exchange (53,660) (52,401)
Royalty income (201,774) (12,798)
Changes in operating assets and liabilities
Accounts receivable 227,144 (272,800)
Accounts receivable from related parties (1,097,866) (269,094)
Inventories (984,235) 84,904
Prepayments (13,335) 142,319
Other current assets (10,936) 4,441
Notes and accounts payable 852,434 204,332
Accounts payable to related parties 190,578 655,865
Other payables 94,104 (38,007)
Receipts in advance 458,137 76,374
Other current liabilities 8,918 805
Net defined benefit liabilities (2,504) 19,141
Cash generated from operations 893,687 832,056
Income tax paid (21,344) (10,031)
Net cash generated from operating activities 872,343 822,025
CASH FLOWS FROM INVESTING ACTIVITIES
Acquisition of available-for-sale financial assets (279,998) -
Proceeds from repayments of debt investments with no active market - 600,000
Proceeds from disposal of financial assets measured at cost 25,080 -
Proceeds from disposal of investment accounted for using the equity
method - 1,251,070
Payments for property, plant and equipment (131,298) (135,027)
Proceeds from disposal of property, plant and equipment 48,784 114
Decrease (increase) in other receivables from related parties 52,946 (52,896)
Payments for other intangible assets (34,290) (93,942)
(Continued)

- 10 -
E INK HOLDINGS INC.
STATEMENTS OF CASH FLOWS
FOR THE YEARS ENDED DECEMBER 31, 2017 AND 2016
(In Thousands of New Taiwan Dollars)
2017 2016
Decrease (increase) in other non-current assets $ (977) $ 231
Interest received 6,531 18,313
Dividends received 613,674 376,936
Net cash generated from investing activities 300,452 1,964,799
CASH FLOWS FROM FINANCING ACTIVITIES
Increase (decrease) in short-term borrowings 230,100 (100,000)
Repayments of long-term borrowings - (1,624,771)
Increase (decrease) in other non-current liabilities 1,688 (1)
Cash dividends (1,680,702) (536,020)
Cash paid for acquisition of treasury shares - (360,464)
Proceeds from treasury shares transferred to employees 52,029 -
Interest paid (9,772) (16,800)
Net cash used in financing activities (1,406,657) (2,638,056)
NET INCREASE (DECREASE) IN CASH AND CASH
EQUIVALENTS (233,862) 148,768
CASH AND CASH EQUIVALENTS AT THE BEGINNING OF THE
YEAR 873,221 724,453
CASH AND CASH EQUIVALENTS AT THE END OF THE YEAR $ 639,359 $ 873,221
The accompanying notes are an integral part of the financial statements. (Concluded)

- 11 -
E INK HOLDINGS INC.
NOTES TO FINANCIAL STATEMENTS
FOR THE YEARS ENDED DECEMBER 31, 2017 AND 2016
(In Thousands of New Taiwan Dollars, Unless Stated Otherwise)
1. GENERAL INFORMATION
E Ink Holdings Inc. (the Company) was incorporated in June 1992 in the Hsin-Chu Science-based
Industrial Park. The Company’s shares have been listed on the Taipei Exchange (TPEx) Mainboard since
March 30, 2004. The Company mainly researches, develops, manufactures and sells electronic paper
display panels.
The financial statements of the Company are presented in New Taiwan dollars, the functional currency of
the Company.
2. APPROVAL OF FINANCIAL STATEMENTS
The financial statements were approved by the Company’s board of directors on March 27, 2018.
3. APPLICATION OF NEW, AMENDED AND REVISED STANDARDS AND INTERPRETATIONS
a. Initial application of the amendments to the Regulations Governing the Preparation of Financial Reports
by Securities Issuers and the International Financial Reporting Standards (IFRS), International
Accounting Standards (IAS), Interpretations of IFRS (IFRIC), and Interpretations of IAS (SIC)
(collectively, the “IFRSs”) endorsed and issued into effect by the Financial Supervisory Commission
(FSC)
Except for the following, whenever applied, the initial application of the amendments to the
Regulations Governing the Preparation of Financial Reports by Securities Issuers and the IFRSs
endorsed and issued into effect by the FSC would not have any material impact on the Company’s
accounting policies:
Amendments to the Regulations Governing the Preparation of Financial Reports by Securities Issuers
The amendments include additions of several accounting items and requirements for disclosures of
impairment of non-financial assets as a consequence of the IFRSs endorsed and issued into effect by the
FSC. In addition, as a result of the post implementation review of IFRSs in Taiwan, the amendments
also include an emphasis on certain recognition and measurement considerations and add requirements
for disclosures of related party transactions and goodwill.
The amendments stipulate that other companies or institutions of which the chairman of the board of
directors or president serves as the chairman of the board of directors or the president of the Company,
or is the spouse or second immediate family of the chairman of the board of directors or president of the
Company, are deemed to have a substantive related party relationship, unless it can be demonstrated
that no control, joint control, or significant influence exists. Furthermore, the amendments require the
disclosure of the names of the related parties and the relationships with whom the Company has
significant transactions. If the transaction amount or balance with a specific related party is 10% or
more of the Company’s respective total transaction amount or balance, such transactions should be
separately disclosed by the name of each related party.
When the amendments are applied retrospectively from January 1, 2017, the disclosures of related party
transactions and impairment of goodwill are enhanced. Refer to Note 22 for the related disclosures.

- 12 -
b. The Regulations Governing the Preparation of Financial Reports by Securities Issuers and the IFRSs
endorsed by the FSC for application starting from 2018
New, Revised or Amended Standards and Interpretations (“New
IFRSs”)
Effective Date
Announced by IASB (Note 1)
Annual Improvements to IFRSs 2014-2016 Cycle Note 2
Amendments to IFRS 2 “Classification and Measurement of
Share-based Payment Transactions”
January 1, 2018
Amendments to IFRS 4 “Applying IFRS 9 Financial Instruments with
IFRS 4 Insurance Contracts”
January 1, 2018
IFRS 9 “Financial Instruments” January 1, 2018
Amendments to IFRS 9 and IFRS 7 “Mandatory Effective Date of
IFRS 9 and Transition Disclosures”
January 1, 2018
IFRS 15 “Revenue from Contracts with Customers” January 1, 2018
Amendments to IFRS 15 “Clarifications to IFRS 15 Revenue from
Contracts with Customers”
January 1, 2018
Amendment to IAS 7 “Disclosure Initiative” January 1, 2017
Amendments to IAS 12 “Recognition of Deferred Tax Assets for
Unrealized Losses”
January 1, 2017
Amendments to IAS 40 “Transfers of Investment Property” January 1, 2018
IFRIC 22 “Foreign Currency Transactions and Advance
Consideration”
January 1, 2018
Note 1: Unless stated otherwise, the above New IFRSs are effective for annual periods beginning on
or after their respective effective dates.
Note 2: The amendment to IFRS 12 is retrospectively applied for annual periods beginning on or after
January 1, 2017; the amendments to IAS 28 are retrospectively applied for annual periods
beginning on or after January 1, 2018.
1) IFRS 9 “Financial Instruments” and related amendments
Classification, measurement and impairment of financial assets
With regard to financial assets, all recognized financial assets that are within the scope of IAS 39
“Financial Instruments: Recognition and Measurement” are subsequently measured at amortized
cost or fair value. Under IFRS 9, the requirement for the classification of financial assets is stated
below.
For the Company’s debt instruments that have contractual cash flows that are solely payments of
principal and interest on the principal amount outstanding, their classification and measurement are
as follows:
a) For debt instruments, if they are held within a business model whose objective is to collect
contractual cash flows, the financial assets are measured at amortized cost and are assessed for
impairment continuously with any impairment loss recognized in profit or loss. Interest
income is recognized in profit or loss by using the effective interest method; and

- 13 -
b) For debt instruments, if they are held within a business model whose objective is achieved by
both collecting contractual cash flows and selling financial assets, the financial assets are
measured at fair value through other comprehensive income (FVTOCI) and are assessed for
impairment. Interest income is recognized in profit or loss by using the effective interest
method, and other gains or losses shall be recognized in other comprehensive income, except for
impairment gains or losses and foreign exchange gains and losses. When the debt instruments
are derecognized or reclassified, the cumulative gain or loss previously recognized in other
comprehensive income is reclassified from equity to profit or loss.
Except for the above, all other financial assets are measured at fair value through profit or loss.
However, the Company may make an irrevocable election to present subsequent changes in the fair
value of an equity investment (that is not held for trading) in other comprehensive income, with
only dividend income generally recognized in profit or loss. No subsequent impairment
assessment is required, and the cumulative gain or loss previously recognized in other
comprehensive income cannot be reclassified from equity to profit or loss.
The Company analyzed the facts and circumstances of its financial assets that exist at December 31,
2017 and performed an assessment of the impact of IFRS 9 on the classification and measurement
of financial assets. Under IFRS 9, listed shares classified as available-for-sale will be designated
as at fair value through other comprehensive income and the fair value gains or losses accumulated
in other equity will be transferred directly to retained earnings instead of being reclassified to profit
or loss on disposal. Besides this, unlisted shares measured at cost will be measured at fair value
instead.
IFRS 9 requires impairment loss on financial assets to be recognized by using the “Expected Credit
Losses Model”. A loss allowance is required for financial assets measured at amortized cost,
investments in debt instruments measured at FVTOCI, lease receivables, contract assets arising
from IFRS 15 “Revenue from Contracts with Customers”, certain written loan commitments and
financial guarantee contracts. A loss allowance for 12-month expected credit losses is required for
a financial asset if its credit risk has not increased significantly since initial recognition. A loss
allowance for full-lifetime expected credit losses is required for a financial asset if its credit risk has
increased significantly since initial recognition and is not low. However, a loss allowance for
full-lifetime expected credit losses is required for trade receivables that do not constitute a financing
transaction.
For originated credit-impaired financial assets, the Company takes into account the expected credit
losses on initial recognition in calculating the credit-adjusted effective interest rate. Subsequently,
any changes in expected losses are recognized as a loss allowance with a corresponding gain or loss
recognized in profit or loss.
The Company has performed a preliminary assessment in which it will apply the simplified
approach to recognize full-lifetime expected credit losses for accounts receivable, contract assets
and lease receivables. In relation to debt instrument investments, the Company will assess
whether there has been a significant increase in credit risk to determine whether to recognize
12-month or full-lifetime expected credit losses. In general, the Company anticipates that the
application of the expected credit losses model of IFRS 9 will result in an earlier recognition of
credit losses for financial assets.
The Company elects not to restate prior reporting periods when applying the requirements for the
classification, measurement and impairment of financial assets under IFRS 9 with the cumulative
effect of the initial application recognized at the date of initial application and will provide the
disclosures related to the classification and the adjustment information upon initial application of
IFRS 9.

- 14 -
The anticipated impact on assets, liabilities and equity of retrospective application of the
requirements for the classification, measurement and impairment of financial assets as of January 1,
2018 is set out below:
Carrying
Amount as of
December 31,
2017
Adjustments
Arising from
Initial
Application
Adjusted
Carrying
Amount as of
January 1, 2018
Impact on assets and equity
Assets
Financial assets at fair value through
other comprehensive income -
non-current $ - $ 1,077,878 $ 1,077,878
Available-for-sale financial assets -
non-current 1,077,878 (1,077,878) -
Investments accounted for using the
equity method 23,992,123 69,274 24,061,397
$ 25,070,001 $ 69,274 $ 25,139,275
Equity
Retained earnings $ 5,621,362 $ 41,607 $ 5,662,969
Other equity 106,609 27,667 134,276
$ 5,727,971 $ 69,274 $ 5,797,245
2) IFRS 15 “Revenue from Contracts with Customers” and related amendments
IFRS 15 establishes principles for recognizing revenue that apply to all contracts with customers
and will supersede IAS 18 “Revenue”, IAS 11 “Construction Contracts” and a number of
revenue-related interpretations.
When applying IFRS 15, the Company recognizes revenue by applying the following steps:
Identify the contract with the customer;
Identify the performance obligations in the contract;
Determine the transaction price;
Allocate the transaction price to the performance obligations in the contract; and
Recognize revenue when the Company satisfies a performance obligation.
IFRS 15 and the related amendments require that when the nature of the Company’s promise in
granting a license is to provide a right to access the Company’s intellectual property, revenue is
recognized over time if all of the following criteria are met. Otherwise, the promise is to provide a
right to use the Company’s intellectual property as it exists at the point in time at which the license
is granted and revenue is recognized when the license is transferred.
a) The contract requires, or the customer reasonably expects, the Company to undertake activities
that significantly affect the intellectual property to which the customer has rights.
b) The rights granted by the license directly expose the customer to any positive or negative effects
of the above activities.
c) Those activities do not result in the transfer of a good or a service to the customer as the
activities occur.

- 15 -
The Company’s activities significantly affect the intellectual property to which the customer has
rights if those activities are expected to significantly change the form or the functionality of the
intellectual property, or if the ability of the customer to obtain benefit from the intellectual property
is substantially derived from, or dependent upon, those activities.
The Company elects to retrospectively apply IFRS 15 to contracts that are not complete as of
January 1, 2018 and recognizes the cumulative effect of the changes in retained earnings on January
1, 2018. In addition, the Company will disclose the difference between the amount that results from
applying IFRS 15 and the amount that results from applying current standards for 2018.
The anticipated impact on assets, liabilities and equity when retrospectively applying IFRS 15 as of
January 1, 2018 is detailed below:
Carrying
Amount as of
December 31,
2017
Adjustments
Arising from
Initial
Application
Adjusted
Carrying
Amount as of
January 1, 2018
Impact on assets, liabilities and equity
Assets
Investments accounted for using the
equity method
$ 23,992,123 $ 388,923 $ 24,381,046
Liabilities
Contract liabilities - current $ - $ 140,607 $ 140,607
Receipts in advance 301,798 (140,607) 161,191
Contract liabilities - non-current - 30,030 30,030
Other non-current liabilities 49,159 (30,030) 19,129
$ 350,957 $ - $ 350,957
Equity
Retained earnings $ 5,621,362 $ 388,923 $ 6,010,285
Except for the above impact, as of the date the financial statements were authorized for issue, the
Company has assessed that the application of other standards and interpretations will have no
material impact on the Company’s financial position and financial performance.
c. New IFRSs in issue but not yet endorsed and issued into effect by the FSC
New IFRSs
Effective Date
Announced by IASB (Note 1)
Annual Improvements to IFRSs 2015-2017 Cycle January 1, 2019
Amendments to IFRS 9 “Prepayment Features with Negative
Compensation”
January 1, 2019 (Note 2)
Amendments to IFRS 10 and IAS 28 “Sale or Contribution of Assets
between an Investor and its Associate or Joint Venture”
To be determined by IASB
IFRS 16 “Leases” January 1, 2019 (Note 3)
IFRS 17 “Insurance Contracts” January 1, 2021
Amendments to IAS 19 “Plan Amendment, Curtailment or
Settlement”
January 1, 2019 (Note 4)
Amendments to IAS 28 “Long-term Interests in Associates and Joint
Ventures”
January 1, 2019
IFRIC 23 “Uncertainty Over Income Tax Treatments” January 1, 2019

- 16 -
Note 1: Unless stated otherwise, the above New IFRSs are effective for annual periods beginning on
or after their respective effective dates.
Note 2: The FSC permits the election for early adoption of the amendments starting from 2018.
Note 3: On December 19, 2017, the FSC announced that IFRS 16 will take effect starting from
January 1, 2019.
Note 4: The Company shall apply these amendments to plan amendments, curtailments or settlements
occurring on or after January 1, 2019.
Expect for the following, whenever applied, the above standards and interpretations would not have any
material impact on the Company’s accounting policies:
IFRS 16 “Leases”
IFRS 16 sets out the accounting standards for leases that will supersede IAS 17 and a number of related
interpretations.
Under IFRS 16, if the Company is a lessee, it shall recognize right-of-use assets and lease liabilities for
all leases on the balance sheets except for low-value and short-term leases. The Company may elect to
apply the accounting method similar to the accounting for operating leases under IAS 17 to low-value
and short-term leases. On the statements of comprehensive income, the Company should present the
depreciation expense charged on right-of-use assets separately from the interest expense accrued on
lease liabilities; interest is computed by using the effective interest method. On the statements of cash
flows, cash payments for the principal portion of lease liabilities are classified within financing
activities; cash payments for the interest portion are classified within financing activities.
The application of IFRS 16 is not expected to have a material impact on the accounting of the Company
as lessor.
When IFRS 16 becomes effective, the Company may elect to apply this standard either retrospectively
to each prior reporting period presented or retrospectively with the cumulative effect of the initial
application of this standard recognized at the date of initial application.
Except for the above impact, as of the date the financial statements were authorized for issue, the
Company is continuously assessing the possible impact that the application of other standards and
interpretations will have on the Company’s financial position and financial performance and will
disclose the relevant impact when the assessment is completed.
4. SUMMARY OF SIGNIFICANT ACCOUNTING POLICIES
a. Statement of compliance
The financial statements have been prepared in accordance with the Regulations Governing the
Preparation of Financial Reports by Securities Issuers.
b. Basis of preparation
The financial statements have been prepared on the historical cost basis except for financial instruments
which are measured at fair value.

- 17 -
The fair value measurements, which are grouped into Levels 1 to 3 based on the degree to which the
fair value measurement inputs are observable and based on the significance of the inputs to the fair
value measurement in its entirety, are described as follows:
1) Level 1 inputs are quoted prices (unadjusted) in active markets for identical assets or liabilities.
2) Level 2 inputs are inputs other than quoted prices included within Level 1 that are observable for an
asset or liability, either directly (i.e. as prices) or indirectly (i.e. derived from prices); and
3) Level 3 inputs are unobservable inputs for an asset or liability.
When preparing the financial statements, the Company uses the equity method to account for its
investments in subsidiaries and associates. In order for the amounts of the net profit for the year, other
comprehensive income for the year and total equity in its financial statements to be the same as the
amounts attributable to the owners of the Company in its consolidated financial statements, adjustments
arising from the differences in accounting treatments between the parent company only basis and the
consolidated basis were made to investments accounted for by using the equity method, the share of
profit or loss of subsidiaries and the share of other comprehensive income of subsidiaries in these
financial statements.
c. Classification of current and non-current assets and liabilities
Current assets include:
1) Assets held primarily for the purpose of trading;
2) Assets expected to be realized within 12 months after the reporting period; and
3) Cash and cash equivalents, unless the asset is restricted from being exchanged or used to settle a
liability for at least 12 months after the reporting period.
Current liabilities include:
1) Liabilities held primarily for the purpose of trading;
2) Liabilities due to be settled within 12 months after the reporting period; and
3) Liabilities for which the Company does not have an unconditional right to defer settlement for at
least 12 months after the reporting period.
Assets and liabilities that are not classified as current are classified as non-current.
d. Foreign currencies
In preparing the Company’s financial statements, transactions in currencies other than the Company’s
functional currency (i.e. foreign currencies) are recognized at the rates of exchange prevailing at the
dates of the transactions.
At the end of each reporting period, monetary items denominated in foreign currencies are retranslated
at the rates prevailing at that date. Exchange differences on monetary items arising from settlement or
translation are recognized in profit or loss in the year in which they arise.

- 18 -
Non-monetary items measured at fair value that are denominated in foreign currencies are retranslated
at the rates prevailing at the date when the fair value was determined. Exchange differences arising
from the retranslation of non-monetary items are included in profit or loss for the year except for
exchange differences arising from the retranslation of non-monetary items in respect of which gains and
losses are recognized directly in other comprehensive income, in which cases, the exchange differences
are also recognized directly in other comprehensive income.
Non-monetary items that are measured at historical cost in a foreign currency are translated using the
exchange rate at the date of the transaction.
For the purpose of presenting financial statements, the functional currencies of the Company and
entities under its control (including subsidiaries in other countries that use currencies that are different
from the currency of the Company) are translated into the presentation currency, the New Taiwan
dollar, as follows: Assets and liabilities are translated at the exchange rates prevailing at the end of the
reporting period; and income and expense items are translated at the average exchange rates for the
year. The resulting currency translation differences are recognized in other comprehensive income,
and attributed to the owners of the Company and non-controlling interests as appropriate.
e. Inventories
Inventories consist of raw materials, semi-finished goods, finished goods and work in progress and are
stated at the lower of cost or net realizable value. Inventory write-downs are made by item, except
where it may be appropriate to group similar or related items. The net realizable value is the estimated
selling price of inventories less all estimated costs of completion and costs necessary to make the sale.
Inventories are recorded at the weighted-average cost on the balance sheet date.
f. Investments in subsidiaries
The Company uses the equity method to account for its investments in subsidiaries.
A subsidiary is an entity that is controlled by the Company.
Under the equity method, investments in a subsidiary are initially recognized at cost and adjusted
thereafter to recognize the Company’s share of the profit or loss and other comprehensive income of the
subsidiary. The Company also recognizes the changes in the Company’s share of the equity of its
subsidiaries.
Changes in the Company’s ownership interest in a subsidiary that do not result in the Company losing
control of the subsidiary are equity transactions. The Company recognizes directly in equity any
difference between the carrying amount of the investments and the fair value of the consideration paid
or received.
When the Company’s share of losses of a subsidiary exceeds its interest in that subsidiary (which
includes any carrying amount of the investment accounted for using the equity method and long-term
interests that, in substance, form part of the Company’s net investment in the subsidiary), the Company
continues recognizing its share of further losses.
Any excess of the cost of an acquisition over the Company’s share of the net fair value of the
identifiable assets and liabilities of a subsidiary at the date of acquisition is recognized as goodwill,
which is included within the carrying amount of the investment and is not amortized. Any excess of
the Company’s share of the net fair value of the identifiable assets and liabilities over the cost of the
acquisition is recognized immediately in profit or loss.

- 19 -
The Company assesses its investments for any impairment by comparing the respective carrying
amounts with the estimated recoverable amounts as assessed based on the entire financial statements of
its investees. Impairment loss is recognized when the carrying amount of any such an investment
exceeds the recoverable amount. If the recoverable amount of an investment subsequently increases,
the Company recognizes a reversal of the impairment loss; the adjusted post-reversal carrying amount
should not exceed the carrying amount that would have been recognized (net of amortization) had no
impairment loss been recognized in prior years. An impairment loss recognized on goodwill cannot be
reversed in a subsequent period.
When the Company loses control of a subsidiary, it recognizes the investment retained in the former
subsidiary at its fair value at the date when control is lost. The difference between the fair value of the
retained investment plus any consideration received and the carrying amount of the previous investment
at the date when control is lost is recognized as a gain or loss in profit or loss. Besides, the Company
accounts for all amounts previously recognized in other comprehensive income in relation to that
subsidiary on the same basis as would be required if the Company had directly disposed of the related
assets or liabilities.
Any profit or loss resulting from downstream transactions is eliminated in full only in the Company’s
parent company only financial statements. Any profit or loss resulting from upstream transactions and
transactions between subsidiaries is recognized only in the Company’s parent company only financial
statements and only to the extent of interests in the subsidiaries that are not related to the Company.
g. Property, plant and equipment
Property, plant and equipment are stated at cost less accumulated depreciation and accumulated
impairment loss.
Property, plant and equipment in the course of construction are carried at cost less any recognized
impairment loss. Cost includes professional fees and borrowing costs eligible for capitalization.
Such assets are depreciated and classified to the appropriate categories of property, plant and equipment
when completed and ready for their intended use.
Depreciation on property, plant and equipment is recognized using the straight-line method. Each
significant part is depreciated separately. The estimated useful lives, residual values and depreciation
methods are reviewed at the end of each year, with the effects of any changes in the estimates accounted
for on a prospective basis.
On derecognition of an item of property, plant and equipment, the difference between the sales proceeds
and the carrying amount of the asset is recognized in profit or loss.
h. Intangible assets
1) Intangible assets acquired separately
Intangible assets with finite useful lives that are acquired separately are initially measured at cost
and subsequently measured at cost less accumulated amortization and accumulated impairment loss.
Amortization is recognized on a straight-line basis. The estimated useful lives, residual values,
and amortization methods are reviewed at the end of each year, with the effects of any changes in
the estimates accounted for on a prospective basis.
2) Internally-generated intangible assets - research and development expenditures
Expenditures on research activities are recognized as expenses in the period in which they are
incurred.

- 20 -
An internally-generated intangible asset arising from the development phase of an internal project is
recognized if, and only if, all of the following have been demonstrated:
a) The technical feasibility of completing the intangible asset so that it will be available for use or
sale;
b) The intention to complete the intangible asset and use or sell it;
c) The ability to use or sell the intangible asset;
d) How the intangible asset will generate probable future economic benefits;
e) The availability of adequate technical, financial and other resources to complete the
development and to use or sell the intangible asset; and
f) The ability to measure reliably the expenditures attributable to the intangible asset during its
development.
The amount initially recognized for internally-generated intangible assets is the sum of the
expenditures incurred from the date when such an intangible asset first meets the recognition
criteria listed above. Subsequent to initial recognition, such intangible assets are measured on the
same basis as intangible assets that are acquired separately.
3) Derecognition of intangible assets
On derecognition of an intangible asset, the difference between the net disposal proceeds and the
carrying amount of the asset is recognized in profit or loss.
i. Impairment of tangible and intangible assets
At the end of each reporting period, the Company reviews the carrying amounts of its tangible and
intangible assets to determine whether there is any indication that those assets have suffered an
impairment loss. If any such indication exists, the recoverable amount of the asset is estimated in
order to determine the extent of the impairment loss. When it is not possible to estimate the
recoverable amount of an individual asset, the Company estimates the recoverable amount of the
cash-generating unit to which the asset belongs. Corporate assets are allocated to the smallest group of
cash-generating units on a reasonable and consistent basis of allocation.
The recoverable amount is the higher of fair value less costs to sell and value in use. If the recoverable
amount of an asset or cash-generating unit is estimated to be less than its carrying amount, the carrying
amount of the asset or cash-generating unit is reduced to its recoverable amount, with the resulting
impairment loss recognized in profit or loss.
When an impairment loss is subsequently reversed, the carrying amount of the corresponding asset or
cash-generating unit is increased to the revised estimate of its recoverable amount, but only to the extent
of the carrying amount (net of amortization or depreciation) that would have been determined had no
impairment loss been recognized for the asset or cash-generating unit in prior years. A reversal of an
impairment loss is recognized in profit or loss.
j. Financial instruments
Financial assets and financial liabilities are recognized when the Company becomes a party to the
contractual provisions of the instruments.

- 21 -
Financial assets and financial liabilities are initially measured at fair value. Transaction costs that are
directly attributable to an acquisition or issuance of financial assets and financial liabilities (other than
financial assets and financial liabilities at fair value through profit or loss) are added to or deducted
from the fair value of the financial assets or financial liabilities, as appropriate, on initial recognition.
Transaction costs directly attributable to the acquisition of financial assets or financial liabilities at fair
value through profit or loss are recognized immediately in profit or loss.
1) Financial assets
All regular way purchases or sales of financial assets are recognized and derecognized on a trade
date basis.
a) Measurement category
Financial assets are classified into the following categories: Available-for-sale financial assets
and loans and receivables.
i. Available-for-sale financial assets
Available-for-sale financial assets are non-derivatives that are either designated as
available-for-sale or are not classified as loans and receivables, held-to-maturity investments
or financial assets at fair value through profit or loss.
Available-for-sale financial assets of the Company are investments in domestic listed shares
and are measured at fair value. Dividends on available-for-sale equity investments are
recognized in profit or loss. Other changes in the carrying amount of available-for-sale
financial assets are recognized in other comprehensive income and will be reclassified to
profit or loss when the investment is disposed of or is determined to be impaired.
Dividends on available-for-sale equity instruments are recognized in profit or loss when the
Company’s right to receive the dividends is established.
Available-for-sale equity investments that do not have a quoted market price in an active
market and whose fair value cannot be reliably measured and derivatives that are linked to
and must be settled by delivery of such unquoted equity investments are measured at cost
less any identified impairment loss at the end of each reporting period and are presented in a
separate line item as financial assets measured at cost. If, in a subsequent period, the fair
value of the financial assets can be reliably measured, the financial assets are remeasured at
fair value. The difference between the carrying amount and the fair value is recognized in
other comprehensive income on the financial assets. Any impairment loss is recognized in
profit and loss.
ii. Loans and receivables
Loans and receivables (including cash and cash equivalents, accounts receivable and other
receivables) are measured using the effective interest method at amortized cost less any
impairment, except for short-term receivables when the effect of discounting is immaterial.
Cash equivalents include time deposits and repurchase agreements collateralized by bonds
with original maturities within three months from the date of acquisition, which are highly
liquid, readily convertible to a known amount of cash and are subject to an insignificant risk
of changes in value. These cash equivalents are held for the purpose of meeting short-term
cash commitments.

- 22 -
b) Impairment of financial assets
Financial assets, other than those at fair value through profit or loss, are assessed for indicators
of impairment at the end of each reporting period. Financial assets are considered to be
impaired when there is objective evidence, as a result of one or more events that occurred after
the initial recognition of the financial asset, that the estimated future cash flows of the
investment have been affected.
For financial assets measured at amortized cost, such as accounts receivable, such assets are
assessed for impairment on a collective basis even if they were assessed not to be impaired
individually. Objective evidence of impairment for a portfolio of receivables could include the
Company’s past experience with collecting payments, an increase in the number of delayed
payments in the portfolio, as well as observable changes in national or local economic
conditions that correlate with defaults on receivables.
For a financial asset measured at amortized cost, the amount of the impairment loss recognized
is the difference between such an asset’s carrying amount and the present value of its estimated
future cash flows, discounted at the financial asset’s original effective interest rate.
For financial assets measured at amortized cost, if, in a subsequent period, the amount of the
impairment loss decreases and the decrease can be related objectively to an event occurring after
the impairment was recognized, the previously recognized impairment loss is reversed through
profit or loss to the extent that the carrying amount of the investment (at the date the impairment
is reversed) does not exceed what the amortized cost would have been had the impairment not
been recognized.
For available-for-sale equity investments, a significant or prolonged decline in the fair value of
the security below its cost is considered to be objective evidence of impairment.
For all other financial assets, objective evidence of impairment could include significant
financial difficulty of the issuer or counterparty, breach of contract such as a default or
delinquency in interest or principal payments, it becoming probable that the borrower will enter
bankruptcy or financial re-organization, or the disappearance of an active market for that
financial asset because of financial difficulties.
When an available-for-sale financial asset is considered to be impaired, cumulative losses
previously recognized in other comprehensive income are reclassified to profit or loss in the
period.
In respect of available-for-sale equity securities, impairment loss previously recognized in profit
or loss is not reversed through profit or loss. Any increase in fair value subsequent to an
impairment loss is recognized in other comprehensive income.
For financial assets that are measured at cost, the amount of the impairment loss is measured as
the difference between such an asset’s carrying amount and the present value of its estimated
future cash flows discounted at the current market rate of return for a similar financial asset.
Such impairment loss will not be reversed in subsequent periods.
The carrying amount of a financial asset is reduced by the impairment loss directly for all
financial assets, with the exception of accounts receivable, where the carrying amount is
reduced through the use of an allowance account. When accounts receivable are considered
uncollectible, they are written off against the allowance account. Subsequent recoveries of
amounts previously written off are credited against the allowance account. Changes in the
carrying amount of the allowance account are recognized in profit or loss except for
uncollectible accounts receivable that are written off against the allowance account.

- 23 -
c) Derecognition of financial assets
The Company derecognizes a financial asset only when the contractual rights to the cash flows
from the asset expire or when it transfers the financial asset and substantially all the risks and
rewards of ownership of the asset to another party.
On derecognition of a financial asset in its entirety, the difference between the asset’s carrying
amount and the sum of the consideration received and receivable and the cumulative gain or
loss that had been recognized in other comprehensive income is recognized in profit or loss.
2) Equity instruments
The repurchase of the Company’s own equity instruments is recognized in and deducted directly
from equity. No gain or loss is recognized in profit or loss on the purchase, sale, issuance or
cancellation of the Company’s own equity instruments.
3) Financial liabilities
Financial liabilities are measured at amortized cost using the effective interest method. On
derecognition of a financial liability, the difference between the carrying amount of a financial
liability derecognized and the consideration paid is recognized in profit or loss.
k. Provisions
Provisions are measured at the best estimate of the discounted cash flows of the consideration required
to settle the present obligation at the end of the reporting period, taking into account the risks and
uncertainties surrounding the obligation.
Provisions for the expected cost of warranty obligations are recognized at the date of sale of the relevant
products at the best estimate by the management of the Company of the expenditures required to settle
the Company’s obligations.
l. Revenue recognition
Revenue is measured at the fair value of the consideration received or receivable. Revenue is reduced
for estimated customer returns, rebates and other similar allowances. Allowances for sales returns are
recognized at the time of sale based on the seller’s reliable estimate of future returns and based on past
experience and other relevant factors.
1) Sale of goods
Revenue from the sale of goods is recognized when all the following conditions are satisfied:
a) The Company has transferred to the buyer the significant risks and rewards of ownership of the
goods;
b) The Company retains neither continuing managerial involvement to the degree usually
associated with ownership nor effective control over the goods sold;
c) The amount of revenue can be measured reliably;
d) It is probable that the economic benefits associated with the transaction will flow to the
Company; and
e) The costs incurred or to be incurred in respect of the transaction can be measured reliably.
- 24 -
The Company does not recognize sales revenue on materials delivered to subcontractors because
this delivery does not involve a transfer of risks and rewards of material ownership.
2) Royalties
Royalty revenue is recognized on an accrual basis in accordance with the substance of the relevant
agreement provided that it is probable that the economic benefits will flow to the Company and the
amount of revenue can be measured reliably. Royalties determined on a time basis are recognized
on a straight-line basis over the period of the agreement. Royalty arrangements that are based on
sales are recognized by reference to the underlying arrangement. Proceeds of royalties received
but which have not met the condition of revenue recognition are recognized as receipts in advance -
current and other non-current liabilities, respectively, based on the remaining contract period.
3) Dividend and interest income
Dividend income from investments is recognized when a shareholder’s right to receive payment has
been established provided that it is probable that the economic benefits will flow to the Company
and the amount of income can be measured reliably.
Interest income from a financial asset is recognized when it is probable that the economic benefits
will flow to the Company and the amount of income can be measured reliably. Interest income is
accrued on a time basis, by reference to the principal outstanding and at the applicable effective
interest rate.
m. Leasing
Leases are classified as finance leases whenever the terms of a lease transfer substantially all the risks
and rewards of ownership to the lessee. All other leases are classified as operating leases.
Rental income from operating leases is recognized on a straight-line basis over the term of the relevant
lease. Operating lease payments are recognized as expenses on a straight-line basis over the lease
term.
n. Borrowing costs
Borrowing costs directly attributable to an acquisition, construction or production of qualifying assets
are added to the cost of those assets, until such time as the assets are substantially ready for their
intended use or sale.
Other than that which is stated above, all other borrowing costs are recognized in profit or loss in the
year in which they are incurred.
o. Employee benefits
1) Short-term employee benefits
Liabilities recognized in respect of short-term employee benefits are measured at the undiscounted
amount of the benefits expected to be paid in exchange for the related services.
2) Retirement benefits
Payments to defined contribution retirement benefit plans are recognized as expenses when
employees have rendered services entitling them to the contributions.

- 25 -
Defined benefit costs (including service cost, net interest and remeasurement) under the defined
benefit retirement benefit plans are determined using the projected unit credit method. Service
cost (including current service cost and past service cost) and net interest on the net defined benefit
liabilities are recognized as employee benefits expense in the period in which they occur.
Remeasurement, comprising actuarial gains and losses and the return on plan assets (excluding
interest), is recognized in other comprehensive income in the period in which it occurs.
Remeasurement recognized in other comprehensive income is reflected immediately in retained
earnings and will not be reclassified to profit or loss.
Net defined benefit liabilities represent the actual deficit in the Company’s defined benefit plans.
p. Share-based payment arrangements
The fair value at the grant date of share-based payments is expensed on a straight-line basis over the
vesting period, based on the Company’s best estimates of the number of shares or options that are
expected to ultimately vest, with a corresponding increase in capital surplus - employee share options.
It is recognized as an expense in full at the grant date if vested immediately.
At the end of each reporting period, the Company revises its estimate of the number of equity
instruments expected to vest. The impact of the revision of the original estimate is recognized in profit
or loss such that the cumulative expenses reflect the revised estimate, with a corresponding adjustment
to capital surplus - employee share options.
q. Taxation
Income tax expense represents the sum of the tax currently payable and deferred tax. Current and
deferred taxes are recognized in profit or loss, except when they relate to items that are recognized in
other comprehensive income, in which case, the current and deferred taxes are also recognized in other
comprehensive income.
1) Current tax
According to the Income Tax Law, an additional tax at 10% of unappropriated earnings is provided
for as income tax in the year that the shareholders approve to retain earnings.
Adjustments of prior years’ tax liabilities are added to or deducted from the current year’s tax
provision.
2) Deferred tax
Deferred tax is recognized on temporary differences between the carrying amounts of assets and
liabilities and the corresponding tax bases used in the computation of taxable profit.
Deferred tax liabilities are generally recognized for all taxable temporary differences. Deferred
tax assets are generally recognized for all deductible temporary differences and unused loss
carryforwards to the extent that it is probable that taxable profit will be available against which
those deductible temporary differences can be utilized.
Deferred tax liabilities are recognized for taxable temporary differences associated with investments
in subsidiaries and associates, except where the Company is able to control the reversal of the
temporary difference and it is probable that the temporary difference will not reverse in the
foreseeable future. Deferred tax assets arising from deductible temporary differences associated
with such investments are only recognized to the extent that it is probable that there will be
sufficient taxable profit against which to utilize the benefits of the temporary differences and they
are expected to reverse in the foreseeable future.

- 26 -
The carrying amount of deferred tax assets is reviewed at the end of each reporting period and
reduced to the extent that it is no longer probable that sufficient taxable profit will be available to
allow all or part of the assets to be recovered. A previously unrecognized deferred tax asset is also
reviewed at the end of each reporting period and recognized to the extent that it has become
probable that future taxable profit will allow the deferred tax asset to be recovered.
Deferred tax liabilities and assets are measured at the tax rates that are expected to apply in the year
in which the liabilities are settled or the assets are realized, based on tax rates and tax laws that have
been enacted or substantively enacted by the end of the reporting period. The measurement of
deferred tax liabilities and assets reflects the tax consequences that would follow from the manner
in which the Company expects, at the end of the reporting period, to recover or settle the carrying
amount of its assets and liabilities.
5. CRITICAL ACCOUNTING JUDGMENTS AND KEY SOURCES OF ESTIMATION
UNCERTAINTY
In the application of the Company’s accounting policies, management is required to make judgments,
estimations and assumptions about the carrying amounts of assets and liabilities that are not readily
apparent from other sources. The estimations and associated assumptions are based on historical
experience and other factors that are considered relevant. Actual results may differ from these
estimations.
The estimations and underlying assumptions are reviewed on an ongoing basis. Revisions to accounting
estimations are recognized in the year in which the estimations are revised if the revisions affect only that
year or in the year of the revisions and future years if the revisions affect both current and future years.
a. Impairment of investments accounted for using the equity method
The Company immediately recognizes impairment loss on its investments accounted for using the
equity method when there is any indication that an investment may be impaired and the carrying
amount may not be recoverable. The Company’s management evaluates such impairment based on
the estimated future cash flows expected to be generated from the investments accounted for using the
equity method. The Company also takes into consideration the market conditions and industry
developments to evaluate the appropriateness of the relevant assumptions.
b. Impairment of inventories
The net realizable value of inventory is the estimated selling price in the ordinary course of business
less the estimated costs of completion and the estimated costs necessary to make the sale. The
estimation of the net realizable value is based on current market conditions and historical experience
with products sales of a similar nature. Certain rates of impairment loss may be estimated if there is
no changes in the stock of inventory over a certain period of time. Changes in market conditions may
have a material impact on the estimation of the net realizable value.

- 27 -
6. CASH AND CASH EQUIVALENTS
December 31
2017 2016
Cash on hand $ 171 $ 165
Checking accounts and demand deposits 639,188 424,382
Cash equivalents (investments with original maturities of less than 3
months)
Time deposits - 64,500
Repurchase agreements collateralized by bonds - 384,174
$ 639,359 $ 873,221
The market rate and market rate intervals of demand deposits, time deposits and bonds with repurchase
agreements at the end of the reporting period were as follows:
December 31
2017 2016
Demand deposits 0.07-0.65% 0.07-0.5%
Time deposits - 1.4%
Repurchase agreements collateralized by bonds - 0.45-1.25%
7. FINANCIAL ASSETS MEASURED AT COST
Financial assets measured at cost of the Company are investments in domestic and overseas unlisted shares
and emerging shares, and were classified as available-for-sale financial assets according to the
measurement categories.
Management believed that the above unlisted equity investments held by the Company had fair values
which could not be reliably measured because the range of reasonable fair value estimates was so
significant. Therefore, they were measured at cost less impairment at the end of the reporting period.
8. ACCOUNTS RECEIVABLE
December 31
2017 2016
Accounts receivable $ 256,077 $ 491,967
Less: Allowance for impairment loss - -
$ 256,077 $ 491,967
In determining the recoverability of accounts receivable, the Company considered any change in the credit
quality of the respective accounts receivable since the date credit was initially granted to the end of the
reporting period. Due to insignificant risks on the recoverability of the Company’s accounts receivable
historically, an allowance for impairment loss was recognized based on the estimated irrecoverable amounts
determined by reference to past default experience with the counterparties and an analysis of their
respective current financial positions.
Before accepting a new customer, the Company evaluates the credit quality of a potential customer through
an internal credit rating system or an external credit rating agency and sets the credit line of the customer.
The Company checks its customers’ credit lines and ratings regularly.

- 28 -
For the accounts receivable balances that were past due at the end of the reporting period, the Company did
not recognize an allowance for impairment loss, because there was no significant change in credit quality
and the amounts were still considered recoverable.
The aging of accounts receivable was as follows:
December 31
2017 2016
Not past due $ 252,645 $ 485,353
Past due in 1-90 days 1,667 6,614
Past due more than 90 days 1,765 -
$ 256,077 $ 491,967
The above aging schedule was based on the number of past due days from the end of the credit term.
The aging of accounts receivable that were past due but not impaired was as follows:
December 31
2017 2016
1-90 days $ 1,667 $ 6,614
More than 90 days 1,765 -
$ 3,432 $ 6,614
The above aging schedule was based on the number of past due days from the end of the credit term.
There was no movement of the allowance for doubtful accounts receivable for the year ended December 31,
2017. The movement of the allowance for doubtful accounts receivable for the year ended December 31,
2016 was as follows:
Individually
Assessed for
Impairment
Collectively
Assessed for
Impairment Total
Balance at January 1, 2016 $ - $ 10,600 $ 10,600
Impairment losses reversed (included in other
income) - (10,600) (10,600)
Balance at December 31, 2016 $ - $ - $ -
9. INVENTORIES
December 31
2017 2016
Finished goods $ 877,724 $ 347,284
Semi-finished goods 204,918 124,799
Work in progress 4,940 28,704
Raw materials 826,210 415,526
$ 1,913,792 $ 916,313
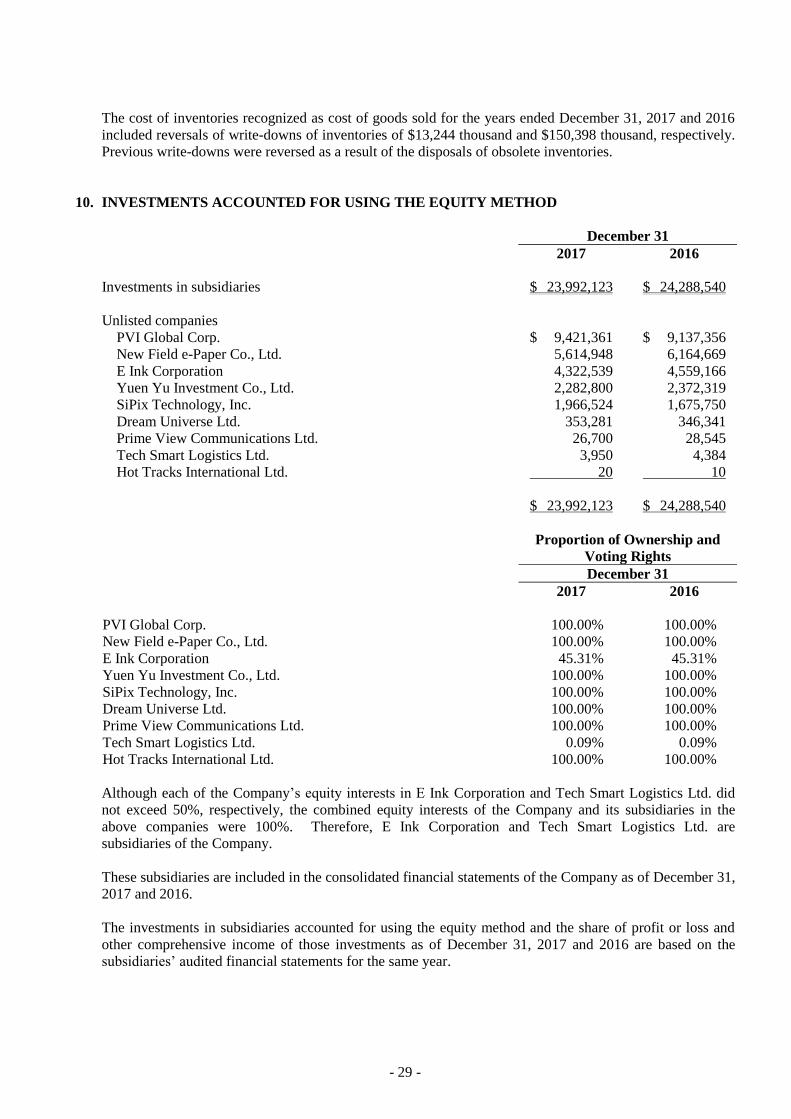
- 29 -
The cost of inventories recognized as cost of goods sold for the years ended December 31, 2017 and 2016
included reversals of write-downs of inventories of $13,244 thousand and $150,398 thousand, respectively.
Previous write-downs were reversed as a result of the disposals of obsolete inventories.
10. INVESTMENTS ACCOUNTED FOR USING THE EQUITY METHOD
December 31
2017 2016
Investments in subsidiaries $ 23,992,123 $ 24,288,540
Unlisted companies
PVI Global Corp. $ 9,421,361 $ 9,137,356
New Field e-Paper Co., Ltd. 5,614,948 6,164,669
E Ink Corporation 4,322,539 4,559,166
Yuen Yu Investment Co., Ltd. 2,282,800 2,372,319
SiPix Technology, Inc. 1,966,524 1,675,750
Dream Universe Ltd. 353,281 346,341
Prime View Communications Ltd. 26,700 28,545
Tech Smart Logistics Ltd. 3,950 4,384
Hot Tracks International Ltd. 20 10
$ 23,992,123 $ 24,288,540
Proportion of Ownership and
Voting Rights
December 31
2017 2016
PVI Global Corp. 100.00% 100.00%
New Field e-Paper Co., Ltd. 100.00% 100.00%
E Ink Corporation 45.31% 45.31%
Yuen Yu Investment Co., Ltd. 100.00% 100.00%
SiPix Technology, Inc. 100.00% 100.00%
Dream Universe Ltd. 100.00% 100.00%
Prime View Communications Ltd. 100.00% 100.00%
Tech Smart Logistics Ltd. 0.09% 0.09%
Hot Tracks International Ltd. 100.00% 100.00%
Although each of the Company’s equity interests in E Ink Corporation and Tech Smart Logistics Ltd. did
not exceed 50%, respectively, the combined equity interests of the Company and its subsidiaries in the
above companies were 100%. Therefore, E Ink Corporation and Tech Smart Logistics Ltd. are
subsidiaries of the Company.
These subsidiaries are included in the consolidated financial statements of the Company as of December 31,
2017 and 2016.
The investments in subsidiaries accounted for using the equity method and the share of profit or loss and
other comprehensive income of those investments as of December 31, 2017 and 2016 are based on the
subsidiaries’ audited financial statements for the same year.

- 30 -
11. PROPERTY, PLANT AND EQUIPMENT
Buildings Machinery
Other
Equipment
Construction in
Progress and
Prepayments
for Equipment Total
Cost
Balance at January 1, 2016 $ 2,506,732 $ 6,370,819 $ 1,368,664 $ 3,434 $ 10,249,649
Additions 160 8,923 40,514 87,446 137,043 Disposals (318,714 ) (34,256 ) (221,343 ) - (574,313 )
Reclassifications 790 7,255 64,022 (72,067 ) -
Balance at December 31, 2016 $ 2,188,968 $ 6,352,741 $ 1,251,857 $ 18,813 $ 9,812,379
Accumulated depreciation and impairment
Balance at January 1, 2016 $ 1,596,891 $ 5,886,133 $ 995,965 $ - $ 8,478,989
Depreciation expenses 41,487 114,784 110,986 - 267,257 Impairment losses 69,045 29,542 30,112 - 128,699
Disposals (318,714 ) (34,256 ) (221,327 ) - (574,297 )
Balance at December 31, 2016 $ 1,388,709 $ 5,996,203 $ 915,736 $ - $ 8,300,648
Carrying amount at December 31, 2016 $ 800,259 $ 356,538 $ 336,121 $ 18,813 $ 1,511,731
Cost
Balance at January 1, 2017 $ 2,188,968 $ 6,352,741 $ 1,251,857 $ 18,813 $ 9,812,379
Additions - 17,845 42,994 113,195 174,034 Disposals (218,374 ) (1,159,592 ) (88,299 ) - (1,466,265 )
Reclassifications - 31,586 65,096 (100,558 ) (3,876 )
Balance at December 31, 2017 $ 1,970,594 $ 5,242,580 $ 1,271,648 $ 31,450 $ 8,516,272
Accumulated depreciation and impairment
Balance at January 1, 2017 $ 1,388,709 $ 5,996,203 $ 915,736 $ - $ 8,300,648
Depreciation expenses 37,965 98,923 103,674 - 240,562 Disposals (218,374 ) (1,153,650 ) (88,299 ) - (1,460,323 )
Balance at December 31, 2017 $ 1,208,300 $ 4,941,476 $ 931,111 $ - $ 7,080,887
Carrying amount at December 31, 2017 $ 762,294 $ 301,104 $ 340,537 $ 31,450 $ 1,435,385
The Company performed an assessment of the recoverable amount of property, plant and equipment and
recognized an impairment loss of $128,699 thousand for the year ended December 31, 2016.
Information about the capitalized interest is as follows:
For the Year Ended December 31
2017 2016
Capitalized interest $ 307 $ 228
Capitalization rate intervals 0.99-1.82% 1.1-1.58%
The above items of property, plant and equipment are depreciated on a straight-line basis over their
estimated useful lives as follows:
Buildings
Main buildings 56 years
Clean rooms and plumbing construction 25-36 years
Others 2-16 years
Machinery 1-9 years
Other equipment 1-26 years

- 31 -
12. SHORT-TERM BORROWINGS
December 31
2017 2016
Bank credit borrowings $ 228,800 $ -
Foreign currency included (in thousands of USD) $ 5,000 $ -
Interest rate intervals 0.98-1.99% -
13. RETIREMENT BENEFIT PLANS
a. Defined contribution plan
The Company adopted a pension plan under the Labor Pension Act (the “LPA”), which is a
state-managed defined contribution plan. Under the LPA, the Company makes monthly contributions
to employees’ individual pension accounts at 6% of monthly salaries and wages.
b. Defined benefit plan
The defined benefit plan adopted by the Company in accordance with the Labor Standards Law is
operated by the government of the ROC. Pension benefits are calculated on the basis of the length of
service and average monthly salaries of the 6 months before retirement. The Company contributes
amounts equal to 2% of total monthly salaries and wages to a pension fund administered by the pension
fund monitoring committee. Pension contributions are deposited in the Bank of Taiwan in the
committee’s name. Before the end of each year, the Company assesses the balance in the pension
fund. If the amount of the balance in the pension fund is inadequate to pay retirement benefits for
employees who conform to retirement requirements in the next year, the Company is required to fund
the difference in one appropriation that should be made before the end of March of the next year. The
pension fund is managed by the Bureau of Labor Funds, Ministry of Labor (“the Bureau”); the
Company has no right to influence the investment policy and strategy.
The amounts included in the balance sheets in respect of the Company’s defined benefit plan were as
follows:
December 31
2017 2016
Present value of defined benefit obligation $ 113,743 $ 104,553
Fair value of plan assets (57,851) (53,010)
Net defined benefit liabilities $ 55,892 $ 51,543

- 32 -
Movements in net defined benefit liabilities were as follows:
Present Value
of the Defined
Benefit
Obligation
Fair Value of
the Plan Assets
Net Defined
Benefit
Liabilities
Balance at January 1, 2016 $ 128,530 $ (104,084) $ 24,446
Service costs
Current service costs 1,127 - 1,127
Past service costs 22,756 - 22,756
Net interest expense (income) 2,089 (1,734) 355
Recognized in profit or loss 25,972 (1,734) 24,238
Remeasurement
Return on plan assets (excluding amounts
included in net interest) - 1,048 1,048
Actuarial loss - changes in demographic
assumptions 2,956 - 2,956
Actuarial loss - changes in financial
assumptions 3,348 - 3,348
Actuarial loss - experience adjustments 604 - 604
Recognized in other comprehensive income 6,908 1,048 7,956
Contributions from the employer - (5,097) (5,097)
Benefits paid (56,857) 56,857 -
Balance at December 31, 2016 104,553 (53,010) 51,543
Service costs
Current service costs 977 - 977
Net interest expense (income) 1,438 (762) 676
Recognized in profit or loss 2,415 (762) 1,653
Remeasurement
Return on plan assets (excluding amounts
included in net interest) - 78 78
Actuarial loss - changes in demographic
assumptions 4,256 - 4,256
Actuarial gain - experience adjustments 2,519 - 2,519
Recognized in other comprehensive income 6,775 78 6,853
Contributions from the employer - (4,157) (4,157)
Balance at December 31, 2017 $ 113,743 $ (57,851) $ 55,892
Through the defined benefit plan under the Labor Standards Law, the Company is exposed to the
following risks:
1) Investment risk: The plan assets are invested in domestic and foreign equity and debt securities,
bank deposits, etc. The investment is conducted at the discretion of the Bureau or under the
mandated management. However, in accordance with relevant regulations, the return generated by
plan assets should not be below the interest rate for a 2-year time deposit with local banks.
2) Interest risk: A decrease in the government bond interest rates will increase the present value of
the defined benefit obligation; however, this will be partially offset by an increase in the return on
the plan’s debt investments.
3) Salary risk: The present value of the defined benefit obligation is calculated by reference to the
future salaries of plan participants. As such, an increase in the salaries of the plan participants will
increase the present value of the defined benefit obligation.

- 33 -
The actuarial valuations of the present value of the defined benefit obligation were carried out by
qualified actuaries. The significant assumptions used for the purposes of the actuarial valuations were
as follows:
December 31
2017 2016
Discount rates 1.4% 1.4%
Expected rates of salary increase 2.8% 2.8%
If possible reasonable changes in each of the significant actuarial assumptions will occur and all other
assumptions will remain constant, the present value of the defined benefit obligation would increase
(decrease) as follows:
December 31
2017 2016
Discount rates
0.25% increase $ (3,567) $ (3,422)
0.25% decrease $ 3,723 $ 3,574
Expected rates of salary increase
0.25% increase $ 3,604 $ 3,460
0.25% decrease $ (3,473) $ (3,331)
The sensitivity analysis presented above may not be representative of the actual changes in the present
value of the defined benefit obligation as it is unlikely that the changes in assumptions would occur in
isolation of one another as some of the assumptions may be correlated.
December 31
2017 2016
The expected contributions to the plan for the next year $ 4,134 $ 4,787
The average duration of the defined benefit obligation 13 years 13 years
14. EQUITY
a. Ordinary shares
December 31
2017 2016
Number of shares authorized (in thousands) 2,000,000 2,000,000
Amount of shares authorized $ 20,000,000 $ 20,000,000
Number of shares issued and fully paid (in thousands) 1,140,468 1,140,468
Amount of shares issued $ 11,404,677 $ 11,404,677

- 34 -
b. Capital surplus
December 31
2017 2016
May be used to offset a deficit, distributed as cash dividends, or
transferred to share capital (1)
Issuance of shares $ 9,494,322 $ 9,494,322
Conversion of bonds 525,200 525,200
Treasury share transactions 20,106 -
The difference between consideration received or paid and the
carrying amount of the subsidiaries’ net assets during actual
disposals or acquisitions
- 2,223
May only be used to offset a deficit (2)
Employee share options expired 49,840 49,833
Share of changes in capital surplus of associates 105 105
May not be used for any purpose
Employee share options 18,546 -
$ 10,108,119 $ 10,071,683
1) Such capital surplus may be used to offset a deficit; in addition, when the Company has no deficit,
such capital surplus may be distributed as cash dividends or transferred to share capital (limited to a
certain percentage of the Company’s capital surplus and once a year).
2) Such capital surplus arises from the effects of changes in ownership interests in subsidiaries and
associates resulting from equity transactions, other than actual disposals or acquisitions, or from
changes in capital surplus of subsidiaries and associates accounted for using the equity method.
c. Retained earnings and dividends policy
Under the dividends policy as set forth in the Company’s amended Articles of Incorporation, where the
Company made a profit in a fiscal year, the profit shall be first utilized for paying taxes, offsetting
losses of previous years, setting aside as a legal reserve 10% of the remaining profit, setting aside or
reversing a special reserve in accordance with the laws and regulations, and then any remaining profit
together with at least 50% of any undistributed retained earnings shall be used by the Company’s board
of directors as the basis for proposing a distribution plan, which should be resolved in the shareholders’
meeting for the distribution of dividends and bonuses to shareholders. For the policies on the
distribution of employees’ compensation and remuneration of directors after amendment, refer to Note
15.
The Company’s Articles of Incorporation also stipulate a dividends policy whereby the issuance of
share dividends takes precedence over the payment of cash dividends. In principle, cash dividends
should be at least 10% of the total dividends distributed.
The appropriation of earnings to a legal reserve shall be made until the legal reserve equals the
Company’s paid-in capital. The legal reserve may be used to offset deficits. If the Company has no
deficits and the legal reserve has exceeded 25% of the Company’s paid-in capital, the excess may be
transferred to capital or distributed in cash.

- 35 -
Items referred to under Rule No. 1010012865 issued by the FSC and in the directive titled “Questions
and Answers for Special Reserves Appropriated Following Adoption of IFRSs” should be appropriated
to or reversed from a special reserve by the Company.
Except for non-ROC resident shareholders, all shareholders receiving dividends are allowed a tax credit
equal to their proportionate share of the income tax paid by the Company.
The appropriations of earnings for 2016 and 2015 approved in the shareholders’ meetings on June 20,
2017 and June 22, 2016, respectively, were as follows:
Appropriation of Earnings
Dividends Per Share
(NT$)
For the Year Ended
December 31
For the Year Ended
December 31
2016 2015 2016 2015
Legal reserve $ 190,794 $ 53,933
Cash dividends 1,680,702 536,020 $ 1.50 $ 0.47
The appropriation of earnings for 2017 were proposed by the Company’s board of directors on March
27, 2018. The appropriation and dividends per share were as follows:
Appropriation
of Earnings
Dividends Per
Share (NT$)
Legal reserve $ 207,806
Cash dividends 1,853,550 $1.65
The appropriation of earnings for 2017 is subject to resolution in the shareholders’ meeting to be held
on June 22, 2018.
d. Special reserve
If the special reserve appropriated on the first-time adoption of IFRSs relates to exchange differences on
translating the financial statements of foreign operations, the special reserve will be reversed on the
Company’s disposal of the foreign operations; on the Company’s loss of significant influence, however,
the entire special reserve will be reversed. An additional special reserve should be appropriated for the
amount equal to the difference between the net debit balance of the reserves and the special reserve
appropriated on the first-time adoption of IFRSs. Any special reserve appropriated may be reversed to
the extent that the net debit balance reverses and may thereafter be distributed.
e. Other equity items
1) Exchange differences on translating foreign operations
For the Year Ended December 31
2017 2016
Balance at January 1 $ 261,704 $ 966,474
Share of exchange differences of subsidiaries accounted for
using the equity method (504,327) (704,770)
Balance at December 31 $ (242,623) $ 261,704
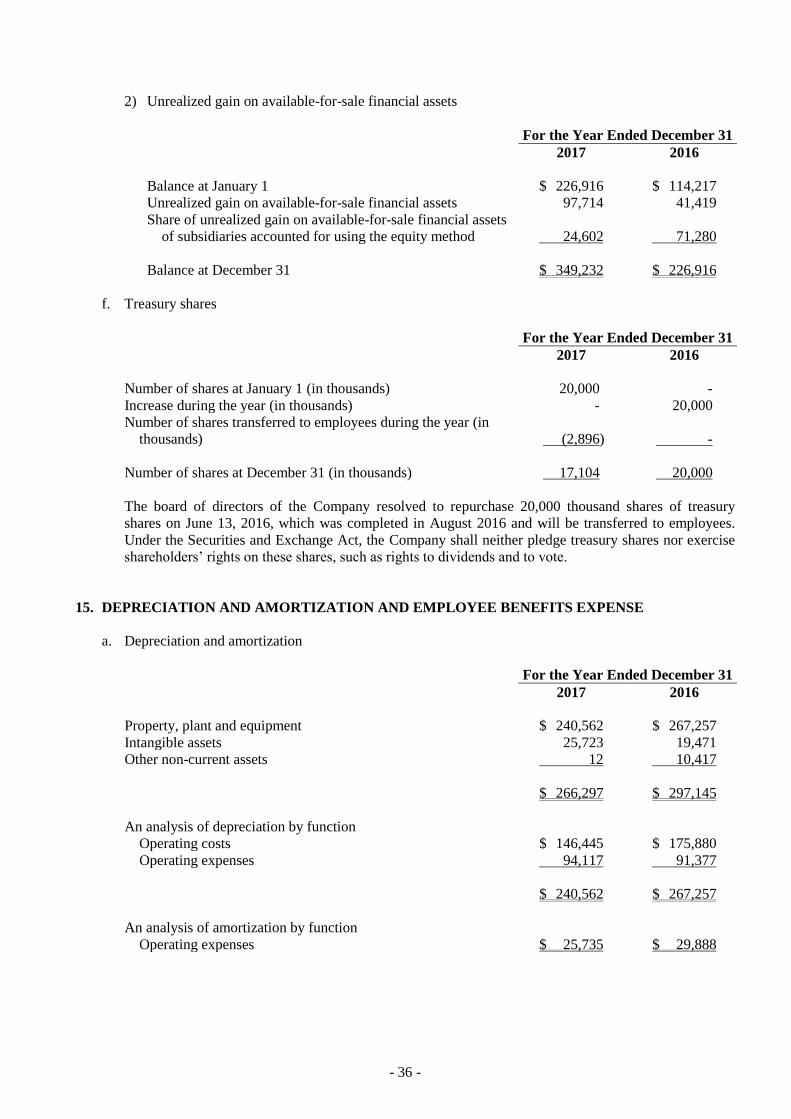
- 36 -
2) Unrealized gain on available-for-sale financial assets
For the Year Ended December 31
2017 2016
Balance at January 1 $ 226,916 $ 114,217
Unrealized gain on available-for-sale financial assets 97,714 41,419
Share of unrealized gain on available-for-sale financial assets
of subsidiaries accounted for using the equity method 24,602 71,280
Balance at December 31 $ 349,232 $ 226,916
f. Treasury shares
For the Year Ended December 31
2017 2016
Number of shares at January 1 (in thousands) 20,000 -
Increase during the year (in thousands) - 20,000
Number of shares transferred to employees during the year (in
thousands) (2,896) -
Number of shares at December 31 (in thousands) 17,104 20,000
The board of directors of the Company resolved to repurchase 20,000 thousand shares of treasury
shares on June 13, 2016, which was completed in August 2016 and will be transferred to employees.
Under the Securities and Exchange Act, the Company shall neither pledge treasury shares nor exercise
shareholders’ rights on these shares, such as rights to dividends and to vote.
15. DEPRECIATION AND AMORTIZATION AND EMPLOYEE BENEFITS EXPENSE
a. Depreciation and amortization
For the Year Ended December 31
2017 2016
Property, plant and equipment $ 240,562 $ 267,257
Intangible assets 25,723 19,471
Other non-current assets 12 10,417
$ 266,297 $ 297,145
An analysis of depreciation by function
Operating costs $ 146,445 $ 175,880
Operating expenses 94,117 91,377
$ 240,562 $ 267,257
An analysis of amortization by function
Operating expenses $ 25,735 $ 29,888

- 37 -
b. Employee benefits expense
For the Year Ended December 31
2017 2016
Retirement benefit plans (Note 13)
Defined contribution plan $ 37,946 $ 39,977
Defined benefit plan 1,653 24,238
39,599 64,215
Share-based payments
Equity-settled 20,257 -
Other employee benefits 1,019,507 1,082,205
Total employee benefits expense $ 1,079,363 $ 1,146,420
An analysis of employee benefits expense by function
Operating costs $ 163,031 $ 276,799
Operating expenses 916,332 869,621
$ 1,079,363 $ 1,146,420
c. Employees’ compensation and remuneration of directors
The Company accrued employees’ compensation and remuneration of directors at the rates of no less
than 1% and no higher than 10% and no higher than 1%, respectively, of net profit before income tax,
employees’ compensation and remuneration of directors. The employees’ compensation and
remuneration of directors for the years ended December 31, 2017 and 2016, which have been approved
by the Company’s board of directors on March 27, 2018 and March 22, 2017, respectively, were as
follows:
For the Year Ended December 31
2017 2016
Employees’ compensation $ 23,000 $ 20,000
Remuneration of directors $ 13,000 $ 8,600
If there is a change in the amounts after the annual financial statements are authorized for issue, the
differences are recorded as a change in the accounting estimate in the following year.
There was no difference between the actual amounts of employees’ compensation and remuneration of
directors paid and the amounts recognized in the financial statements for the years ended December 31,
2016 and 2015.
Information on the appropriation of earnings proposed and employees’ compensation and remuneration
of directors resolved by the Company’s board of directors in 2018 and 2017 and the appropriation of
earnings and the employees’ compensation and remuneration of directors resolved in the shareholders’
meetings in 2018 and 2017 is available at the Market Observation Post System website of the Taiwan
Stock Exchange.
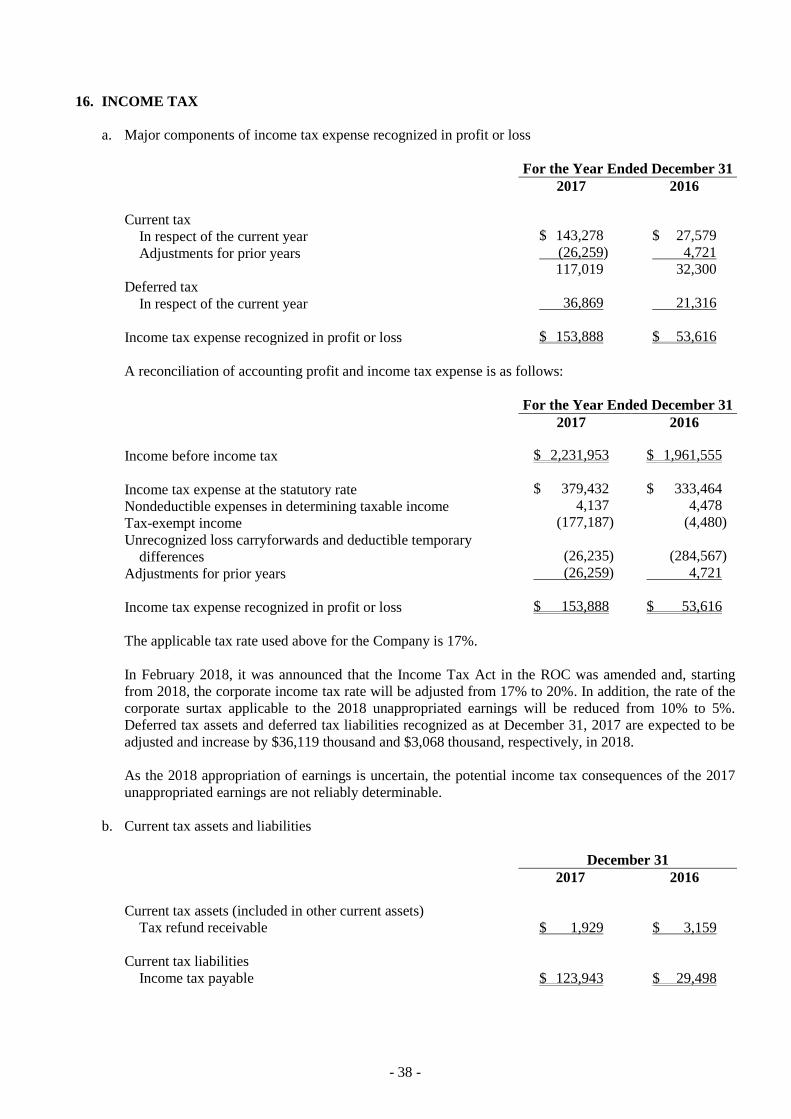
- 38 -
16. INCOME TAX
a. Major components of income tax expense recognized in profit or loss
For the Year Ended December 31
2017 2016
Current tax
In respect of the current year $ 143,278 $ 27,579
Adjustments for prior years (26,259) 4,721
117,019 32,300
Deferred tax
In respect of the current year 36,869 21,316
Income tax expense recognized in profit or loss $ 153,888 $ 53,616
A reconciliation of accounting profit and income tax expense is as follows:
For the Year Ended December 31
2017 2016
Income before income tax $ 2,231,953 $ 1,961,555
Income tax expense at the statutory rate $ 379,432 $ 333,464
Nondeductible expenses in determining taxable income 4,137 4,478
Tax-exempt income (177,187) (4,480)
Unrecognized loss carryforwards and deductible temporary
differences
(26,235) (284,567)
Adjustments for prior years (26,259) 4,721
Income tax expense recognized in profit or loss $ 153,888 $ 53,616
The applicable tax rate used above for the Company is 17%.
In February 2018, it was announced that the Income Tax Act in the ROC was amended and, starting
from 2018, the corporate income tax rate will be adjusted from 17% to 20%. In addition, the rate of the
corporate surtax applicable to the 2018 unappropriated earnings will be reduced from 10% to 5%.
Deferred tax assets and deferred tax liabilities recognized as at December 31, 2017 are expected to be
adjusted and increase by $36,119 thousand and $3,068 thousand, respectively, in 2018.
As the 2018 appropriation of earnings is uncertain, the potential income tax consequences of the 2017
unappropriated earnings are not reliably determinable.
b. Current tax assets and liabilities
December 31
2017 2016
Current tax assets (included in other current assets)
Tax refund receivable $ 1,929 $ 3,159
Current tax liabilities
Income tax payable $ 123,943 $ 29,498

- 39 -
c. Deferred income tax assets and liabilities
The movements of deferred income tax assets and deferred income tax liabilities (included in other
non-current liabilities) were as follows:
For the year ended December 31, 2017
Opening
Balance
Recognized in
Profit or Loss
Recognized in
Comprehensive
Income
Closing
Balance
Deferred income tax assets
Temporary differences
Inventories $ 183,551 $ (56,865) $ - $ 126,686
Property, plant and
equipment 9,988 16,576 - 26,564
Deferred revenue 4,247 23,459 - 27,706
Defined benefit plans 10,248 - 1,165 11,413
Others 13,333 (1,026) - 12,307
221,367 (17,856) 1,165 204,676
Loss carryforwards 6,407 (6,407) - -
$ 227,774 $ (24,263) $ 1,165 $ 204,676
Deferred income tax liabilities
Temporary differences
Other $ 4,783 $ 12,606 $ - $ 17,389
For the year ended December 31, 2016
Opening
Balance
Recognized in
Profit or Loss
Recognized in
Other
Comprehensive
Income
Closing
Balance
Deferred income tax assets
Temporary differences
Inventories $ 189,323 $ (5,772) $ - $ 183,551
Property, plant and
equipment 10,890 (902) - 9,988
Defined benefit plans 8,895 - 1,353 10,248
Others 19,105 (1,525) - 17,580
228,213 (8,199) 1,353 221,367
Loss carryforwards 14,741 (8,334) - 6,407
$ 242,954 $ (16,533) $ 1,353 $ 227,774
Deferred income tax liabilities
Temporary differences
Other $ - $ 4,783 $ - $ 4,783

- 40 -
d. Aggregate temporary differences associated with investments for which deferred income tax liabilities
have not been recognized
As of December 31, 2017 and 2016, the taxable temporary differences associated with investments in
subsidiaries for which no deferred income tax liabilities have been recognized were $6,466,056
thousand and $6,161,086 thousand, respectively.
e. Integrated income tax information
December 31
2017 2016
Unappropriated earnings
Generated on and after January 1, 1998 $ 4,246,203 $ 4,301,134
(Note)
Shareholder-imputed credit amounts (“ICA”) $ 247,457 $ 447,942
(Note)
For the Year Ended December 31
2017 2016
Creditable ratio for distribution of earnings (Note) 11.05%
Note: Since the amended Income Tax Act announced in February 2018 abolished the imputation tax
system, no creditable ratio for the distribution of earnings in 2018 is expected.
f. Income tax assessments
The income tax returns of the Company through 2015 have been assessed by the tax authorities.
17. EARNINGS PER SHARE
Unit: NT$ Per Share
For the Year Ended December 31
2017 2016
Basic earnings per share $ 1.85 $ 1.69
Diluted earnings per share $ 1.85 $ 1.69

- 41 -
The earnings and weighted average number of ordinary shares outstanding in the computation of earnings
per share were as follows:
For the Year Ended December 31
2017 2016
Net income for the year $ 2,078,065 $ 1,907,939
Number of shares (in thousands)
Weighted average number of ordinary shares in computation of basic
earnings per share 1,121,916 1,130,865
Effect of potentially dilutive ordinary shares:
Employees’ compensation 656 952
Employee share options 1,660 -
Weighted average number of ordinary shares used in the
computation of diluted earnings per share 1,124,232 1,131,817
If the Company offered to settle compensation or bonuses paid to employees in cash or shares, the
Company assumed the entire amount of the compensation or bonuses will be settled in shares, and the
resulting potential shares were included in the weighted average number of shares outstanding used in the
computation of diluted earnings per share, as the effect is dilutive. Such dilutive effect of the potential
shares is included in the computation of diluted earnings per share until the number of shares to be
distributed to employees is resolved in the following year.
Since the exercise price of employee share options issued by the Company exceeded the average market
price of the shares during 2016, they were anti-dilutive and excluded from the computation of diluted
earnings per share.
18. SHARE-BASED PAYMENT ARRANGEMENTS
Qualified employees of the Company and its subsidiaries were granted 4,500 options in July 2010. Each
option entitles the holder to subscribe for one thousand ordinary shares of the Company. The options
granted are valid for 6 years, expired in July 2016, and were exercisable at certain percentages after the
second or third anniversary from the grant date. The options were granted at an exercise price equal to
70% of the closing price of the Company’s ordinary shares listed the day before the grant date. For any
subsequent changes in the Company’s capital surplus, such as share issuances for cash, retained earnings
transferred to capital and capital surplus transferred to capital, the exercise price is adjusted accordingly.
The board of directors resolved on March 22, 2017 to transfer 7,289 thousand treasury shares to qualified
employees of the Company and its subsidiaries. In compliance with the Corporation’s Article of
Incorporation, the transfer price is the average of the actual buy back price.
Information about treasury shares transfers to employees as of December 31, 2017 is as follows:
(In Thousand Shares)
Grant Date
Transferable
Units
Transferred
Units for the
Year
Accumulated
Transferred
Units
Expired
Units
Transfer
Price (NT$)
March 22, 2017 7,289 2,896 2,896 238 $18.02

- 42 -
Information on employee share options as of December 31, 2016 is as follows:
(In Thousand Shares)
Grant Date
Exercisable
Units
Exercised
Units for the
Year
Accumulated
Exercised
Units
Expired
Units
Exercise
Price (NT$)
July 2010 4,500 - 193 4,307 $23.6
Treasury shares transferred to employees in 2017 were priced using the Black-Scholes pricing model, while
options granted in 2010 were priced using the binomial option pricing model. Compensation costs
recognized were $20,257 thousand for the year ended December 31, 2017. The inputs to the models were
as follows:
March 2017 July 2010
Expected volatility 30.53-40.29% 47.89%
Expected life (in years) 0-2 6
Expected dividend yield 2.34% 52.67%
Risk-free interest rate 0.63-1.08% 1.03%
19. NON-CASH TRANSACTIONS
The Company entered into the following non-cash investing activities which were not reflected in the
statements of cash flows:
For the Year Ended December 31
2017 2016
Acquisitions of property, plant and equipment
Increase in property, plant and equipment $ 174,034 $ 137,043
Increase in payables for construction and equipment (included in
other payables) (42,736) (2,016)
Net cash used $ 131,298 $ 135,027
20. CAPITAL MANAGEMENT
The Company manages its capital to ensure that the Company will be able to continue as a going concern
while maximizing the return to shareholders through the optimization of the debt and equity balance. The
Company’s overall strategy remains unchanged in the future.
The Company’s risk management committee reviews the capital structure on an annual basis. As part of
this review, the committee considers the cost of capital and the risks associated with each class of capital.
Based on the committee’s recommendations, the Company expects to balance its capital structure through
the payment of dividends, the issuance of new shares and private ordinary shares or the payment of old
debt.

- 43 -
21. FINANCIAL INSTRUMENTS
a. Fair value of financial instruments not measured at fair value
The financial statements include unlisted shares measured by cost. Since the range of fair values of
these equity investments estimated by valuation techniques varied significantly, management believed
that the unlisted equity investments held by the Company had fair values which could not be reliably
measured. Therefore, they were measured at cost at the end of the reporting period.
b. Fair value of financial instruments measured at fair value on a recurring basis
Fair value hierarchy
December 31, 2017
Level 1 Level 2 Level 3 Total
Available-for-sale financial assets
Domestic listed shares $ 1,077,878 $ - $ - $ 1,077,878
December 31, 2016
Level 1 Level 2 Level 3 Total
Available-for-sale financial assets
Domestic listed shares $ 700,166 $ - $ - $ 700,166
There were no transfers between Levels 1 and 2 in the current and prior periods.
c. Categories of financial instruments
December 31
2017 2016
Financial assets
Loans and receivables (Note 1) $ 5,187,075 $ 4,754,080
Available-for-sale financial assets (Note 2) 1,077,878 722,471
Financial liabilities
Financial liabilities measured at amortized cost (Note 3) 6,733,137 5,528,566
Note 1: The balances included loans and receivables measured at amortized cost, which comprise cash
and cash equivalents, accounts receivable (related parties included) and other receivables from
related parties.
Note 2: The balances included the carrying amount of available-for-sale financial assets measured at
cost.
Note 3: The balances included financial liabilities measured at amortized cost, which comprise
short-term borrowings, notes and accounts payable (related parties included) and other
payables.

- 44 -
d. Financial risk management objectives and policies
The Company’s major financial instruments include equity and debt investments, trade receivables,
trade payables and borrowings. The Company’s Corporate Treasury function provides services to the
business and monitors and manages the financial risks relating to the operations of the Company
through internal risk reports which analyze exposures by degree and magnitude of risks. These risks
include market risk, credit risk and liquidity risk.
1) Market risk
The Company’s activities exposed it primarily to the financial risks of changes in foreign currency
exchange rates, interest rates and other market-related factors.
There have been no changes to the Company’s exposure to market risks or the manner in which
these risks were managed and measured.
a) Foreign currency risk
The Company had foreign-currency-denominated sales and purchases, which exposed the
Company to foreign currency risk.
The carrying amounts of the Company’s foreign-currency-denominated monetary assets and
monetary liabilities at the end of the reporting period are set out in Note 25.
Sensitivity analysis
The Company was mainly exposed to the U.S. dollar (USD).
The following details the Company’s sensitivity to a 1% increase and decrease in the New
Taiwan dollar (NTD) against the U.S. dollar (USD). The sensitivity analysis included only
outstanding foreign-currency-denominated monetary items and adjusts their translation at the
end of the reporting period for a 1% change in foreign currency rates. For a 1% strengthening
of the New Taiwan dollar (NTD) against the U.S. dollar (USD), net profit after tax for the years
ended December 31, 2017 and 2016 would increase by $8,786 thousand and $6,282 thousand,
respectively. For a 1% weakening of the New Taiwan dollar (NTD) against the U.S. dollar
(USD), there would be an equal and opposite impact on pre-tax profit and the balances would be
negative.
b) Interest rate risk
The carrying amount of the Company’s financial assets and financial liabilities with exposure to
interest rates at the end of the reporting period were as follows:
December 31
2017 2016
Cash flow interest rate risk
Financial assets $ 639,188 $ 424,382
Sensitivity analysis
The sensitivity analysis below was determined based on the Company’s exposure to interest
rates for non-derivative instruments at the end of the reporting period. For floating rate
liabilities, the analysis was prepared assuming the amount of the liabilities outstanding at the
end of the reporting period was outstanding for the whole year. A 50-basis point increase or
decrease was used when reporting interest rate risk internally to key management personnel and
represents management’s assessment of the reasonably possible change in interest rates.

- 45 -
If interest rates had been 50 basis points higher, the Company’s post-tax profit for the years
ended December 31, 2017 and 2016 would be $2,653 thousand and $1,761 thousand,
respectively, which would be attributable to the Company’s exposure to interest rates on its
financial assets. If interest rates had been 50 basis point lower, there would be an equal and
opposite impact on post-tax profit, and the balances would be negative.
c) Other price risk
The Company was exposed to equity price risk through its investments in listed equity
securities. Equity investments are held for strategic rather than trading purposes. The
Company does not actively trade these investments.
Sensitivity analysis
The sensitivity analysis was determined based on the exposure to equity price risk in listed
equity securities at the end of the reporting period. If equity prices had been 5% higher/lower,
the other comprehensive income (loss) for the years ended December 31, 2017 and 2016 would
have increased/decreased by $53,894 thousand and $35,008 thousand, respectively.
2) Credit risk
Credit risk refers to the risk that a counterparty will default on its contractual obligations resulting
in a financial loss to the Company. As of the end of the reporting period, the Company’s
maximum exposure to credit risk, which would cause a financial loss to the Company due to failure
of counterparties to discharge an obligation and financial guarantees provided by the Company,
could arise from:
a) The carrying amount of the respective recognized financial assets as stated in the balance sheets;
and
b) The amount of contingent liabilities in relation to financial guarantees issued by the Company.
The Company adopted a policy of only dealing with creditworthy counterparties and obtaining
sufficient collateral, where appropriate, as a means of mitigating the risk of financial loss from
defaults. The Company transacted with a large number of unrelated customers, and thus, no
concentration of credit risk was observed.
3) Liquidity risk
The Company manages liquidity risk by monitoring and maintaining a level of cash and cash
equivalents deemed adequate to finance the Company’s operations and mitigate the effects of
fluctuations in cash flows. In addition, management monitors the utilization of bank borrowings
and ensures compliance with loan covenants.
The Company relies on bank borrowings as a significant source of liquidity. As of December 31,
2017 and 2016, the Company had available unutilized short-term bank loans amounting to
$2,700,000 thousand and $2,648,500 thousand, respectively.
The following table details the Company’s remaining contractual maturity for its non-derivative
financial liabilities with agreed repayment periods. The table has been drawn up based on the
undiscounted cash flows of financial liabilities from the earliest date on which the Company can be
required to pay. The table includes both interest and principal cash flows. Specifically, bank
loans with a repayment on demand clause were included in the earliest time band regardless of the
probability of the banks choosing to exercise their rights.

- 46 -
December 31, 2017
On
Demand or
Less than
1 Month 1-3 Months
3 Months
to
1 Year 1-5 Years 5+ Years
Non-derivative financial
liabilities
Fixed interest rate
liabilities $ 229,097 $ - $ - $ - $ -
22. TRANSACTIONS WITH RELATED PARTIES
Besides information disclosed elsewhere in other notes, details of transactions between the Company and
other related parties are disclosed below.
a. Names and categories of related parties
Name Related-party Categories
SiPix Technology, Inc. Subsidiary
New Field e-Paper Co., Ltd. Subsidiary
YuanHan Materials Inc. Subsidiary
Linfiny Corporation Subsidiary
Rich Optronics (Yangzhou) Co., Ltd. Subsidiary
Transyork Technology Yangzhou Ltd. Subsidiary
Transcend Optronics (Yangzhou) Co., Ltd. Subsidiary
Transmart Electronics (Yangzhou) Ltd. Subsidiary
PVI International Corp. Subsidiary
PVI Global Corp. Subsidiary
Prime View Communications Ltd. Subsidiary
Hydis Taiwan Inc. Subsidiary
Hot Tracks International Ltd. Subsidiary
E Ink Corporation Subsidiary
E Ink California, LLC Subsidiary
E Ink Japan Inc. Subsidiary
Dream Pacific International Corp. Subsidiary
Tech Smart Logistics Ltd. Subsidiary
NTX Electronics Yangzhou Co., Ltd. Associate
Yuen Foong Yu Biotech Co., Ltd. Associate
YFY Inc. Investor with significant influence over the
Company
YFY Jupiter Ltd. Subsidiary of investor with significant
influence over the Company
LiVEBRiCKS Inc. Subsidiary of investor with significant
influence over the Company
YFY Holding Management Co., Ltd. Subsidiary of investor with significant
influence over the Company
Eihoyo Shoji Co., Ltd. Subsidiary of investor with significant
influence over the Company
(Continued)

- 47 -
Name Related-party Categories
Yuen Foong Yu Consumer Products Co., Ltd. Subsidiary of investor with significant
influence over the Company
YFY Packaging Inc. Subsidiary of investor with significant
influence over the Company
Yuen Foong Shop Co., Ltd. Subsidiary of investor with significant
influence over the Company
Chung Hwa Pulp Corporation Subsidiary of investor with significant
influence over the Company
China Color Printing Co., Ltd. Subsidiary of investor with significant
influence over the Company
Johnson Lee Key management personnel
TGKW Management Limited Substantive related party
Hsin Yi Enterprise Co., Ltd. Substantive related party
Shen's Art Print Co., Ltd. Substantive related party
Yuen Foong Paper Co., Ltd. Substantive related party
SinoPac Securities Corp. Substantive related party
(Concluded)
b. Sales of goods
For the Year Ended December 31
Related Party Categories/Names 2017 2016
Subsidiaries Prime View Communications Ltd. $ 4,962,180 $ 5,939,451
PVI International Corp. 2,929,151 1,748,720
SiPix Technology, Inc. 1,501,343 1,501,091
Others 75,748 128,670
9,468,422 9,317,932
Investor and its subsidiaries with significant influence over the
Company 526 77,360
Associates - 28
$ 9,468,948 $ 9,395,320
c. Purchases of goods
For the Year Ended December 31
Related Party Categories/Names 2017 2016
Subsidiaries E Ink Corporation $ 3,812,117 $ 2,731,897
Transyork Technology Yangzhou Ltd. 1,626,121 1,245,443
Others 99,129 635,283
5,537,367 4,612,623
Associates 427,035 304,201
Investor and its subsidiaries with significant influence over the
Company 24 12,322
Substantive related parties 16 -
$ 5,964,442 $ 4,929,146

- 48 -
d. Receivables from related parties
December 31
Line Items Related Party Categories/Names 2017 2016
Trade receivables Subsidiaries
Transyork Technology Yangzhou Ltd. $ 2,275,283 $ 1,801,677
Prime View Communications Ltd. 891,061 993,244
Others 865,629 474,450
4,031,973 3,269,371
Associates 229,618 26,919
Investor and its subsidiaries with significant
influence over the Company 522 10,069
$ 4,262,113 $ 3,306,359
Other receivables Subsidiaries
E Ink Corporation $ 17,980 $ 81,200
Linfiny Corporation 10,679 -
Others 310 663
28,969 81,863
Investor and its subsidiaries with significant
influence over the Company 557 670
$ 29,526 $ 82,533
The outstanding receivables from related parties were unsecured. For the years ended December 31,
2017 and 2016, no impairment loss was recognized for receivables from related parties.
e. Payables to related parties
December 31
Line Items Related Party Categories/Names 2017 2016
Trade payables Subsidiaries
Transyork Technology Yangzhou Ltd. $ 2,810,857 $ 2,231,558
Tech Smart Logistics Ltd. 731,646 907,279
E Ink Corporation 467,067 266,868
Transcend Optronics (Yangzhou) Co., Ltd. 23,904 644,379
Others 40,528 914
4,074,002 4,050,998
Investor and its subsidiaries with significant
influence over the Company
721 113
Associates 16 218
$ 4,074,739 $ 4,051,329
Other payables Subsidiaries $ 13,598 $ 13,602
Substantive related parties 905 249
Investor and its subsidiaries with significant
influence over the Company
382 41
$ 14,885 $ 13,892
The outstanding payables to related parties were unsecured.

- 49 -
f. Prepayments
December 31
Related Party Categories 2017 2016
Subsidiaries $ - $ 136
g. Unearned revenue
December 31
Related Party Categories/Names 2017 2016
Subsidiaries
Transyork Technology Yangzhou Ltd. $ 162,977 $ 24,979
Others 2 1
$ 162,979 $ 24,980
h. Guarantee deposits received (included in other non-current liabilities)
December 31
Related Party Categories 2017 2016
Key management personnel $ 1,050 $ -
i. Royalty income
For the Year Ended December 31
Related Party Categories/Names 2017 2016
Subsidiaries
Transmart Electronics (Yangzhou) Ltd. $ - $ 12,798
j. Manufacturing overhead (included in operating costs)
For the Year Ended December 31
Related Party Categories 2017 2016
Subsidiaries $ 282,104 $ 427,596
k. Endorsements and guarantees given by related parties
December 31
Related Party Categories/Names 2017 2016
Subsidiaries
E Ink Corporation $ 1,279,680 $ 774,000
PVI Global Corp. 59,520 129,000
Dream Pacific International Corp. 59,520 129,000
$ 1,398,720 $ 1,032,000

- 50 -
l. Compensation of key management personnel
For the Year Ended December 31
2017 2016
Short-term employee benefits $ 109,495 $ 97,487
Post-employment benefits 1,188 1,221
Share-based payments 7,007 -
$ 117,690 $ 98,708
The remuneration of directors and key executives was determined by the remuneration committee based
on the performance of individuals and market trends.
23. ASSETS PLEDGED AS COLLATERAL
Assets amounting to $36,679 thousand and $33,528 thousand (included in other current assets) as of
December 31, 2017 and 2016, respectively, were provided as tenancy deposits for renting plants and land
and as guarantees of tariffs of imported goods.
24. SIGNIFICANT CONTINGENT LIABILITIES AND UNRECOGNIZED COMMITMENTS
Loan note guarantees issued due to long-term and short-term borrowings and transaction lines of credit of
derivative instruments were $3,530,000 thousand and $3,610,000 thousand as of December 31, 2017 and
2016, respectively.
The Company expected to file patent infringement actions against infringers for the purpose of
safeguarding the intellectual property rights of its patented technology. As of December 31, 2017, since
the infringers have filed patent infringement action against the Company, the Company will continue to
take an active defense to safeguard its rights and interests.
25. SIGNIFICANT ASSETS AND LIABILITIES DENOMINATED IN FOREIGN CURRENCIES
The following information was aggregated by the foreign currencies other than the Company’s functional
currency, and the exchange rates between such foreign currencies and the Company’s functional currency
are disclosed. The significant assets and liabilities denominated in foreign currencies are as follows:
December 31, 2017
Foreign
Currencies
(In Thousands) Exchange Rate
Carrying
Amount
Financial assets
Monetary items
USD $ 167,595 29.76 (USD:NTD) $ 4,987,627
Non-monetary items
Investments accounted for using equity
method
USD 365,217 29.76 (USD:NTD) $ 10,868,872
(Continued)

- 51 -
Foreign
Currencies
(In Thousands) Exchange Rate
Carrying
Amount
Financial liabilities
Monetary items
USD $ 203,164 29.76 (USD:NTD) $ 6,046,161
(Concluded)
December 31, 2016
Foreign
Currencies
(In Thousands) Exchange Rate
Carrying
Amount
Financial assets
Monetary items
USD $ 132,160 32.25 (USD:NTD) $ 4,262,166
Non-monetary items
Investments accounted for using equity
method
USD 331,337 32.25 (USD:NTD) $ 10,685,614
Financial liabilities
Monetary items
USD 155,629 32.25 (USD:NTD) $ 5,019,034
For the years ended December 31, 2017 and 2016, net foreign exchange losses (realized and unrealized)
were $28,301 thousand and $15,644 thousand, respectively. It is impractical to disclose net foreign
exchange gains (losses) by each significant foreign currency due to the variety of the foreign currency
transactions.
26. SEPARATELY DISCLOSED ITEMS
a. Information about significant transactions and investees
1) Financing provided to others (Table 1)
2) Endorsements/guarantees provided (Table 2)
3) Marketable securities held (excluding investment in subsidiaries) (Table 3)
4) Marketable securities acquired and disposed of at costs or prices of at least NT$300 million or 20%
of the paid-in capital (Table 4)
5) Acquisitions of individual real estate at costs of at least NT$300 million or 20% of the paid-in
capital (None)
6) Disposals of individual real estate at prices of at least NT$300 million or 20% of the paid-in capital
(None)

- 52 -
7) Total purchases from or sales to related parties amounting to at least NT$100 million or 20% of the
paid-in capital (Table 5)
8) Receivables from related parties amounting to at least NT$100 million or 20% of the paid-in capital
(Table 6)
9) Trading in derivative instruments (None)
10) Information on investees (Table 7)
b. Information on investments in mainland China (Table 8)
1) Information on any investee company in mainland China, showing the name, principal business
activities, paid-in capital, method of investment, inward and outward remittance of funds,
ownership percentage, net income of investees, investment income or loss, carrying amount of the
investment at the end of the period, repatriations of investment income, and limit on the amount of
investment in the mainland China area
2) Any of the following significant transactions with investee companies in mainland China, either
directly or indirectly through a third party, and their prices, payment terms, and unrealized gains or
losses:
a) The amount and percentage of purchases and the balance and percentage of the related payables
at the end of the year
b) The amount and percentage of sales and the balance and percentage of the related receivables at
the end of the year
c) The amount of property transactions and the amount of the resultant gains or losses
d) The balance of negotiable instrument endorsements or guarantees or pledges of collateral at the
end of the year and the purposes
e) The highest period balance, the end of period balance, the interest rate range, and total current
period interest with respect to financing of funds
f) Other transactions that have a material effect on the profit or loss for the year or on the financial
position, such as the rendering or receipt of services
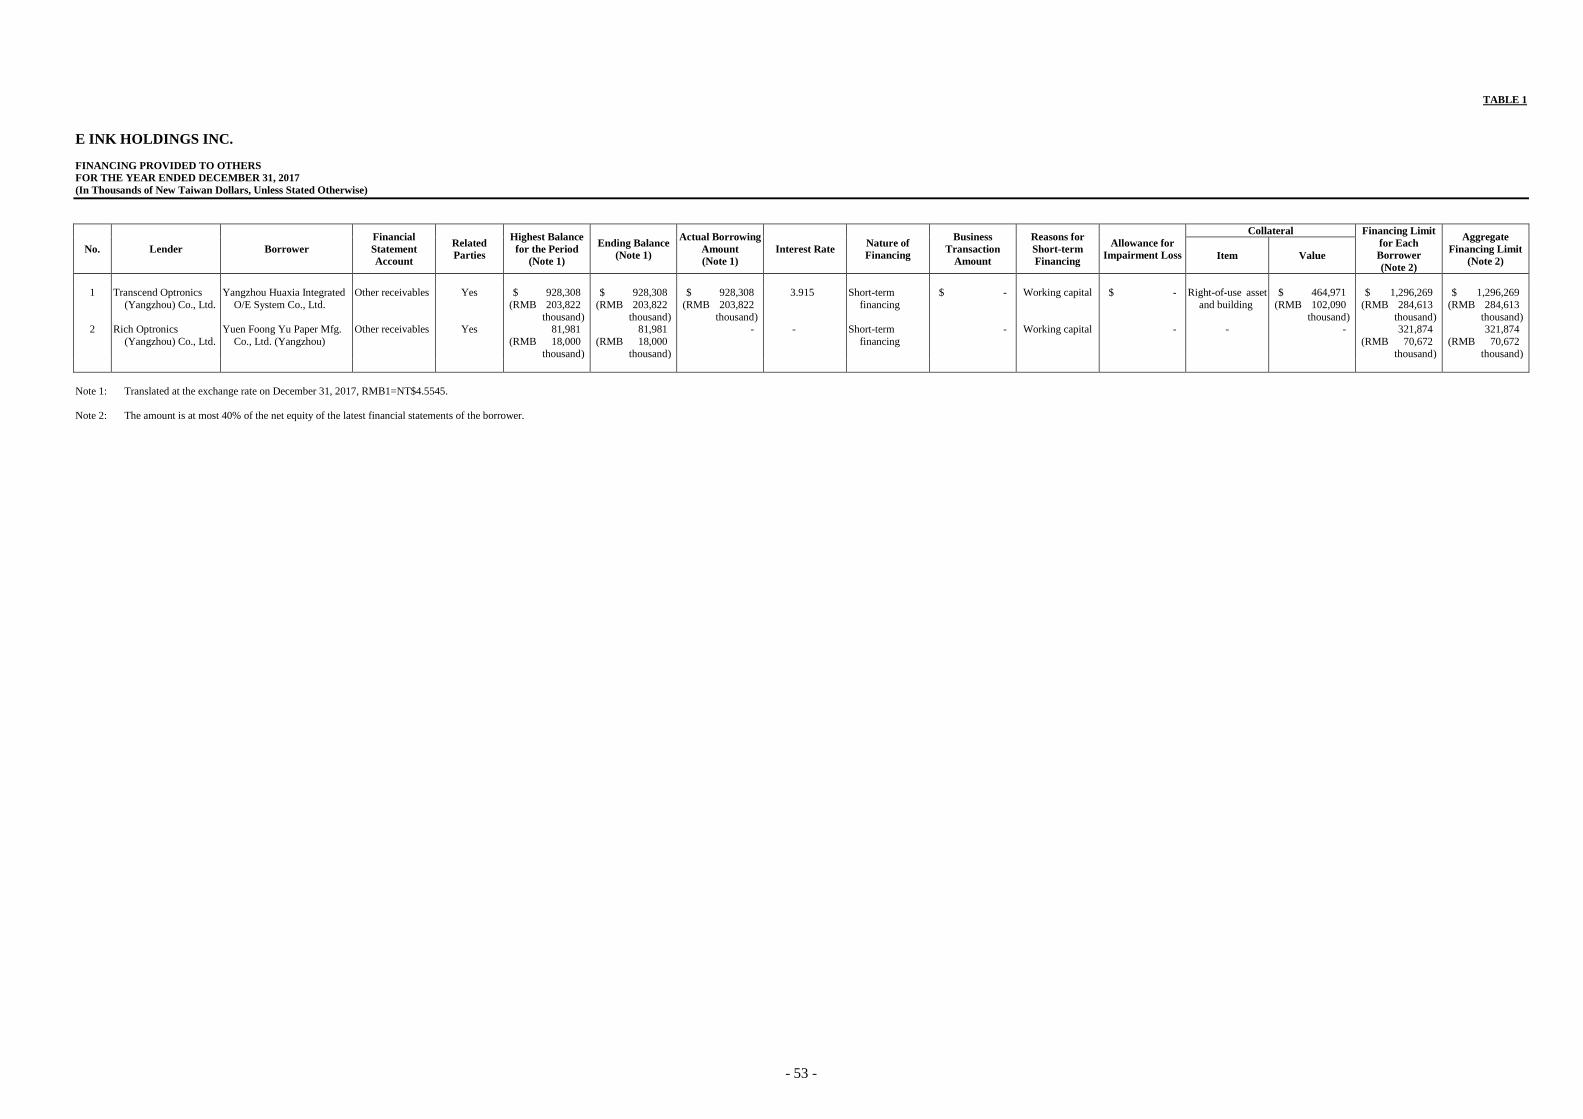
- 53 -
TABLE 1
E INK HOLDINGS INC.
FINANCING PROVIDED TO OTHERS
FOR THE YEAR ENDED DECEMBER 31, 2017
(In Thousands of New Taiwan Dollars, Unless Stated Otherwise)
No. Lender Borrower
Financial
Statement
Account
Related
Parties
Highest Balance
for the Period
(Note 1)
Ending Balance
(Note 1)
Actual Borrowing
Amount
(Note 1)
Interest Rate Nature of
Financing
Business
Transaction
Amount
Reasons for
Short-term
Financing
Allowance for
Impairment Loss
Collateral Financing Limit
for Each
Borrower
(Note 2)
Aggregate
Financing Limit
(Note 2) Item Value
1 Transcend Optronics
(Yangzhou) Co., Ltd.
Yangzhou Huaxia Integrated
O/E System Co., Ltd.
Other receivables Yes $ 928,308
(RMB 203,822
thousand )
$ 928,308
(RMB 203,822
thousand )
$ 928,308
(RMB 203,822
thousand )
3.915 Short-term
financing
$ - Working capital $ - Right-of-use asset
and building
$ 464,971
(RMB 102,090
thousand )
$ 1,296,269
(RMB 284,613
thousand )
$ 1,296,269
(RMB 284,613
thousand ) 2 Rich Optronics
(Yangzhou) Co., Ltd.
Yuen Foong Yu Paper Mfg.
Co., Ltd. (Yangzhou)
Other receivables Yes 81,981
(RMB 18,000
thousand )
81,981
(RMB 18,000
thousand )
- - Short-term
financing
- Working capital - - - 321,874
(RMB 70,672
thousand )
321,874
(RMB 70,672
thousand )
Note 1: Translated at the exchange rate on December 31, 2017, RMB1=NT$4.5545.
Note 2: The amount is at most 40% of the net equity of the latest financial statements of the borrower.

- 54 -
TABLE 2
E INK HOLDINGS INC.
ENDORSEMENTS/GUARANTEES PROVIDED
FOR THE YEAR ENDED DECEMBER 31, 2017
(In Thousands of New Taiwan Dollars, Unless Stated Otherwise)
No. Endorser/Guarantor
Endorsee/Guarantee
Limit on
Endorsement/
Guarantee Given
on Behalf of
Each Party
(Note 2)
Maximum
Amount
Endorsed/Guara
nteed During the
Period
(Note 3)
Outstanding
Endorsement/
Guarantee at the
End of the Period
(Note 3)
Actual
Borrowing
Amount
(Note 3)
Amount
Endorsed/
Guaranteed by
Collateral
Ratio of
Accumulated
Endorsement/
Guarantee to Net
Equity in Latest
Financial
Statements
(%)
Aggregate
Endorsement/
Guarantee Limit
(Note 4)
Endorsement/
Guarantee Given
by Parent on
Behalf of
Subsidiaries
Endorsement/
Guarantee Given
by Subsidiaries
on Behalf of
Parent
Endorsement/
Guarantee Given
on Behalf of
Companies in
Mainland China
Name Relationship
0 E Ink Holdings Inc. E Ink Corporation (Note 1) $ 6,733,125 $ 1,279,680
(US$ 43,000
thousand)
$ 1,279,680
(US$ 43,000
thousand)
$ 148,800
(RMB 5,000
thousand)
$ - 4.75 $ 26,932,498 Yes No No
Dream Pacific International Corp. (Note 1) 6,733,125 119,040
(US$ 4,000
thousand)
59,520
(US$ 2,000
thousand)
59,520
(RMB 2,000
thousand)
- 0.22 26,932,498 Yes No No
PVI Global Corp. (Note 1) 6,733,125 119,040
(US$ 4,000
thousand)
59,520
(US$ 2,000
thousand)
59,520
(RMB 2,000
thousand)
- 0.22 26,932,498 Yes No No
Note 1: Subsidiary.
Note 2: At most 25% of the Company’s net equity.
Note 3: At the exchange rate on December 31, 2017, US$1=NT$29.76.
Note 4: At most 100% of the Company’s net equity.

- 55 -
TABLE 3
E INK HOLDINGS INC.
MARKETABLE SECURITIES HELD
DECEMBER 31, 2017
(In Thousands of New Taiwan Dollars, Unless Stated Otherwise)
Holding Company Name Type and Name of Marketable Securities Relationship with the
Holding Company Financial Statement Account
December 31, 2017
Note Shares (In
Thousands)
Carrying
Amount
Percentage of
Ownership (%) Fair Value
E Ink Holdings Inc. Shares
SinoPac Financial Holding Company Limited Substantive related party Available-for-sale financial assets 88,678 $ 857,516 0.80 $ 857,516
YFY Inc. Investments accounted for
using the equity method
Available-for-sale financial assets 7,814 109,005 0.47 109,005
Ultra Chip, Inc. Corporate director Available-for-sale financial assets 2,863 111,357 4.51 111,357
Ignis Innovation Inc. - Financial assets measured at cost 388 - 0.22 -
New Medical Imaging (NMI) - Financial assets measured at cost 109 - 2.37 -
Yuen Yu Investment Co., Ltd. Shares
SinoPac Financial Holding Company Limited Substantive related party Available-for-sale financial assets 112,750 1,090,295 1.02 1,090,295
YFY Inc. Investments in parent
company accounted for
using the equity method
Available-for-sale financial assets 16 223 - 223
Netronix, Inc. Corporate director Available-for-sale financial assets 5,309 282,980 6.38 282,980
Fitipower Integrated Technology Inc. - Financial assets measured at cost 2,689 59,218 1.90 47,095
Formolight Technologies, Inc. - Financial assets measured at cost 2,228 27,801 10.93 18,950
Echem Solutions Corp. - Financial assets measured at cost 643 10,169 2.5 17,148
SiPix Technology, Inc. Shares
SinoPac Financial Holding Company Limited Substantive related party Available-for-sale financial assets 30,811 297,941 0.28 297,941
Transcend Optronics (Yangzhou) Co., Ltd. Shares
Wuxi Vision Peak Technology Corporation Limited - Financial assets measured at cost - RMB 37,500
thousand
10.00 RMB 50,149
thousand
Note: See Tables 7 and 8 for information on investments in subsidiaries and associates.

- 56 -
TABLE 4
E INK HOLDINGS INC.
MARKETABLE SECURITIES ACQUIRED AND DISPOSED OF AT COSTS OR PRICES OF AT LEAST NT$300 MILLION OR 20% OF THE PAID-IN CAPITAL
FOR THE YEAR ENDED DECEMBER 31, 2017
(In Thousands of New Taiwan Dollars, Unless Stated Otherwise)
Company Name Type and Name of
Marketable Securities
Financial Statement
Account Counterparty Relationship
Beginning Balance Acquisition Disposal Other
Adjustments
(Note 2)
Ending Balance
Shares (In
Thousands) Amount
Shares (In
Thousands) Amount
Shares (In
Thousands) Amount Carrying Amount Gain on Disposal
Shares (In
Thousands) Amount
Yuen Yu Investment Shares Co., Ltd. Linfiny Corporation Investments accounted for
using the equity method
Note 1 Subsidiary - $ - 32,340 $ 323,400 - $ - $ - $ - $ (116,866 ) 32,340 $ 206,534
Rich Optronics Principal guarantee note
(Yangzhou) Co., Ltd. Jubao cai fu wen ying
No.2
Debt investments with no
active market
- - - RMB 33,200
thousand
- RMB 257,800
thousand
- RMB 262,202
thousand
RMB 260,000
thousand
RMB 2,202
thousand (Note 3)
- - RMB 31,000
thousand
Note 1: Participant in capital increase of Linfiny Corporation.
Note 2: Including share of profit or loss of subsidiaries accounted for using the equity method and exchange differences on translating foreign operations.
Note 3: Included in interest income.

- 57 -
TABLE 5
E INK HOLDINGS INC.
TOTAL PURCHASES FROM OR SALES TO RELATED PARTIES AMOUNTING TO AT LEAST NT$100 MILLION OR 20% OF THE PAID-IN CAPITAL
FOR THE YEAR ENDED DECEMBER 31, 2017
(In Thousands of New Taiwan Dollars)
Buyer Related Party Relationship
Transaction Details Abnormal Transaction Notes/Accounts Receivable
(Payable)
Note Purchase/
Sale Amount
% of
Total Payment Terms Unit Price Payment Terms Ending Balance
% of
Total
(Note)
E Ink Holdings Inc. Prime View Communications Ltd. Subsidiary Sale $ (4,962,180) (36) Payment terms were based on
agreements
$ - - $ 891,061 21
PVI International Corp. Subsidiary Sale (2,929,151) (21) Payment terms were based on
agreements
- - 313,451 7
E Ink Corporation Subsidiary Purchase 3,812,117 33 Payment terms were based on
agreements
- - (467,067) (12)
SiPix Technology, Inc. Subsidiary Sale (1,501,343) (11) Payment terms were based on
agreements
- - 350,167 8
Transyork Technology Yangzhou Ltd. Subsidiary Purchase 1,626,121 14 Payment terms were based on
agreements
- - (2,810,857) (69)
NTX Electronics Yangzhou Co., Ltd. Associate Purchase 427,035 4 Payment terms were based on
agreements
- - - -
SiPix Technology, Inc. E Ink Holdings Inc. Parent company Purchase 1,501,343 86 Payment terms were based on
agreements
- - (350,167) (83)
E Ink Corporation Same ultimate parent
company
Purchase 184,584 11 Payment terms were based on
agreements
- - (70,242) (17)
Linfiny Corporation Linfiny Japan Inc. Subsidiary Purchase 148,583 59 Payment terms were based on
agreements
- - (148,583) (56)
Linfiny Japan Inc. Linfiny Corporation Parent company Sale (148,583) 100 Payment terms were based on
agreements
- - 148,583 100
Prime View Communications Ltd. E Ink Holdings Inc. Parent company Purchase 4,962,180 100 Payment terms were based on
agreements
- - (891,061) (100)
PVI International Corp. E Ink Holdings Inc. Parent company Purchase 2,929,151 100 Payment terms were based on
agreements
- - (313,451) (100)
Transyork Technology Yangzhou Ltd. E Ink Holdings Inc. Parent company Sale (1,626,121) (100) Payment terms were based on
agreements
- - 2,810,857 100
E Ink Corporation E Ink Holdings Inc. Parent company Sale (3,812,117) (93) Payment terms were based on
agreements
- - 467,067 80
SiPix Technology, Inc. Same ultimate parent
company
Sale (184,584) (5) Payment terms were based on
agreements
- - 70,242 12
E Ink California, LLC Subsidiary Purchase 371,984 29 Payment terms were based on
agreements
- - (272,588) (55)
E Ink California, LLC E Ink Corporation Parent company Sale (371,984) (100) Payment terms were based on
agreements
- - 272,588 100
Note: The proportion of the individual company’s total receivables (payables).
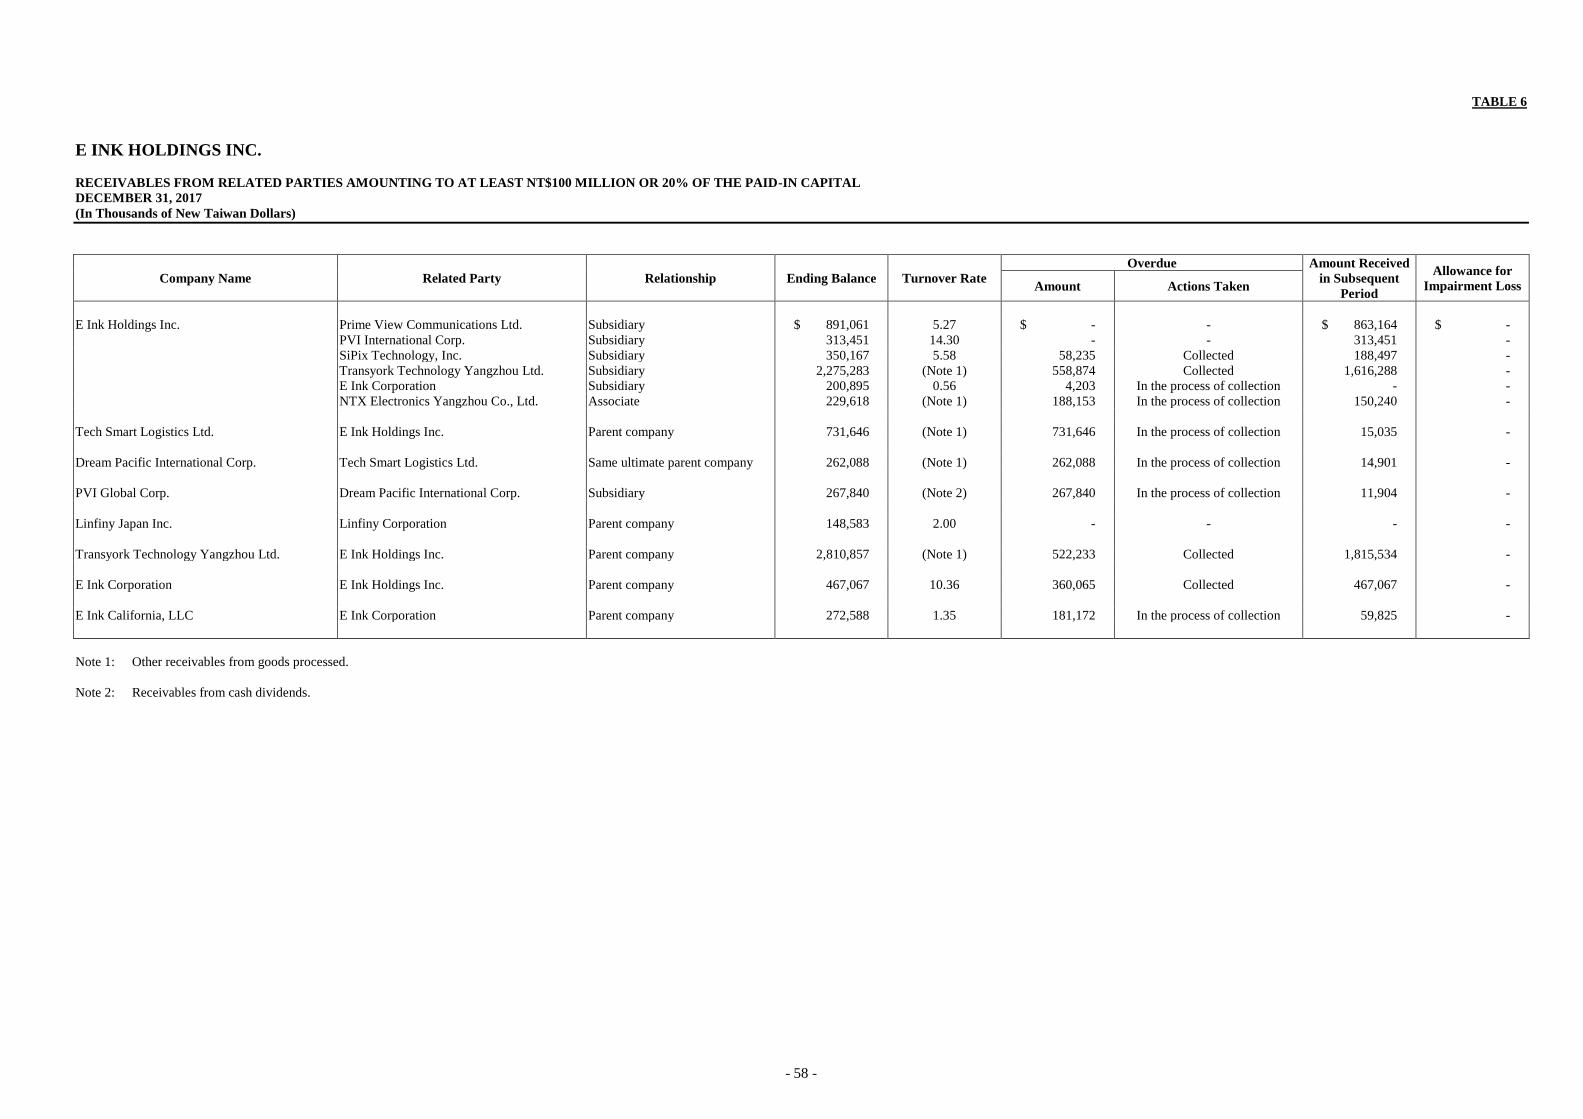
- 58 -
TABLE 6
E INK HOLDINGS INC.
RECEIVABLES FROM RELATED PARTIES AMOUNTING TO AT LEAST NT$100 MILLION OR 20% OF THE PAID-IN CAPITAL
DECEMBER 31, 2017
(In Thousands of New Taiwan Dollars)
Company Name Related Party Relationship Ending Balance Turnover Rate
Overdue Amount Received
in Subsequent
Period
Allowance for
Impairment Loss Amount Actions Taken
E Ink Holdings Inc. Prime View Communications Ltd. Subsidiary $ 891,061 5.27 $ - - $ 863,164 $ -
PVI International Corp. Subsidiary 313,451 14.30 - - 313,451 -
SiPix Technology, Inc. Subsidiary 350,167 5.58 58,235 Collected 188,497 -
Transyork Technology Yangzhou Ltd. Subsidiary 2,275,283 (Note 1) 558,874 Collected 1,616,288 -
E Ink Corporation Subsidiary 200,895 0.56 4,203 In the process of collection - -
NTX Electronics Yangzhou Co., Ltd. Associate 229,618 (Note 1) 188,153 In the process of collection 150,240 -
Tech Smart Logistics Ltd. E Ink Holdings Inc. Parent company 731,646 (Note 1) 731,646 In the process of collection 15,035 -
Dream Pacific International Corp. Tech Smart Logistics Ltd. Same ultimate parent company 262,088 (Note 1) 262,088 In the process of collection 14,901 -
PVI Global Corp. Dream Pacific International Corp. Subsidiary 267,840 (Note 2) 267,840 In the process of collection 11,904 -
Linfiny Japan Inc. Linfiny Corporation Parent company 148,583 2.00 - - - -
Transyork Technology Yangzhou Ltd. E Ink Holdings Inc. Parent company 2,810,857 (Note 1) 522,233 Collected 1,815,534 -
E Ink Corporation E Ink Holdings Inc. Parent company 467,067 10.36 360,065 Collected 467,067 -
E Ink California, LLC E Ink Corporation Parent company 272,588 1.35 181,172 In the process of collection 59,825 -
Note 1: Other receivables from goods processed.
Note 2: Receivables from cash dividends.
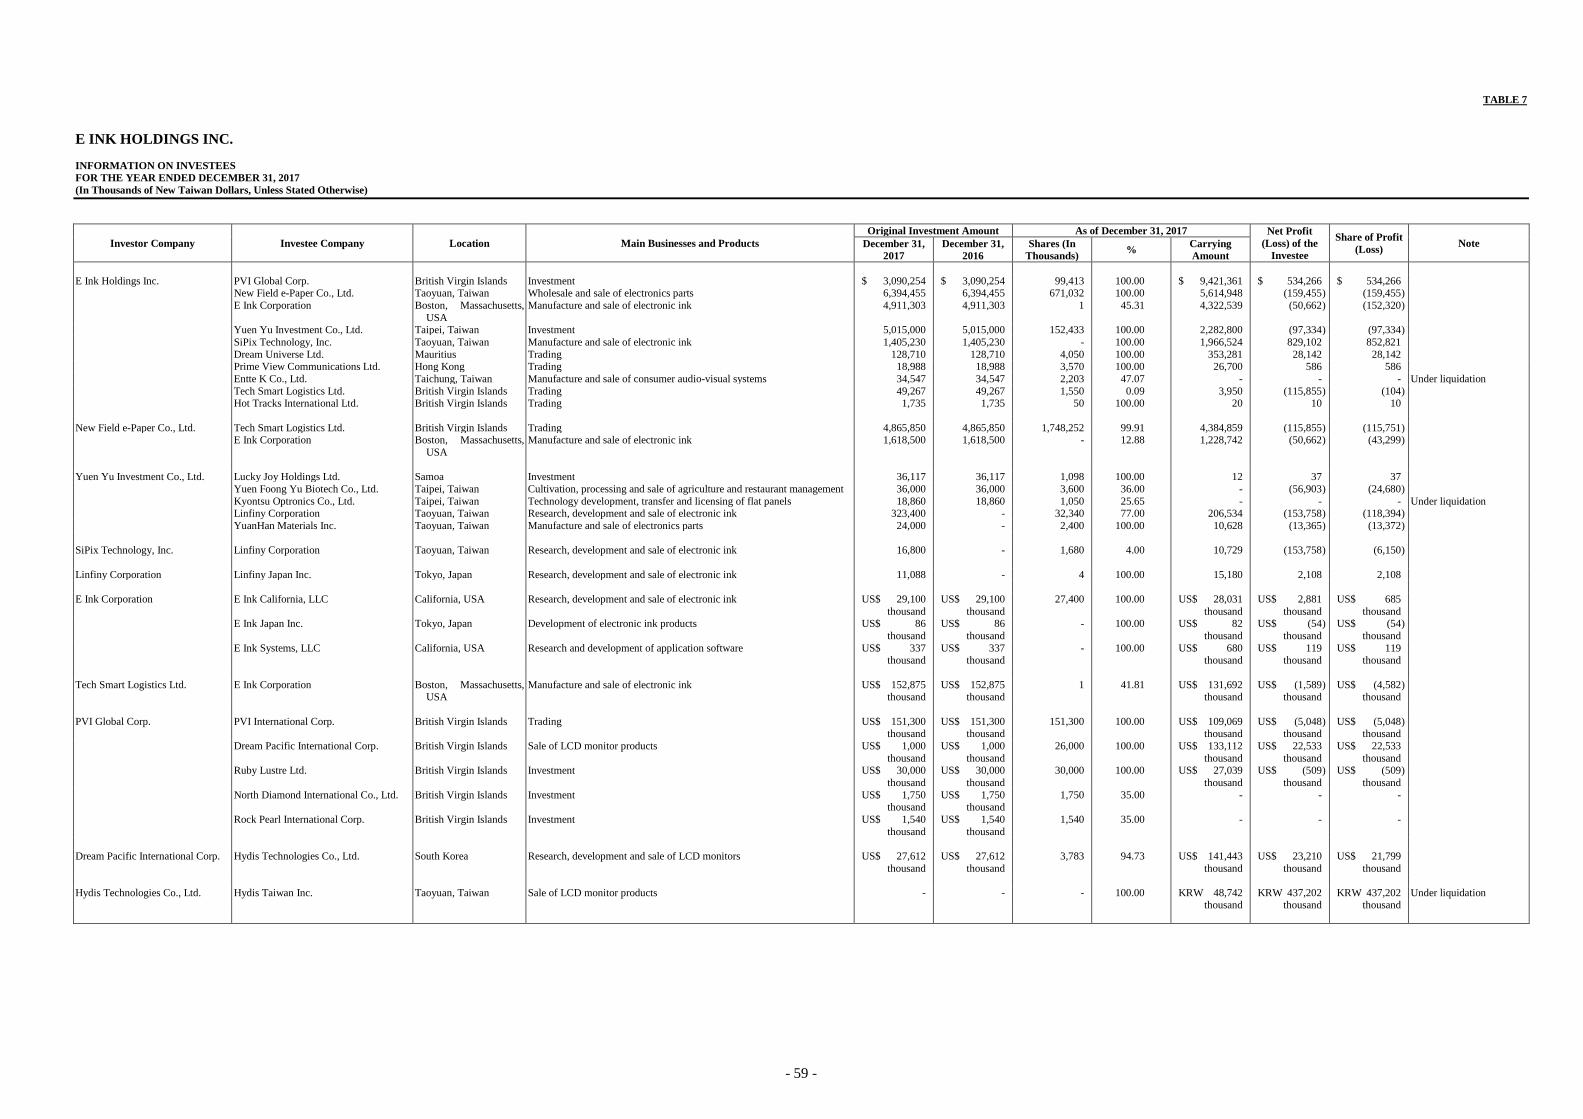
- 59 -
TABLE 7
E INK HOLDINGS INC.
INFORMATION ON INVESTEES
FOR THE YEAR ENDED DECEMBER 31, 2017
(In Thousands of New Taiwan Dollars, Unless Stated Otherwise)
Investor Company Investee Company Location Main Businesses and Products
Original Investment Amount As of December 31, 2017 Net Profit
(Loss) of the
Investee
Share of Profit
(Loss) Note December 31,
2017
December 31,
2016
Shares (In
Thousands) %
Carrying
Amount
E Ink Holdings Inc. PVI Global Corp. British Virgin Islands Investment $ 3,090,254 $ 3,090,254 99,413 100.00 $ 9,421,361 $ 534,266 $ 534,266 New Field e-Paper Co., Ltd. Taoyuan, Taiwan Wholesale and sale of electronics parts 6,394,455 6,394,455 671,032 100.00 5,614,948 (159,455 ) (159,455 )
E Ink Corporation Boston, Massachusetts,
USA
Manufacture and sale of electronic ink 4,911,303 4,911,303 1 45.31 4,322,539 (50,662 ) (152,320 )
Yuen Yu Investment Co., Ltd. Taipei, Taiwan Investment 5,015,000 5,015,000 152,433 100.00 2,282,800 (97,334 ) (97,334 )
SiPix Technology, Inc. Taoyuan, Taiwan Manufacture and sale of electronic ink 1,405,230 1,405,230 - 100.00 1,966,524 829,102 852,821
Dream Universe Ltd. Mauritius Trading 128,710 128,710 4,050 100.00 353,281 28,142 28,142 Prime View Communications Ltd. Hong Kong Trading 18,988 18,988 3,570 100.00 26,700 586 586
Entte K Co., Ltd. Taichung, Taiwan Manufacture and sale of consumer audio-visual systems 34,547 34,547 2,203 47.07 - - - Under liquidation
Tech Smart Logistics Ltd. British Virgin Islands Trading 49,267 49,267 1,550 0.09 3,950 (115,855 ) (104 ) Hot Tracks International Ltd. British Virgin Islands Trading 1,735 1,735 50 100.00 20 10 10
New Field e-Paper Co., Ltd. Tech Smart Logistics Ltd. British Virgin Islands Trading 4,865,850 4,865,850 1,748,252 99.91 4,384,859 (115,855 ) (115,751 ) E Ink Corporation Boston, Massachusetts,
USA
Manufacture and sale of electronic ink 1,618,500 1,618,500 - 12.88 1,228,742 (50,662 ) (43,299 )
Yuen Yu Investment Co., Ltd. Lucky Joy Holdings Ltd. Samoa Investment 36,117 36,117 1,098 100.00 12 37 37
Yuen Foong Yu Biotech Co., Ltd. Taipei, Taiwan Cultivation, processing and sale of agriculture and restaurant management 36,000 36,000 3,600 36.00 - (56,903 ) (24,680 )
Kyontsu Optronics Co., Ltd. Taipei, Taiwan Technology development, transfer and licensing of flat panels 18,860 18,860 1,050 25.65 - - - Under liquidation Linfiny Corporation Taoyuan, Taiwan Research, development and sale of electronic ink 323,400 - 32,340 77.00 206,534 (153,758 ) (118,394 )
YuanHan Materials Inc. Taoyuan, Taiwan Manufacture and sale of electronics parts 24,000 - 2,400 100.00 10,628 (13,365 ) (13,372 )
SiPix Technology, Inc. Linfiny Corporation Taoyuan, Taiwan Research, development and sale of electronic ink 16,800 - 1,680 4.00 10,729 (153,758 ) (6,150 )
Linfiny Corporation Linfiny Japan Inc. Tokyo, Japan Research, development and sale of electronic ink 11,088 - 4 100.00 15,180 2,108 2,108
E Ink Corporation E Ink California, LLC California, USA Research, development and sale of electronic ink US$ 29,100
thousand
US$ 29,100
thousand
27,400 100.00 US$ 28,031
thousand
US$ 2,881
thousand
US$ 685
thousand
E Ink Japan Inc. Tokyo, Japan Development of electronic ink products US$ 86
thousand
US$ 86
thousand
- 100.00 US$ 82
thousand
US$ (54 )
thousand
US$ (54 )
thousand
E Ink Systems, LLC California, USA Research and development of application software US$ 337 thousand
US$ 337 thousand
- 100.00 US$ 680 thousand
US$ 119 thousand
US$ 119 thousand
Tech Smart Logistics Ltd. E Ink Corporation Boston, Massachusetts, USA
Manufacture and sale of electronic ink US$ 152,875 thousand
US$ 152,875 thousand
1 41.81 US$ 131,692 thousand
US$ (1,589 ) thousand
US$ (4,582 ) thousand
PVI Global Corp. PVI International Corp. British Virgin Islands Trading US$ 151,300 thousand
US$ 151,300 thousand
151,300 100.00 US$ 109,069 thousand
US$ (5,048 ) thousand
US$ (5,048 ) thousand
Dream Pacific International Corp. British Virgin Islands Sale of LCD monitor products US$ 1,000
thousand
US$ 1,000
thousand
26,000 100.00 US$ 133,112
thousand
US$ 22,533
thousand
US$ 22,533
thousand
Ruby Lustre Ltd. British Virgin Islands Investment US$ 30,000
thousand
US$ 30,000
thousand
30,000 100.00 US$ 27,039
thousand
US$ (509 )
thousand
US$ (509 )
thousand
North Diamond International Co., Ltd. British Virgin Islands Investment US$ 1,750 thousand
US$ 1,750 thousand
1,750 35.00 - - -
Rock Pearl International Corp. British Virgin Islands Investment US$ 1,540
thousand
US$ 1,540
thousand
1,540 35.00 - - -
Dream Pacific International Corp. Hydis Technologies Co., Ltd. South Korea Research, development and sale of LCD monitors US$ 27,612
thousand
US$ 27,612
thousand
3,783 94.73 US$ 141,443
thousand
US$ 23,210
thousand
US$ 21,799
thousand
Hydis Technologies Co., Ltd. Hydis Taiwan Inc. Taoyuan, Taiwan Sale of LCD monitor products - - - 100.00 KRW 48,742 thousand
KRW 437,202 thousand
KRW 437,202 thousand
Under liquidation

- 60 -
TABLE 8
E INK HOLDINGS INC.
INFORMATION ON INVESTMENTS IN MAINLAND CHINA
FOR THE YEAR ENDED DECEMBER 31, 2017
(In Thousands of New Taiwan Dollars, Unless Stated Otherwise)
Investee Company Main Businesses and
Products
Paid-in Capital
(Note 1) Method of Investment
Accumulated
Outward
Remittance for
Investment
from Taiwan
as of
January 1, 2017
(Note 1)
Remittance of Funds Accumulated
Outward
Remittance for
Investment
from Taiwan as
of December 31,
2017
(Note 1)
Net Profit
(Loss) of the
Investee
(Note 2)
% Ownership
of Direct or
Indirect
Investment
Investment
Gain (Loss)
(Notes 2 and 3)
Carrying
Amount as of
December 31,
2017 (Note 1)
Accumulated
Repatriation of
Investment
Income as of
December 31,
2017
Outward Inward
Transcend Optronics
(Yangzhou) Co., Ltd.
Assembly of LCD flat
panels
$ 4,502,688
(US$ 151,300
thousand)
The Company indirectly owns the
investee through an investment
company registered in a third
region
$ 3,239,227
(US$ 108,845
thousand)
$ - $ - $ 3,239,227
(US$ 108,845
thousand)
$ (154,321)
(US$ (5,071)
thousand)
100.00 $ (154,321)
(US$ (5,071)
thousand)
$ 3,240,656
(US$ 108,893
thousand)
$ -
Rich Optronics (Yangzhou)
Co., Ltd.
Assembly of LCD flat
panels
892,800
(US$ 30,000
thousand)
The Company indirectly owns the
investee through an investment
company registered in a third
region
892,800
(US$ 30,000
thousand)
- - 892,800
(US$ 30,000
thousand)
(15,490)
(US$ (509)
thousand)
100.00 (15,490)
(US$ (509)
thousand)
804,681
(US$ 27,039
thousand)
-
Transyork Technology
Yangzhou Ltd.
Assembly of LCD flat
panels
2,140,667
(US$ 71,931
thousand)
The Company indirectly owns the
investee through an investment
company registered in a third
region
- - - - 38,131
(US$ 1,253
thousand)
100.00 38,131
(US$ 1,253
thousand)
1,753,906
(US$ 58,935
thousand)
-
Transyang Electronics
(Yangzhou) Ltd.
Assembly of LCD flat
panels
119,040
(US$ 4,000
thousand)
The Company indirectly owns the
investee through an investment
company registered in a third
region
119,040
(US$ 4,000
thousand)
- - 119,040
(US$ 4,000
thousand)
(9,921)
(US$ (326)
thousand)
100.00 (9,921)
(US$ (326)
thousand)
106,898
(US$ 3,592
thousand)
-
Transmart Electronics
(Yangzhou) Ltd.
Research, development
and sale of LCD
monitors
295,100
(US$ 9,916
thousand)
The Company indirectly owns the
investee through an investment
company registered in a third
region
196,714
(US$ 6,610
thousand)
- - 196,714
(US$ 6,610
thousand)
1,126
(US$ 37
thousand)
100.00 1,126
(US$ 37
thousand)
25,415
(US$ 854
thousand)
-
Yangzhou Huaxia Integrated
O/E System Co., Ltd.
Manufacture and sale of
LED products
553,536
(US$ 18,600
thousand)
The Company indirectly owns the
investee through an investment
company registered in a third
region
89,280
(US$ 3,000
thousand)
- - 89,280
(US$ 3,000
thousand)
(48,935)
(US$ (1,608)
thousand)
100.00 (45,401)
(US$ (1,492)
thousand)
(857,445)
(US$ (28,812)
thousand)
-
Ultraview Technology Ltd.
(under liquidation)
Assembly of automobile
LCD monitors
286,291
(US$ 9,620
thousand)
The Company indirectly owns the
investee through an investment
company registered in a third
region
32,676
(US$ 1,098
thousand)
- - 32,676
(US$ 1,098
thousand)
- (Note 4) - - -
Dihao Electronics
(Yangzhou) Co., Ltd.
Assembly of LCD
backlight board
display modules
148,800
(US$ 5,000
thousand)
The Company indirectly owns the
investee through an investment
company registered in a third
region
52,080
(US$ 1,750
thousand)
- - 52,080
(US$ 1,750
thousand)
- 35.00 - - -
(Continued)

- 61 -
Investee Company Main Businesses and
Products
Paid-in Capital
(Note 1) Method of Investment
Accumulated
Outward
Remittance for
Investment
from Taiwan
as of
January 1, 2017
(Note 1)
Remittance of Funds Accumulated
Outward
Remittance for
Investment
from Taiwan as
of December 31,
2017
(Note 1)
Net Profit
(Loss) of the
Investee
(Note 2)
% Ownership
of Direct or
Indirect
Investment
Investment
Gain (Loss)
(Notes 2 and 3)
Carrying
Amount as of
December 31,
2017 (Note 1)
Accumulated
Repatriation of
Investment
Income as of
December 31,
2017
Outward Inward
Hydis Shenzhen Ltd. (under
liquidation)
Sale of LCD monitor
products
$ 2,024
(US$ 68
thousand)
The Company indirectly owns the
investee through an investment
company registered in a third
region
$ - $ - $ - $ - $ 822
(KRW 30,294
thousand)
94.73 $ 779
(KRW 28,698
thousand)
$ (922)
(KRW (32,801)
thousand)
$ -
NTX Electronics Yangzhou
Co., Ltd.
Manufacture and sale of
flat panels
182,180
(RMB 40,000
thousand)
The Company indirectly owns the
investee through an investment
company registered in a third
region
- - - - 2,685
(RMB 596
thousand)
49.00 1,247
(RMB 292
thousand)
88,752
(RMB 19,487
thousand)
-
Accumulated Outward Remittance
for Investment in Mainland China
as of December 31, 2017
Investment Amount Authorized by
Investment Commission, MOEA
Upper Limit on the Amount of
Investment Stipulated by
Investment Commission, MOEA
$ 4,621,817
(US$ 155,303
thousand)
$ 8,035,527
(US$ 270,011
thousand)
$ 17,529,179
Note 1: The amounts are translated at the exchange rate on December 31, 2017, US$1=NT$29.76, RMB1=NT$4.5545, KRW1=NT$0.02812.
Note 2: The amounts are translated at the average exchange rate of the year ended December 31, 2017, US$1=NT$30.432, RMB1=NT$4.50531, KRW1=NT$0.02713.
Note 3: The carrying amount and related investment income of the equity investment were calculated based on audited financial statements of the corresponding year.
Note 4: The investee company was ruled bankrupt by the court in June 2014 and was assigned a bankruptcy manager. The Company eliminated its investment amount and reclassified it as financial assets measured at cost.
Note 5: Information on the prices, terms of payment and unrealized profit or loss of significant transactions of investee companies in mainland China are provided in Tables 1, 5 and 6.
(Concluded)
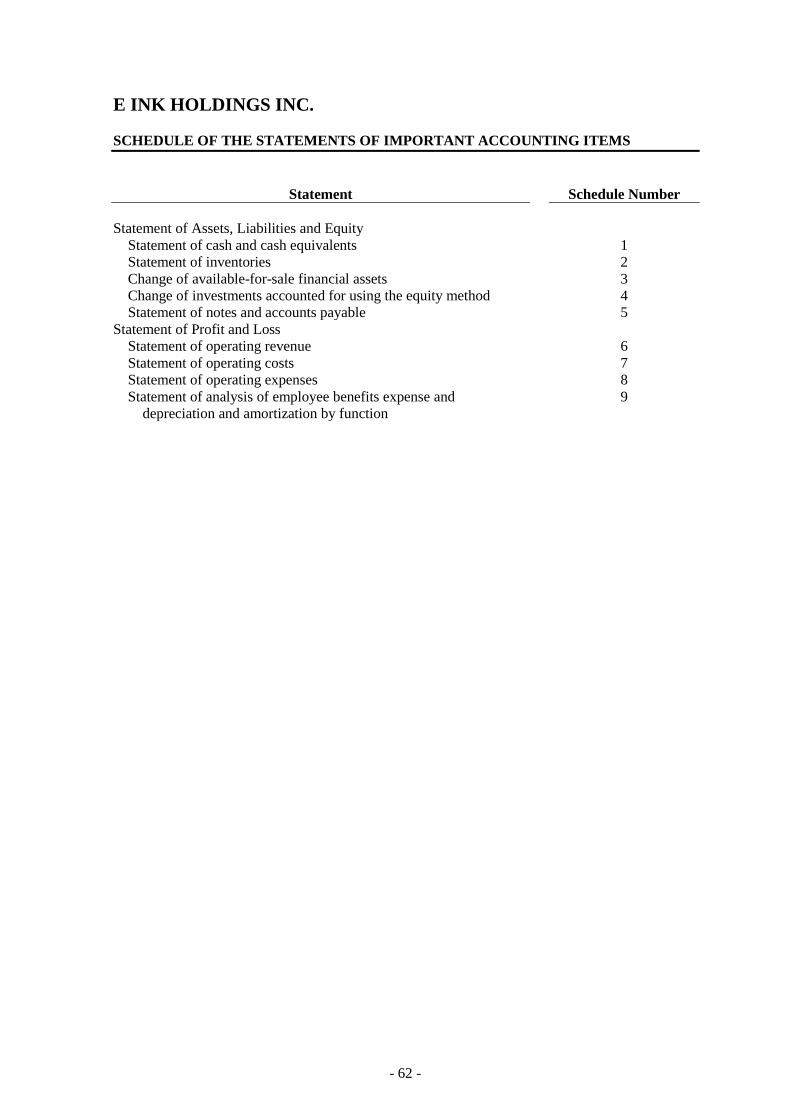
- 62 -
E INK HOLDINGS INC.
SCHEDULE OF THE STATEMENTS OF IMPORTANT ACCOUNTING ITEMS
Statement Schedule Number
Statement of Assets, Liabilities and Equity
Statement of cash and cash equivalents 1
Statement of inventories 2
Change of available-for-sale financial assets 3
Change of investments accounted for using the equity method 4
Statement of notes and accounts payable 5
Statement of Profit and Loss
Statement of operating revenue 6
Statement of operating costs 7
Statement of operating expenses 8
Statement of analysis of employee benefits expense and
depreciation and amortization by function
9

- 63 -
SCHEDULE 1
E INK HOLDINGS INC.
STATEMENT OF CASH AND CASH EQUIVALENTS
DECEMBER 31, 2017
(In Thousands of New Taiwan Dollars, Except Amounts Shown in the Notes)
Item Rate Amount
Cash on hand (Note) $ 171
Checking accounts and demand deposits (Note)
Checking accounts 156
Demand deposits 0.07%-0.65% 639,032
639,188
$ 639,359
Note: Including US$15,095 thousand and JPY58,090 thousand, translated at an exchange rate of
US$1=NT$29.76 and JPY1=NT$0.2642.
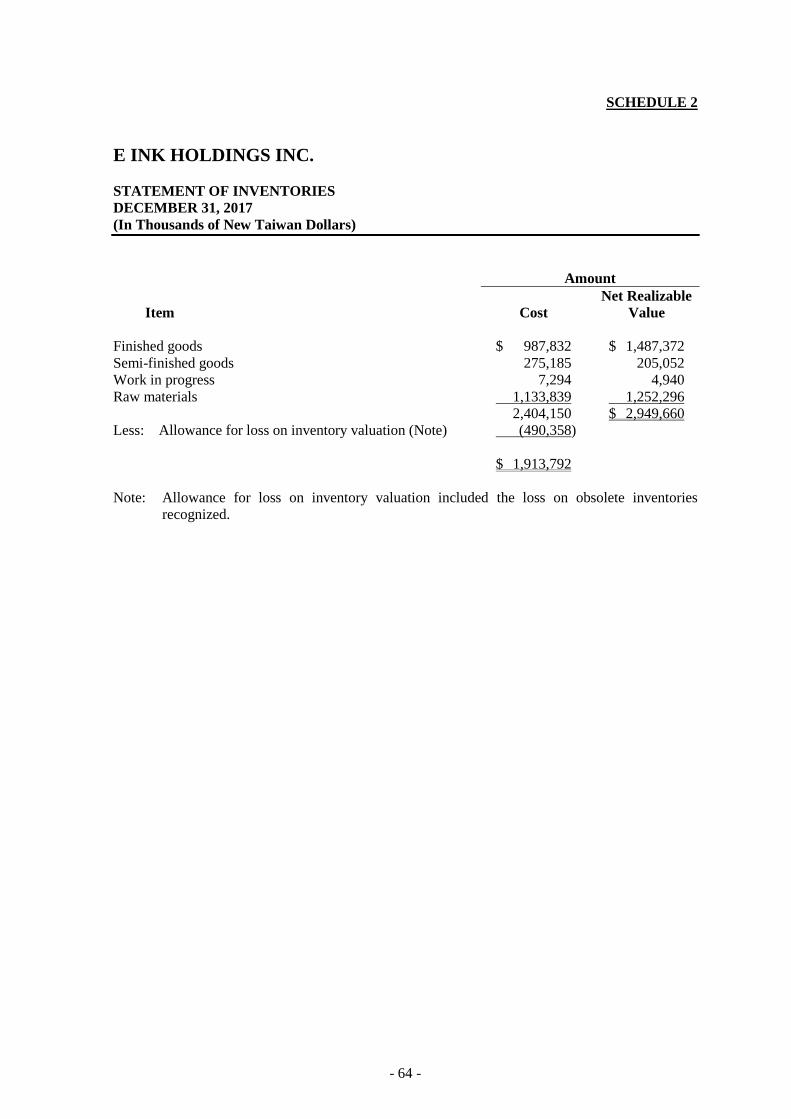
- 64 -
SCHEDULE 2
E INK HOLDINGS INC.
STATEMENT OF INVENTORIES
DECEMBER 31, 2017
(In Thousands of New Taiwan Dollars)
Amount
Item Cost
Net Realizable
Value
Finished goods $ 987,832 $ 1,487,372
Semi-finished goods 275,185 205,052
Work in progress 7,294 4,940
Raw materials 1,133,839 1,252,296
2,404,150 $ 2,949,660
Less: Allowance for loss on inventory valuation (Note) (490,358)
$ 1,913,792
Note: Allowance for loss on inventory valuation included the loss on obsolete inventories
recognized.

- 65 -
SCHEDULE 3
E INK HOLDINGS INC.
CHANGES OF AVAILABLE-FOR-SALE FINANCIAL ASSETS
FOR THE YEAR ENDED DECEMBER 31, 2017
(In Thousands of New Taiwan Dollars, Except Unit Price)
Fair Value on December 31, 2017 (Note)
January 1, 2017 Increase in 2017 Unrealized Percentage of
Type and Name of Marketable Securities Shares Amount Shares Amount Gain or Loss Shares Ownership (%) Unit Price Amount
Shares
SinoPac Financial Holding Company Limited 56,201 $ 510,306 32,477 $ 279,998 $ 67,212 88,678 0.80 $ 9.67 $ 857,516
YFY Inc. 7,814 75,640 - - 33,365 7,814 0.47 13.95 109,005
Ultra Chip, Inc. 2,863 114,220 - - (2,863) 2,863 4.51 38.90 111,357
$ 700,166 $ 279,998 $ 97,714 $ 1,077,878
Note: Closing price on December 31, 2017

- 66 -
SCHEDULE 4
E INK HOLDINGS INC.
CHANGES IN INVESTMENTS ACCOUNTED FOR USING THE EQUITY METHOD
FOR THE YEAR ENDED DECEMBER 31, 2017
(In Thousands of New Taiwan Dollars)
Balance, January 1, 2017 Decrease in 2017
Share of
Profit or Loss
of Investments
Accounted for
Using the
Unrealized
Loss on Share Equity Balance, December 31, 2017
Investee Company
Shares (In
Thousands) Amount
Shares (In
Thousands) Amount
Equity Method
(Note 1)
Transactions
with Associates
Adjustments
(Note 2)
Shares (In
Thousands)
Percentage of
Ownership (%) Amount
PVI Global Corp. 99,413 $ 9,137,356 - $ - $ 534,266 $ - $ (250,261) 99,413 100.00 $ 9,421,361
New Field e-Paper Co., Ltd. 671,032 6,164,669 - - (159,455) - (390,266) 671,032 100.00 5,614,948
E Ink Corporation 1 4,559,166 - - (152,320) - (84,307) 1 45.31 4,322,539
Yuen Yu Investment Co., Ltd. 152,433 2,372,319 - - (97,334) - 7,815 152,433 100.00 2,282,800
SiPix Technology, Inc. (Note 3) - 1,675,750 - (581,523) 852,821 (2,314) 21,790 - 100.00 1,966,524
Dream Universe Ltd. 4,050 346,341 - - 28,142 - (21,202) 4,050 100.00 353,281
Prime View Communications Ltd. 3,570 28,545 - - 586 - (2,431) 3,570 100.00 26,700
Tech Smart Logistics Ltd. 1,550 4,384 - - (104) - (330) 1,550 0.09 3,950
Hot Tracks International Ltd. 50 10 - - 10 - - 50 100.00 20
Entte K Co., Ltd. (under liquidation) 2,203 - - - - - - 2,203 47.07 -
$ 24,288,540 $ (581,523) $ 1,006,612 $ (2,314) $ (719,192) $ 23,992,123
Note 1: The carrying amount was calculated based on audited financial statements of the corresponding year.
Note 2: Adjustments included capital surplus, exchange differences on translating foreign operations, unrealized gain (loss) on available-for-sale financial assets and retained earnings.
Note 3: The carrying amount decrease was due to the distribution of cash dividends.

- 67 -
SCHEDULE 5
E INK HOLDINGS INC.
STATEMENT OF NOTES AND ACCOUNTS PAYABLE
DECEMBER 31, 2017
(In Thousands of New Taiwan Dollars)
Company Name Amount
Company A $ 277,195
Company B 256,326
Company C 143,600
Company D 128,288
Company E 123,378
Company F 103,410
Company G 102,293
Others (Note) 675,828
$ 1,810,318
Note: The individual amounts per vendor included in “Others” do not exceed 5% of the account
balance.

- 68 -
SCHEDULE 6
E INK HOLDINGS INC.
STATEMENT OF OPERATING REVENUE
FOR THE YEAR ENDED DECEMBER 31, 2017
(In Thousands of New Taiwan Dollars)
Item
Number/Units (In
Thousands) Amount
Sales
Monitors 12,074 $ 11,322,912
e-Tags 4,956 451,998
Others 6,942 2,159,844
13,934,754
Less: Sales returns and discounts (29,395)
Net sales $ 13,905,359

- 69 -
SCHEDULE 7
E INK HOLDINGS INC.
STATEMENT OF OPERATING COSTS
FOR THE YEAR ENDED DECEMBER 31, 2017
(In Thousands of New Taiwan Dollars)
Item Amount
Cost of goods sold
Raw materials and supplies balance, beginning of year $ 745,543
Raw materials and supplies purchased 11,384,852
Sales of raw materials and supplies (459,734)
Transfers to other accounts (177,775)
Raw materials and supplies, end of year (1,133,839)
Usage of direct materials and supplies 10,359,047
Direct labor 31,779
Manufacturing expenses 620,807
Manufacturing costs 11,011,633
Work in progress and semi-finished goods, beginning of year 253,569
Semi-finished goods purchased 32
Sales of semi-finished goods (314,031)
Transfers to other accounts (79,505)
Work in progress and semi-finished goods, end of year (282,479)
Cost of finished goods 10,589,219
Finished goods, beginning of year 420,803
Finished goods purchased 1,069
Transfers to other accounts (14,461)
Finished goods, end of year (987,832)
Cost of goods sold of finished goods 10,008,798
Cost of goods sold of raw materials and supplies 459,734
Cost of goods sold of semi-finished goods 314,031
Idle capacity losses 294,061
Write-downs of inventories 193,180
Reversal of write-downs of inventories (13,244)
Total operating costs $ 11,256,560

- 70 -
SCHEDULE 8
E INK HOLDINGS INC.
STATEMENT OF OPERATING EXPENSES
FOR THE YEAR ENDED DECEMBER 31, 2017
(In Thousands of New Taiwan Dollars)
Items
Selling and
Marketing
Expenses
General and
Administrative
Expenses
Research and
Development
Expenses Total
Employee benefits $ 122,044 $ 475,926 $ 318,362 $ 916,332
Professional service
remuneration 100,070 50,158 37,241 187,469
Material fees 6,384 18,406 103,993 128,783
Depreciation 234 28,021 65,862 94,117
Testing experiment
expenses 2,463 616 90,576 93,655
Travel expenses 17,351 18,824 11,325 47,500
Others (Note) 15,578 167,358 60,919 243,855
$ 264,124 $ 759,309 $ 688,278 $ 1,711,711
Note: The amount of each item included in “Others” does not exceed 5% of the account balance.
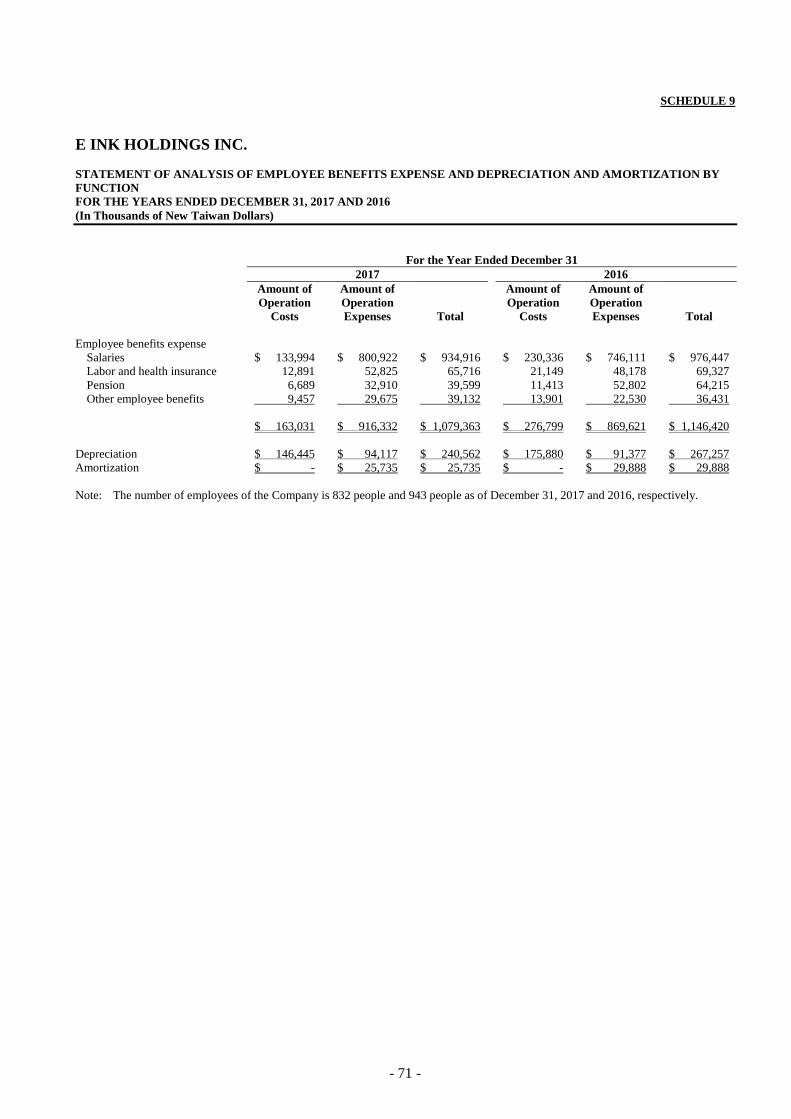
- 71 -
SCHEDULE 9
E INK HOLDINGS INC.
STATEMENT OF ANALYSIS OF EMPLOYEE BENEFITS EXPENSE AND DEPRECIATION AND AMORTIZATION BY
FUNCTION
FOR THE YEARS ENDED DECEMBER 31, 2017 AND 2016
(In Thousands of New Taiwan Dollars)
For the Year Ended December 31
2017 2016
Amount of
Operation
Costs
Amount of
Operation
Expenses Total
Amount of
Operation
Costs
Amount of
Operation
Expenses Total
Employee benefits expense
Salaries $ 133,994 $ 800,922 $ 934,916 $ 230,336 $ 746,111 $ 976,447
Labor and health insurance 12,891 52,825 65,716 21,149 48,178 69,327
Pension 6,689 32,910 39,599 11,413 52,802 64,215
Other employee benefits 9,457 29,675 39,132 13,901 22,530 36,431
$ 163,031 $ 916,332 $ 1,079,363 $ 276,799 $ 869,621 $ 1,146,420
Depreciation $ 146,445 $ 94,117 $ 240,562 $ 175,880 $ 91,377 $ 267,257
Amortization $ - $ 25,735 $ 25,735 $ - $ 29,888 $ 29,888
Note: The number of employees of the Company is 832 people and 943 people as of December 31, 2017 and 2016, respectively.

Copyrights of some images used in this report belong toPapercast、Terrada Music Score (Listing the company's names in alphabetical order).
E INK
HO
LDIN
GS IN
C. 2
01
7 A
nn
ua
l Rep
ort
• Taiwan Stock Exchange Market Observation Post System (Also known as MOPS): http://mops.twse.com.tw • EIH annual report is available at www.eink.com • Printed on April 24, 2018
E INK HOLDINGS INC. 2017 Annual Report
EIH: 8069
No.3, Lixing 1st Rd., Hsinchu Science Park,Hsinchu 300, TaiwanTel: 886 3 5643200www.eink.com
Recommended