8
Earthquake Response Analysis and Evaluation for Earth-Rock Dams
Zhenzhong Shen, Lei Gan, Juan Cui and Liqun Xu State Key Laboratory of Hydrology-Water Resources
and Hydraulic Engineering, Hohai University China
1. Introduction
An earthquake is any shaking of the ground, usually intense shaking of the ground - caused
by either natural sources or by humans. There are many different types of earthquakes. The
most common is tectonic earthquake, which occur when rocks in the earth's crust break due
to geological forces created by movement of tectonic plates. Another type of earthquake is
called volcanic earthquake, occurring in conjunction with volcanic activity. And also there
are various types of earthquakes caused by man-made activities, which caused directly by
human involvement, has been recorded as a result of water filling large dams, development
of mineral, geothermal and hydrocarbon resources, waste injection, underground nuclear
explosions and large-scale construction projects. This type of earthquake includes collapse
earthquake, explosion earthquake and induced earthquake due to water filling large dams
(Talwani, 1997; Chen & Talwani, 1998) and so on. Earthquake is the rapid vibration of the
earth surface whose acceleration motion can easily cause the destruction of hydraulic
structures. The relative deformation of the hydraulic structures increases when the inertial
force caused by the earthquake increases suddenly. For the hydrodynamic pressure acting
on the reservoir, dam foundation may appear relative deformation or different stage
deformation. For example, those parts of concrete dams, including dam crest, fold slope,
orifice inside the dam and corridor, are easily cracked, which may damage and then cause
the leakage of the dam body, even the collapse of the structures after the earthquake. As it to
the earth-rock dam, it is easy to appear cracks in dam in the process of the earthquake,
meanwhile, dam foundation or dam body may collapse caused by earthquake liquefaction if
the sands inside them are not fully roller compaction. Thus earthquake may cause the
unsafe of the hydraulic structures, even dam breach which may threatened the life and
property safety of the people downstream the river.
On May 12, 2008, a magnitude destructive earthquake (Ms=8.0), with the epicenter in
Wenchuan County, struck Sichuan province, in southwestern China, killing more than
100,000 people. The earthquake was the largest and most destructive to strike China since
the 1976 Tangshan earthquake, which killed more than 240,000 people (Pei et al., 2010; Wang
et al., 2010; Cao et al., 2011). On January 12, 2010, a massive 7.3-magnitude earthquake has
struck the Caribbean nation of Haiti. The earthquake struck about 15km (10 miles) south-
www.intechopen.com

Advances in Geotechnical Earthquake Engineering – Soil Liquefaction and Seismic Safety of Dams and Monuments
190
west of Port-au-Prince which is the capital city of Haiti. Approximately 230,000 people died
immediately or during ensuing weeks, mostly due to acute trauma (Kenneth, 2011). The
most devastating earthquake (Ms=9.0) in Japan after the 1923 Great Kanto earthquake hit the
eastern Japan in the afternoon of March 11, 2011. Nearly 30,000 people were killed or missed
in the Tohoku earthquake and the ensuing monster tsunami (Takewaki et al., 2011). In this
paper, the non-linear FEM is adopted to calculate the Wenchuan earthquake response. Then,
the earthquake-resistance safety of the Bikou dam is evaluated.
1.1 Bikou earth core dam
The Bikou hydropower station is located on the Bailong River in Gansu province of China,
where is about 240km away from the epicenter of Wenchuan earthquake, China, May 12,
2008(Chen et al., 2008; Yu et al., 2009; Lin et al., 2009). The Bikou earth core rockfill dam is
a 100m graduate earth-rock dam (Gu, 1989). According to the earthquake loss survey and
preliminary report of the Bikou hydropower project suffered “5.12” Wenchuan
earthquake, some damage appeared inside Bikou dam, but no dam slope slide and
instability damaged phenomenon happened after the earthquake (Zhou et al., 2009; Pan,
2009).The normal water level of the reservoir is 707.0m, and its relative reservoir capacity
is 5.21×10⁸ m3. The dam is earth core rockfill dam with height of 101.8m, where the typical
cross section of the dam is shown as in Fig.1. The ratio of the upstream slope of the dam
are 1:1.8 and 1:2.3 respectively, and the downstream slope are 1:1.7, 1:1.85, 1:2.2 and 1:1.5
respectively. Its width of dam crest is 7.6 m at elevation 710.00m, and the crest length of
dam is about 297.36 m. The dam is located in a roughly symmetric valley of V-type, the
slope of river bank is about 50-60 degree, and the one of right bank is about 35-45 degree.
The depth of overburden layer on the riverbed is about 25-34 m. The core wall in the
riverbed area is built on the natural sandy gravel layer, the width of core wall crest is
4.0m at elevation 709.00-710.00m, and the ratio of the upstream slope of the core wall are
1:0.2 and 1:0.25 respectively, the section of the dam along the dam axis is shown as in
Fig.2. Two concrete cut-off walls are adopted to connect the soil core wall and the
bedrock. The first one built along the dam axis inserts the bedrock with the thickness
1.30m and crest the elevation 630.00m. And the second concrete one is located at the dam
axis downstream 12m, inserting the bedrock with the thickness 0.80m and the crest
653.00m. The spillway buildings are made up of one spillway on the right bank, one
desilting tunnel and two spillway tunnels in the left bank.
Design W.L
703.00
Normal W.L
707.00
Check W.L
708.80
715.30
710.00(dam crest)
691.00
670.00
661.190
Design W.L
627.55
Check W.L
628.90
Normal W.L 617.02
Dead W.L
685.00
624.00
647.00
663.71
680.00
cut-off wall
thickness 130cm
overburden
cut-off wall
thickness 80cm
overburden
624.00
658.00
loam
core
wall
dam axis
Fig. 1. Typical cross section of the dam
www.intechopen.com

Earthquake Response Analysis and Evaluation for Earth-Rock Dams
191
left bank
right bank
730
720
710
700
690
680
670
660
650
640
730
720
710
700
690
680
670
660
650
640
714.30715.30
dam crest
710.00normal water level 707.00
spillway
loam core wall
original ground
cut-off wall line
curtain grouting line
653.00 the first cut-off wall line
the second cut-off wall line
625.50
curtain grouting line
curtain grouting line
Fig. 2. Section of the dam along the dam axis
1.2 Geological conditions
In the dam site area, the fractures are developed, mainly are the bedding extrusion fracture zones and the slow obliquity faults. Most of the fractures are the tension and twist fractures of steep obliquity, and the slow obliquity fractures in the SN, NNE and EW directions. The faulted structures are mainly as follow: the fault F9, F1, F6 and F14, broken bandwidth 0.3 ~ 3.0m, mainly for fault mud and rock. The fracture zones are mainly made up of fault mud and rock, with width of 0.3-3.0m.
2. Calculation model
2.1 Static analysis model
2.1.1 Control equation of FEM
According to the displacement solution, the basic balance equation of the nonlinear finite element method is as follows
K u u R (1)
Where K u is overall strength degree matrix, u node displacement array and R node
load array.
This equation can be solved by the incremental early strain gauge method, where the basic balance equation holds:
0 K u R R (2)
Here, u is nodal displacement incremental array, R node load incremental array and 0R the equivalent node load array of initial strain.
www.intechopen.com
Advances in Geotechnical Earthquake Engineering – Soil Liquefaction and Seismic Safety of Dams and Monuments
192
2.1.2 Constitutive model
In the static analysis, the soil materials and overburden layer materials are regarded as
elastic-plastic object, where the Duncan-Zhang's nonlinear-elastic (E-B) model (Duncan &
Chang, 1970) is carried out. The concrete and bedrock are regarded as linear elastic objects,
which obey the generalized Hook's law.
2.2 Dynamic analysis model
2.2.1 Control equation of FEM
The dynamic equilibrium equation can be described as follows after the calculation domain
is discretized by the finite element method
M C K F t
(3)
Here, , , are nodal displacement, nodal velocity and nodal acceleration respectively, F t nodal dynamic loading, M mass matrix, K strength degree matrix, C damping
matrix obtained by C M K , where is the first mode for vibration frequency
and the damping ratio.
Eq.(3) can be gradually integral solved by the Wilson linear acceleration method
( Wilson method), which can instead by the following equations.
t t
K F (4)
2
6 3 M CK K
dtdt (5)
tt ttF F M A C B (6)
2
6 62
t t dt t dt t dtA
dtdt (7)
32 +
2 t t dt t dt t dt
dtB
dt (8)
3 t tt
Bdt
(9)
2
6=
t ttA
dt (10)
The iterative method is adopted with the consideration of the variations of dynamic shear
modulus and damping ratio in calculation process after the average dynamic shear strain
change. In the iteration process the convergence criterion is
www.intechopen.com
Earthquake Response Analysis and Evaluation for Earth-Rock Dams
193
1
0.1 i i
i
G G
G (11)
Here, iG is the new shear modulus and 1iG the last shear modulus. The maximum
iteration times is taken for 6 to lest the iterative calculation into dead circulation.
2.2.2 Constitutive model
In the dynamic analysis (Mejia et al., 1981a, 1982b; Shen et al., 2006a, 2010b), the equivalent
nonlinear viscoelastic model is applied in the dynamic calculation and analysis, the soil
materials and the overburden layers are assumed to be viscoelastic bodies. They reflect
nonlinearity and hysteretic nature of the dynamic stress-strain relation by using of the
equivalent dynamic shear modulus G and equivalent damping ratio , which can be
expressed as the function between the equivalent shear modulus and damping ratio and the
dynamic shear strain amplitude. The key point of this model is to confirm the relationship
between the maximum dynamic shear modulus maxG and the average effective stress 0 . In
this paper, the Hardin-Drnevich model (Hardin & Denevich, 1972a, 1972b) is used, where
the dynamic shear modulus and damping ratio can be calculated as follows
max
1
GG (12)
max1
(13)
0max
n
aa
G K pp
(14)
Where 0 is average effective stress, aP atmospheric pressure, 'K modulus coefficient
and n is modulus exponent. Here, maxG , 0 and ap have the same dimension. The
relation curves of dynamic shear strain to dynamic shear modulus and damping ratio
can be obtained by dynamic tri-axial test (Xenaki & Athanasopoulos, 2008; Zegha &
Abdel-Ghaffar, 2009). When having dynamic calculation, the related relation curve can be
inputted directly, and then interpolate and extent the values according to the strain values
for the calculation.
The dynamic model of contact face elements referred to the test results of Hohai University, China. The relationship between shear rigidity K and dynamic shear strain is described as
follow
max
max1
f
KK
MK (15)
The shear rigidity K and damping ratio have the following relationship:
www.intechopen.com

Advances in Geotechnical Earthquake Engineering – Soil Liquefaction and Seismic Safety of Dams and Monuments
194
maxmax
1 K
K (16)
0.7
max nK C , tan f n (17)
Where n is the normal stress on contact face, the angle of internal friction on contact
face, max the maximum damping ratio and M , C are the test parameters.
2.3 Stability evaluation
The stress of element is used to calculate the factor of safety and evaluate its stability, thus
the position of slide surface can be obtained. According to the Mohr-Coulomb criterion,
the regions whose local safety factors are less than 1.0 are combined together to obtain the
most dangerous multi-slip surface. The factor of safety on the surface is defined as the
ratio of anti-sliding force to sliding force, and then the relationship between factors of
safety and time can be obtained during the earthquake period. In this way, the anti-
sliding stability is evaluated by stress when considering the unstable duration of
earthquake.
During an earthquake, the dynamic strength of rockfill material is not always less than its static strength, at least we can assume it is equal to static strength. Taking compressive stress as positive and tensile stress as negative, after obtaining the static stress and dynamic stress under an earthquake by finite element method, the local factor of safety of an element can be calculated by the following formula
1 3
1 3
2 cos 2 sin
ds
c uLF (18)
Where c is cohesion, the angle of internal friction and 1 , 3 are the maximum and
minimum principal stresses.
The du can be calculated by the formula as follow
1 31
3
d ddu (19)
Here, is Poisson’s ratio and 1 d , 3 d are dynamic stresses respectively.
3. Working behavior of Bikou earth-rock dam
According to the actual engineering conditions of the Bikou earth core rockfill dam, the 3-D non-linear FEM static and dynamic models of the dam are set up to calculate and analyze the stress and deformation characteristics of dam, including the deformation and stress of the dam shell, core wall, two cut-off walls, overburden layers, bedrock and so on. In order to consider the construction process, the process of filling the dam is divided into 15 levels to simulate, and the reservoir impoundment process is divided into 3 levels.
www.intechopen.com

Earthquake Response Analysis and Evaluation for Earth-Rock Dams
195
3.1 Initial stress field of dam
In order to calculate the earthquake responses of dam, the initial stress field of dam must be determined firstly. Thus, the 3-D finite element model is created to simulate the construction process of dam and reservoir impounding, and the initial stress field of dam before earthquake can be obtained.
3.1.1 Finite element model
According to the actual situation of the Bikou dam, the 3-D finite element model of the dam
and its foundation is set up, which has simulated the geometry and material partition of the
dam and its foundation. The control section super-element finite element mesh automatic
division technique is adopted to generate the information of finite element model, and
furthermore the super-element can be encrypted to form finite element. Based on
requirements of structural characteristics, stage loading and forming the super-element grid,
a set of control sections with 19 sections horizontal are selected. Then the dam and its
foundation are discretized, and the supper-element grid is built up. After the super-element
gird is discretized further more, the super-element gird is created whose total nodes are
31523 and total element numbers are 30087. The finite element mesh of the dam and its
foundation and its core wall are shown as in Fig.3.
Select domain of the calculation model. 1) The distance from the upstream boundary to the
dam axis of the river bed section is about 363.40m (approximately 1.0 times of dam height).
2) The distance from the downstream boundary to the dam toe of the river bed section is
around 401.00m. 3) The distance from the left boundary to the right boundary is about
698.18m (approximately 2.0 times of dam height). 4) The vertical distance from the bottom
boundary to the dam foundation surface is about 241.80 m.
The coordinate system is set up as following. The X-axis is along stream from up to down
with zero at dam axis, the Y-axis is along dam axis from right bank to left bank, and the Z-
axis is vertical corresponding to the elevation.
(a) dam body and foundation (b) core wall
Fig. 3. Finite element grid
Flow
www.intechopen.com
Advances in Geotechnical Earthquake Engineering – Soil Liquefaction and Seismic Safety of Dams and Monuments
196
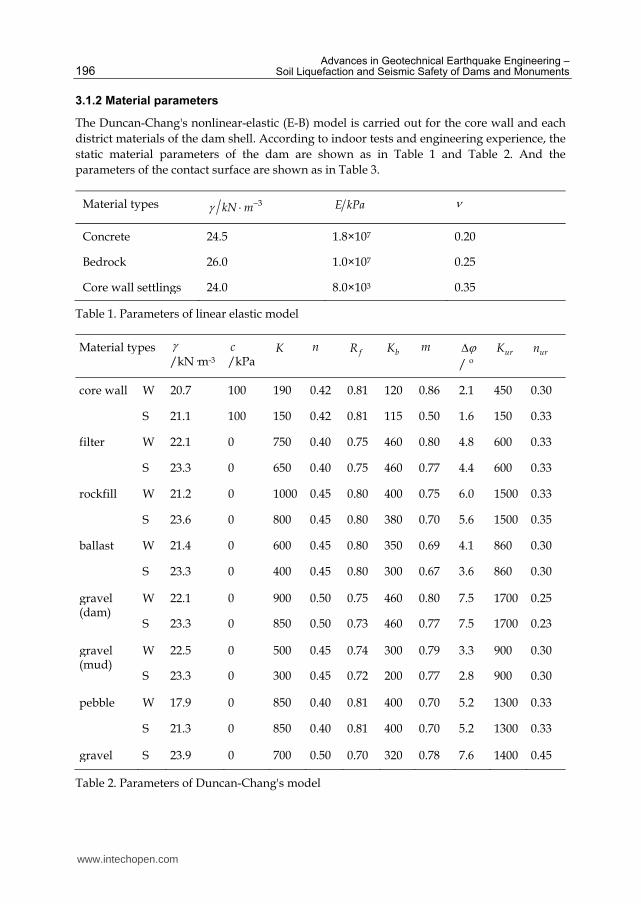
3.1.2 Material parameters
The Duncan-Chang's nonlinear-elastic (E-B) model is carried out for the core wall and each
district materials of the dam shell. According to indoor tests and engineering experience, the
static material parameters of the dam are shown as in Table 1 and Table 2. And the
parameters of the contact surface are shown as in Table 3.
Material types 3 kN m E kPa Concrete 24.5 1.8×10⁷ 0.20
Bedrock 26.0 1.0×10⁷ 0.25
Core wall settlings 24.0 8.0×10³ 0.35
Table 1. Parameters of linear elastic model
Material types /kN·m-3
c/kPa
K nfR bK m
/ º urK urn
core wall W 20.7 100 190 0.42 0.81 120 0.86 2.1 450 0.30
S 21.1 100 150 0.42 0.81 115 0.50 1.6 150 0.33
filter W 22.1 0 750 0.40 0.75 460 0.80 4.8 600 0.33
S 23.3 0 650 0.40 0.75 460 0.77 4.4 600 0.33
rockfill W 21.2 0 1000 0.45 0.80 400 0.75 6.0 1500 0.33
S 23.6 0 800 0.45 0.80 380 0.70 5.6 1500 0.35
ballast W 21.4 0 600 0.45 0.80 350 0.69 4.1 860 0.30
S 23.3 0 400 0.45 0.80 300 0.67 3.6 860 0.30
gravel (dam)
W 22.1 0 900 0.50 0.75 460 0.80 7.5 1700 0.25
S 23.3 0 850 0.50 0.73 460 0.77 7.5 1700 0.23
gravel (mud)
W 22.5 0 500 0.45 0.74 300 0.79 3.3 900 0.30
S 23.3 0 300 0.45 0.72 200 0.77 2.8 900 0.30
pebble W 17.9 0 850 0.40 0.81 400 0.70 5.2 1300 0.33
S 21.3 0 850 0.40 0.81 400 0.70 5.2 1300 0.33
gravel S 23.9 0 700 0.50 0.70 320 0.78 7.6 1400 0.45
Table 2. Parameters of Duncan-Chang's model
www.intechopen.com

Earthquake Response Analysis and Evaluation for Earth-Rock Dams
197
Material
/ º
sK
/×104
sn fsR sC
/kPa·m-3
Loam /concrete 14.0 2.30 0.69 0.75 0
Sandy gravel / concrete 32.2 4.00 0.65 0.75 0
Loam /Loam 17.3 1.80 0.70 0.88 68
Bedrock /concrete 35.0 6.00 0.20 0.80 0
Bedrock /the settlings 30.0 3.00 0.70 0.80 0
Table 3. Parameters of contact surface
3.1.3 Displacement and stress field of dam
By use of the stage loading method to simulate the construction process of dam and
reservoir impounding, the displacement field and stress field of dam under normal water
level condition are obtained. Here, as examples, the displacement and stress distribution on
the maximum transverse cross section of dam (Y=210m) and dam axis maximum
longitudinal section of dam (X=-10m) are shown as in Fig.4 ~Fig.6.
Here, the displacement along the coordinate axis direction is positive, that is, the horizontal
displacement along the flow with the direction of upstream point to the downstream is
positive, the positive horizontal displacement along the dam axis direction is from the right
bank to the left, and the positive vertical displacement is from bottom to up. The unit of the
displacement is “mm” in some figures. The compressive stress is positive, and the tensile
stress is negative. The unit of the stress is “kPa” in some figures.
1. Dam shell
Under normal water level condition, the maximum horizontal displacement pointing to the
upstream and the downstream respectively is -289mm and 1132mm.The maximum value
appears in the lower crust, close to the slope. The dam horizontal displacement distribution
along the dam axis direction shows that the horizontal displacement value along dam axis
direction is small. And the maximum settlement occurs in the upstream dam shell which is
near the dam axis in the middle of the river. The maximum vertical displacement of the dam
body is 1273mm, accounts for about 1.2% of the maximum height.
The maximum first principal stress of the dam body is 2534kPa, the maximum second
principal stress is 2445kPa and the maximum third principal stress is 1842kPa. The
maximum principal stress of the upstream and downstream dam shell occurs at the
bottom of dam near the dam axis. The shear stress level of most rock-fill units are less
than 0.85, no the shear failure zone appears in the dam body. It indicates that the dam is
stable.
www.intechopen.com

Advances in Geotechnical Earthquake Engineering – Soil Liquefaction and Seismic Safety of Dams and Monuments
198
2. Core wall
The maximum horizontal displacement pointing to the downstream of the loam core wall is
812mm.The maximum horizontal displacements of core wall along dam axis direction is
181mm, pointing to the left bank. And the maximum vertical displacement of core wall is
1413mm, appearing in the upstream of the core wall near the dam axis where the elevation
is 657.00m at the deepest valley section. The maximum first principal stress of the core wall
is 1839kPa, the maximum second principal stress is 1373kPa, and the maximum third
principal stress is 1256kPa.
-200 -100 0 100 200 300 400
600
650
700
-200 -100 0 100 200 300 400
600
650
700
-200 -100 0 100 200 300 400
600
650
700
-200 -100 0 100 200 300 400
600
650
700
-200 -100 0 100 200 300 400
600
650
700
(a) X-displacement
-200 -100 0 100 200 300 400
600
650
700
-200 -100 0 100 200 300 400
600
650
700
-200 -100 0 100 200 300 400
600
650
700
-200 -100 0 100 200 300 400
600
650
700
-200 -100 0 100 200 300 400
600
650
700
(b) Y-displacement
-200 -100 0 100 200 300 400
600
650
700
-200 -100 0 100 200 300 400
600
650
700
-200 -100 0 100 200 300 400
600
650
700
-200 -100 0 100 200 300 400
600
650
700
-200 -100 0 100 200 300 400
600
650
700
(c) Z-displacement
Fig. 4. Displacement distribution on section Y=210m (unit: mm)
Under normal water level condition, although core wall stress is smaller than depletion
layer stress, but no tensile stress appeared, so the loam core wall won't produce pull crack.
Meanwhile, for the strength and modulus of core wall is lower and the core wall is easy to
adapt to deformation, core wall stress levels are lower. It indicates that the core wall is
stable.
www.intechopen.com
Earthquake Response Analysis and Evaluation for Earth-Rock Dams
199
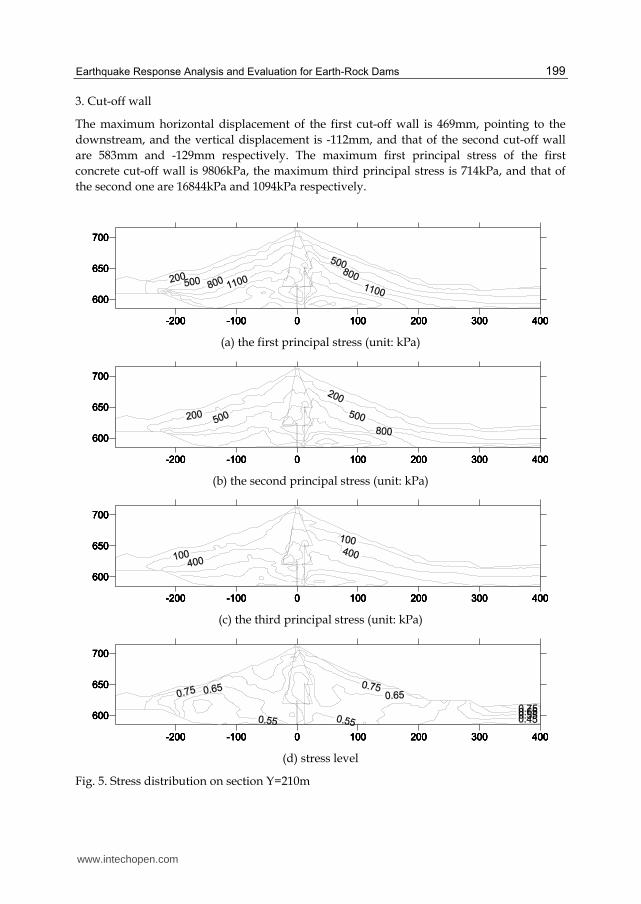
3. Cut-off wall
The maximum horizontal displacement of the first cut-off wall is 469mm, pointing to the
downstream, and the vertical displacement is -112mm, and that of the second cut-off wall
are 583mm and -129mm respectively. The maximum first principal stress of the first
concrete cut-off wall is 9806kPa, the maximum third principal stress is 714kPa, and that of
the second one are 16844kPa and 1094kPa respectively.
-200 -100 0 100 200 300 400
600
650
700
-200 -100 0 100 200 300 400
600
650
700
-200 -100 0 100 200 300 400
600
650
700
-200 -100 0 100 200 300 400
600
650
700
-200 -100 0 100 200 300 400
600
650
700
(a) the first principal stress (unit: kPa)
-200 -100 0 100 200 300 400
600
650
700
-200 -100 0 100 200 300 400
600
650
700
-200 -100 0 100 200 300 400
600
650
700
-200 -100 0 100 200 300 400
600
650
700
-200 -100 0 100 200 300 400
600
650
700
(b) the second principal stress (unit: kPa)
-200 -100 0 100 200 300 400
600
650
700
-200 -100 0 100 200 300 400
600
650
700
-200 -100 0 100 200 300 400
600
650
700
-200 -100 0 100 200 300 400
600
650
700
-200 -100 0 100 200 300 400
600
650
700
(c) the third principal stress (unit: kPa)
-200 -100 0 100 200 300 400
600
650
700
-200 -100 0 100 200 300 400
600
650
700
-200 -100 0 100 200 300 400
600
650
700
-200 -100 0 100 200 300 400
600
650
700
-200 -100 0 100 200 300 400
600
650
700
(d) stress level
Fig. 5. Stress distribution on section Y=210m
www.intechopen.com

Advances in Geotechnical Earthquake Engineering – Soil Liquefaction and Seismic Safety of Dams and Monuments
200
-20 -10 0 10 20
620
630
640
650
660
670
680
690
700
710
-20 -10 0 10 20
620
630
640
650
660
670
680
690
700
710
-20 -10 0 10 20
620
630
640
650
660
670
680
690
700
710
-20 -10 0 10 20
620
630
640
650
660
670
680
690
700
710
(a) X-displacement (b) Z-displacement
Fig. 6. Displacement distribution of core wall on section Y=210m (unit: mm)
3.2 Earthquake responses of dam
3.2.1 Finite element model
The finite element model what can be used to analyze earthquake responses of the dam is build, which is the same as the model for the static analysis.
3.2.2 Dynamic parameters and calculation condition
The time history analysis method is used and the equivalent nonlinear viscoelastic model is chosen as the constitutive model of soil, which assumes that the soil of dam body and foundation overburden are considered as viscoelasticity, and equivalent shear modulus G
and equivalent damping ratio are applied to reflect the nonlinearity and hysteretic nature
this two properties of soil dynamic stress-strain relation. The dynamic parameters of dam are shown as in Table 4 and Table 5.
www.intechopen.com

Earthquake Response Analysis and Evaluation for Earth-Rock Dams
201
Material
parameters
Soil Material
loam filter rockfill ballast Gravel
(dam)
Gravel
(mud)
pebble Gravel
(foundation)
K 375 1875 2282 1147 2052 696 1701 1603
n 0.63 0.61 0.55 0.58 0.54 0.57 0.55 0.54
Table 4. Maximum dynamic shear modulus parameters of dam materials
Material
parameters
Soil Material
loam filter rockfill ballast Gravel
(dam)
Gravel
(mud)
pebble Gravel
(foundation)
aK 0.4653 1.5232 2.2814 1.6118 1.6653 1.4226 2.1450 1.6603
an 1.1883 1.2100 2.0871 1.5464 1.5553 1.2002 2.0322 1.4876
K 1.8252 2.0632 2.3221 1.7877 1.7623 1.5308 2.2895 1.7222
n 1.7119 1.9121 2.2007 1.6206 1.5989 1.3359 2.1659 1.5098
Table 5. Residual strain parameters of dam materials
-5.00
-4.00
-3.00
-2.00
-1.00
0.00
1.00
2.00
3.00
4.00
5.00
0 5 10 15 20 25 30
t/s
Ax/ m/s*s
Fig. 7. The input curve of earthquake acceleration of bedrock in horizontal direction
www.intechopen.com

Advances in Geotechnical Earthquake Engineering – Soil Liquefaction and Seismic Safety of Dams and Monuments
202
Under the Wenchuan earthquake condition, in the dam site of Bikou hydropower station, the seismic intensity is comprehensively evaluated as degree 9. Correspondingly, the bedrock in the dam site has a peak level acceleration of 404cm/s2 and its seismic acceleration curve of bedrock in horizontal direction is shown as Fig.7, which is in up-down stream direction and in dam axis direction. When calculating, the seismic acceleration value of vertical direction is regarded as two thirds of the horizontal one. Meanwhile, the dynamic water pressure is evaluated by the additional mass method called Westergaard method, that using equivalent additional mass instead of the dynamic water pressure to stack with the quality of the dam body during the earthquake.
3.2.3 Earthquake responses
Under the conditions of Wenchuan earthquake intensity, the earthquake response of the dam are analyzed, including the maximum acceleration response, displacement response and stress response of dam body, loam core and cut-off walls, and the earthquake induced permanent deformation (Serff et al., 1976; Taniguchi et al., 1983; Kuwano & Ishihara, 1988; Cascone & Rampello, 2003; Elia et al, 2011) of the dam is also obtained. The maximum values of earthquake responses analysis results are shown as in Table 8.The distributions of the dynamic analysis main features (Idriss et al., 19773; Ahmed-Waeil et al., 1990a, 1993b; Zhu et al., 2003) are shown as in Fig.8~Fig.14.
1. Acceleration response
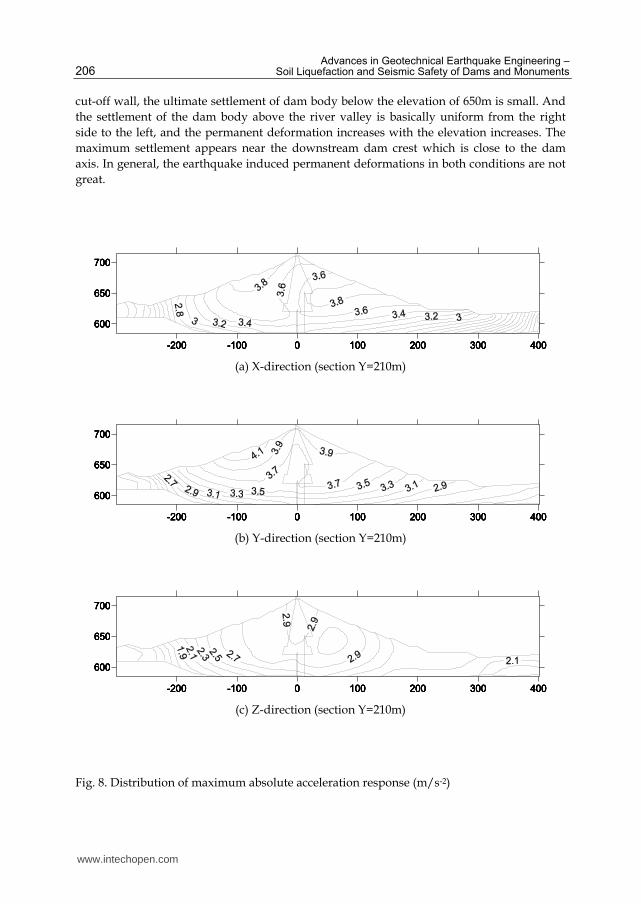
Calculation results show that the natural vibration period of Bikou dam is about 0.74 seconds. The maximum acceleration response of the rockfill respectively is 4.08m/s2 along the river direction, 4.43m/s2 along the dam axis direction and 3.20m/s2 along the elevation direction. For the core, the maximum acceleration response along the above three directions are 3.89m/s2,4.14m/s2 and 3.14m/s2 respectively. Along the dam axis direction, the acceleration response of the dam is the greatest, followed by the acceleration response along the river direction and the acceleration response along the elevation direction is the smallest.
When earthquake comes, the upstream and downstream dam shell materials, which have a relatively long distance to the cut-off wall, are slightly affected. The corresponding horizontal acceleration response is basically proportional to the dam height and the maximum one appears near the upstream and the downstream slope surfaces which are close to the dam crest. The seismic acceleration response of a point is related to the vertical distance between the point and the bottom of the river valley; the height is greater, the corresponding seismic response is greater. As the slide slope of the right bank is slower than the left bank, the maximum horizontal acceleration response appears much closer to the right bank. From the middle of river bed to the both banks, the horizontal acceleration response decrease gradually which is related to the dam body type and boundary conditions. From the distribution of acceleration response on cross section, it can be seen that near the right bank, as the base of the downstream dam body is higher than the upstream and overburden layer exist at the bottom of the upstream dam body, the acceleration response of the upstream dam body is greater than the downstream dam body. The situation is opposite near the left bank, as deep overburden layer exists at the bottom of the downstream dam body and the downstream dam slope is much steeper than the upstream, the acceleration response of the downstream dam body is greater than the upstream dam body.
www.intechopen.com
Earthquake Response Analysis and Evaluation for Earth-Rock Dams
203
2. Displacement response
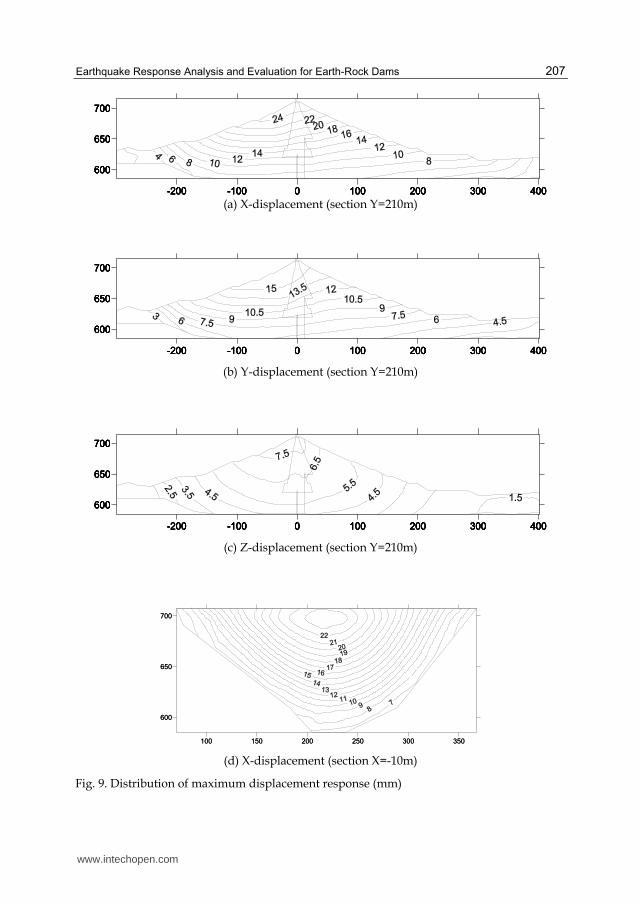
The maximum displacement response of the rock-fill is 25.92mm along the river direction,
16.99mm along the dam axis direction and 12.39mm along the elevation direction. For the
loam core, the maximum acceleration response along the above three directions are
25.61mm, 16.77mm and 12.33mm respectively.
The displacement responses are not so great. Along the river direction, the displacement response of the dam is the greatest, followed by the displacement response along the dam axis direction. The smallest displacement response is along the elevation direction. The distribution of displacement response is almost the same with acceleration response. Under the seismic action, the displacement response is basically proportional to the dam height and the maximum one appears near the upstream and the downstream slope surfaces which are close to the dam crest. The seismic acceleration response of a point is related to the vertical distance between the point and the bottom of the river valley, the height is greater, corresponding seismic response is greater. The maximum horizontal displacement response appears near the dam crest above the deepest site of river valley. As overburden exists at the left bank, the maximum vertical displacement appears much closer to the left bank. From the center of river bed to the both banks, the displacement response decreases gradually which is related to the dam body type and boundary conditions. From the distribution of displacement response on cross section, the displacement response of the dam is not only related to the grade of upstream and downstream slope, but also the depth and distribution of overburden. Close to the right bank, as the base of the downstream dam body is higher than the upstream and overburden layer exists at the bottom of the upstream dam body, the displacement response of the upstream dam body is greater than the downstream dam body. The situation is opposite near the left bank. As deep overburden layer exists at the bottom of the downstream dam body and the downstream dam slope is much steeper than the upstream, the displacement response of the downstream dam body is greater than the upstream dam body.
3. Stress response
For the rockfill of dam, the maximum first principal stress is 425kPa, the maximum second principal stress is 352kPa and the maximum third principal stress is 203kPa. For the core, the maximum first principal stress is 265kPa, the dynamic tensile stress is 221kPa; the maximum second principal stress is 215kPa, the dynamic tensile stress is 178kPa; the maximum third principal stress is 192kPa, the dynamic tensile stress is 157kPa. For the first concrete cut-off wall, the maximum first principal stress is 3031kPa, the maximum second principal stress is compressive stress with a value of 591kPa and the maximum third principal stress is compressive stress with a value of 363kPa. For the second concrete cut-off wall, the maximum first principal stress is 4482kPa, the maximum second principal stress is compressive stress with a value of 683kPa and the maximum third principal stress is compressive stress with a value of 422kPa.
The stress response of rockfill and core along the river direction is the greatest, followed by the displacement response along the dam axis direction and the displacement response along the elevation direction is the smallest. The strong stress response of the core happens on the major river bed where the loam core connects to the both banks. The big and small principal stress response of the rock-fill become stronger with the increase of cover depth,
www.intechopen.com

Advances in Geotechnical Earthquake Engineering – Soil Liquefaction and Seismic Safety of Dams and Monuments
204
thus the contour lines are parallel to the dam slope, and the maximum dynamic compressive stress and maximum dynamic tensile stress appear at the bottom of the dam near the deepest river valley. At the same elevation, the stress response of the dam body is much stronger than the core. As the great difference of deformation modulus between concrete and loam, stress concentration appears near the cut-off wall. Besides, at the downstream side of cut-off wall, dynamic stress response is very strong. From the distribution of stress response on longitudinal profile, it can be seen that the stress response at the bottom of the dam on the right bank is a bit stronger than on the left bank, the dynamic stress response is great at the connecting part between dam body and both bank slopes, especially near the place where the section of bank slope varies, stress concentration of strong dynamic stress response appears; and with the increase of peak acceleration, the stress response becomes stronger. So, more attentions should be paid to these weak areas.
Great dynamic stress appears at the top of the concrete cut-off wall, so does in the
connection part between bedrock and the cut-off wall close to the bank slope. The stress
response of concrete is proportional to the peak seismic acceleration, thus with the increase
of peak acceleration, the dynamic tensile stress and compressive stress become greater. The
maximum dynamic tensile stress of the cut-off wall is shown as in Table 6. Overall, the
dynamic compressive stress of concrete is small and the dynamic tensile stress is relatively
much greater, so the monitoring to the strength of the cut-off wall should be strengthened to
ensure the safety operation of the dam.
During the earthquake, the maximum shear stresses of the dam are respectively 236kPa. On
the cross section of the dam, the maximum dynamic shear stress and the dynamic shear
stress become greater gradually from the upstream side and downstream side to the dam
axis; but in the middle of the core, the dynamic shear stress decreases greatly, and at the
bottom of dam, the dynamic shear stress response of rock-fill and transition material are
very great. So, as the significant difference of the filling materials, the maximum shear stress
responses are very significant in the connection parts of materials. The shear stress response
of rock-fill is very great on the bank slope where the sections vary, and shear stress
concentration appears in the local areas of where the sections vary at both banks; in the
main river bed where the core connects to both bank, the shear stress is great.
4. Earthquake induced permanent deformation
The maximum permanent horizontal displacement is 74mm along the river direction, 47mm
along the dam axis direction and the maximum permanent vertical displacement or
settlement is 239mm. Taking no account of the thickness of the overburden on the dam
foundation, the maximum dam height is 101.8m, then the permanent settlement induced by
earthquake is about 0.23 percents of the dam height.
Due to the upstream water pressure, the earthquake induced permanent deformation of the
core along the river orientation points to the downstream, so does the upstream dam shell
materials near the dam crest. Along the dam axis direction, the earthquake induced
permanent deformation is not so great and the maximum one appears near the upstream
dam slope. It can be seen that in the dam abutments of both banks, the displacements of the
dam body point to the center of the river valley; near the dam axis, the displacement and its
variation gradient at the right bank are greater than the left bank. Affected by the concrete
www.intechopen.com

Earthquake Response Analysis and Evaluation for Earth-Rock Dams
205
Item Value
maximum absolute acceleration response / m·s-2
Rockfill up-down stream direction 4.08
dam axis direction 4.43
vertical direction 3.20
Core wall up-down stream direction 3.89
dam axis direction 4.14
vertical direction 3.14
maximum displacement response /mm
Rockfill up-down stream direction 25.92
dam axis direction 16.99
vertical direction 12.39
Core wall up-down stream direction 25.61
dam axis direction 16.77
vertical direction 12.23
maximum stress response of rockfill /kPa
Rockfill 1st principal stress 425/-422
2nd principal stress 352/-347
3rd principal stress 203/-188
Core wall 1st principal stress 265/-221
2nd principal stress 215/-178
3rd principal stress 192/-157
1st cut-off wall 1st principal stress 3031/-2908
2nd principal stress 591/-589
3rd principal stress 363/-316
2nd cut-off wall 1st principal stress 4482/-3759
2nd principal stress 683/-665
3rd principal stress 422/-387
Earthquake induced permanent deformation/mm
stream direction (up/down stream)
74/-49
dam axis direction (left /right bank)
47/-26
vertical direction(settlement) -239
maximum shear stress response / kPa 236
Table 6. Earthquake responses of Bikou dam by 3-D dynamic FEM
www.intechopen.com
Advances in Geotechnical Earthquake Engineering – Soil Liquefaction and Seismic Safety of Dams and Monuments
206
cut-off wall, the ultimate settlement of dam body below the elevation of 650m is small. And
the settlement of the dam body above the river valley is basically uniform from the right
side to the left, and the permanent deformation increases with the elevation increases. The
maximum settlement appears near the downstream dam crest which is close to the dam
axis. In general, the earthquake induced permanent deformations in both conditions are not
great.
-200 -100 0 100 200 300 400
600
650
700
-200 -100 0 100 200 300 400
600
650
700
-200 -100 0 100 200 300 400
600
650
700
-200 -100 0 100 200 300 400
600
650
700
-200 -100 0 100 200 300 400
600
650
700
(a) X-direction (section Y=210m)
-200 -100 0 100 200 300 400
600
650
700
-200 -100 0 100 200 300 400
600
650
700
-200 -100 0 100 200 300 400
600
650
700
-200 -100 0 100 200 300 400
600
650
700
-200 -100 0 100 200 300 400
600
650
700
(b) Y-direction (section Y=210m)
-200 -100 0 100 200 300 400
600
650
700
-200 -100 0 100 200 300 400
600
650
700
-200 -100 0 100 200 300 400
600
650
700
-200 -100 0 100 200 300 400
600
650
700
-200 -100 0 100 200 300 400
600
650
700
(c) Z-direction (section Y=210m)
Fig. 8. Distribution of maximum absolute acceleration response (m/s-2)
www.intechopen.com
Earthquake Response Analysis and Evaluation for Earth-Rock Dams
207
-200 -100 0 100 200 300 400
600
650
700
-200 -100 0 100 200 300 400
600
650
700
-200 -100 0 100 200 300 400
600
650
700
-200 -100 0 100 200 300 400
600
650
700
-200 -100 0 100 200 300 400
600
650
700
(a) X-displacement (section Y=210m)
-200 -100 0 100 200 300 400
600
650
700
-200 -100 0 100 200 300 400
600
650
700
-200 -100 0 100 200 300 400
600
650
700
-200 -100 0 100 200 300 400
600
650
700
-200 -100 0 100 200 300 400
600
650
700
(b) Y-displacement (section Y=210m)
-200 -100 0 100 200 300 400
600
650
700
-200 -100 0 100 200 300 400
600
650
700
-200 -100 0 100 200 300 400
600
650
700
-200 -100 0 100 200 300 400
600
650
700
-200 -100 0 100 200 300 400
600
650
700
(c) Z-displacement (section Y=210m)
100 150 200 250 300 350
600
650
700
100 150 200 250 300 350
600
650
700
(d) X-displacement (section X=-10m)
Fig. 9. Distribution of maximum displacement response (mm)
www.intechopen.com

Advances in Geotechnical Earthquake Engineering – Soil Liquefaction and Seismic Safety of Dams and Monuments
208
-200 -100 0 100 200 300 400
600
650
700
-200 -100 0 100 200 300 400
600
650
700
-200 -100 0 100 200 300 400
600
650
700
-200 -100 0 100 200 300 400
600
650
700
-200 -100 0 100 200 300 400
600
650
700
(a) the first principal stress
-200 -100 0 100 200 300 400
600
650
700
-200 -100 0 100 200 300 400
600
650
700
-200 -100 0 100 200 300 400
600
650
700
-200 -100 0 100 200 300 400
600
650
700
-200 -100 0 100 200 300 400
600
650
700
(b) the second principal stress
-200 -100 0 100 200 300 400
600
650
700
-200 -100 0 100 200 300 400
600
650
700
-200 -100 0 100 200 300 400
600
650
700
-200 -100 0 100 200 300 400
600
650
700
-200 -100 0 100 200 300 400
600
650
700
(c) the third principal stress
Fig. 10. Distribution of maximum stress response on section (Y=210m) (unit: kPa)
www.intechopen.com

Earthquake Response Analysis and Evaluation for Earth-Rock Dams
209
140 160 180 200 220 240 260 280 300 320
600
620
640
140 160 180 200 220 240 260 280 300 320
600
620
640
(a) the first principal stress
140 160 180 200 220 240 260 280 300 320
600
620
640
140 160 180 200 220 240 260 280 300 320
600
620
640
(b) the second principal stress
140 160 180 200 220 240 260 280 300 320
600
620
640
140 160 180 200 220 240 260 280 300 320
600
620
640
(c) the third principal stress
Fig. 11. Distribution of maximum stress response of the second cut-off wall (unit: kPa)
www.intechopen.com

Advances in Geotechnical Earthquake Engineering – Soil Liquefaction and Seismic Safety of Dams and Monuments
210
-200 -100 0 100 200 300 400
600
650
700
-200 -100 0 100 200 300 400
600
650
700
-200 -100 0 100 200 300 400
600
650
700
-200 -100 0 100 200 300 400
600
650
700
-200 -100 0 100 200 300 400
600
650
700
Fig. 12. Distribution of maximum dynamic shear on section (Y=210m) (unit: kPa)
-200 -100 0 100 200 300 400
600
650
700
-200 -100 0 100 200 300 400
600
650
700
-200 -100 0 100 200 300 400
600
650
700
-200 -100 0 100 200 300 400
600
650
700
-200 -100 0 100 200 300 400
600
650
700
(a) X-direction
-200 -100 0 100 200 300 400
600
650
700
-200 -100 0 100 200 300 400
600
650
700
-200 -100 0 100 200 300 400
600
650
700
-200 -100 0 100 200 300 400
600
650
700
-200 -100 0 100 200 300 400
600
650
700
(b) Y-direction
-200 -100 0 100 200 300 400
600
650
700
-200 -100 0 100 200 300 400
600
650
700
-200 -100 0 100 200 300 400
600
650
700
-200 -100 0 100 200 300 400
600
650
700
-200 -100 0 100 200 300 400
600
650
700
(c) Z-direction
Fig. 13. Distribution of earthquake induced permanent deformation on section(Y=210m) (mm)
www.intechopen.com

Earthquake Response Analysis and Evaluation for Earth-Rock Dams
211
-200 -100 0 100 200 300 400
600
650
700
-200 -100 0 100 200 300 400
600
650
700
-200 -100 0 100 200 300 400
600
650
700
-200 -100 0 100 200 300 400
600
650
700
-200 -100 0 100 200 300 400
600
650
700
(a) t=5s
-200 -100 0 100 200 300 400
600
650
700
-200 -100 0 100 200 300 400
600
650
700
-200 -100 0 100 200 300 400
600
650
700
-200 -100 0 100 200 300 400
600
650
700
-200 -100 0 100 200 300 400
600
650
700
(b) t=15s
-200 -100 0 100 200 300 400
600
650
700
-200 -100 0 100 200 300 400
600
650
700
-200 -100 0 100 200 300 400
600
650
700
-200 -100 0 100 200 300 400
600
650
700
-200 -100 0 100 200 300 400
600
650
700
(c) t=25s
Fig. 14. Distribution of safety factors at different times during earthquake on section (Y=210m)
4. Earthquake-resistance safety evaluation
4.1 Comparing the static calculation results and monitoring data
In order to monitor the consolidation settlement in construction and operation, 5
collimating lines are set for the Bikou Hydropower Station soil core dam(Fig.18), which
are respectively up dam 0-010.1m(708.00m elevation), under dam 0+007.8m(709m
elevation), under dam 0+041.8m(691m elevation), under dam 0+093.0(670m elevation) and
under dam 0+142.7(650m elevation). Only up dam section 0-010.0m got observed on
December 17, 1975, and other sections started observation two years later after storage for
the construction of crest parapet wall and downstream slope and drainage. Monitoring
date of dam surface horizontal displacement and settlement before earthquake are shown
as in Fig.16 and Fig.17.
Among all the monitoring sites, only section 0-010.0m started observation once storage,
while other sections started observation relatively late. Therefore, displacement of these 5
sections cannot directly be compared with that of finite element calculation. As section 0-
www.intechopen.com
Advances in Geotechnical Earthquake Engineering – Soil Liquefaction and Seismic Safety of Dams and Monuments
212
010.0m got monitored earlier, its monitoring date should be compared with modified results
of finite element calculation, which can be shown as in Fig.16 and Fig.17.
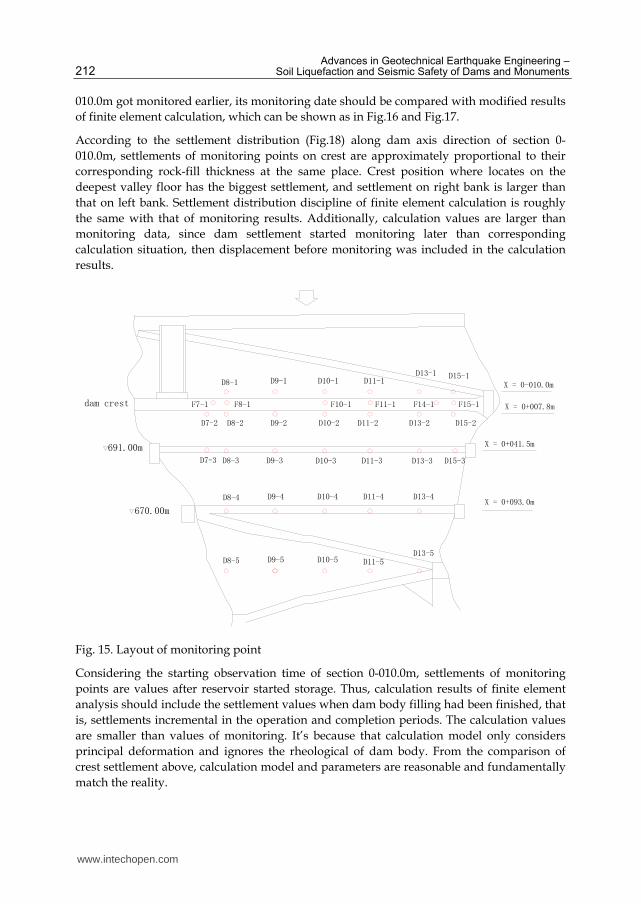
According to the settlement distribution (Fig.18) along dam axis direction of section 0-
010.0m, settlements of monitoring points on crest are approximately proportional to their
corresponding rock-fill thickness at the same place. Crest position where locates on the
deepest valley floor has the biggest settlement, and settlement on right bank is larger than
that on left bank. Settlement distribution discipline of finite element calculation is roughly
the same with that of monitoring results. Additionally, calculation values are larger than
monitoring data, since dam settlement started monitoring later than corresponding
calculation situation, then displacement before monitoring was included in the calculation
results.
X = 0+093.0m
D7-3
D15-1
D8-3 D9-3 D10-3 D11-3 D13-3 D15-3
X = 0+041.5m
X = 0+007.8m
X = 0-010.0m
D15-2D13-2D11-2D10-2D9-2D8-2D7-2
D9-1D8-1
D10-1 D11-1
D13-1
D13-4D11-4D10-4D9-4D8-4
D8-5 D9-5 D10-5D11-5
D13-5
F8-1F7-1 F10-1 F11-1 F14-1 F15-1dam crest
691.00m
670.00m
Fig. 15. Layout of monitoring point
Considering the starting observation time of section 0-010.0m, settlements of monitoring
points are values after reservoir started storage. Thus, calculation results of finite element
analysis should include the settlement values when dam body filling had been finished, that
is, settlements incremental in the operation and completion periods. The calculation values
are smaller than values of monitoring. It’s because that calculation model only considers
principal deformation and ignores the rheological of dam body. From the comparison of
crest settlement above, calculation model and parameters are reasonable and fundamentally
match the reality.
www.intechopen.com

Earthquake Response Analysis and Evaluation for Earth-Rock Dams
213
-30
-20
-10
0
10
20
30
40
100 150 200 250 300 350
along dam axis direction/m
Ho
rizo
nta
l d
isp
lace
me
nt
be
fore
ea
rth
qu
ak
e/
mm x=-10
x=7.8
x=41.8
x=93
x=142.7
Fig. 16. Distribution of horizontal displacement measured value before the earthquake
-600
-500
-400
-300
-200
-100
0
100 150 200 250 300 350
along dam axis direction/m
sett
lem
en
t b
ifo
re e
art
hq
ua
ke
/m
m
x=-10
x=7.8
x=41.8
x=93
x=142.7
Fig. 17. Distribution of settlement measured value before the earthquake
-1000
-800
-600
-400
-200
0
70 120 170 220 270 320 370
along dam axis direction/mVe
rtic
al
dis
pla
cem
en
t o
f d
am
cre
st i
n t
he
see
tio
n x
=-1
0m
/m
m
settlement in completion period settlement in operation period
settlement incremental monitoring settlement
Fig. 18. Comparison of the settlement measured value and calculated value before the earthquake on the section (X=-10.0m)
www.intechopen.com
Advances in Geotechnical Earthquake Engineering – Soil Liquefaction and Seismic Safety of Dams and Monuments
214
4.2 Results of earthquake-resistance analysis
In the process of dynamic calculation, safety factor development of every element,
excluding bed rock, concrete cut-off walls, wave wall and joints, has been completely
recorded throughout earthquake. The safety factor is defined as the ratio of shear strength
to shear stress (including both static and dynamic shear stress) of element potential failure
surface. As it to analyze the seismic safety of upstream and downstream, the anti-slide
stability coefficient is calculated on pseudo-static method. Sweden Slice Method is
adopted for slope stability analysis, where both horizontal and vertical seismic actions are
considered.
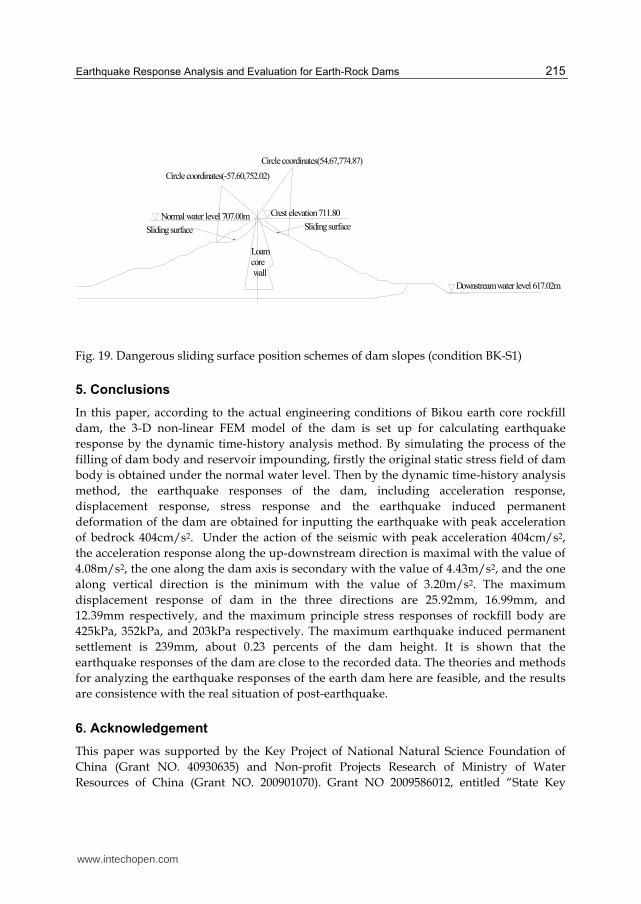
Calculation condition for slope anti-slide stability can be seen in Table 7. The smallest
safety factors of upstream and downstream slopes are shown as in Table 8, and the
potential sliding surfaces are shown as in Fig.19. As the compacted earth dam design
specification (SL274-2001) says that the smallest anti-slide stability factor under seismic
action should be no less than 1.15. Under the condition BK-S1, slope stability of Bikou
dam cannot meet the present criterion. However, on the conclusion of Bikou station
injuring survey under “5.12” Wenchuan earthquake and its initial analysis report, only
some joints connecting crest and body to embankment were damaged and needed
amending, yet the whole dam was safe in general. Under the seismic action, safety factor
of Bikou dam does not satisfy demand, however, the dam did not suffer from sliding or
slope instability during the “5.12” Wenchuan earthquake. So, it is suggested that smaller
safety factors should be adopted. For example, a level 2 dam has a safety factor ranging
from 1.05 to 1.10. In a word, the safety factor distribution suggests that the Bikou dam has
some partial scopes where the factors are less than 1 near the crest and upstream and
downstream slopes. But the scales are sporadic and will not lead the failure of dam
slopes.
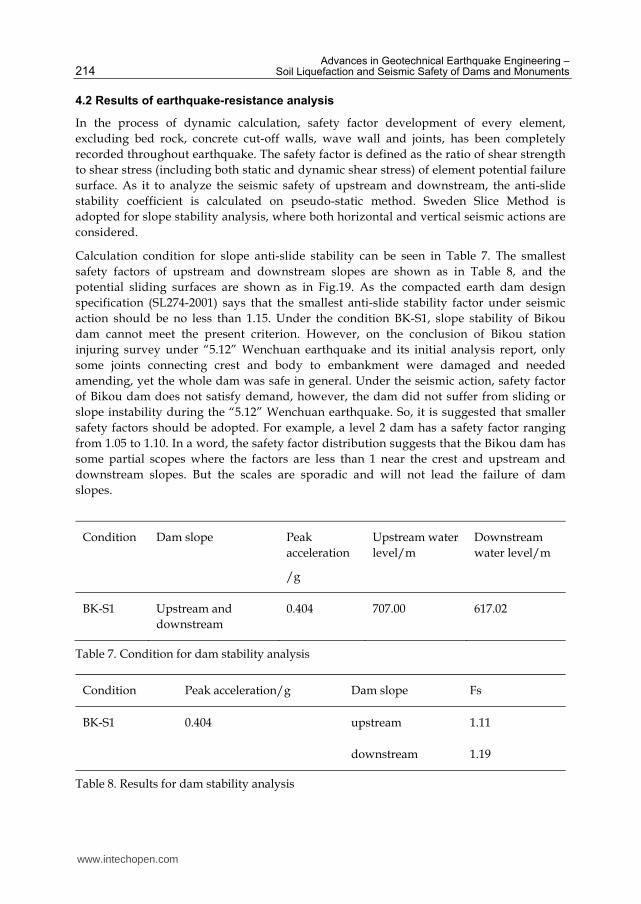
Condition Dam slope Peak
acceleration
/g
Upstream water
level/m
Downstream
water level/m
BK-S1 Upstream and
downstream
0.404 707.00 617.02
Table 7. Condition for dam stability analysis
Condition Peak acceleration/g Dam slope Fs
BK-S1 0.404 upstream 1.11
downstream 1.19
Table 8. Results for dam stability analysis
www.intechopen.com
Earthquake Response Analysis and Evaluation for Earth-Rock Dams
215
Circle coordinates(-57.60,752.02)
Circle coordinates(54.67,774.87)
Downstream water level 617.02m
Crest elevation 711.80Normal water level 707.00m
Sliding surface
Loamcore
wall
Sliding surface
Fig. 19. Dangerous sliding surface position schemes of dam slopes (condition BK-S1)
5. Conclusions
In this paper, according to the actual engineering conditions of Bikou earth core rockfill
dam, the 3-D non-linear FEM model of the dam is set up for calculating earthquake
response by the dynamic time-history analysis method. By simulating the process of the
filling of dam body and reservoir impounding, firstly the original static stress field of dam
body is obtained under the normal water level. Then by the dynamic time-history analysis
method, the earthquake responses of the dam, including acceleration response,
displacement response, stress response and the earthquake induced permanent
deformation of the dam are obtained for inputting the earthquake with peak acceleration
of bedrock 404cm/s2. Under the action of the seismic with peak acceleration 404cm/s2,
the acceleration response along the up-downstream direction is maximal with the value of
4.08m/s2, the one along the dam axis is secondary with the value of 4.43m/s2, and the one
along vertical direction is the minimum with the value of 3.20m/s2. The maximum
displacement response of dam in the three directions are 25.92mm, 16.99mm, and
12.39mm respectively, and the maximum principle stress responses of rockfill body are
425kPa, 352kPa, and 203kPa respectively. The maximum earthquake induced permanent
settlement is 239mm, about 0.23 percents of the dam height. It is shown that the
earthquake responses of the dam are close to the recorded data. The theories and methods
for analyzing the earthquake responses of the earth dam here are feasible, and the results
are consistence with the real situation of post-earthquake.
6. Acknowledgement
This paper was supported by the Key Project of National Natural Science Foundation of
China (Grant NO. 40930635) and Non-profit Projects Research of Ministry of Water
Resources of China (Grant NO. 200901070). Grant NO 2009586012, entitled “State Key
www.intechopen.com

Advances in Geotechnical Earthquake Engineering – Soil Liquefaction and Seismic Safety of Dams and Monuments
216
Laboratory of Hydrology-Water Resources and Hydraulic Engineering” provided partial
support for this work.
7. References
Ahmed-Waeil, M. E., & Ramana, V. G. (1993). Dynamic behaviour and seismic response of
El Infiernillo dam. Earthquake Engineering & Structural Dynamics, 1993, Volume 22
Issue 8, pp. 665-684
Ahmed-Waeil, M. E., Ronald, F. S., Mohamed, F. S., et al. (1990). La Villita Dam
Response During Five Earthquakes Including Permanent Deformation. Journal
of Geotechnical Engineering (ASCE), Vol.116, No.10, October 1990, pp. 1443-
1462
Cao, Z. Z., Youd, T. L., and Yuan X. M. (2011). Gravelly soils that liquefied during 2008
Wenchuan, China earthquake, Ms=8.0, Soil Dynamics and Earthquake Engineering,
2011, Vol. 31, pp.1132-1143.
Cascone, E., & Rampello, S. (2003). Decoupled seismic analysis of an earth dam, SOIL
DYNAMICS AND EARTHQUAKE ENGINEERING, 2003, Vol. 23, pp.349-
365
Chen, H. Q., Xu, Z. P., and Lee, M. (2008). Wenchuan Earthquake and seismic safety of
large dams, Journal of Hydraulic Engineering, 2008, Vol.39, No.10, pp.1158-
1167
Chen, L. Y., & Talwani, P. (1998). Reservoir-induced seismicity in China, PURE AND
APPLIED GEOPHYSICS, 1998, Vol. 153, No. 1, pp.133-149
Duncan, J. M., and Chang, C. Y. (1970). Nonlinear analysis of stress and strain in soil,
Journal of the Soil Mechanics and Foundation Division, ASCE, 96(SM5), pp.l629-
l653
Elia, G., Amorosi, A., Chan A, H. C., et al. (2011). Fully coupled dynamic analysis of an
earth dam, GEOTECHNIQUE, 2011, Vol.61, pp.549-563
Gu, G. C. (1989). Earthquake Engineering for Earth-rock Dams, Hohai University Press, Nanjing
, 1989
Hardin, B. O., & Denevich, V. P. (1972). Shear moduls and damping in soil: design equations
and curves. ASCE, 98 (SM7), pp.667-92
Hardin, B. O., & Denevich, V. P. (1972). Shear modulus and damping in soil: measurements
and parameter effects. ASCE, 98 (SM6), pp.603-624
Idriss, I. M., Lysmer, J., Huang, R., et al. (1973), A computer program for evaluating the
seismic response of soil structures by variable damping finite element procedures,
Berkeley, College of Engineering University of California.
Kenneth, G. (2011). Dermatology Aboard the USNS COMFORT: Disaster Relief
Operations in Haiti After the 2010 Earthquake, Dermatologic Clinics, 2011, Vol. 29,
No.1, pp.15-19
Kuwano, J., & Ishihara, K. (1988). Analysis of permanent deformation of earth dams due to
earthquake, Soils and Foundations, Vol, 28(01), pp.41-55
Lin, P., Wang, R. K., and Li, Q. B. (2009). Effect Analysis of Structural Safety of Typical Large
Dams in Wenchuan 8.0 Earthquake, Chinese Journal of Rock Mechanics and
Engineering, 2009,Vol.28, No.6, pp. 1261~1268
www.intechopen.com
Earthquake Response Analysis and Evaluation for Earth-Rock Dams
217
Mejia, L. H. (1981). Three dimensional dynamic response analysis of earth dam, Report No.
UCB/EERC-81/15. Berkeley, University of California
Mejia, L. H., Seed, H. B., & Lysmer, J. (1982). Dynamic analysis of earth dams in three
dimensions, Journal Geotechnical Engineering Division (ASCE), 1982, 108(GT12), pp.
1354-1376
Pan, R. Y. (2009). Analysis of the recheck of the earthquake damage of Bikou Core Rockfill Dam,
Hohai University, Nanjing,2009
Pei, S. P., Su, J. R., Zhang, H. J., et al. (2010). Three-dimensional seismic velocity structure
across the 2008 Wenchuan Ms 8.0 earthquake, Sichuan, China, Tectonophysics, 2010,
Vol.491, pp.211-217
Serff, N., Seed, H. B., Makdisi, F. I., & Chang, C. K. (1976). Earthquake induced deformations
of earth dams, Report No. EERC/76-4, Earthquake Engineering Research Center,
University of California, Berkely, 1976
Shen, Z. Z., Wen, X.Y., and Lv, S.X. (2006). Analysis of earthquake responses for Jiudianxia
concrete face rockfill dam, L. Berga et al eds, Dams and Reservoirs, Societies and
Environment in the 21st Century, Published by Taylor & Francis/Balkema, London,
2006, Vol. 1, pp.925–930
Shen, Z. Z., Xu, L.Q., and Wang, W. (2010). Earthquake response of Xika concrete face
rockfill dam by EFM, Engineering, Science, Construction, and Operations in Challenging
Environments, 2010 ASCE, pp.463-472
Takewaki, I., Murakami, S., Fujita, K., et al. (2011). The 2011 off the Pacific coast of Tohoku
earthquake and response of high-rise buildings under long-period ground motions,
Soil Dynamics and Earthquake Engineering, 2011, (In press)
Talwani, P. (1997). On the nature of reservoir-induced seismicity, PURE AND APPLIED
GEOPHYSICS, 1997, Vol. 150, pp.473-492
Taniguchi,E., Whiteman, R.V., & Warr, W. A. (1983). Prediction of earthquake induced
deformation of earth dams, Soils and Foundations, 1983, Vol. 23(4)
Wang, W. X., Sun, W. K., and Jiang, Z. S. (2010). Comparison of fault models of the 2008
Wenchuan earthquake (Ms8.0) and spatial distributions of co-seismic deformations,
Tectonophysics, 2010, Vol.491, pp.85-95
Xenaki, V. C., & Athanasopoulos, G. A. (2008). Dynamic properties and liquefaction
resistance of two soil materials in an earthfill dam - Laboratory test results,
SOIL DYNAMICS AND EARTHQUAKE ENGINEERING, 2008, Vol. 28, pp. 605-
620
Yu, H. Y., Wang, D., Yang, Y.Q., et al. (2009). The preliminary analysis of strong ground
motion records from the Ms 8.0 Wenchuan Earthquake. Journal of Earthquake
Engineering and Engineering Vibration, 2009, Vol.29, No.1, pp.1~13
Zeghal, M., & Abdel-Ghaffar, A. M. (2009). Evaluation of the Nonlinear Seismic Response of
an Earth Dam: Nonparametric System Identification, JOURNAL OF EARTHQUAKE
ENGINEERING, 2009, Vol.2009. pp. 384-405
Zhou, J. P., Yang, Z. Y., Fan, J. X., et al. (2009). Seismic Damage Investigation on Large and
Medium Sized Hydropower Projects in Wenchuan Earthquake Area. Chinese
Journal of Water Power, 2009,Vol.35,No.5, pp.1-6
www.intechopen.com

Advances in Geotechnical Earthquake Engineering – Soil Liquefaction and Seismic Safety of Dams and Monuments
218
Zhu, S., Wen, S.Q., and Huang, Y. M. (2003). Deformation and Stress Calculation for A
200m High CFRD, Journal of Hohai University (Natural Sciences ) ,2003, 31(6):631-
634
www.intechopen.com

Advances in Geotechnical Earthquake Engineering - SoilLiquefaction and Seismic Safety of Dams and MonumentsEdited by Prof. Abbas Moustafa
ISBN 978-953-51-0025-6Hard cover, 424 pagesPublisher InTechPublished online 10, February, 2012Published in print edition February, 2012
InTech EuropeUniversity Campus STeP Ri Slavka Krautzeka 83/A 51000 Rijeka, Croatia Phone: +385 (51) 770 447 Fax: +385 (51) 686 166www.intechopen.com
InTech ChinaUnit 405, Office Block, Hotel Equatorial Shanghai No.65, Yan An Road (West), Shanghai, 200040, China
Phone: +86-21-62489820 Fax: +86-21-62489821
This book sheds lights on recent advances in Geotechnical Earthquake Engineering with special emphasis onsoil liquefaction, soil-structure interaction, seismic safety of dams and underground monuments, mitigationstrategies against landslide and fire whirlwind resulting from earthquakes and vibration of a layered rotatingplant and Bryan's effect. The book contains sixteen chapters covering several interesting research topicswritten by researchers and experts from several countries. The research reported in this book is useful tograduate students and researchers working in the fields of structural and earthquake engineering. The bookwill also be of considerable help to civil engineers working on construction and repair of engineering structures,such as buildings, roads, dams and monuments.
How to referenceIn order to correctly reference this scholarly work, feel free to copy and paste the following:
Zhenzhong Shen, Lei Gan, Juan Cui and Liqun Xu (2012). Earthquake Response Analysis and Evaluation forEarth-Rock Dams, Advances in Geotechnical Earthquake Engineering - Soil Liquefaction and Seismic Safety ofDams and Monuments, Prof. Abbas Moustafa (Ed.), ISBN: 978-953-51-0025-6, InTech, Available from:http://www.intechopen.com/books/advances-in-geotechnical-earthquake-engineering-soil-liquefaction-and-seismic-safety-of-dams-and-monuments/earthquake-response-analysis-and-safety-evaluation-for-earth-rock-dams

© 2012 The Author(s). Licensee IntechOpen. This is an open access articledistributed under the terms of the Creative Commons Attribution 3.0License, which permits unrestricted use, distribution, and reproduction inany medium, provided the original work is properly cited.
Recommended


![Drilling Rock and Earth[1]](https://img.pdfslide.net/doc/110x75/577cd9f01a28ab9e78a47b79/drilling-rock-and-earth1.jpg)