
How to Use Net Promoter to Drive Business Growth
by Deborah Eastman

Overview Net Promoter has become the industry standard customer loyalty measurement. Businesses see customer experience as an imperative. But is your organization doing it right? Learn the fundamentals of running a Net Promoter that delivers stronger relationships with customers who then buy more and bring their friends.
This ebook will provide guidance on structuring an effective Net Promoter program that drives business growth.

Deborah has spent her career with a passion for customer success. After 15 years of top sales performance, she has held a number of executive leadership positions in sales, marketing and consulting. As the Chief Customer Officer at Satmetrix, Deborah works across the organization to continuously innovate the customer experience, and deliver tangible value to Satmetrix clients. She brings firsthand experience at deploying a global Net Promoter program at KPMG Consulting where she integrated customer feedback into the strategic account management process. Working with customers across all industries, she brings breadth of experience to help organizations accelerate their program results.
Deborah is a frequent speaker and blogger on the topics of Net Promoter, Customer Experience, and Social Media. Previously, she was Executive Vice President of Sales & Marketing for Biz360, a social media company. Before Biz360, Deborah served as a Partner for KPMG Consulting and Vice President at BearingPoint. In 2000, Deborah was selected by Consulting Magazine as one of the top in her field for developing a partnership between KPMG and Cisco which resulted over $100m in incremental revenue and a billion dollar investment.
About the Author Deborah Eastman, Chief Customer Officer, Satmetrix

MARKET DYNAMICS
THE CUSTOMER JOURNEY
NET PROMOTER SUCCESS
Table of Contents

Market Dynamics

Creating an ultimate experience that appeals to both the heart and the head is our goal. Customers give their money, fans give their hearts.
44%
69%
of consumers say that majority of customer experiences are bland
of consumers say that emotions count for over half their experiences
2% 2% increase in customer retention has the same effect as decreasing costs by 10%
91% 91% of marketing leaders believe that in two years they will be competing primarily on the basis of the customer experience (Gartner)
5X Acquiring new customers can cost as much as 5X more than satisfying and retaining current customers

When Net Promoter came into the marketplace in 2004, social media was in its infancy. In the original research behind the Net Promoter methodology, the response to the question “How likely would you be to recommend [company] to a friend or colleague?” had the strongest correlation to financial growth. Recommendations have only become more important as social media has grown in reach and power.
Today, social media has high adoption, and plays a key role in how consumers and business interact with, and evaluate the companies they consider doing business with.
Facebook = 1.28 billion Twitter = 255 million LinkedIn = 287 million
U N I Q U E V I S I T O R S E A C H M O N T H
Recommendations Are More Important Than Ever

Organizations are increasingly looking beyond their customers’ individual purchases, and instead focusing on creating ongoing relationships with them.
Some examples:
Subscriptions Are the New Transactions
DOLLAR SHAVE CLUB
provides a subscription model for razor blades and shaving supplies
MASS AG E ENVY
allows customer to purchase a series of massages at a discount
AMAZON PRIME
the annual fee that entitles customers to free two-day shipping, prompting them to consider Amazon
first for online shopping

Do You Have Your Toothbrush Subscription Yet?Amazon also offers the opportunity to “subscribe” to many consumer goods that haven’t traditionally been purchased by that model. For example, buy a toothbrush on Amazon and you’ll likely be offered a chance to automatically receive more toothbrushes at pre-determined intervals. The accompanying discount might convince you to sign up. Now Amazon is your partner in dental health, and is building a relationship with you, rather than simply selling you a toothbrush.

Many new companies in the market, like Zappos, Airbnb, and Uber, offer innovative business models focused on radically improved, or radically different, customer experience.
Significant Disruptive Forces in the Market
1976 1994 1999 2008 2009

Established businesses often cite the difficulty of changing deeply ingrained, highly developed habits and approaches. But failing to innovate can have disastrous consequences: non-innovators may not be around to compete for much longer. Only 11% of the Fortune 500 from 1955 still exist, and the average time a company stays on the top 500 has declined from 75 years to 15 years. Change is inevitable.
Innovate or Die
What if Kodak, once the dominant player in camera film, had introduced an Instagram-like service? In that alternate reality, in which Kodak truly understood its customers’ interest in sharing photos online, it might be a very different company today. Instead, Instagram is the dominant player now. In just five
years, it has achieved an estimated market cap of $35 billion.
Kodak
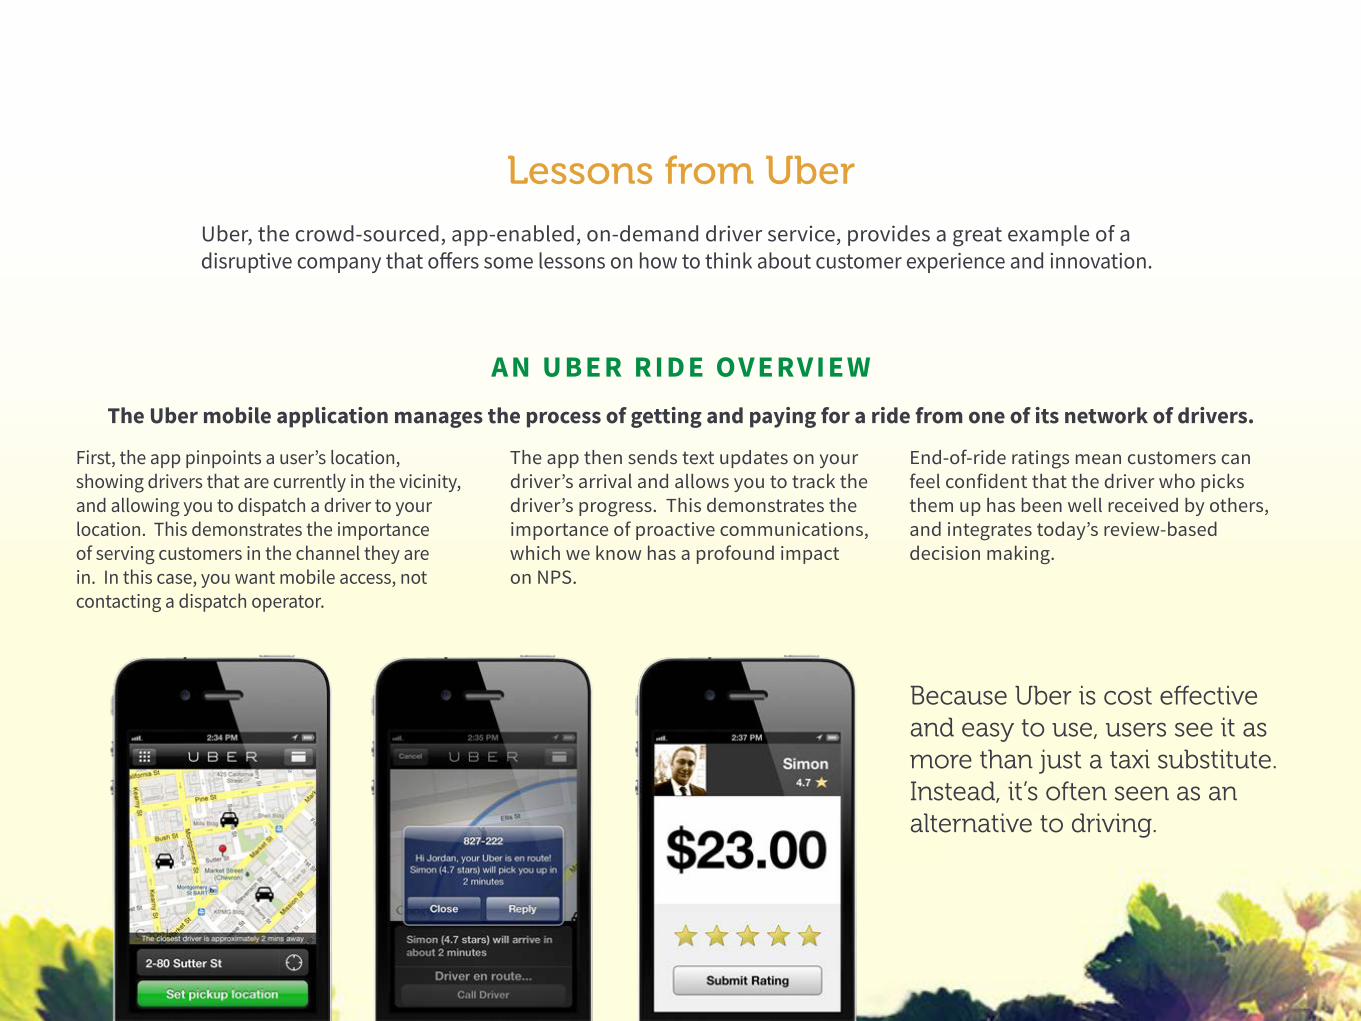
Uber, the crowd-sourced, app-enabled, on-demand driver service, provides a great example of a disruptive company that offers some lessons on how to think about customer experience and innovation.
Lessons from Uber
AN UBER RIDE OVERVIEWThe Uber mobile application manages the process of getting and paying for a ride from one of its network of drivers.
First, the app pinpoints a user’s location, showing drivers that are currently in the vicinity, and allowing you to dispatch a driver to your location. This demonstrates the importance of serving customers in the channel they are in. In this case, you want mobile access, not contacting a dispatch operator.
The app then sends text updates on your driver’s arrival and allows you to track the driver’s progress. This demonstrates the importance of proactive communications, which we know has a profound impact on NPS.
End-of-ride ratings mean customers can feel confident that the driver who picks them up has been well received by others, and integrates today’s review-based decision making.
Because Uber is cost effective and easy to use, users see it as more than just a taxi substitute. Instead, it’s often seen as an alternative to driving.

Founded in 2009, Uber has grown astronomically, achieving a market cap of $41 billion in less than 5 years. The value of technology startups like Uber have risen
three times faster today than a decade ago, according to Fortune magazine.
Business Performance to Envy
Uber illustrates the importance of looking at customer experience as a differentiator, no matter how old a company is.

TODAY’S APPROACHT RADI T I ONAL THINKING
Focus on Customer Lifetime Value
Customer lifetime value is defined by their annual spend, tenure, and word of mouth value.
Customer lifetime value was defined by how much they spent in the past.
As the market shifts, it’s more important than ever to focus on customer lifetime value, and even rethink the way we assign value to the relationship. This shift is especially important in a subscription economy.
The focus on retention, combined with the impact of word of mouth means it’s critical that customers have an experience that will keep them coming back, and prompt them to share positive stories.
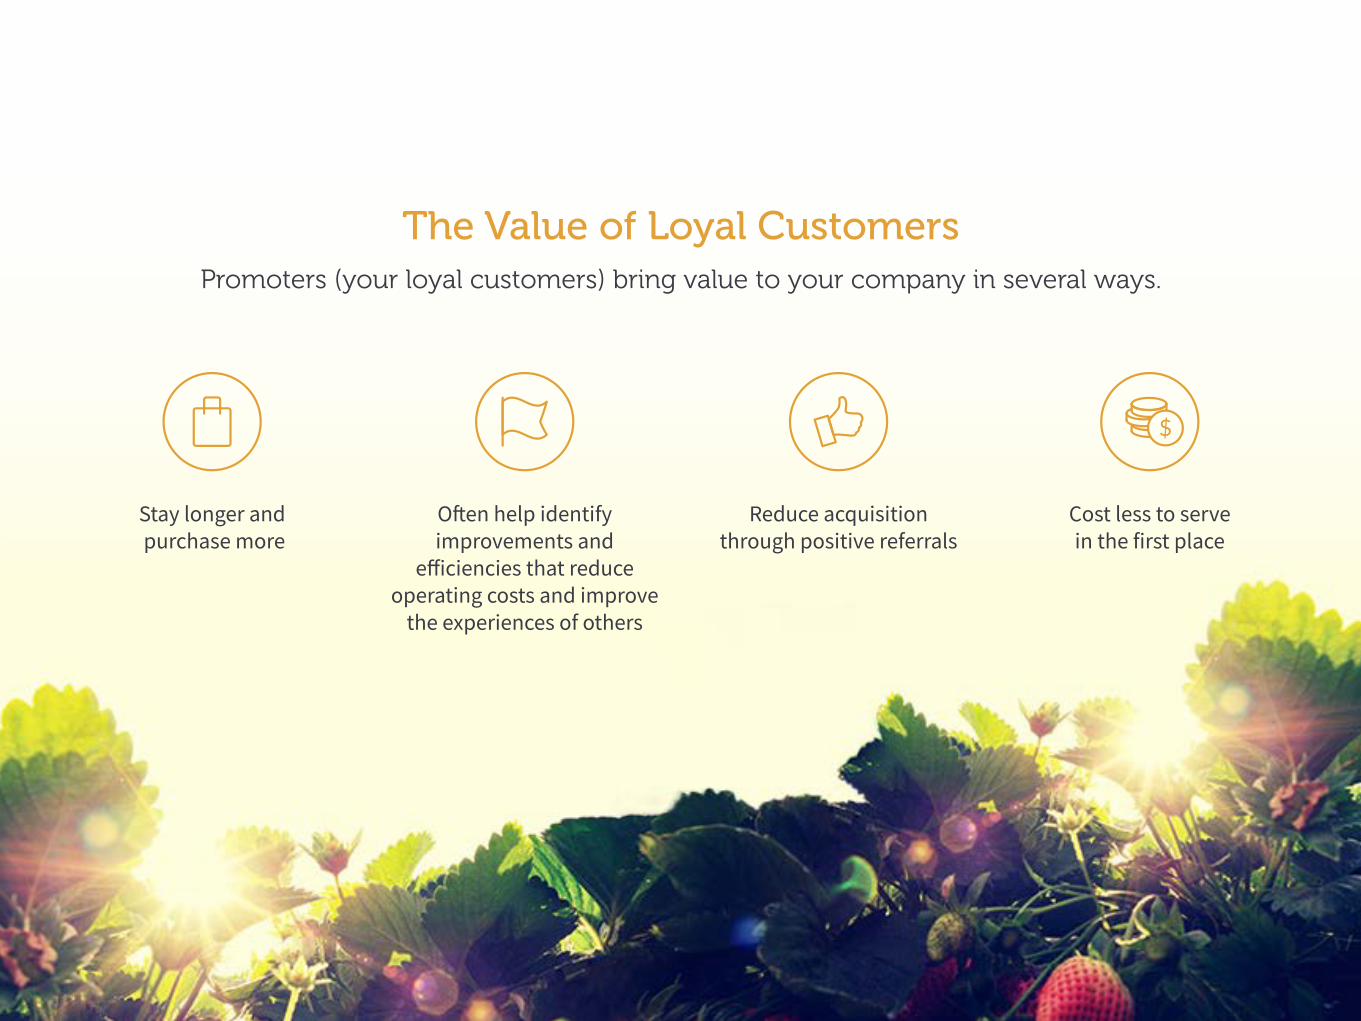
Stay longer and purchase more
Often help identify improvements and
efficiencies that reduce operating costs and improve
the experiences of others
The Value of Loyal CustomersPromoters (your loyal customers) bring value to your company in several ways.
Cost less to serve in the first place
Reduce acquisition through positive referrals
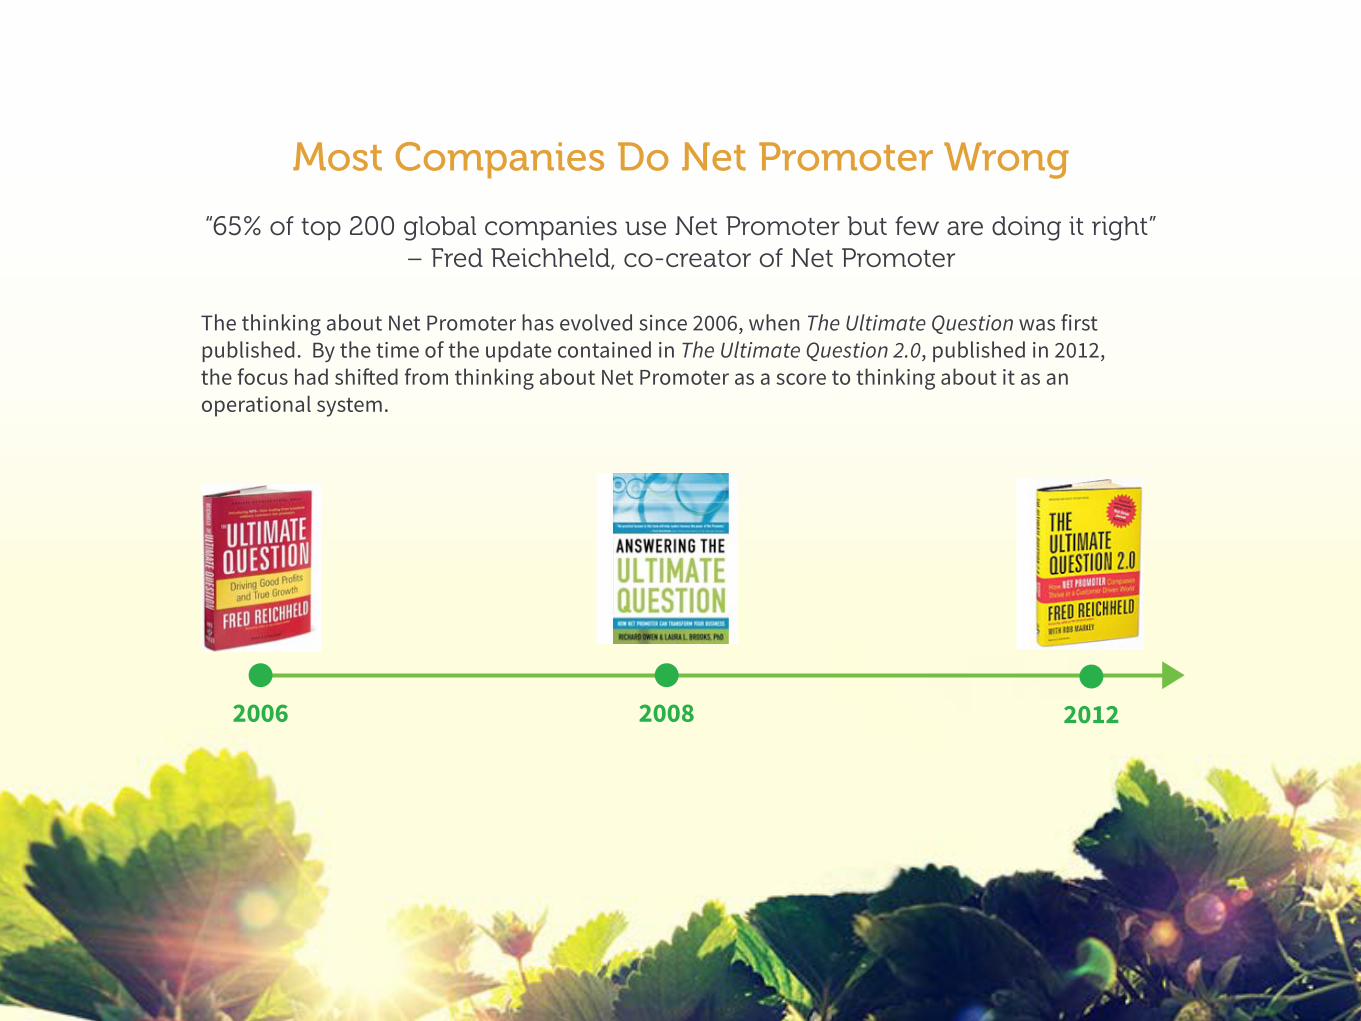
The thinking about Net Promoter has evolved since 2006, when The Ultimate Question was first published. By the time of the update contained in The Ultimate Question 2.0, published in 2012, the focus had shifted from thinking about Net Promoter as a score to thinking about it as an operational system.
Most Companies Do Net Promoter Wrong
2006 2008 2012
“65% of top 200 global companies use Net Promoter but few are doing it right” – Fred Reichheld, co-creator of Net Promoter

It’s the Action, Not the MeasurementWeight loss goals are never achieved just by getting on the scale. Similarly, thinking about Net Promoter as simply a score, without changing the way you actually do business, will never improve customer loyalty and the resulting profitable growth.

The Customer
Journey

To create promoters who will help your company thrive, you need to manage their experience across the entire customer journey.
At the same time, managing the journey is more complex than ever. You need to consider several factors that affect the customer experience.
Customers expect to be seamlessly served in multiple channels; whether mobile, call centers, web, or branch operations.
Many experiences rely on the behavior of frontline employees. Yet, often they are not trained, are not the right employees, or are not empowered to deliver a positive customer experience.
Operational metrics are designed for efficiency, but can work against creating positive customer experiences. Organizations need to understand the impact of operational metrics on the experience and will often find ways to create more promoters AND reduce costs.
Many organizations have disparate IT systems that can slow down or complicate the customer journey in needless and frustrating ways.
Handoffs between departments can be challenging and create a negative customer experience. Break down the organizational silos to deliver a positive experience across the journey.
MULTI-CHANNEL SERVICE
EMPLOYEE BEHAVIOR
OPERATIONAL METRICS
IT SYSTEMS
ORGANIZATIONAL SILOS
Manage the Journey to Create Promoters

The journey your customers take may vary a bit, but most customer journeys follow this general sequence.
Defining a Customer Journey

Net Promoter was designed to evaluate the entire customer journey, across all its phases, and all its channels, including the web, physical locations, call
centers, and even channel partners.
NPS: See the Whole Journey
Relationship or brand NPS helps you measure the entire customer experience and understand which points of interaction are the moments of truth that define the creation of promoters.
Relationship NPS is the measure to link to financial outcomes such as retention, repurchase, and referrals. This will also provide an understanding of the key drivers of your Net Promoter score so that you can prioritize your investment of resources.

Once you have identified the moments of truth in your customer experience and prioritized your areas of focus, you’ll need transactional measures to help you improve the daily operations of the business that drive your Net
Promoter Score.
Transactional Measures Drive Improvements
You might measure relationship NPS quarterly, or twice a year, or even annually, but what’s important is that you embed customer-centric behavior in every day operations. Do this by identifying those key moments of truth along the journey and creating transactional measures that help your monitor your performance at those particular points.
Transactional measures help you:• Improve operations day to day• Engage employees and drive customer centric behaviors
Consider Your Information Consumers
Who are the business leaders that need regular access to data about customer experience? What information do they need? How frequently? In what format?
Providing enterprise-wide access to customer experience data helps ensure that it is held to the same standards, and accorded the same level of importance as financial and operational metrics. Employees get regular feedback and the opportunity to improve. Operational leaders quickly identify performance gaps and continuously improve the experience.
Failing to engage leaders from the front office and the back office could create a drag on your Net Promoter performance. If department leaders don’t have access to data about customer experience, how can they improve?

Net Promoter
Success

Pillars of Success
Experience Metrics | Improvement Insights | Action Framework
HOL DI NG UP PROGRAM SUCCESS ARE THREE KEY PILLARS:
Customer experience programs, including those based on Net Promoter, rely on executive commitment and accountability, and they rest on a foundation of program structure and technology.
BUSINESS OBJECTIVE: EXECUTIVE COMMITMENT
PROGRAM FOUNDATION: TECHNOLOGY, COMMUNICATION, CHANGE MANAGEMENT
EXPERIENCE METRICS
Connected to Journey
Segments That Matter
Right Data, Right Time
IMPROVEMENT INSIGHTS
Enterprise Adoption
Operational Integration
Customer Economics
ACTION FRAMEWORK
Smart Closed Loop
Promoter Development
Governance

Does Your Score Reflect Your Business?A successful program relies on a high quality data. To make sure your Net Promoter
Score is an accurate reflection of your business, evaluate these key elements:
Response Rates
Customer Segments
Decision Makers Vs. Influencers
(For B2B)
Same-Respondent Trends
Percentage Of Transactions
Evaluated
E X P E R I E N C E M E T R I C S

Response Rates: Keep Them HighResponse rates provide a key indicator of your customer engagement. If you have a high
Net Promoter score, but low response rates, you may have a false sense of security.
E X P E R I E N C E M E T R I C S
AIM FOR:
20% response rates are a good goal in B2C >30% in B2B
+

Make sure your data represents the customer segments that matter most. Then be sure that your customer data aligns properly to those higher value segments, so that less important demographics, geographies, customer types, or other segments do not drown out the voice of the customers that drive growth.
E X P E R I E N C E M E T R I C S
Customers Per Segment

Decision Makers vs. InfluencersIn B2B, balancing data gathered from influencers and decision makers is key to getting an accurate picture of your business. Often data gathered by B2B businesses includes an overrepresentation of
end users who have little to no influence over purchase decisions. That means that drawing financial linkages with NPS scores will be difficult, if not impossible.
E X P E R I E N C E M E T R I C S

Same-Respondent TrendsSame-respondent responses, meaning those received from the same contact person from survey
to survey, provide accurate insight into improvement trends, particularly in B2B. A low rate of same-respondent responses may lead you to believe you have improved, when in fact, it’s due
to a different customer sample.
Example: Are many of your responses from new customers? Your score might be artificially high as it reflects the “honeymoon phase” of the customer relationship. By contrast, adequate same-
respondent responses give a more reliable picture of your company’s performance year over year.
E X P E R I E N C E M E T R I C S

If you are conducting transactional surveys, what percentage of your transactions are represented by your survey data? If the percentage is very small, you might not be getting an accurate picture of that touch point in the customer journey.
If needed, consider ways to increase response rates at a particular touch point so that your transactional surveys serve their purpose of driving day-to-day improvements.
E X P E R I E N C E M E T R I C S
Percentage of Transactions Represented

Drive Action with Role-Specific InsightReporting and analytics provide the most fuel for improvement when they are targeted to business segments in a way that supports each segments particular needs. Make sure your business leaders
have information that’s relevant to them. An overall Net Promoter Score of 35 isn’t useful to a business leader who doesn’t understand the connection to that line of business.
Each business area might need a different set of alerts, push reports, and role-specific dashboards. Here are some example areas of interest by business role.
I M P R O V E M E N T I N S I G H T S
CALL CENTER
Performance by Center
Agent Performance
Closed Loop Management
Experience Gaps
SERVICE LEADERS
Performance by Region
TechnicianPerformance
Closed Loop Management
Experience Gaps
PRODUCTLEADERS
NPS by Product
Experience Gaps
Promoter Engagement
Supportability
SALES TEAMS
Account Health
Journey Performance
ReferencePrograms
Revenue Risk
MARKETING
NPS by Segment
Brand Attributes
Promoter Activation
Competitive Performance

Example: The Call CenterBusiness leaders in different areas have different needs – think about the insight they need to drive improvements. Consider call centers.
• Are some call centers performing better than others?• How can I learn from the best performers and address the low performers?
• Are my managers following the defined closed loop process?• What am I learning from closed loop processes?
• What coaching is needed to make every agent successful?
I M P R O V E M E N T I N S I G H T S
CALL CENTER
Performance by Center
Agent Performance
Closed Loop Management
Experience Gaps
SERVICE LEADERS
Performance by Region
TechnicianPerformance
Closed Loop Management
Experience Gaps
PRODUCTLEADERS
NPS by Product
Experience Gaps
Promoter Engagement
Supportability
SALES TEAMS
Account Health
Journey Performance
ReferencePrograms
Revenue Risk
MARKETING
NPS by Segment
Brand Attributes
Promoter Activation
Competitive Performance
• Where are my experience gaps? How can I prioritize my improvement initiatives?
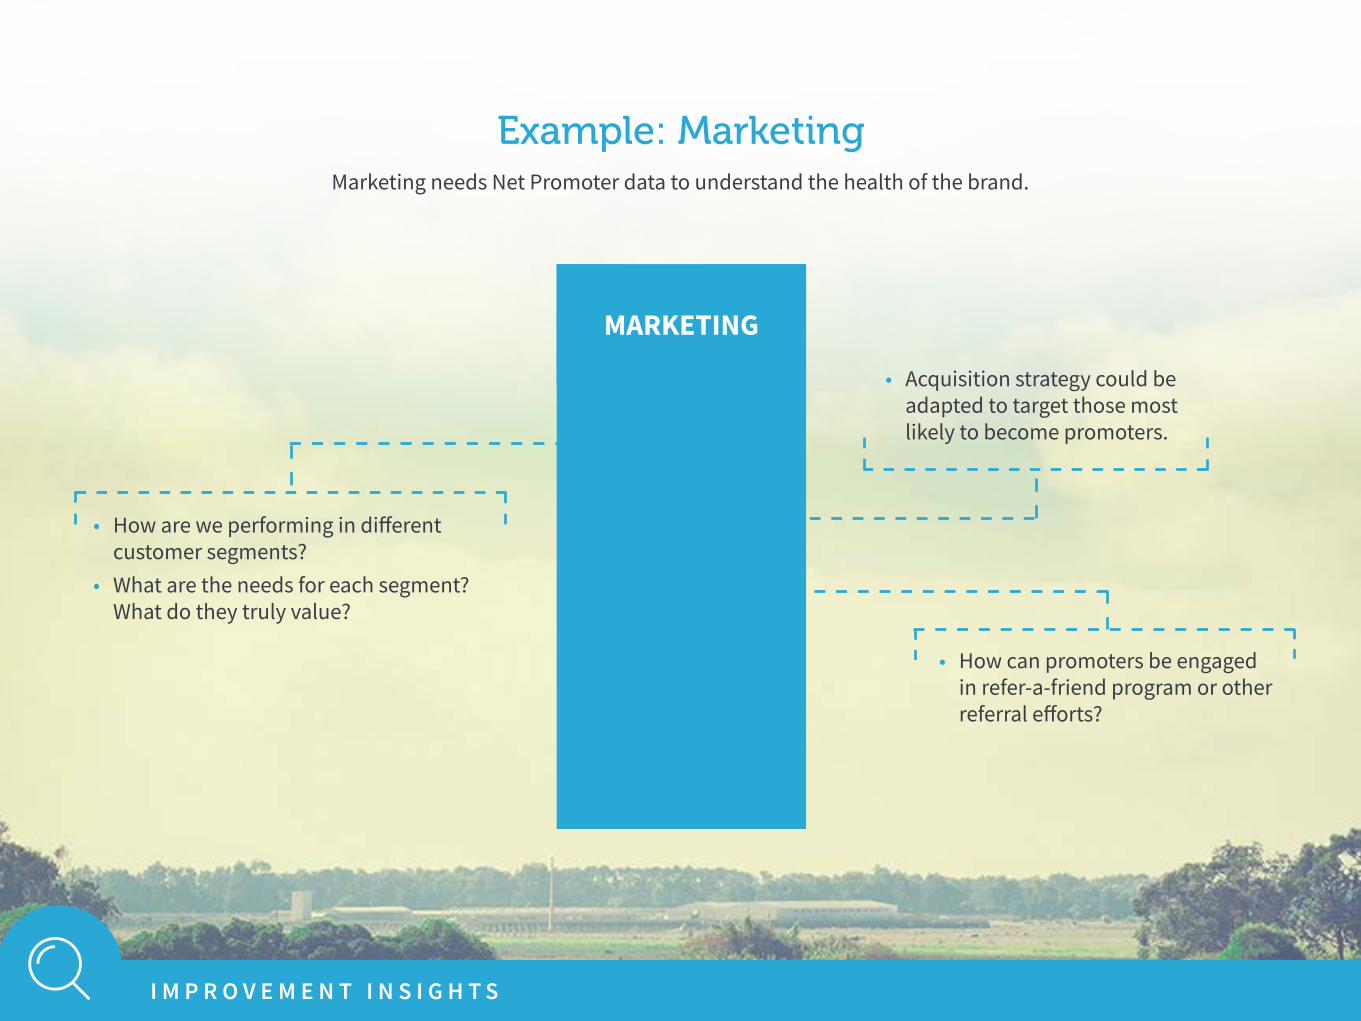
Example: MarketingMarketing needs Net Promoter data to understand the health of the brand.
• How are we performing in different customer segments?• What are the needs for each segment? What do they truly value?
• How can promoters be engaged in refer-a-friend program or other referral efforts?
• Acquisition strategy could be adapted to target those most likely to become promoters.
I M P R O V E M E N T I N S I G H T S
CALL CENTER
Performance by Center
Agent Performance
Closed Loop Management
Experience Gaps
SERVICE LEADERS
Performance by Region
TechnicianPerformance
Closed Loop Management
Experience Gaps
PRODUCTLEADERS
NPS by Product
Experience Gaps
Promoter Engagement
Supportability
SALES TEAMS
Account Health
Journey Performance
ReferencePrograms
Revenue Risk
MARKETING
NPS by Segment
Brand Attributes
Promoter Activation
Competitive Performance
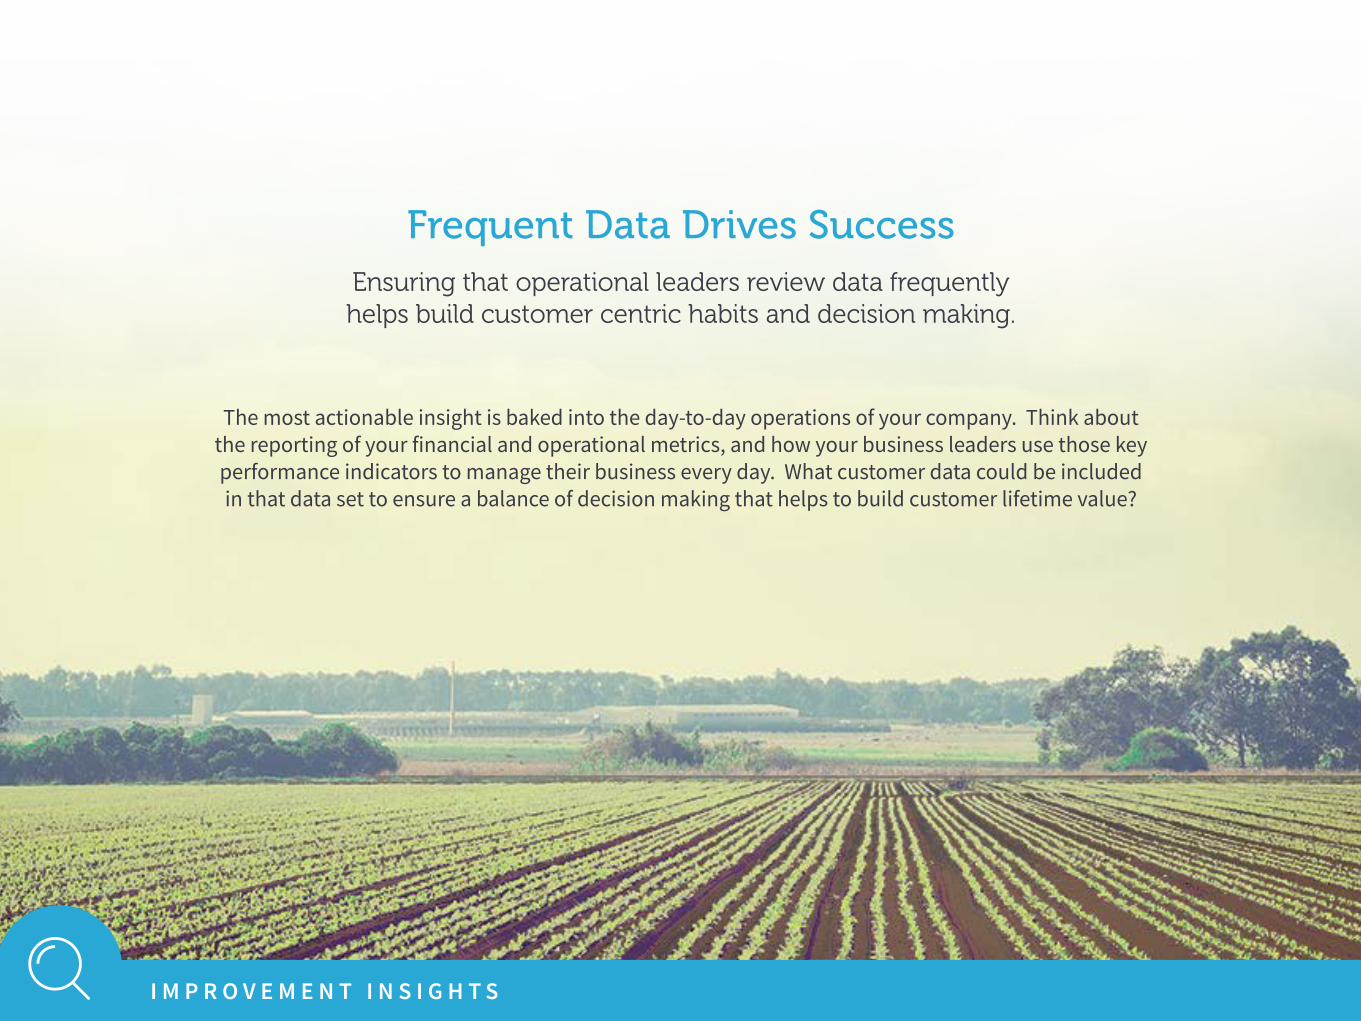
Frequent Data Drives Success
The most actionable insight is baked into the day-to-day operations of your company. Think about the reporting of your financial and operational metrics, and how your business leaders use those key performance indicators to manage their business every day. What customer data could be included in that data set to ensure a balance of decision making that helps to build customer lifetime value?
I M P R O V E M E N T I N S I G H T S
Ensuring that operational leaders review data frequently helps build customer centric habits and decision making.
A C T I O N F R A M E W O R K
FRONTLINE
Service Recovery
Root Cause Learning
Build Relationships
Mobilize Promoters
CLOSE D LOOP
BUSINESS LEADERS
Functional Actions
Team Performance
REGION TEAMS
Cross Functional Actions
Regional Actions
B2B ACCOUNT TEAMS
Account Development
Root Cause Learning
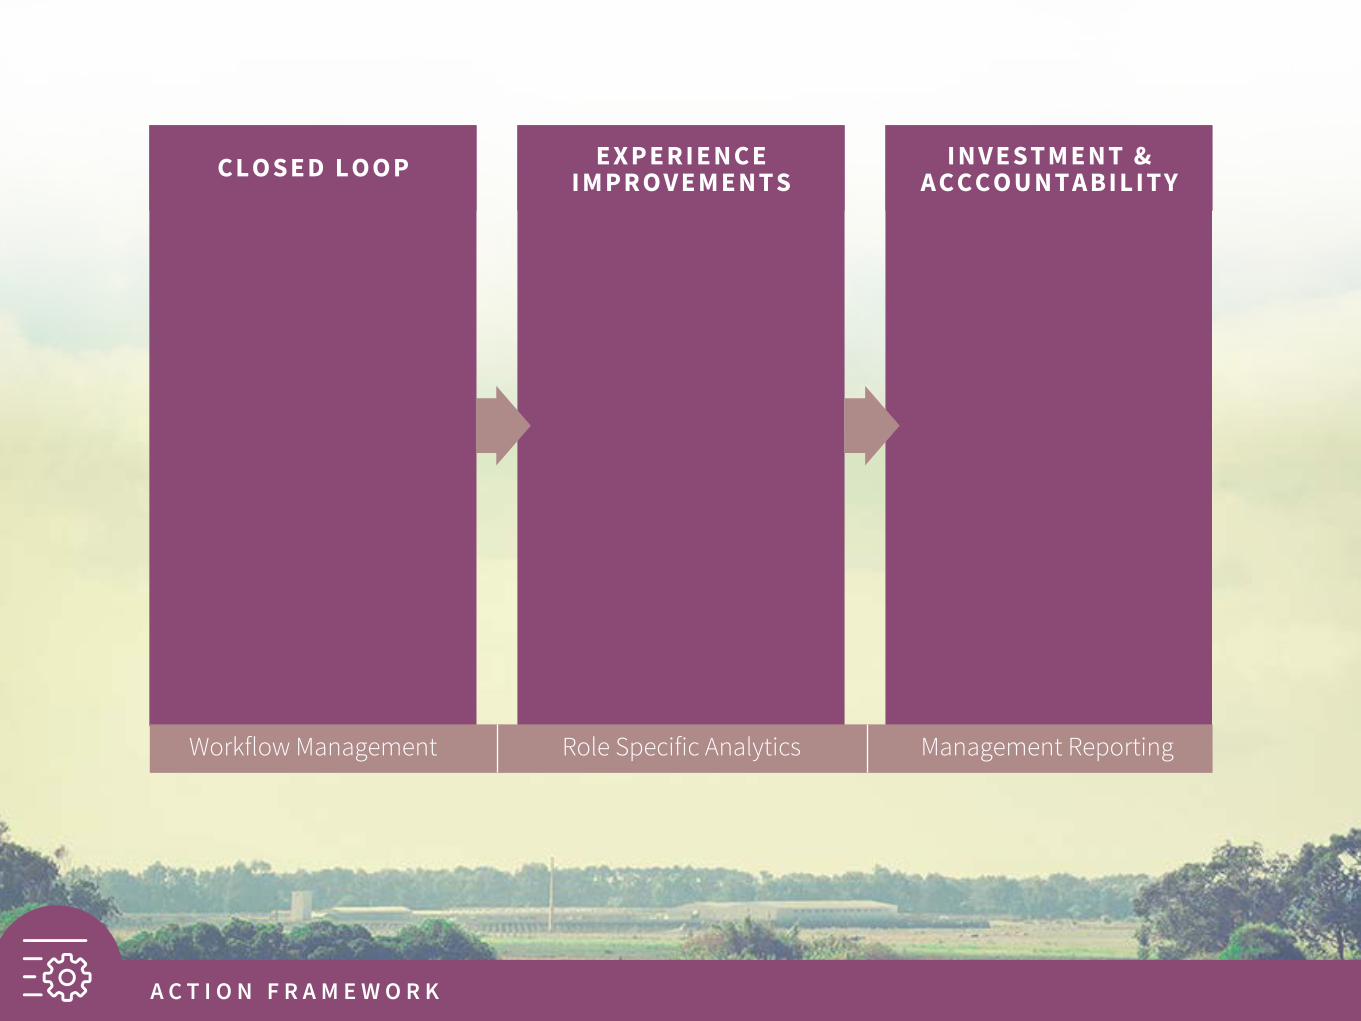
EXPERIENCE IMPROVEMENTS
EXECUTIVES
Drivers of Loyalty
Financial Linkage
Recognition
INVESTMENT & ACCCOUNTABILITY
Workflow Management Role Specific Analytics Management Reporting

Establish an Action Framework: Begin at the FrontlineAn action framework starts with the frontline. There, your closed loop process can help with service recovery (especially in high value customer segments), but it also supports learning about the root cause of issues by going under the hood. The closed loop process is also a great chance to enhance relationships with key customers, and in all settings, you have an opportunity to mobilize your promoters on your behalf.
The closed loop process, as managed by your frontline, is really about workflow management: gathering and documenting insight, solving immediate concerns, and cementing relationships.
A C T I O N F R A M E W O R K
FRONTLINE
Service Recovery
Root Cause Learning
Build Relationships
Mobilize Promoters
CLOSE D LOOP
BUSINESS LEADERS
Functional Actions
Team Performance
REGION TEAMS
Cross Functional Actions
Regional Actions
B2B ACCOUNT TEAMS
Account Development
Root Cause Learning
EXPERIENCE IMPROVEMENTS
EXECUTIVES
Drivers of Loyalty
Financial Linkage
Recognition
INVESTMENT & ACCCOUNTABILITY
Workflow Management Role Specific Analytics Management Reporting
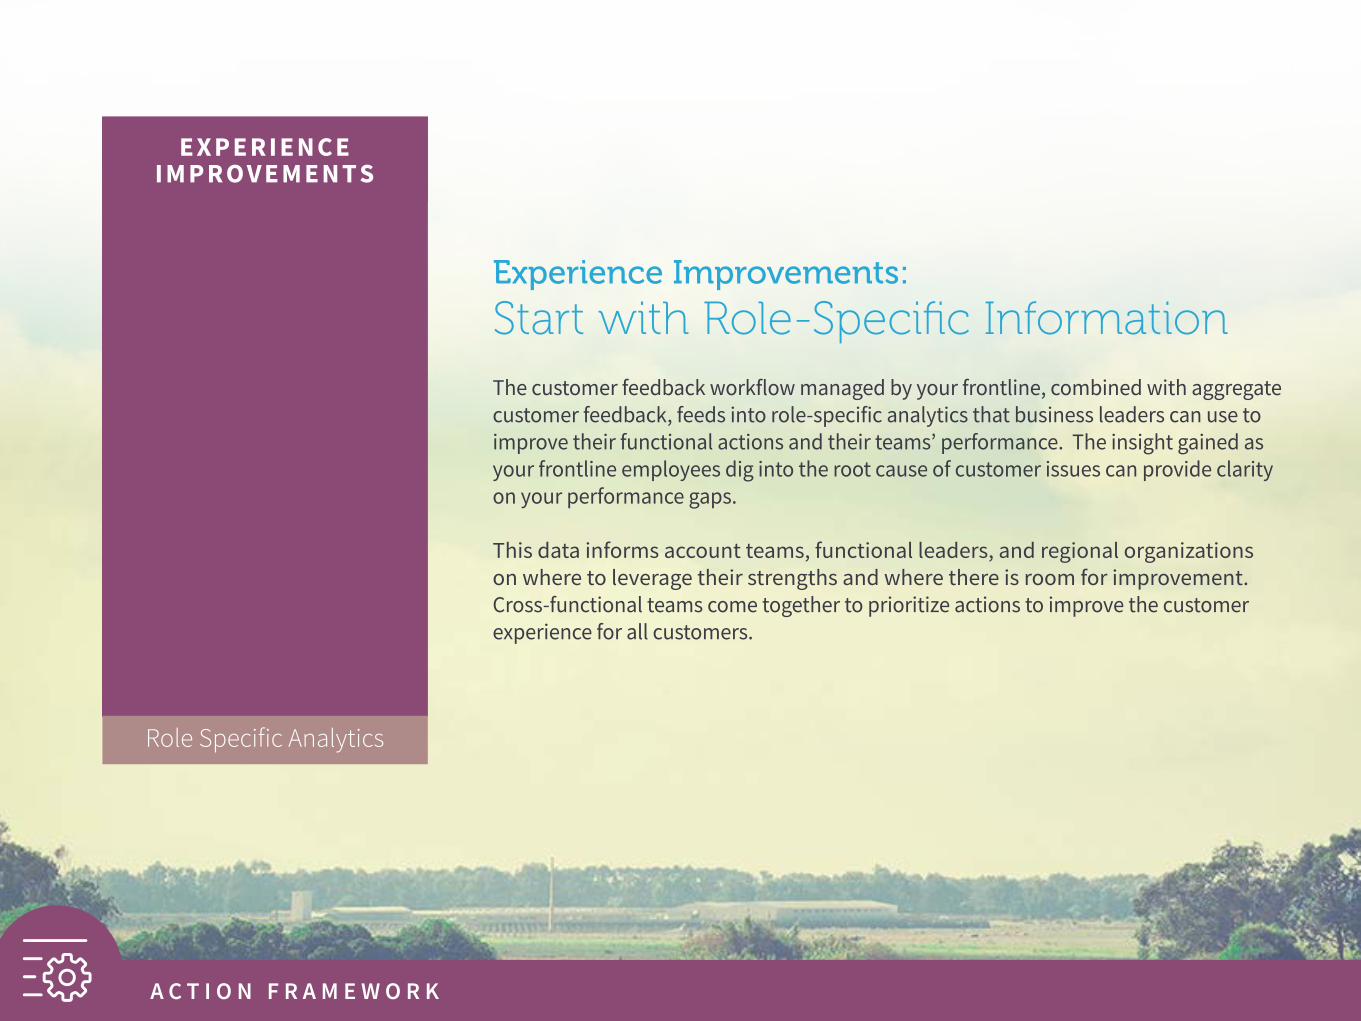
Experience Improvements: Start with Role-Specific InformationThe customer feedback workflow managed by your frontline, combined with aggregate customer feedback, feeds into role-specific analytics that business leaders can use to improve their functional actions and their teams’ performance. The insight gained as your frontline employees dig into the root cause of customer issues can provide clarity on your performance gaps.
This data informs account teams, functional leaders, and regional organizations on where to leverage their strengths and where there is room for improvement. Cross-functional teams come together to prioritize actions to improve the customer experience for all customers.
A C T I O N F R A M E W O R K
FRONTLINE
Service Recovery
Root Cause Learning
Build Relationships
Mobilize Promoters
CLOSED LOOP
BUSINESS LEADERS
Functional Actions
Team Performance
REGION TEAMS
Cross Functional Actions
Regional Actions
B2B ACCOUNT TEAMS
Account Development
Root Cause Learning
E XPE RIENCE IMPROVE ME NTS
EXECUTIVES
Drivers of Loyalty
Financial Linkage
Recognition
INVESTMENT & ACCCOUNTABILITY
Workflow Management Role Specific Analytics Management Reporting
Investment and Accountability: Give Executives What They NeedMost importantly, executives use customer data and recommendations from their teams to prioritize investments that drive higher levels of customer loyalty. By linking customer feedback with financial data, you’ll be better able to build an economic model that supports an effective business case for change.
Executives also use customer data to recognize employees who do an exceptional job of delivering a superior experience to customers, and therefore building the customer-centric culture that is everyone’s goal.
A C T I O N F R A M E W O R K
FRONTLINE
Service Recovery
Root Cause Learning
Build Relationships
Mobilize Promoters
CLOSED LOOP
BUSINESS LEADERS
Functional Actions
Team Performance
REGION TEAMS
Cross Functional Actions
Regional Actions
B2B ACCOUNT TEAMS
Account Development
Root Cause Learning
E X PERI ENC E IMPROVEMEN T S
EXECUTIVES
Drivers of Loyalty
Financial Linkage
Recognition
INVE STME NT & ACCCOUNTABILITY
Workflow Management Role Specific Analytics Management Reporting
A C T I O N F R A M E W O R K
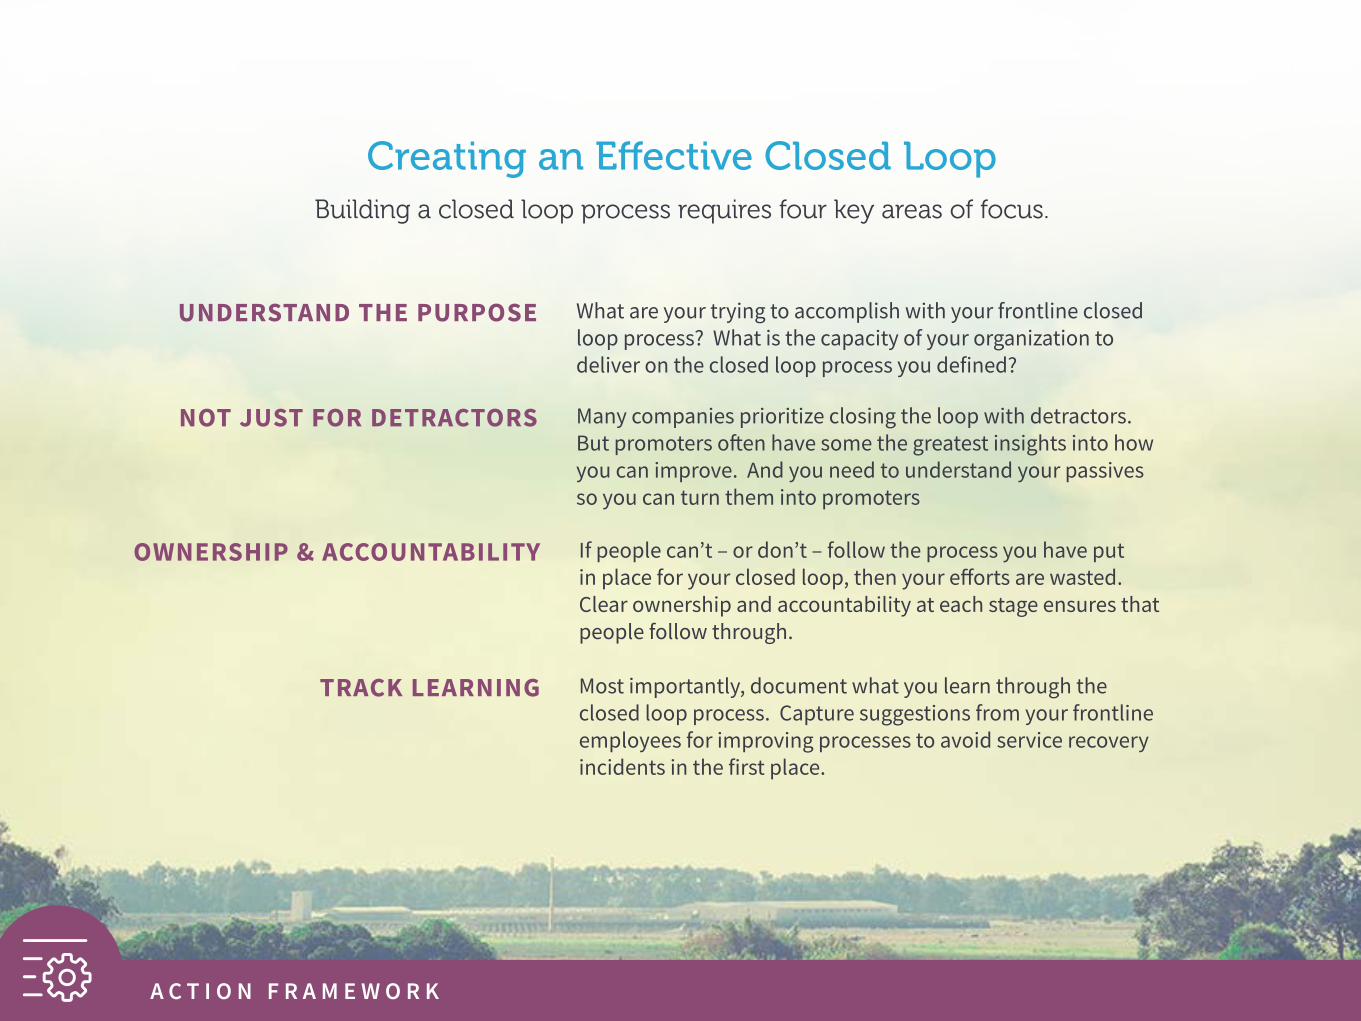
Creating an Effective Closed LoopBuilding a closed loop process requires four key areas of focus.
What are your trying to accomplish with your frontline closed loop process? What is the capacity of your organization to deliver on the closed loop process you defined?
Many companies prioritize closing the loop with detractors. But promoters often have some the greatest insights into how you can improve. And you need to understand your passives so you can turn them into promoters
If people can’t – or don’t – follow the process you have put in place for your closed loop, then your efforts are wasted. Clear ownership and accountability at each stage ensures that people follow through.
Most importantly, document what you learn through the closed loop process. Capture suggestions from your frontline employees for improving processes to avoid service recovery incidents in the first place.
UNDERSTAND THE PURPOSE
NOT JUST FOR DETRACTORS
OWNERSHIP & ACCOUNTABILITY
TRACK LEARNING
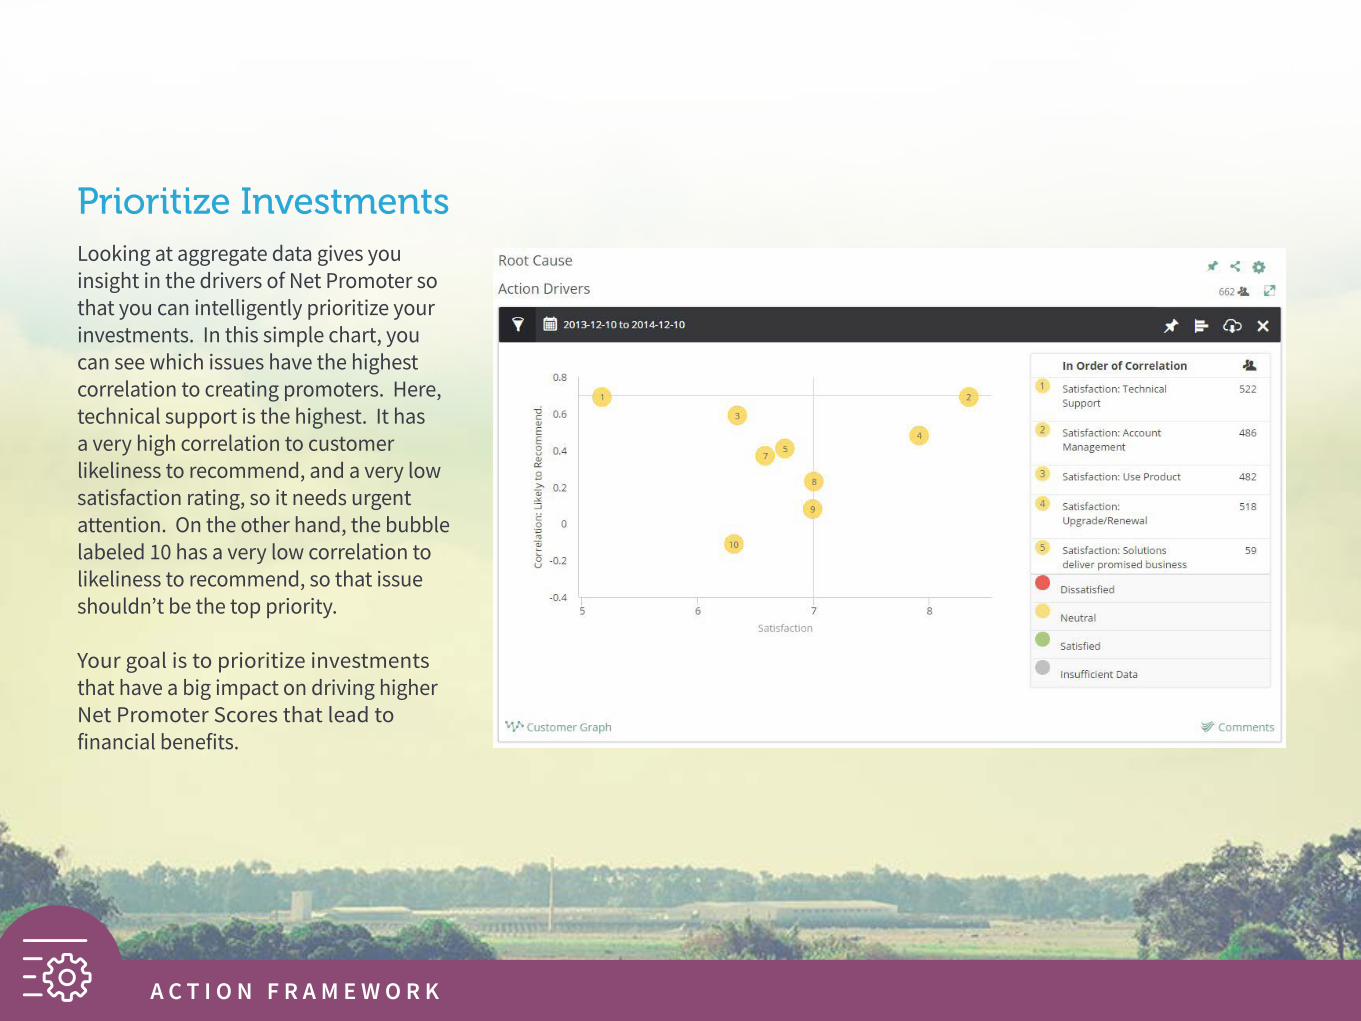
Looking at aggregate data gives you insight in the drivers of Net Promoter so that you can intelligently prioritize your investments. In this simple chart, you can see which issues have the highest correlation to creating promoters. Here, technical support is the highest. It has a very high correlation to customer likeliness to recommend, and a very low satisfaction rating, so it needs urgent attention. On the other hand, the bubble labeled 10 has a very low correlation to likeliness to recommend, so that issue shouldn’t be the top priority.
Your goal is to prioritize investments that have a big impact on driving higher Net Promoter Scores that lead to financial benefits.
A C T I O N F R A M E W O R K
Prioritize Investments

A C T I O N F R A M E W O R K
Example: Broad Financial Benefits from Improving NPSIn this example, Satmetrix analyzed data at a communication company, looking at revenue, cost to
serve, and profitability for promoters, passives, and detractors. We found that promoters spend about €8 more, and cost €1 less to serve. This calculation looked at the average number of calls and their cost.
That €9 difference in profitability doesn’t sound like much without some further calculations.
20M subscribers x 2% more promoters = €3.6M of increased profits.

FIX ISSUESReduce DetractorsFunctional Improvements
BUI LD MOMENTUMEngage EmployeesQuick Wins
IMPROVE OPERATIONSReduce CostsCustomer-Centric Operations
INNOVATE & D IF F E RE NTIATEPromoter EngagementMarket Leadership
REF INE & EXPA ND
A C T I O N F R A M E W O R K
Phases of Customer Experience Maturity
Our experience shows that organizations tend to go through phases of maturity as their customer experience programs evolve.
A C T I O N F R A M E W O R K
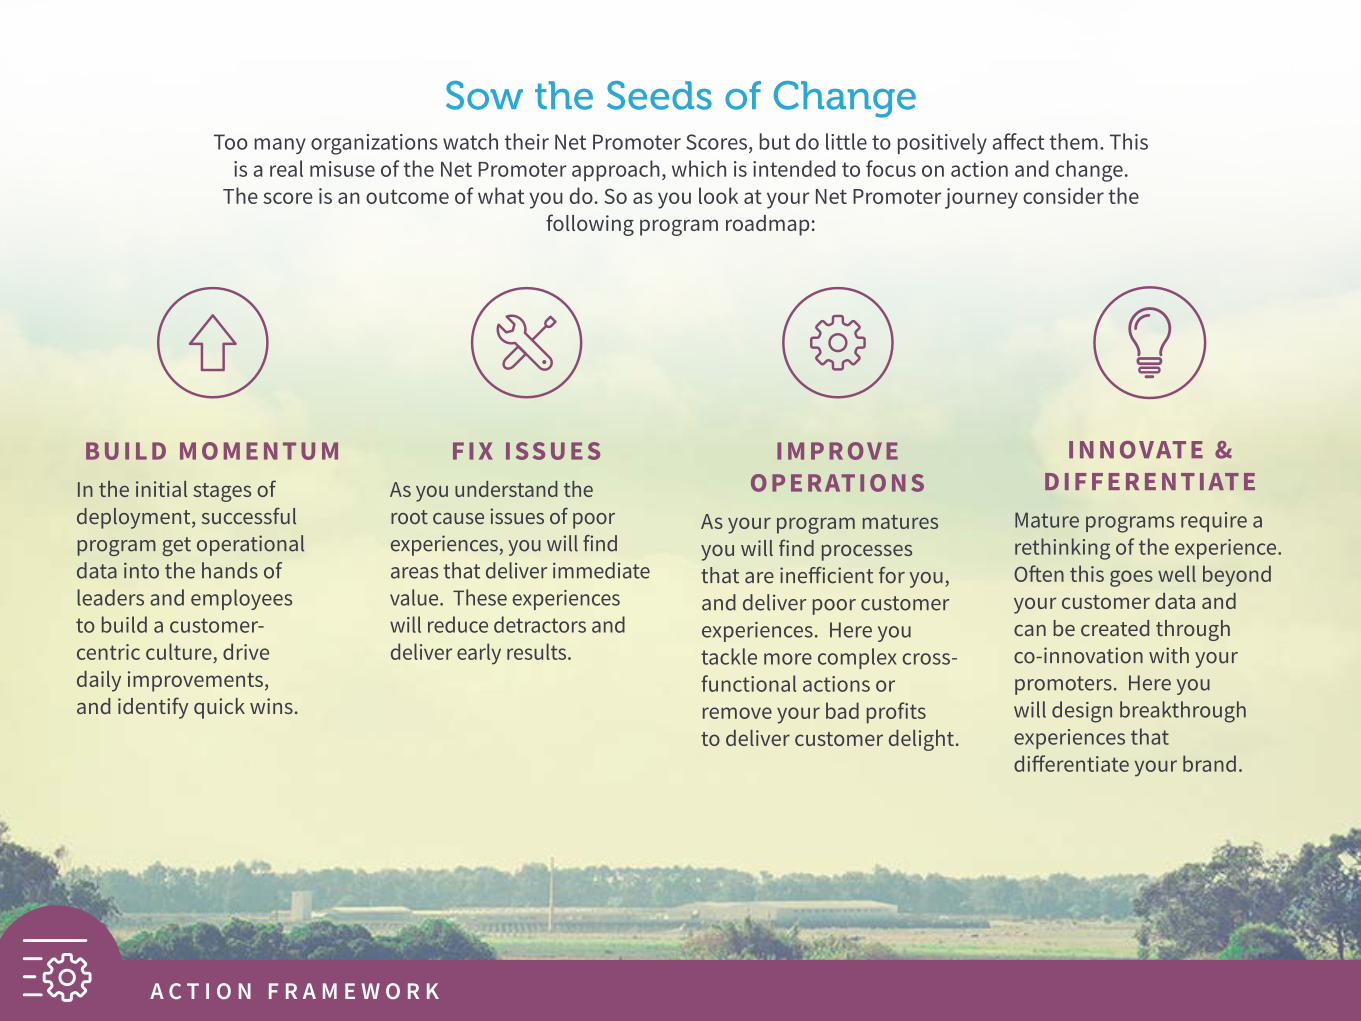
BUILD MOMENTUMIn the initial stages of deployment, successful program get operational data into the hands of leaders and employees to build a customer- centric culture, drive daily improvements, and identify quick wins.
FIX ISSUESAs you understand the root cause issues of poor experiences, you will find areas that deliver immediate value. These experiences will reduce detractors and deliver early results.
IMPROVE OPERATIONS
As your program matures you will find processes that are inefficient for you, and deliver poor customer experiences. Here you tackle more complex cross- functional actions or remove your bad profits to deliver customer delight.
INNOVATE & DIFFERENTIATE
Mature programs require a rethinking of the experience. Often this goes well beyond your customer data and can be created through co-innovation with your promoters. Here you will design breakthrough experiences that differentiate your brand.
Sow the Seeds of ChangeToo many organizations watch their Net Promoter Scores, but do little to positively affect them. This
is a real misuse of the Net Promoter approach, which is intended to focus on action and change. The score is an outcome of what you do. So as you look at your Net Promoter journey consider the
following program roadmap:

A C T I O N F R A M E W O R K
Assess Your Organization
► Is my leadership committed to drive change?
► Is my listening strategy aligned with my customer journey?
► Does my Net Promoter Score accurately reflect by customer segments?
► Am I providing frequent data to the leaders and employees?
► Do we understand our customer lifetime value economics?
► Does my closed loop process go beyond detractor recovery?
► Do I leverage my promoters to acquire new customers?
► Do we have an effective governance structure?
► Do I have a robust communication strategy for customers and employees?
► Do I have the technology necessary for an operational program?
Ask yourself these questions about where your organization is on its Net Promoter journey.

Take Action
FREE DEMOSee how Satmetrix can enable your program. Get a free demo.
www.satmetrix/freedemo

INTERNATIONAL +44(0) 845.371.1040 | NORTH AMERICA [email protected] | www.satmetrix.com
Recommended