Ecology
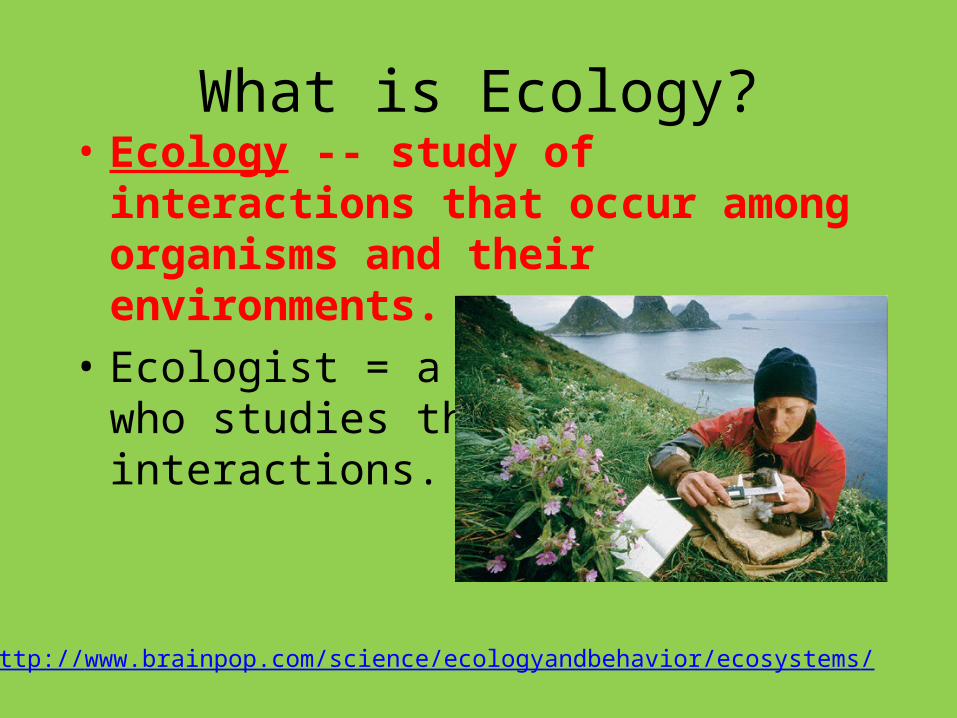
What is Ecology?• Ecology -- study of interactions that occur
among organisms and their environments.• Ecologist = a scientist
who studies these interactions.
http://www.brainpop.com/science/ecologyandbehavior/ecosystems/
What is the Biosphere?
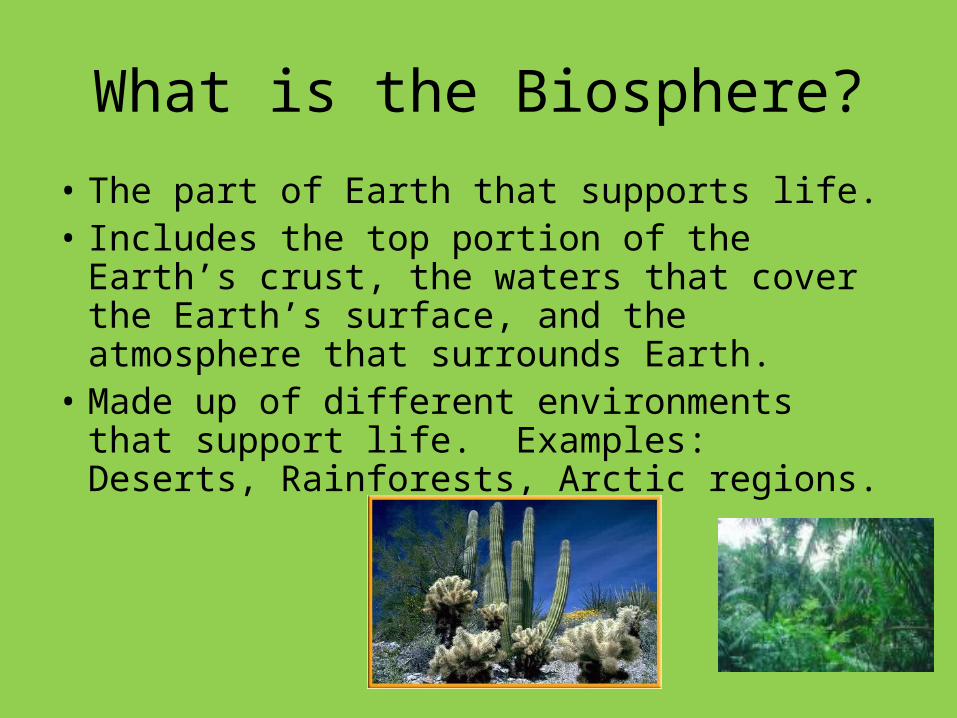
• The part of Earth that supports life.• Includes the top portion of the Earth’s crust,
the waters that cover the Earth’s surface, and the atmosphere that surrounds Earth.
• Made up of different environments that support life. Examples: Deserts, Rainforests, Arctic regions.
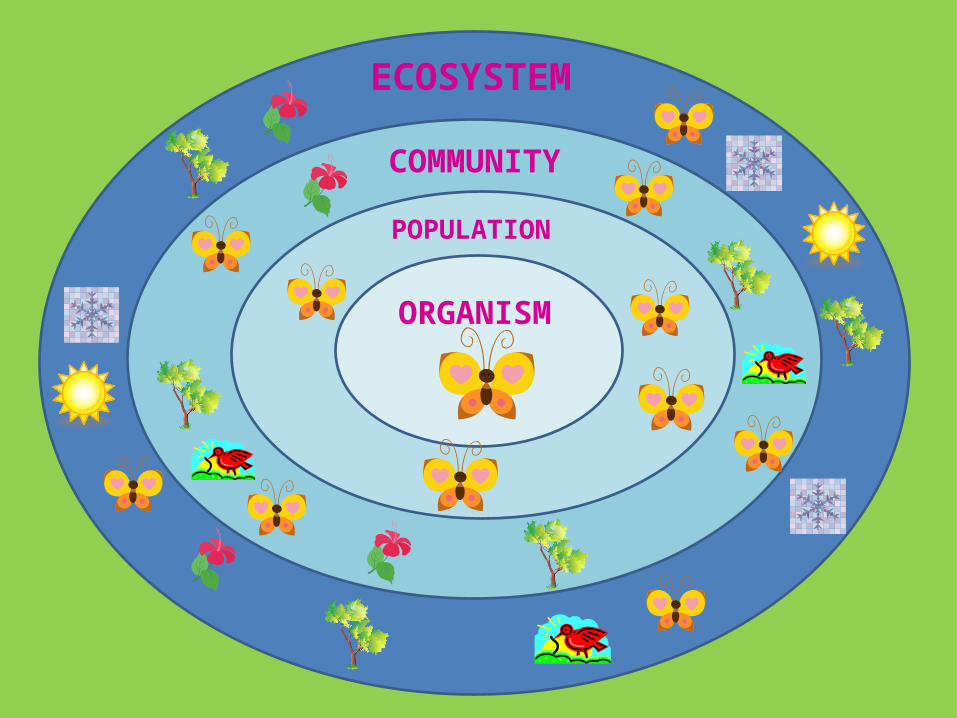
ECOSYSTEM
COMMUNITY
POPULATION
ORGANISM

What is an ecosystem?
• Ecosystem -- contains all of the living organisms in an area and the nonliving parts of the environment.
• Living organisms = plants and animals• Nonliving parts = water, temperature,
sunlight, soil and air• Example: Prairie ecosystem
What is a community?
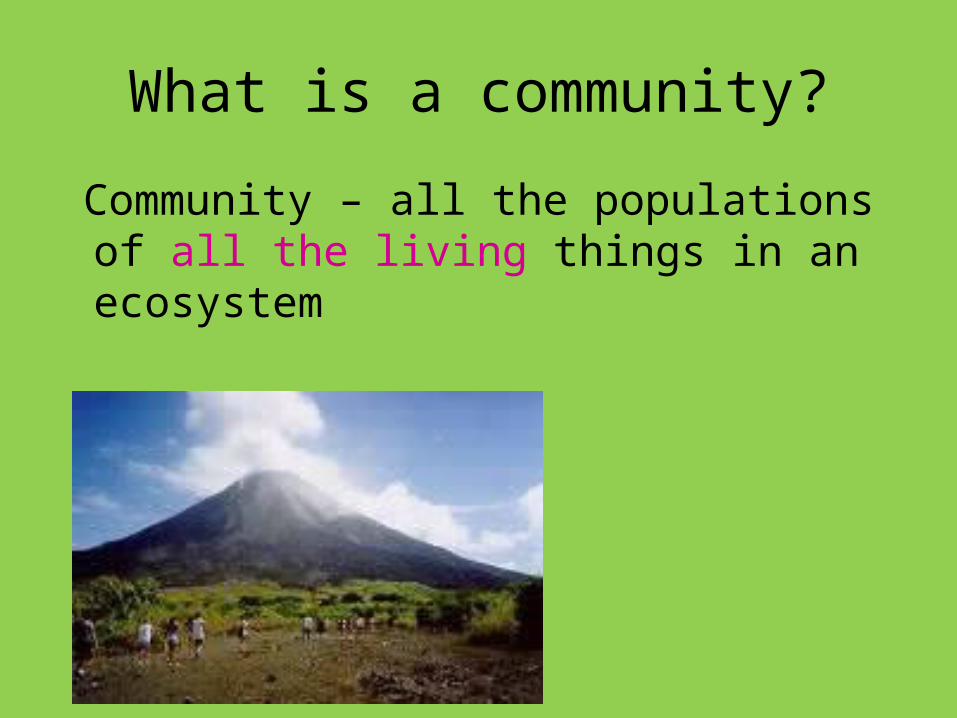
Community – all the populations of all the living things in an ecosystem
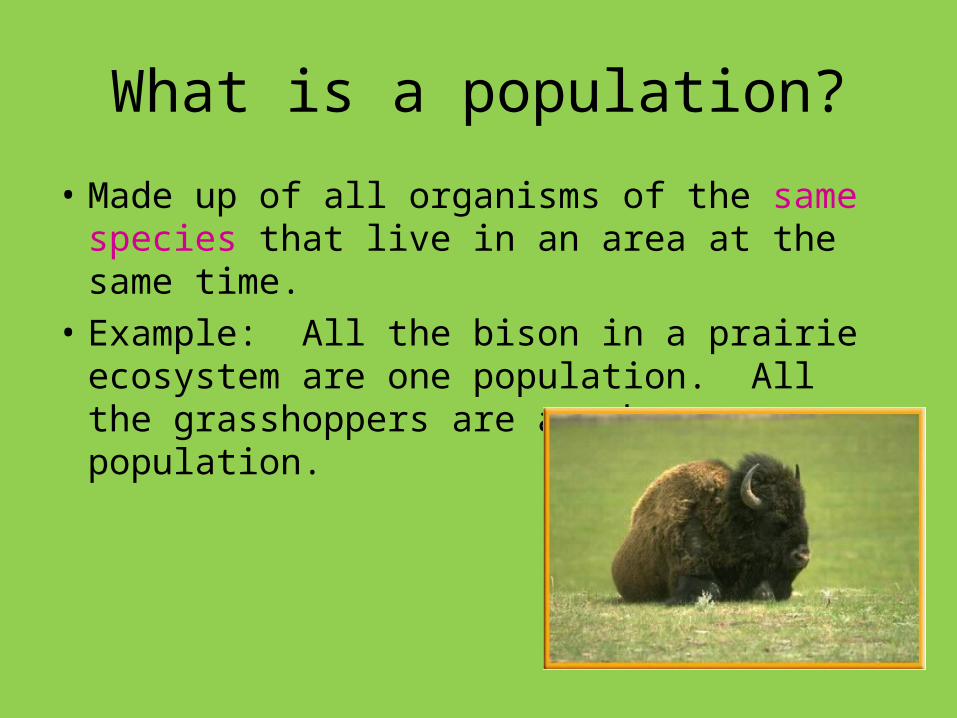
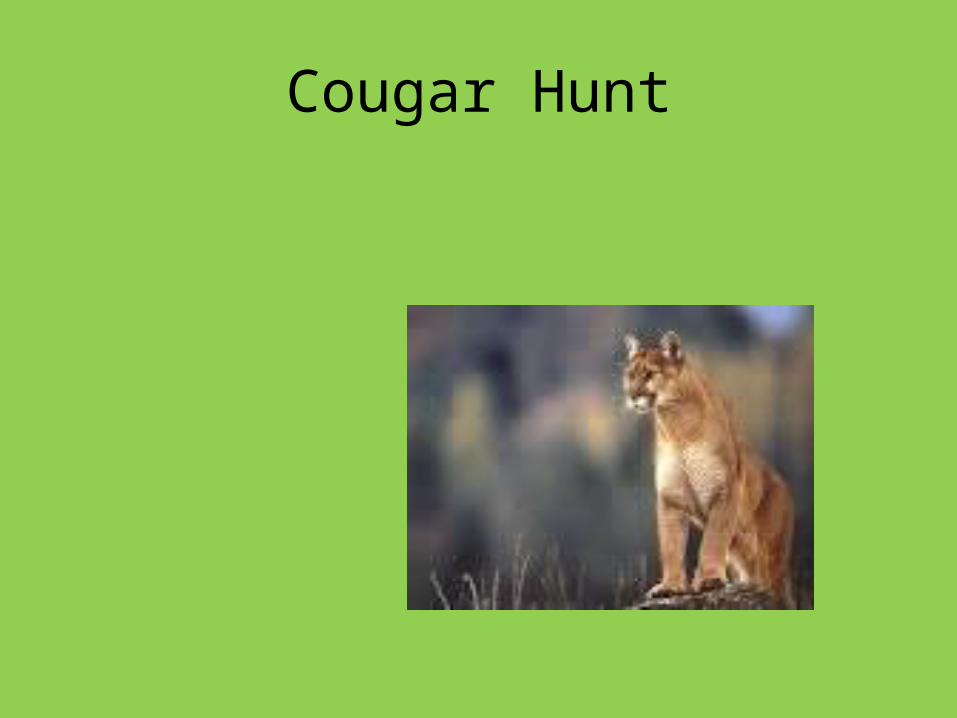
What is a population?
• Made up of all organisms of the same species that live in an area at the same time.
• Example: All the bison in a prairie ecosystem are one population. All the grasshoppers are another population.
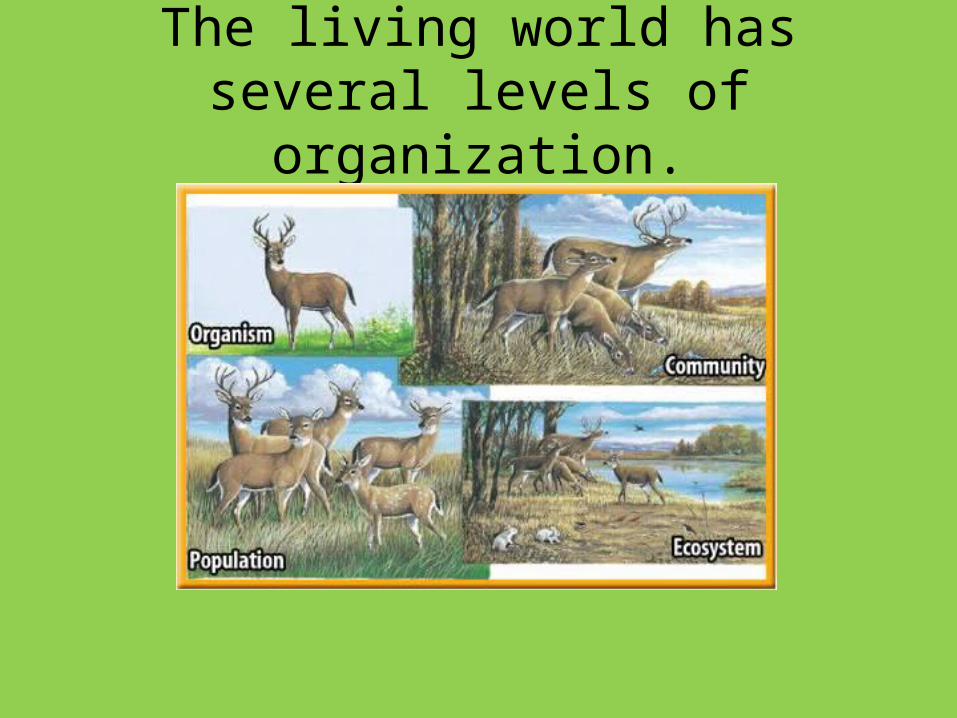
The living world has several levels of organization.
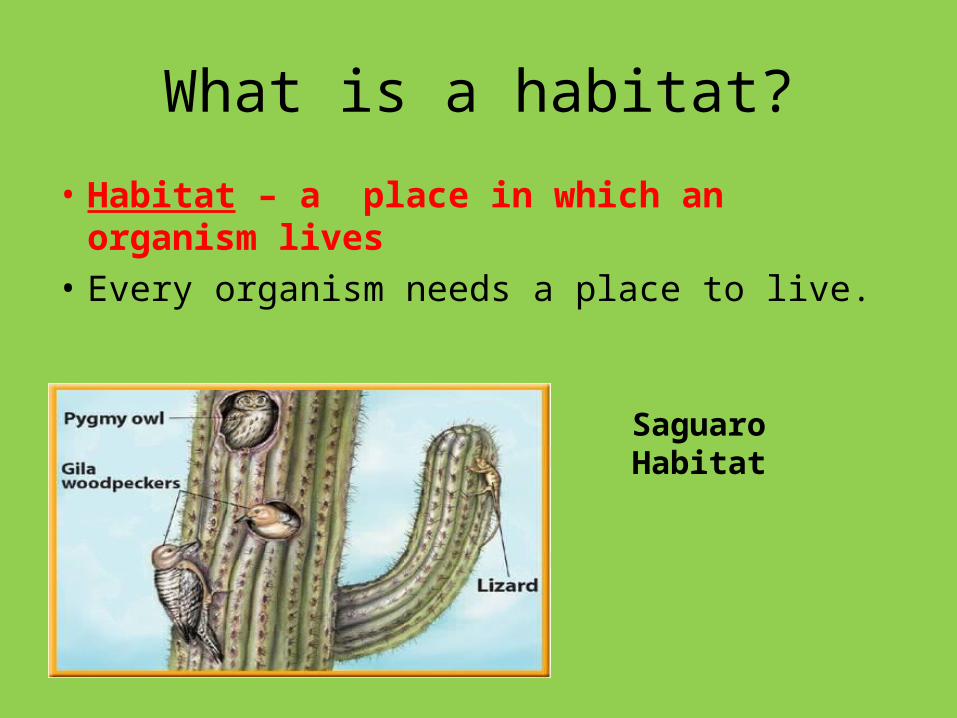
What is a habitat?
• Habitat – a place in which an organism lives• Every organism needs a place to live.
Saguaro Habitat
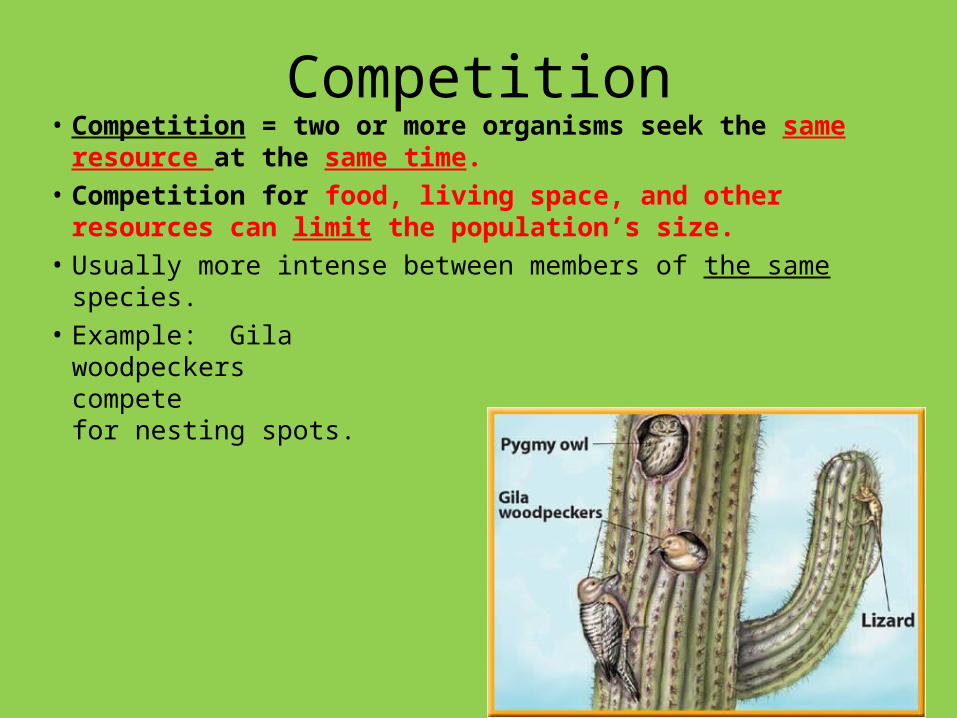
Competition• Competition = two or more organisms seek the same resource at
the same time.• Competition for food, living space, and other resources can limit
the population’s size.• Usually more intense between members of the same species.• Example: Gila
woodpeckers competefor nesting spots.
Factors Affecting Population Size – Limiting Factors
• Limiting Factors – anything that restricts the number of individuals in a population.
• Can affect more than one population in a community.
• Can be living or nonliving features in an ecosystem.• Example: Not enough seeds for seed eating mice is a
limiting factor for the number of mice. The number of mice becomes a limiting factor for the hawks and owls that eat mice. Less seeds = less mice = less hawks and owls.
Factors Affecting Population Size – Carrying Capacity
• Carrying Capacity - the largest number of individuals of one species that an ecosystem can support over time.
• Example: A population of robins lives in a group of trees in a park. As the number of robins grows, there is less nesting space. The nesting space is a limiting factor that keeps the robin population from getting bigger.

Ecology Activities
Organism Cards• Find your population.
• Find your community.
• Describe your ecosystem.
Cougar Activity• Each of you represent a cougar• Each of you will try to find 50 kg of food
– Enough food to live for about a month
• Your seat is your den– This is where you will bring your prey
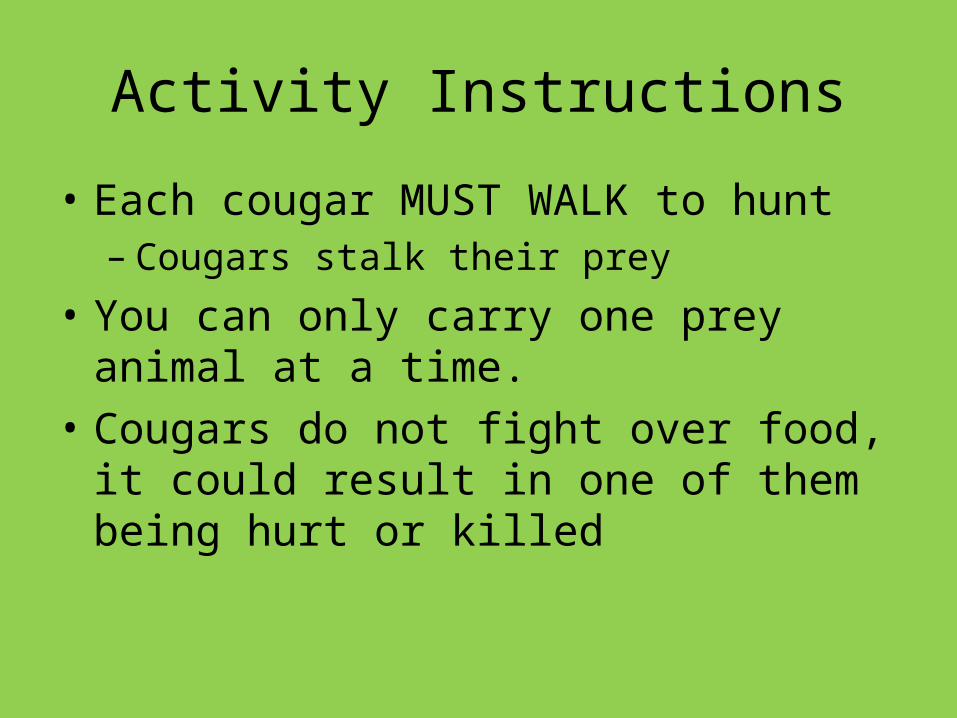
Activity Instructions
• Each cougar MUST WALK to hunt– Cougars stalk their prey
• You can only carry one prey animal at a time.• Cougars do not fight over food, it could result
in one of them being hurt or killed
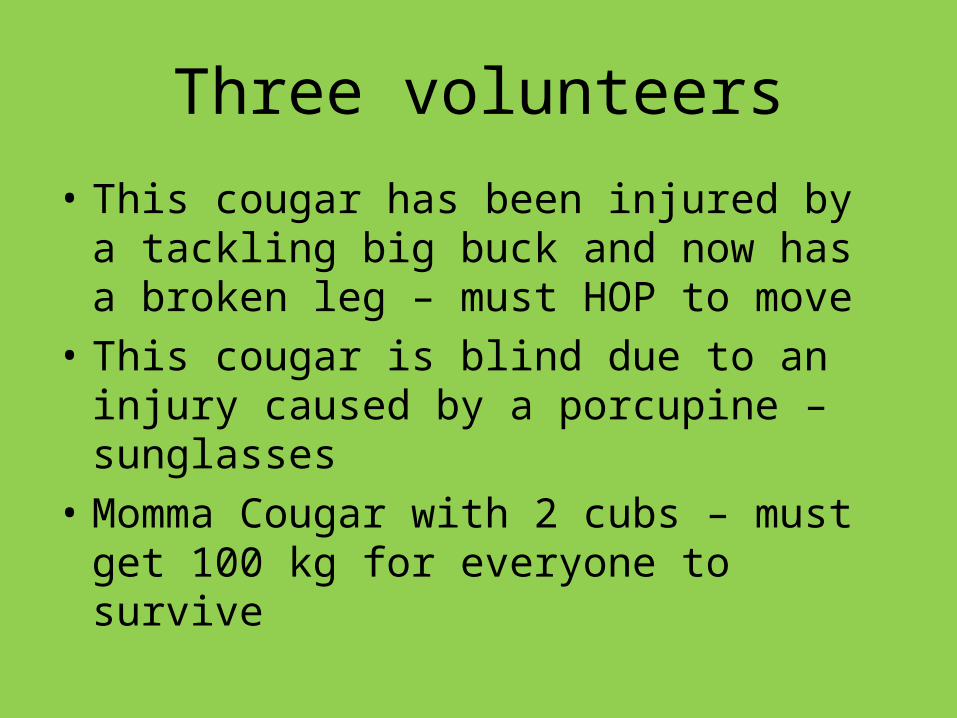
Three volunteers
• This cougar has been injured by a tackling big buck and now has a broken leg – must HOP to move
• This cougar is blind due to an injury caused by a porcupine – sunglasses
• Momma Cougar with 2 cubs – must get 100 kg for everyone to survive
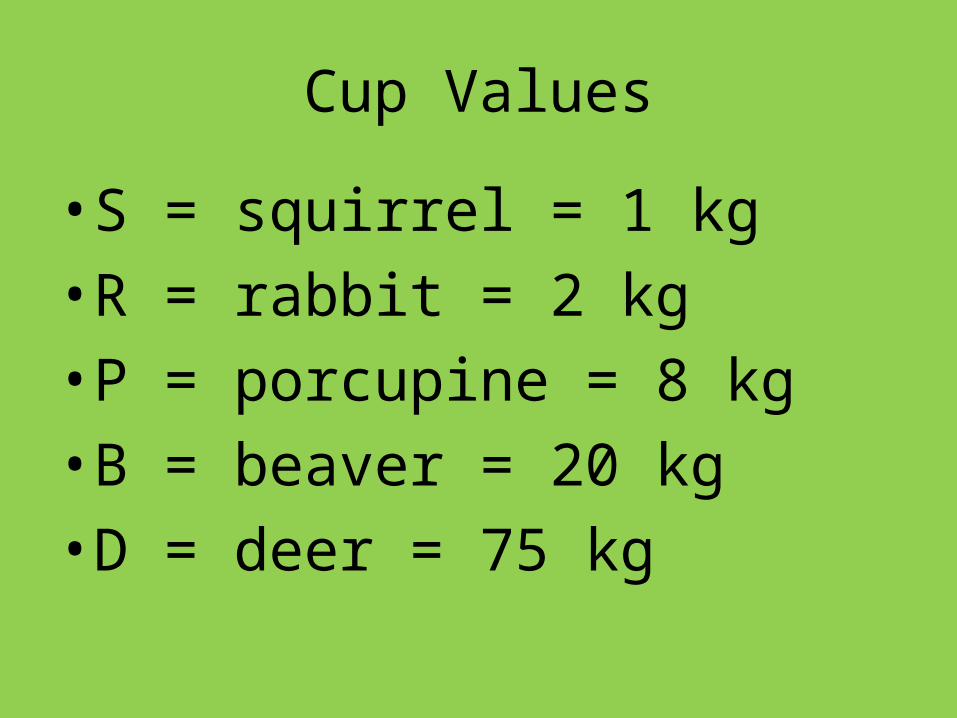
Cup Values
• S = squirrel = 1 kg• R = rabbit = 2 kg• P = porcupine = 8 kg• B = beaver = 20 kg• D = deer = 75 kg
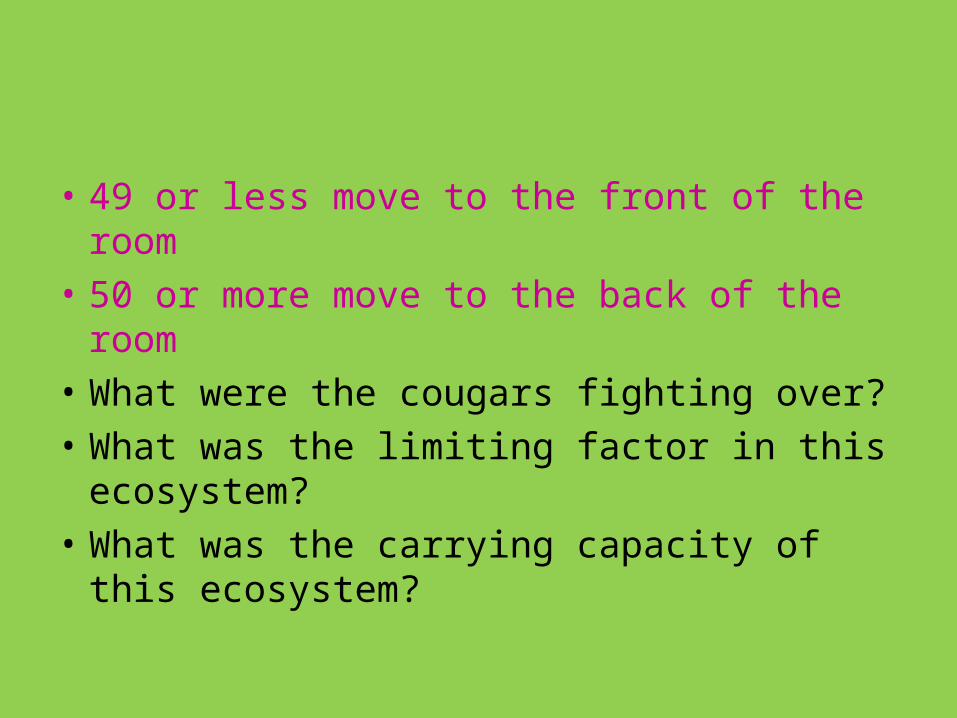
• 49 or less move to the front of the room• 50 or more move to the back of the room• What were the cougars fighting over?• What was the limiting factor in this
ecosystem?• What was the carrying capacity of this
ecosystem?
Your Hunt
• Who got the deer? • Would a real cougar have continued to hunt
after getting that much food?• How would the carrying capacity for cougars
change if all the rabbits died as a result of disease?
• What would happen if the cougars’ numbers dwindled as a result of humans moving into the area?
Your Hunt
• What would happen in the cougar’s habitat became polluted?
• This game is about cougars. Do the same rules apply for humans? How are the similar/dissimilar?
• What do human compete over?• Do humans have a carrying capacity?
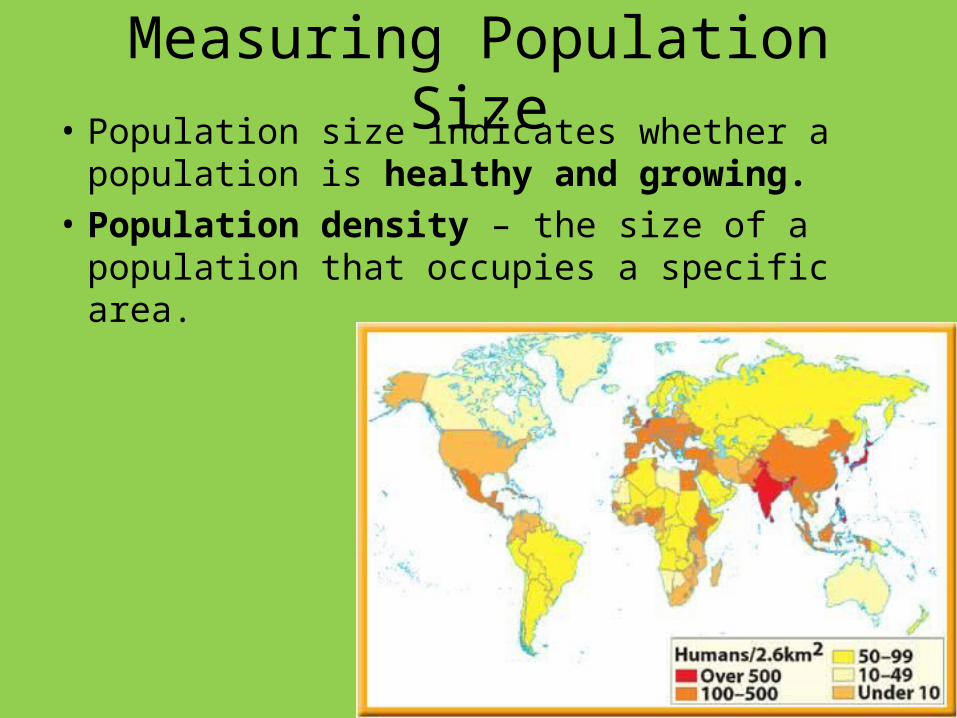
Measuring Population Size• Population size indicates whether a
population is healthy and growing.• Population density – the size of a population
that occupies a specific area.
Factors Affecting Population Size – Biotic Potential
• Biotic potential – the highest rate of reproduction for a population under ideal conditions.
• The higher the number of offspring (babies), the higher the biotic potential.
• Example: An avocado fruit produces one big seed, while a tangerine fruit contains a dozen seeds. So the tangerine tree makes more seeds per fruit which means higher biotic potential.
Changes in Population
• Birth and death rates affect the population size.• If the number of births is greater than the number of
deaths, then the population grows. • Movement also affects population size. When birds
fly south for the winter, the northern population goes down but the southern population goes up.
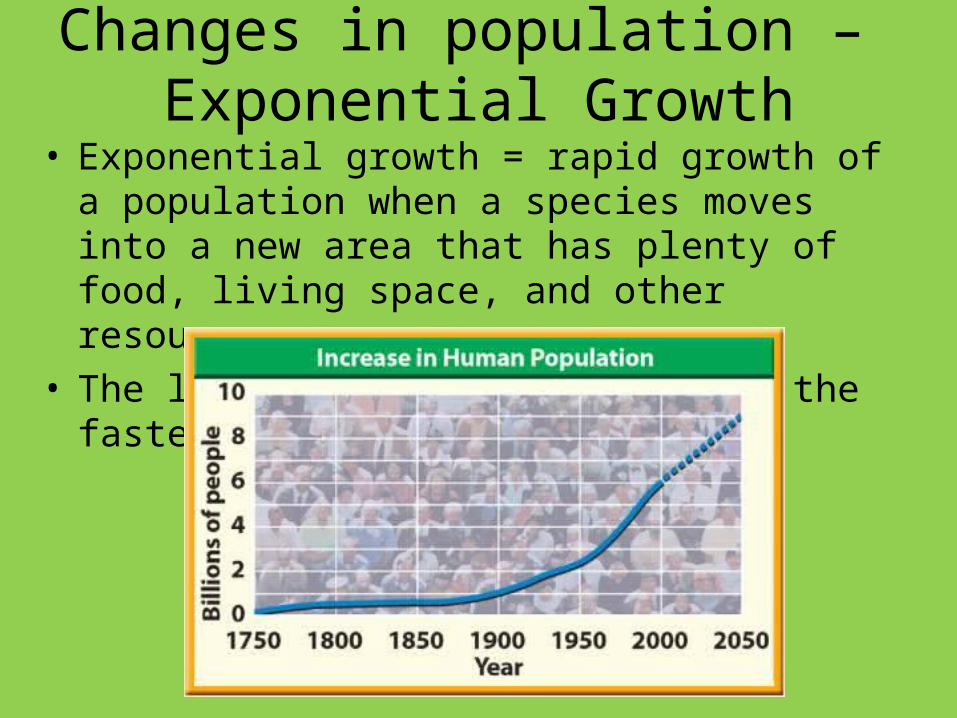
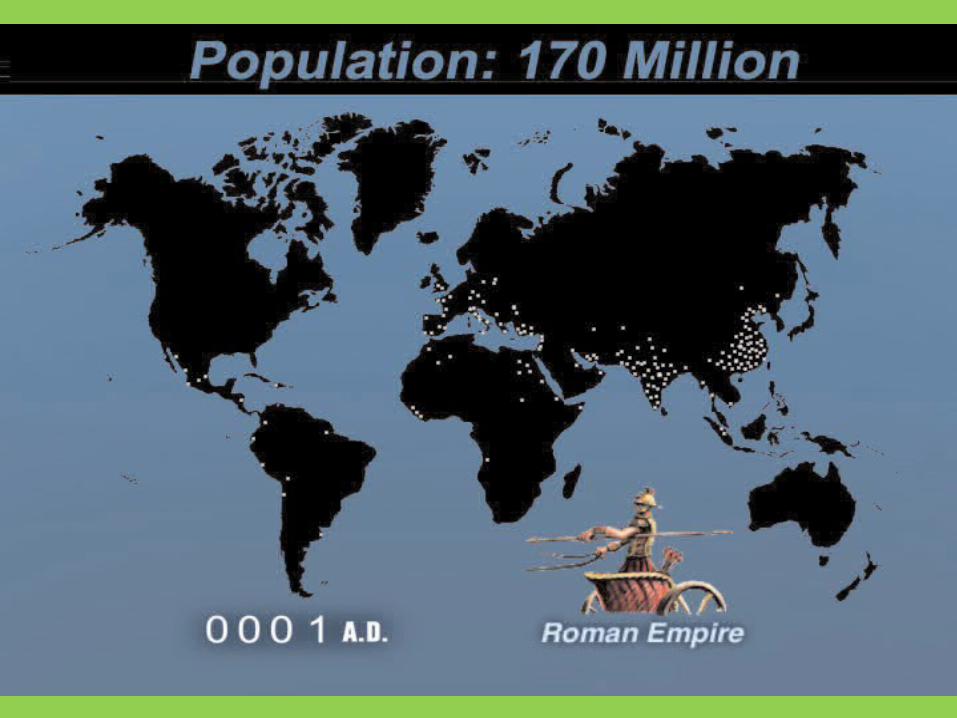
Changes in population – Exponential Growth
• Exponential growth = rapid growth of a population when a species moves into a new area that has plenty of food, living space, and other resources.
• The larger the population gets, the faster it grows.
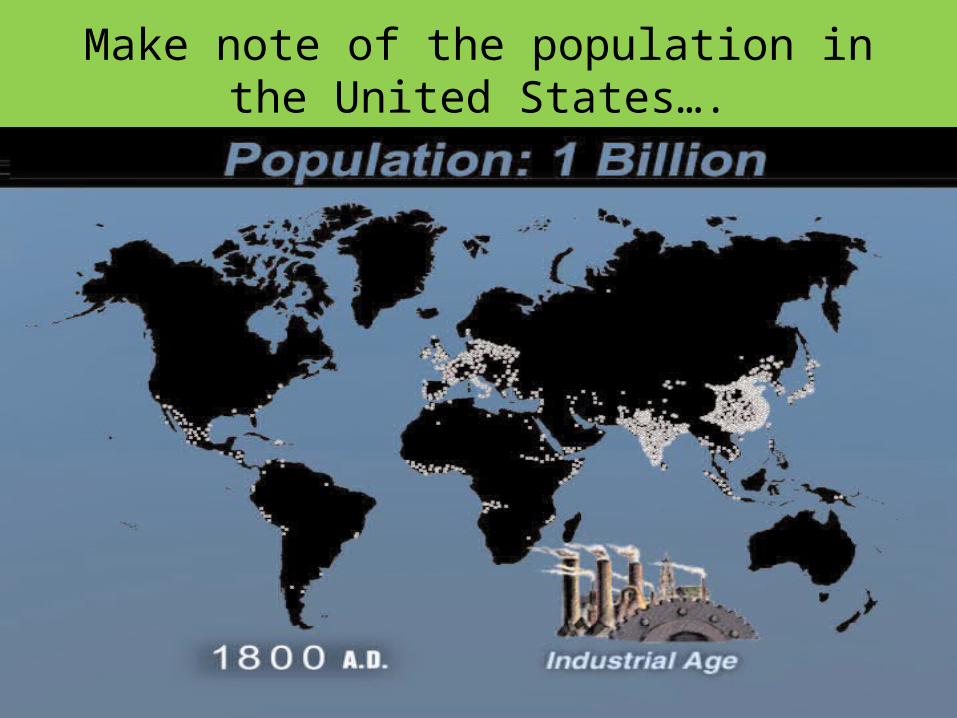
Make note of the population in the United States….
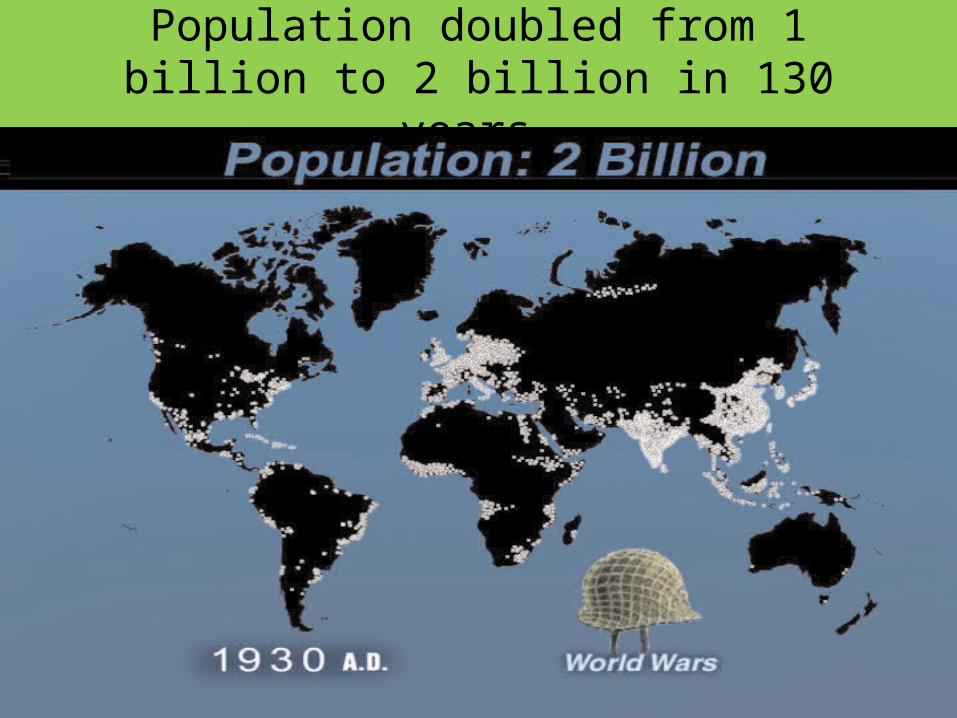
Population doubled from 1 billion to 2 billion in 130 years.
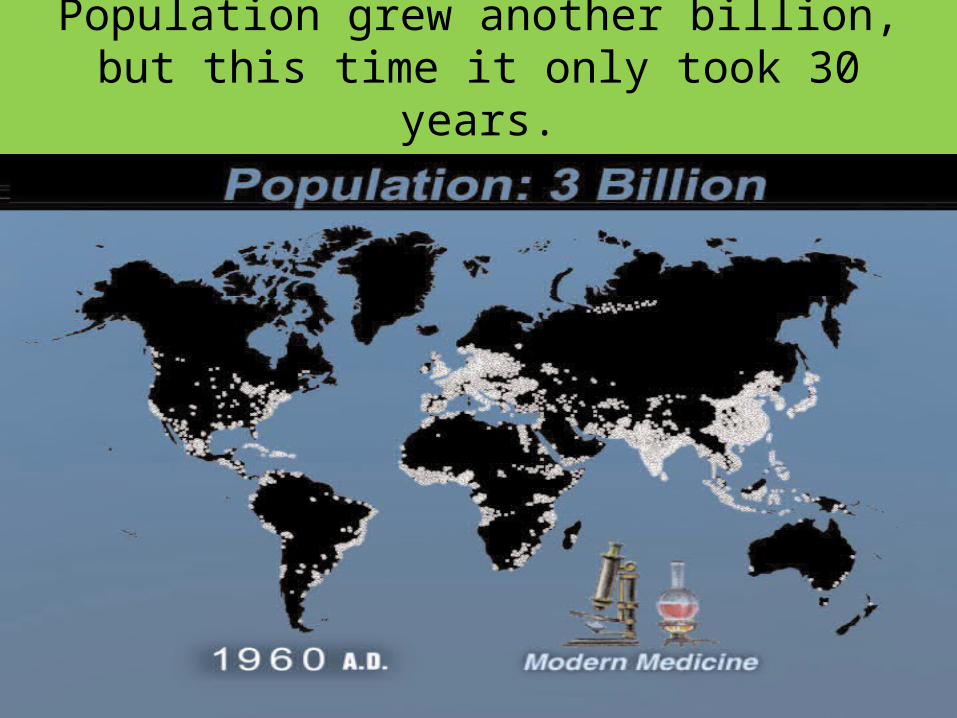
Population grew another billion, but this time it only took 30 years.
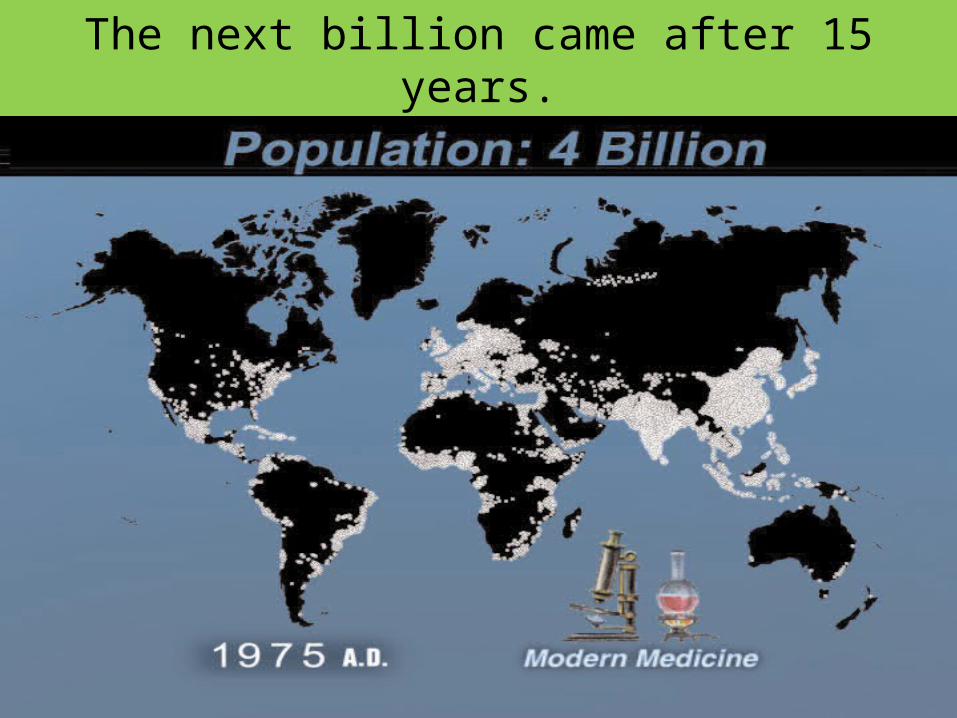
The next billion came after 15 years.
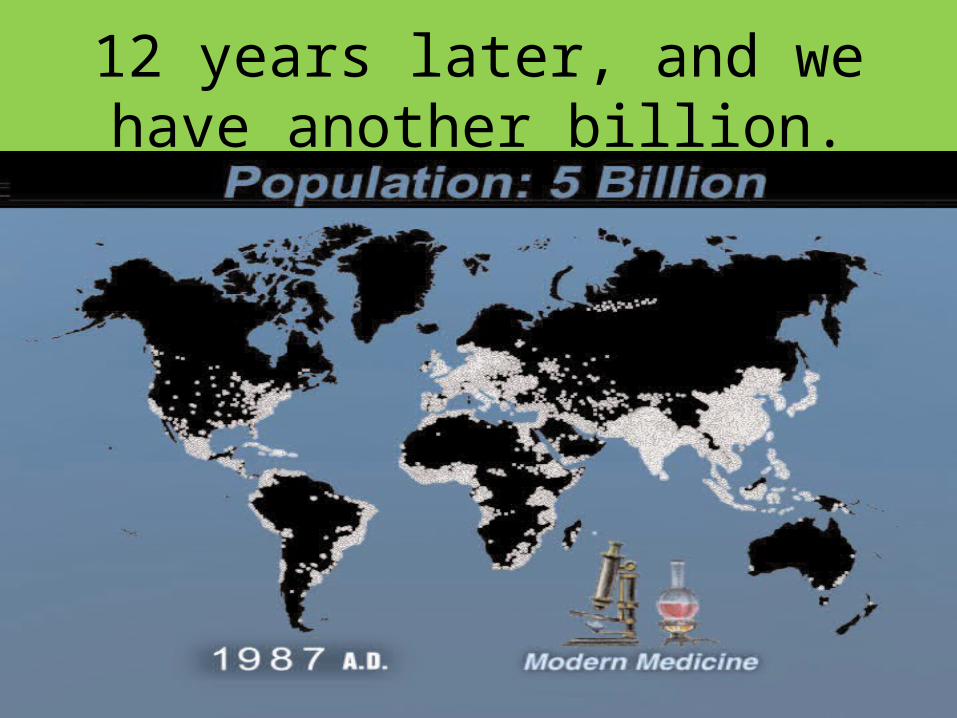
12 years later, and we have another billion.
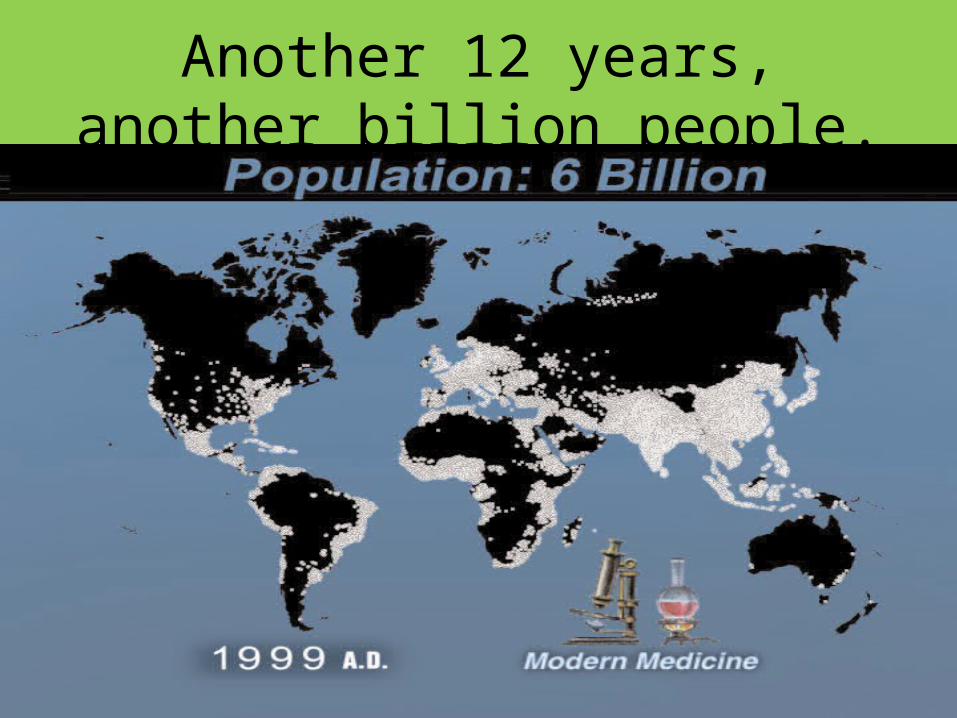
Another 12 years, another billion people.
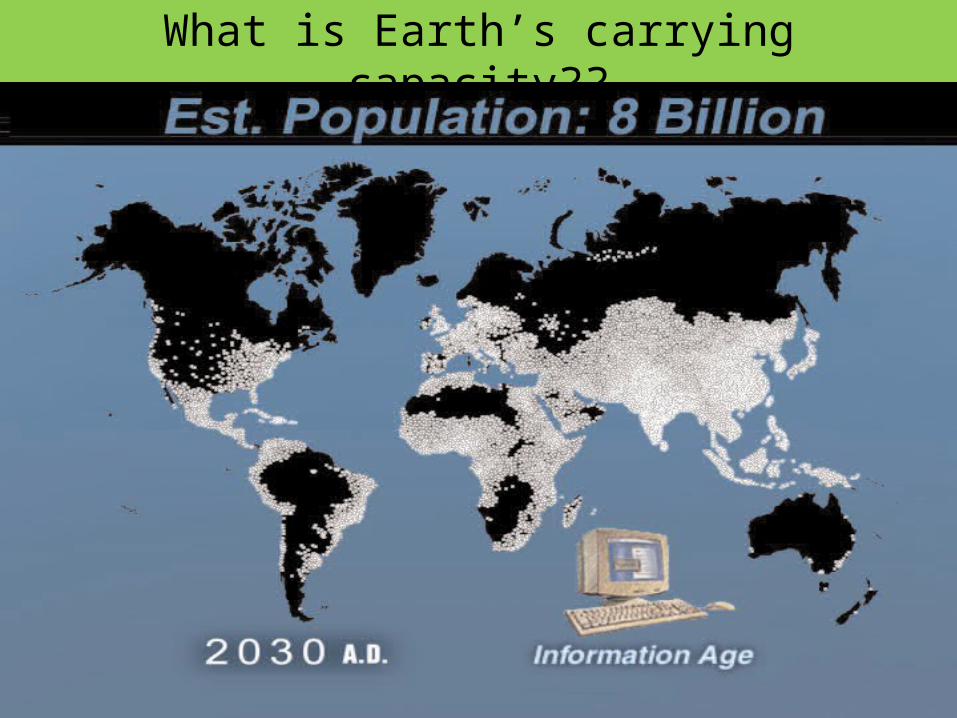
What is Earth’s carrying capacity??
Ways to Measure Population Size
• Trap-mark-release method • Example: Capture the rabbit, mark the rabbit,
and release the rabbit.• Later capture a sample of rabbits.• By comparing the number of marked and
unmarked rabbits, ecologists can estimate the size of the rabbit population.
Ways to Measure Population Size
• Sample Counts• Example: To estimate the number of rabbits in
an area of 100 acres, count the number of rabbits in an area and multiply by 100.
• Look at figure 7 in your book on p. 14.
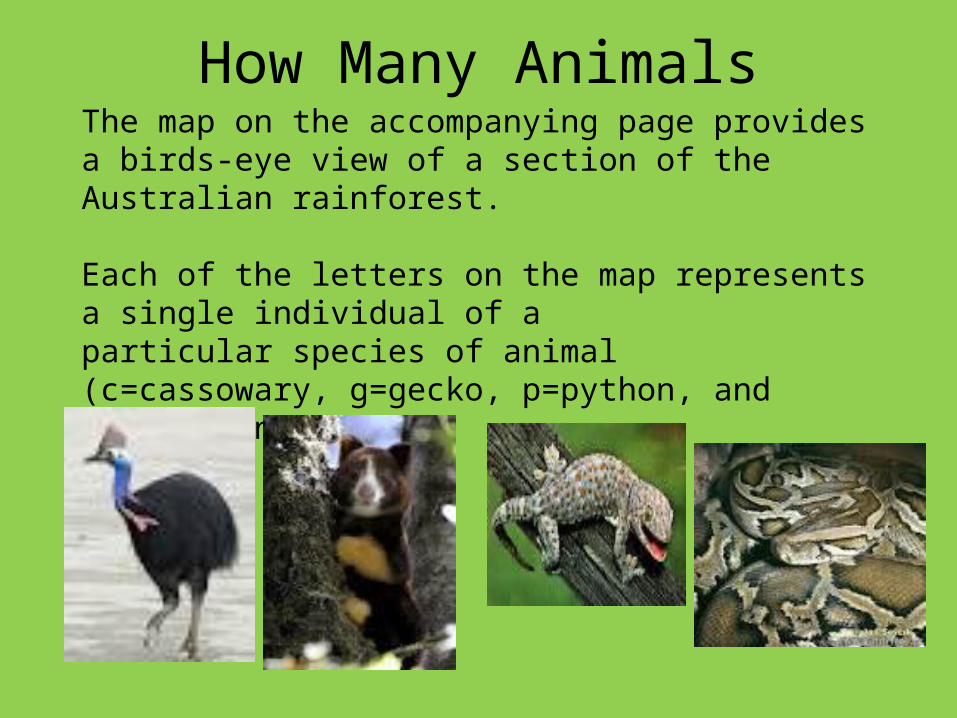
How Many AnimalsThe map on the accompanying page provides a birds-eye view of a section of the Australian rainforest.
Each of the letters on the map represents a single individual of aparticular species of animal (c=cassowary, g=gecko, p=python, and t=tree kangaroo.)
Activity Directions – 10 minutes• First, you will flip a quarter onto your map.
Without moving the quarter, draw a circle around the quarter in pencil.
• Pick up the quarter, count the number of animals of each type within the circle using the key. As long as the line is touching the animal – it counts! Record data in Table One under Sample One.
• Repeat two more times and record data in Sample Two and Three on Table One.
• Calculate the mean for each organism– to the nearest tenth (one place after the decimal) Record in table.

Part Two• Area of paper = 336 sp cm• Area of quarter = 5 cm• Divide the total area by the area of one
quarter. 336/5 = 67• Complete the discussion questions with your
table partner.
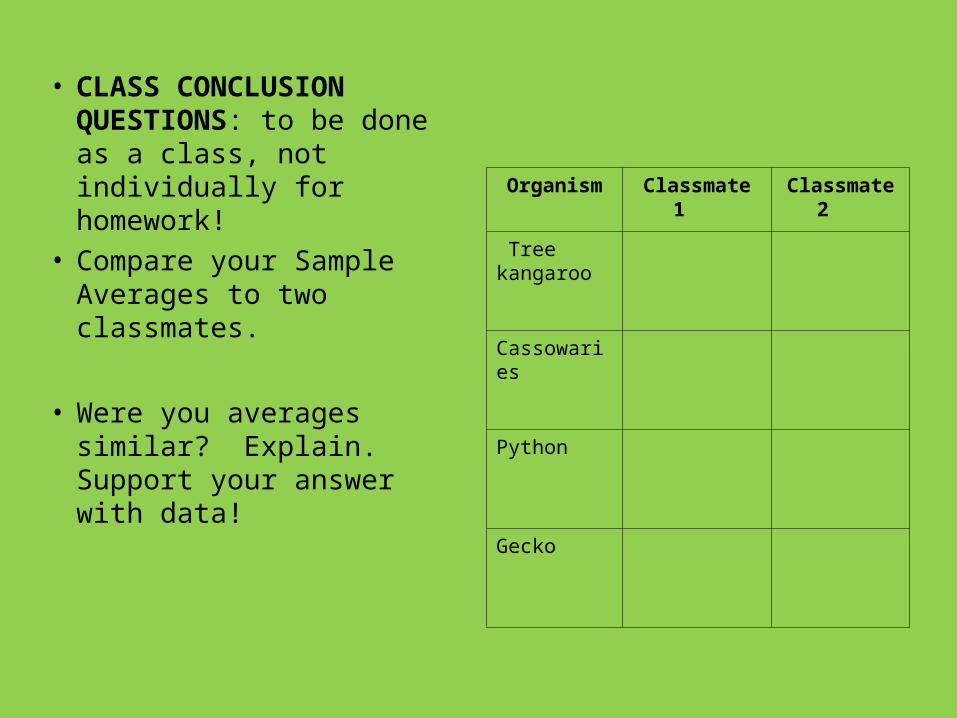
• CLASS CONCLUSION QUESTIONS: to be done as a class, not individually for homework!
• Compare your Sample Averages to two classmates.
• Were you averages similar? Explain. Support your answer with data!
Organism Classmate 1 Classmate 2
Tree kangaroo
Cassowaries
Python
Gecko
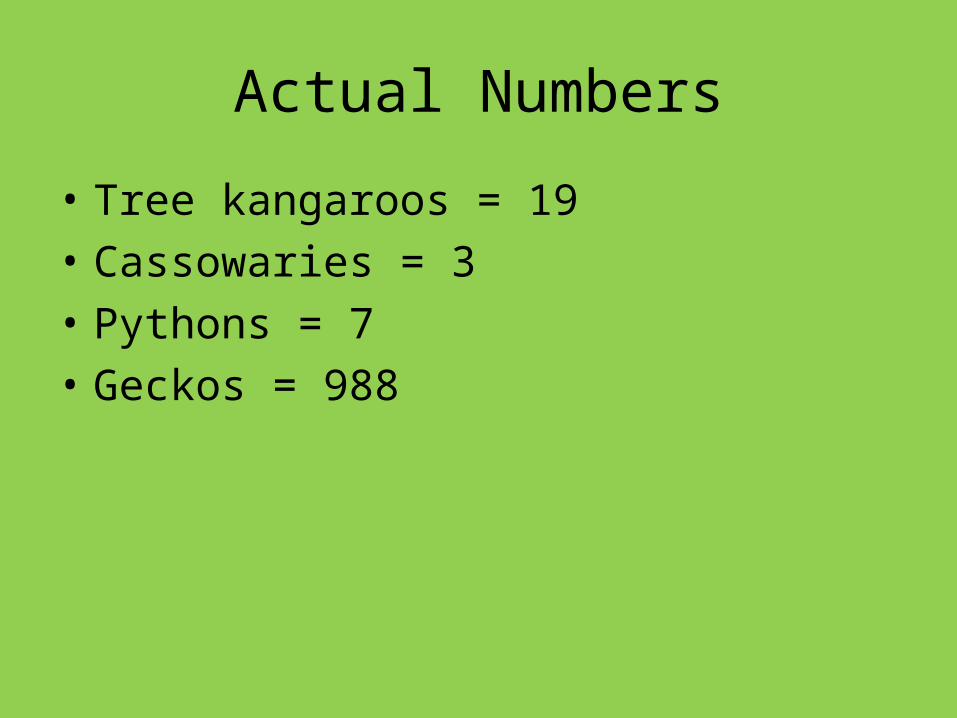
Actual Numbers
• Tree kangaroos = 19• Cassowaries = 3• Pythons = 7• Geckos = 988
Recommended