© Kamla-Raj 2010 J Hum Ecol, 31(1): 13-17 (2010)
Economic Analysis of Homestead Fish Production inOgun State Nigeria
A.T. Olawumi1, A. O. Dipeolu2 and O. M. Bamiro3
1Agricultural Production and Management Sciences, Tai Solarin University of Education,Ijebu – Ode, Ogun State, Nigeria
2Department of Agricultural Economics and Farm Management, University of Agriculture,Abeokuta, Nigeria
3Department of Agricultural Economics, Olabisi Onabanjo University, Yewa Campus,Ayetoro, Nigeria
KEYWORDS Homestead. Fish Farming. Clarias. Heteroclarias. Aquaculture
ABSTRACT This study examines the determinants of revenue of homestead fish production in Ogun State, Nigeria.Descriptive statistics, budgetary and regression models were the tools employed for the analysis of data obtained from72 fish farmers. Most of the farmers are within the economically active age bracket, having a mean household sizeof 6 with high level of educational status. Farmers in the study area practiced mono-culture and poly-culture fishfarming. Sole clarias enterprise recorded the lowest net farm income while Tilapia/heteroclarias enterprise has thehighest net farm income. The quadratic functional form is chosen as the lead equation. The pond size, quantity of fishseeds stocked other significant, determinants of the revenue that accrue to homestead fish production in Ogun state,Nigeria. This study therefore suggests that policy variables such as pond size, labour and fingerlings that influence theaquaculture revenue should be strengthened for sustainable fish production to be attained in Ogun State and in Nigeria.
INTRODUCTION
Protein intake in developing countries arebelow the required 75g per person per day (FAO1995) and the Nigerian population is growing atabout 4% per annum as against livestockproduction, which is growing at about just 2%per annum (Owolabi 2002). Talabi (2004) statedthat statistics and researches have further shownthat meat protein shortage continues to increaseeveryday in Nigeria, despite various efforts toimprove its productivity in the field of cattleproduction and the price of beef has becomeunaffordable for an average consumer. Theawareness of the need for adequate protein inhuman diet has greatly increased in manydeveloping regions of the world and fish has beenwidely acknowledged as a rich source of dietaryprotein (Ajayi 2001). Akinyemi (1998) projectedthat fish demand would increase from 1.392million tones in 2001 to about 1.688 million tonesin 2010. Recent accounts show that domesticdemand (because of progressive increase in theNigeria population with over 140 million people)for fish in Nigeria could not be met only bydependence on artisanal fisheries, which expertssay is fast depleting (Ojo and Fagbenro 2004).This observation, contradicts the report of theFAO-World Fish Center workshop on small-scale
aquaculture in Sub-Saharan Africa in 2004, whichidentified Nigeria as one of the country in theregion with great potential to attain sustainablefish production, via aquaculture consideringextensive mangrove ecosystem available in thecountry (FAO 2005). The annual state of economicreport by sector published by Central Bank ofNigeria shows that, Nigeria imports over US$200million worth of frozen fish per annum. This,however, accounts for over 50% of fish consumedannually to offset the gap in the domestic demandin the country (CBN 2006).
The overall economic objective of aquaculture(the rearing of fish and other aquatic organism inan enclosed water body called pond) is to producemaximum weight of marketable fish or shrimp froma given volume of water in a shortest time at theleast cost (Papka 1993; Ogundari and Ojo 2009).According to Duarte et al. (2000), the totalproduction of fisheries in 2004 was 140.5milliontonnes of which aquaculture contributed 45.5million tonnes or about 32% of the total worldproduction. There have been consistent calls forincreased investment in aquaculture to boost fishproduction in developing countries (such asNigeria). Report of successful introduction andadoption of homestead fish production had beengiven by the Ogun State Agricultural Develop-ment Programme (OGADEP 2004).
14 A.T. OLAWUMI, A. O. DIPEOLU AND O. M. BAMIRO
In order to achieve the much-desiredincreased fish production to match the ever –widening gap between production and demand,there is a need for research into the various factorsthat determine the revenue realizable fromhomestead fish farming with a bill to encouragemore investors to produce at economicallyprofitable levels.
METHODOLOGY
The study was carried out in the zonalheadquarters of Ogun State AgriculturalDevelopment Programme (OGADEP), which areAbeokuta, Ikenne, Ilaro and Ijebu – Ode. Thepurposive technique was used to select twenty-five (25) homestead fish farmer in each of the fourOGADEP’s zonal headquarters making a total ofhundred (100) respondents. Responses from 72respondents were used in the analysis due toincomplete supply of data. Structuredquestionnaires was administered on the samplehomestead fish farmers to get data on both socio–economic and production variables through theassistant of the Village Extension Agents (VEA’s)of OGADEP. Some of the data collected from thefarmers are age, sex, education, size of pond,species of fish raised, input used and their cost,labour types and wages, output/yield and pricesof the products.
Model Specifications
(a) Budgetary AnalysisThe Net Farm Income (NFI) was obtainedthus:NFI = TR
i - TC
i. …...............………………. (i)
TC = TFCi + TVC
i …………............………..(ii)
Where TRi = Total revenue from the
ith
enterprise (Naira)TVC
i = Total Variable cost from
ith enterprise
(Naira)TFC
i = Total fixed cost of
ith enterprise (Naira)
TCi = Total cost of
ith enterprise (Naira)
NFI = Net Farm Income (Naira)
Production Function
The determinants of the revenue fromhomestead fish farming in Ogun State wasexamined by multiple regression analysis usingordinary least square (OLS) techniques. Theestimated model is implicitly stated as:
Rev = f(psze, qfsd, lfdg, lhar, dlim, dfer, drat, dpwa,syst, e) ………………. (iii)Where;Rev = total revenue per production season (naira)Psze = pond size (m2)Qfsd = quantity of fish seeds (number offingerlings)Lfdg = labour for feeding (number of man perhour)Lhar = labour of harvesting (number of man perhour)dlim = dummy variable for using lime (1 if used, 0otherwise)dfer = dummy variable for using fertilizers (1 ifused, 0 otherwise)drat = dummy variable for using ration feed (1 ifused, 0 otherwise)dpwa = dummy variable for using poultry waste(1 if used, 0 otherwise)syst = fish culture system dummy (polyculture =1, monoculture = 0)e = error term.
Four functional forms were estimated (linear,semilog, doublelog and quadratic). The leadequation (quadratic functional form) was selectedon the basis of economic, statistical andeconometric criteria.
RESULT AND DISCUSSION
Socio-economic Characteristics of HomesteadFish Farmers in Ogun State
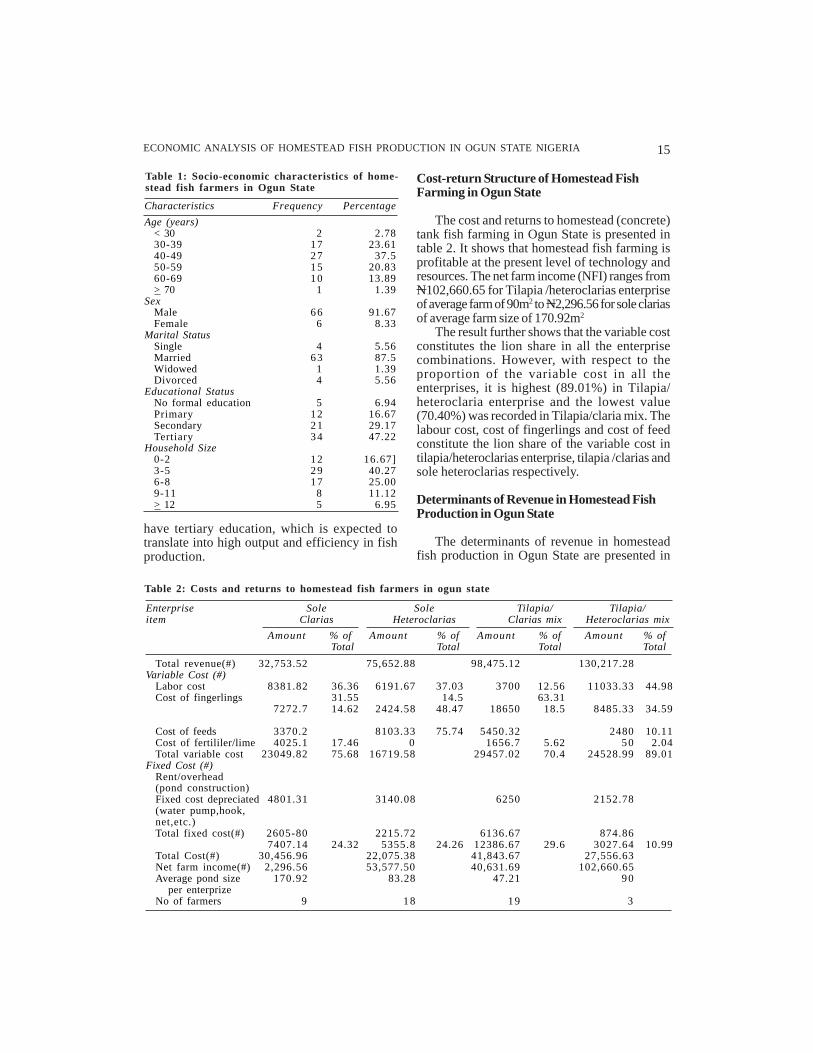
Age, sex, marital status educational status andhousehold size, among others are the socio-economic characteristics of the fish farmers thatare considered in this study. The result ispresented in table 1. A greater percentage of thehomestead fish farmers fall between the ages of40-49, indicating that most of them are within theeconomically active population and thereforeconstitute a good labour force for fisheryenterprise with the expectation that they wouldbe good managers of limited available resources.The result further shows that the production ofhomestead fish in Ogun State is gender biased,as male represents 92 percent of the fish farmersin the state. Majority of the fish farmers aremarried with the mean household size of 6. Thisimplies that the fish farmers have adequate familymembers that can provide cheap labour, which isa major characteristic of farmers in the study area.In addition, most of the homestead fish farmers
15ECONOMIC ANALYSIS OF HOMESTEAD FISH PRODUCTION IN OGUN STATE NIGERIA
Cost-return Structure of Homestead FishFarming in Ogun State
The cost and returns to homestead (concrete)tank fish farming in Ogun State is presented intable 2. It shows that homestead fish farming isprofitable at the present level of technology andresources. The net farm income (NFI) ranges fromN102,660.65 for Tilapia /heteroclarias enterpriseof average farm of 90m2 to N2,296.56 for sole clariasof average farm size of 170.92m2
The result further shows that the variable costconstitutes the lion share in all the enterprisecombinations. However, with respect to theproportion of the variable cost in all theenterprises, it is highest (89.01%) in Tilapia/heteroclaria enterprise and the lowest value(70.40%) was recorded in Tilapia/claria mix. Thelabour cost, cost of fingerlings and cost of feedconstitute the lion share of the variable cost intilapia/heteroclarias enterprise, tilapia /clarias andsole heteroclarias respectively.
Determinants of Revenue in Homestead FishProduction in Ogun State
The determinants of revenue in homesteadfish production in Ogun State are presented in
Table 1: Socio-economic characteristics of home-stead fish farmers in Ogun State
Characteristics Frequency Percentage
Age (years)< 30 2 2.7830-39 17 23.6140-49 27 37.550-59 15 20.8360-69 10 13.89> 70 1 1.39
SexMale 66 91.67Female 6 8.33
Marital StatusSingle 4 5.56Married 63 87.5Widowed 1 1.39Divorced 4 5.56
Educational StatusNo formal education 5 6.94Primary 12 16.67Secondary 21 29.17Tertiary 34 47.22
Household Size0-2 12 16.67]3-5 29 40.276-8 17 25.009-11 8 11.12> 12 5 6.95
Table 2: Costs and returns to homestead fish farmers in ogun state
Enterprise Sole Sole Tilapia/ Tilapia/item Clarias Heteroclarias Clarias mix Heteroclarias mix
Amount % of Amount % of Amount % of Amount % of Total Total Total Total
Total revenue(#) 32,753.52 75,652.88 98,475.12 130,217.28Variable Cost (#)
Labor cost 8381.82 36.36 6191.67 37.03 3700 12.56 11033.33 44.98Cost of fingerlings 31.55 14.5 63.31
7272.7 14.62 2424.58 48.47 18650 18.5 8485.33 34.59
Cost of feeds 3370.2 8103.33 75.74 5450.32 2480 10.11Cost of fertililer/lime 4025.1 17.46 0 1656.7 5.62 50 2.04Total variable cost 23049.82 75.68 16719.58 29457.02 70.4 24528.99 89.01
Fixed Cost (#)Rent/overhead(pond construction)Fixed cost depreciated 4801.31 3140.08 6250 2152.78(water pump,hook,net,etc.)Total fixed cost(#) 2605-80 2215.72 6136.67 874.86
7407.14 24.32 5355.8 24.26 12386.67 29.6 3027.64 10.99Total Cost(#) 30,456.96 22,075.38 41,843.67 27,556.63Net farm income(#) 2,296.56 53,577.50 40,631.69 102,660.65Average pond size 170.92 83.28 47.21 90 per enterprizeNo of farmers 9 18 19 3
have tertiary education, which is expected totranslate into high output and efficiency in fishproduction.
16 A.T. OLAWUMI, A. O. DIPEOLU AND O. M. BAMIRO
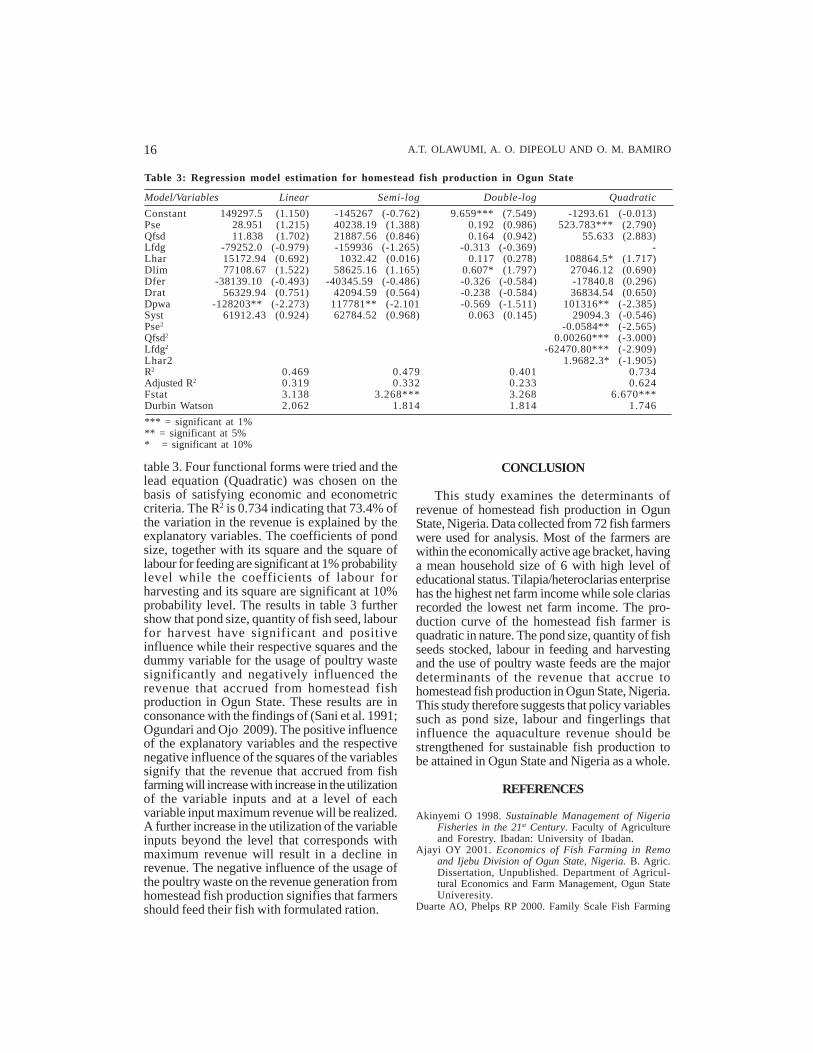
table 3. Four functional forms were tried and thelead equation (Quadratic) was chosen on thebasis of satisfying economic and econometriccriteria. The R2 is 0.734 indicating that 73.4% ofthe variation in the revenue is explained by theexplanatory variables. The coefficients of pondsize, together with its square and the square oflabour for feeding are significant at 1% probabilitylevel while the coefficients of labour forharvesting and its square are significant at 10%probability level. The results in table 3 furthershow that pond size, quantity of fish seed, labourfor harvest have significant and positiveinfluence while their respective squares and thedummy variable for the usage of poultry wastesignificantly and negatively influenced therevenue that accrued from homestead fishproduction in Ogun State. These results are inconsonance with the findings of (Sani et al. 1991;Ogundari and Ojo 2009). The positive influenceof the explanatory variables and the respectivenegative influence of the squares of the variablessignify that the revenue that accrued from fishfarming will increase with increase in the utilizationof the variable inputs and at a level of eachvariable input maximum revenue will be realized.A further increase in the utilization of the variableinputs beyond the level that corresponds withmaximum revenue will result in a decline inrevenue. The negative influence of the usage ofthe poultry waste on the revenue generation fromhomestead fish production signifies that farmersshould feed their fish with formulated ration.
Model/Variables Linear Semi-log Double-log Quadratic
Constant 149297.5 (1.150) -145267 (-0.762) 9.659*** (7.549) -1293.61 (-0.013)Pse 28.951 (1.215) 40238.19 (1.388) 0.192 (0.986) 523.783*** (2.790)Qfsd 11.838 (1.702) 21887.56 (0.846) 0.164 (0.942) 55.633 (2.883)Lfdg -79252.0 (-0.979) -159936 (-1.265) -0.313 (-0.369) -Lhar 15172.94 (0.692) 1032.42 (0.016) 0.117 (0.278) 108864.5* (1.717)Dlim 77108.67 (1.522) 58625.16 (1.165) 0.607* (1.797) 27046.12 (0.690)Dfer -38139.10 (-0.493) -40345.59 (-0.486) -0.326 (-0.584) -17840.8 (0.296)Drat 56329.94 (0.751) 42094.59 (0.564) -0.238 (-0.584) 36834.54 (0.650)Dpwa -128203** (-2.273) 117781** (-2.101 -0.569 (-1.511) 101316** (-2.385)Syst 61912.43 (0.924) 62784.52 (0.968) 0.063 (0.145) 29094.3 (-0.546)Pse2 -0.0584** (-2.565)Qfsd2 0.00260*** (-3.000)Lfdg2 -62470.80*** (-2.909)Lhar2 1.9682.3* (-1.905)R2 0.469 0.479 0.401 0.734Adjusted R2 0.319 0.332 0.233 0.624Fstat 3.138 3.268*** 3.268 6.670***Durbin Watson 2.062 1.814 1.814 1.746
*** = significant at 1%** = significant at 5%* = significant at 10%
Table 3: Regression model estimation for homestead fish production in Ogun State
CONCLUSION
This study examines the determinants ofrevenue of homestead fish production in OgunState, Nigeria. Data collected from 72 fish farmerswere used for analysis. Most of the farmers arewithin the economically active age bracket, havinga mean household size of 6 with high level ofeducational status. Tilapia/heteroclarias enterprisehas the highest net farm income while sole clariasrecorded the lowest net farm income. The pro-duction curve of the homestead fish farmer isquadratic in nature. The pond size, quantity of fishseeds stocked, labour in feeding and harvestingand the use of poultry waste feeds are the majordeterminants of the revenue that accrue tohomestead fish production in Ogun State, Nigeria.This study therefore suggests that policy variablessuch as pond size, labour and fingerlings thatinfluence the aquaculture revenue should bestrengthened for sustainable fish production tobe attained in Ogun State and Nigeria as a whole.
REFERENCES
Akinyemi O 1998. Sustainable Management of NigeriaFisheries in the 21st Century. Faculty of Agricultureand Forestry. Ibadan: University of Ibadan.
Ajayi OY 2001. Economics of Fish Farming in Remoand Ijebu Division of Ogun State, Nigeria. B. Agric.Dissertation, Unpublished. Department of Agricul-tural Economics and Farm Management, Ogun StateUniveresity.
Duarte AO, Phelps RP 2000. Family Scale Fish Farming
17ECONOMIC ANALYSIS OF HOMESTEAD FISH PRODUCTION IN OGUN STATE NIGERIA
in Guatemala, Economics Viability of Fish Farming.Journal of Aquaculture in the Tropics, 10(1): 57-72.
CBN 2006. Annual Report and Statement of Account ofCentral Bank of Nigeria for the year ended 31stDecember, 2005.
FAO 1995. Yearbook Production. Vol 45. Rome: FAOFAO 2005. Report Of The FAO-Worldfish Center
Workshop on Small-Scale Aquaculture in Sub-Saharan Africa: Revisiting the Aquaculture TargetGroup Paradigm. FAO Rome Publication. ftp://ftp.fao.org/docrep/ fao/008/a0038e/a0038e00.pdf.
Owolabi OO 2002. Wildlife contribution to meat proteinconsumption in the rural community in south-western Nigeria. Proceeding of the 27th annualConference Nigeria Society for Animal Production(NSAP) March 17 -21, Akure.
OGADEP 2004. Ogun State Agricultural DevelopmentProgramme. Fisheries unit working paper.
Papka PMS 1993. Conservation: Some search Areas forPolicy in Nigeria. FORMECU/STAT/PUB/No: 14:51
Ogundari K, Ojo SO 2009. An Examination of IncomeGeneration Potential of Aquaculture Farms inAlleviating Household Poverty: Estimation andPolicy Implications from Nigeria Turkish Journalof Fisheries and Aquatic Sciences, 9: 39-45.
Ojo SO, Fagbenro OA 2004. Poverty Reduction Strategyin Nigeria –Improving productivity and TechnicalEfficiency in Artisanal Fisheries in Niger DeltaRegion. Paper presented at the 12th Bi-annualconference of the International Institute of FisheriesEconomics and Trade (IIFET), Tokyo, Japan.
Tobor JG 1997. The Fish Industry in Nigeria: Status andPotential for Self Sufficiency in Fish Production. NigeriaInstitute of Maritime NIOMR Technical Paper, 54: 34.
Sani RM, David AE Kushwalia, Mbanasor J 1991 EconomicAnalysis of Fish Farming in Bauchi State. TropicalJournal of Animal Science, 1: 75-83
Recommended