Edexcel AS and A level Geography
Topic Booklet for Area of Study 2: Dynamic Places, Topic 4: Shaping Places,
Option 4A: Regenerating Places
Practical support to help you deliver this Edexcel specification
The aim of this topic booklet is get an overview of the key issues related to how local places vary economically and socially with change driven by local, national and global
processes. The four enquiry questions each follow a particular strand of investigation about
different elements of how places change: how and why do places vary; why regeneration might be needed; how regeneration is managed; and determining how
successful regeneration is. A key part of this topic is for students to gain a clear understanding of how processes of change can include movements of people, capital, information and resources, making some places economically dynamic while other
places appear to be marginalised. This creates and exacerbates considerable economic and social inequalities both between and within local areas. Furthermore,
students need to understand that urban and rural regeneration programmes involve a range of players which are involved in place making (regeneration) and place marketing (rebranding), that regeneration programmes impact variably on people,
and the relative success of such programmes depends on the extent to which the lived experience, perceptions, and attachments to places are changed.
There are two key things to bear in mind:
1) It is important to make sure students know enough about the located examples of different regeneration issues to be able to compare and contrast experiences
from different places, preferably with experiences in their local area.
2) When studying different places, students should always be trying to recognise how these places are perceived and presented differently, by and for different groups of people. In turn they should be considering the impact of these
representations on experiences (including their own) of place.
This booklet is aimed at helping teachers to develop a clear path through the unit, and should allow you to adapt your resources and develop your teaching as you guide your students through the content. It aims to show that the content is
manageable over the guided learning hours, although teachers will know the pace they need set to get students ready for the exam.

2 © Pearson Education Ltd 2016. Copying permitted for purchasing institution only. This material is not copyright free.
The booklet is aimed at both the AS and A levels in Geography; the AS Assessment will be at the end of the first year, and the A level Assessment will be at the end of
the second year.
Centres can adapt the guided learning hours to fit their own contexts and teaching styles. This topic booklet has been produced as an example approach and is not intended to be prescriptive. It will indicate resources that you can use to support
your teaching. These are only suggestions, and you are encouraged to use a wide range of resources to suit the needs of your students.
The advised teaching time for Option 4A: Regenerating Places is 20 guided learning hours + 6 hours of fieldwork lessons + 1 day of fieldwork. This requires some
blending together of the detailed content. The guidance below includes suggestions about contextualisation or challenges that may be suitable for more able students, as
well as expected lesson outcomes for less able students. Please note that these are suggestions only and not specific syllabus requirements.
Each enquiry question/key idea (EQ) is broken down into manageable sections, each beginning with a quick overview of the breadth of the enquiry question followed by a
more detailed explanation of the key concepts and processes, examples of teaching strategies, guidance on integrating geographical skills, and a summary of the key
terminology required. The structure is suggestive, not prescriptive.
Synoptic linkages and case study nesting
Our synoptic themes help students see ‘the bigger picture’ by encouraging them
to make geographical links between topics and issues. To enable this, and to support exam preparations, we have continued to signpost ‘Players’ (P), ‘Attitudes and Actions’ (A) and ‘Futures and Uncertainties’ (F) throughout the specification content.
Synoptic links include topics such as glaciation and the hazards that exist between volcanic eruptions and glacial outbursts. Other links can include geological formations, coasts, raw materials, mining and farming, all of which are discussed in
other areas of the course.
© Pearson Education Ltd 2016. Copying permitted for purchasing institution only. This material is not copyright free. 3
Introduction Overview
Students and teachers will gain an understanding of the population structures, changing population dynamics and demographic and cultural issues. Different
places are influenced by the dynamics of the communities that inhabit them, and impacted by a range of local, regional, national and international influences: EQ1: How and why do places vary?
EQ2: Why might regeneration be needed?
EQ3: How is regeneration managed?
EQ4: How successful is regeneration?
EQ1. How and why do places vary?
Teaching approach over 8 hours
Lesson 1 (1hr) Understanding how different economies are classified.
Lesson 2 (1hr) Inequalities in pay levels across economic sectors.
Lesson 3 (1hr) Changing functions and demographic characteristics.
Lesson 4 (1hr) Understanding changing functions and demographic
characteristics.
Lesson 5 & 6 (2hr)
Understanding regional, national, international and global
influences that shape places.
Lesson 7 & 8
(2 hr) Understanding how the local area has changed.
Lesson 1: Classification of economies
Overview
This first lesson could address Key Idea 4A.1a and 4A.1b by exploring how economic
activities can be classified by sectors as well as by the type of employment, and by looking at variation social factors. This should focus on an area where they live and another contrasting rural or urban area in the UK.
• More able students will be able to assess the importance of different economic
activities in your local area, and a contrasting area.
• Less able students could be asked to describe the differences between economic sector composition between your local area and a contrasting area.
Key concepts and processes
For this lesson students need to be able to understand how economic activity can be classified by sector (primary, secondary, tertiary, and quaternary) as well as by type
4 © Pearson Education Ltd 2016. Copying permitted for purchasing institution only. This material is not copyright free.
of employment (part-time, full-time, temporary, permanent, self-employed). This BBC Bitesize web page provides a good recap of the different sectors and how this
relates to employment structure.
It is also important students understand how economic activity and employment differ between economies. The Clarke-Fisher Model can be used to discuss changing employment structure (see the slides which can be downloaded from the Edexcel
Ning at edexcelbgeog.ning.com/forum/attachment/download?id=2599962%3A UploadedFile%3A45480).
In this model the differences between employment structure are associated with different stages of development.
The pre-industrial stage has high amount of primary industries, often with
many people working in subsistence farming. In the industrial stage, as manufacturing increases the secondary sector
grows in importance and primary sector goes into decline.
In the post-industrial stage the tertiary sector becomes the most prominent due to a rising demand for services. The quaternary sector also emerges.
Guidance on teaching
Use the Clarke-Fisher model to start discussions about changes in employment sectors, in particular focusing on the reasons for change, and highlighting the relevance of the model for your local area. You could prompt students to think how
this has changed over time. Which sectors do they think are the most important for their local area? Why?
For the main task students should work in groups to explore different social and economic indicators for your local area and another contrasting locality. You could
use the DataShine website which maps the 2011 census data, or Neighbourhood Statistics from the ONS. Students can feedback to others in the class about what can
be deduced from these economic indicators for the two places, and explore reasons for contrasts in the data.
Lesson 2: Inequalities of pay levels
Overview
The second lesson could tackle Key idea 4A.1c by focusing on how inequalities in pay
levels across economic sectors and in different types of employment are reflected in quality of life indices.
This lesson provides an opportunity to develop integrated skills (1) use of GIS to
represent data about place characteristics, and (3) use of index of multiple deprivation.
• More able students will be able to evaluate how useful the Index of Multiple Deprivation is for understanding inequality.
• Less able students could be asked to outline how inequalities are reflected in the Index of Multiple Deprivation.

© Pearson Education Ltd 2016. Copying permitted for purchasing institution only. This material is not copyright free. 5
Key concepts and processes
Building on what has been learnt in the previous lesson students will need to develop an understanding of how inequalities exists in pay levels across different economic sectors, as well as how these are reflected in quality of life indices such as the Index
of Multiple Deprivation.
The web page provides an interactive version of a wage distribution map for the UK which can be searched by location, and there is also a link to
download the data should you wish to do any further exercises on this topic.
Office for National Statistics To show a different indicator of inequality for comparison this map from the ONS on
‘Good health’ can also be used. There are concentrations of high percentages of ‘good general health’ in central and southern England, but there is a clear north-south divide. Compared to 2001 (which can also be viewed on the ONS web page)
there have been some improvements mainly in London, while some coastal areas such as Kent, East Sussex and Cambridgeshire have experienced some decline.
Index of Multiple Deprivation The Index of Multiple Deprivation (IMD) is a measure of relative deprivation for different areas (in England this is done by neighbourhood). There is no definitive cut off point at which an area can be described as deprived, so it is usual to describe
how relatively deprived an area is by saying whether it falls in the most deprived 10%, 20% and so on.
The IMD is comprised of seven different indices which respond to the different dimensions of deprivation: income; employment; education; health; crime; barriers to housing & services; and living environment. Supplementary indices are also
available which focus on income deprivation among children (ICACI) and older people (IDAOPI). The IMD is used by both national and local organisations to target resources and funding where efforts are needed most. It can be used as evidence to bid for funding
or to create development strategies for local areas. Of course, many other organisations, particularly those in the voluntary and community sector will also use
the index to identify areas where people may benefit from their efforts.
While the IMD is a very useful tool as a relative measure of deprivation, there are a number of things that the index cannot be used for: quantifying how
deprived as a small area is, to identify deprived people, saying how affluent a place is, comparing with small areas in other UK countries (each country in
the UK produces its own version of the IMD), and measuring real change in deprivation over time. More details on the IMD, and where to access the data
from the ONS are documented here.
The English Index of Multiple Deprivation, its components, how it can be used
and a map of the 2015 results are summarised in an infographic.
You can view an interactive map of the IMD for 2015 on the Department for
Communities and Local Government web page. The map allows the different elements of deprivation to be explored too.
6 © Pearson Education Ltd 2016. Copying permitted for purchasing institution only. This material is not copyright free.
Guidance on teaching
You could begin the lesson by discussing the pattern of wages across the UK, and reasons for them. This can be used to contrast with the proportion of the population reporting good health.
The Index of Multiple Deprivation should be discussed as a tool to measure levels of
deprivation. You can check the IMD score for your local area (and other areas for comparison) here.
A Spearman’s rank exercise can be used to investigate whether there is a link between the overall level of deprivation and another quality of life indicators (such as
percentage of people reporting poor health).
Lesson 3: Changing functions and demographic characteristics
Overview
This series of lessons can address Key idea 4A.2a by focusing on how over time, places have changed their functions (administrative, commercial, retail and industrial) and demographic characteristics (gentrification, age structure and ethnic
composition).
• More able students should be asked to assess which have been the most significant changes that have taken place in your local area.
• Less able students should be asked to outline how your local area has changed
over time.
Key concepts and processes
It is important for students to understand why changes may alter the function and
demographic characteristics of an area over time. This builds on lesson 1 which focused on changes in economic activity and employment structure. The Centre for
Cities think tank have a range of reports and resources which can be used to explore the changing geography in the UK, particularly in urban areas. There are many elements of this which could be explored, including:
Population change at local authority level: data and commentary from the
ONS. Population pyramids at the local authority level: neighbourhood statistics from
the ONS.
Changing ethnic composition: data and commentary from the ONS Land use changes: use the Google Earth time slider function.
Average property prices: use Zoopla Heat maps
Guidance on teaching
To begin the lesson, use some images of an area that has experienced significant change. If possible use some from your local area (if relevant developments have
taken place), and another contrasting location. You could use images of former derelict land, and one with subsequent developments from another location. Use
these images to discuss the reasons for changes in these areas.

© Pearson Education Ltd 2016. Copying permitted for purchasing institution only. This material is not copyright free. 7
The main activity for this lesson could focus on a teacher-led discussion around why places may change their function and demographic characteristics over time, making
links to ideas that were discussed in lesson 1 on changing economic activity. If possible discuss the changes that have taken place in your local area, but you could
also use other areas, particularly as contrasts.
Lesson 4: Understanding changing functions and demographic characteristics
Overview
The fourth lesson could tackle Key ideas 4A.2b and 2c, to explore reasons for changes in a place, and how change can be measured.
This lesson provides an opportunity to develop integrated skills (2) interpretation of oral accounts of the values and lived experiences of places from different interest
groups and ethnic communities, and (3) use of index of multiple deprivation. • More able students might be able to explain the most useful ways in which
change in a place can be measured. • Less able students may need to have a series of category prompts in order to be
able to explain change in a place.
Key concepts and processes
For this lesson it is important the students develop an understanding of: the various reasons why these changes take place, including, physical factors (e.g. shortage of
space); accessibility and connectedness (e.g. new road networks or airports); historical development (e.g. industrial change, sector shifts); the role of local and
national planning (e.g. ability to attract investment). Furthermore students should be able to understand the ways in which these changes
can be measured, this could be via:
Employment trends: changes to employment levels, dominant sectors or employment, and employment types. Data on labour market trends can be access from the ONS, or NOMIS.
Demographic changes: population growth, composition including gender, age, ethnicity. Data on all these issues can be accessed from the ONS.
Land use changes: photography (including aerial) and the use of Google earth showing changes in land use.
Levels of deprivation: changes could be indicated through changes to Index of Multiple of Deprivation data which could be used by students to describe and explain differences in levels of deprivation in their contrasting localities. The
IMD data mapper tool could be used for this.
Guidance on teaching
A good starting point is to build on previous lessons about how areas change over time by considering the reasons behind those changes. Encourage the students to mind map ideas before you discuss as a class. You could decide to give them a
stimulus to prompt ideas, of at least headings such as physical factors, accessibility etc.

8 © Pearson Education Ltd 2016. Copying permitted for purchasing institution only. This material is not copyright free.
The main part of this lesson should allow students to investigate the different
reasons why places change. You could decide to split students into four groups (physical factors, accessibility, historical development and national planning). Ensure
that in whole class discussions students are made aware of the details of the reasons, other than the one they are investigating.
Encourage students to use a variety of both quantitative and qualitative data in their investigation.
Lessons 5, 6, 7 and 8: Past and present connections
Overview This set of lessons could tackle Key ideas 4A.3a, 3b and 3c to explore how past and
present connections have shaped the economic and social characteristics of different places. This provides an opportunity to develop the integrated skills (4) around the
investigation of social media to understand how people relate to places where they live.
• More able students should be able to evaluate the ways in which their local area
has been affected by regional, national, international and global influences.
• Less able students should be able to recognise the different influences that have affected their local area.
Key concepts and processes
For these lessons students need to develop an understanding of how regional, national, international and global influences that have shaped your chosen place. These influences will vary greatly depending on the location you choose to study but
indicative influences at the different levels could include: Regional: regional development policies, or attempts to increase interaction
between settlements in a region, e.g. the Northern Powerhouse, Midlands Growth Engine.
National: impact of policies from central government, or expansion/demise of
a business that has a national presence. International: impact of EU policies or international trade agreements.
Global: impact of TNCs in the area or impact of migration.
When considering economic and social changes in their areas students could
focus on how the function and land use of the area has changed over the
years – a useful resource is www.oldmaps.co.uk. Other questions to pose to students to help them understand these issues:
Is there inequality in your area?
What is happening to house prices?
How have median incomes changed over the last ten years?
What evidence is there for aesthetic change?
There are a range of resources that can be used for this:
Interactive map of 2011 Census data: DataShine

© Pearson Education Ltd 2016. Copying permitted for purchasing institution only. This material is not copyright free. 9
A range of data is available from the ONS and Neighbourhood Statistics.
Social media sources such as Twitter and Facebook, online forum –
there are often local interest groups where some of these topic issues are discussed.
Newspapers.
Oral History Society – check if oral histories exist for your local area.
It is important that students appreciate that the perceived reality of the impact of changes on people’s lives can be different from the reality, and
using a range of sources in their investigations in these lessons can help develop this understanding. For example, particular newspapers might
present a view of how an area is changing that is not representative of the wider area.
Guidance on teaching
A helpful way to start these lessons is for students to produce a mind map of how their chosen place (either local area, or a contrasting place) is influenced
by regional, national and international factors.
For the main part of these lessons students need to cover investigating how
their chosen place is affected by the four scales of influence. It is important that students develop a knowledge of how their chosen area is affected by influences from these different scale whether this is regional interactions
(e.g. as part of a regional development policy) or a global influence (for example the presence of a TNC).
Use the first two lessons for students to investigate your local area (or
chosen place) and the second two lessons to investigate a contrasting location. As a plenary at the end of these lessons pair students up and have
students take turns talking non-stop about regional and national influences, and then international and global influences. Ensure that students can
distinguish between the scales of influence and where possible for students to indicate which has the most influence, and why?
Key vocabulary for EQ1
There are many key words in this section; here are just some of them.
Different Places
Economic activity
Employment structure Functions Index of Multiple
Deprivation
Median
Inequality Quality of Life
Regeneration
Gentrification Studentification
10 © Pearson Education Ltd 2016. Copying permitted for purchasing institution only. This material is not copyright free.
EQ2. Why might regeneration be needed?
Teaching approach over 8 hours plus fieldwork, analysis and
presentation
Lesson 9 (1hr) Perceptions of place: successful regions
Lesson 10 (1hr) Perceptions of place: less successful regions
Lesson 11 (1hr) Priorities for regeneration
Lesson 12 (1hr) Engagement in local communities
Lesson 13 (1hr) Attachment to places
Lesson 14 (1hr) Conflicts among communities
Lesson 15 and 16 (2 hrs)
Determining the need for regeneration
Lesson 9: Perceptions of place: successful regions
Overview
This lesson can address Key idea 4A.4a to explore how economic and social inequalities change people’s perceptions of an area. In particular the lesson
explores why successful regions have high rates of employment, inward migration, and low levels of multiple deprivation, but also high property prices and skill
shortages in both urban and rural areas. • More able students might like to provide an assessment of what key factors can
contribute to creating a successful place. • Less able students could be able to outline key factors that can create a
successful place.
Key concepts and processes
Students need to develop a clear understanding of the different economic and social inequalities that occur in different places, but also how these can change people’s
perceptions of an area. Perceptions are relative to people, place and time, and you should take time to explore the student’s perceptions of places both in this lesson
and throughout the topic – and encourage students to question why they have those perceptions.
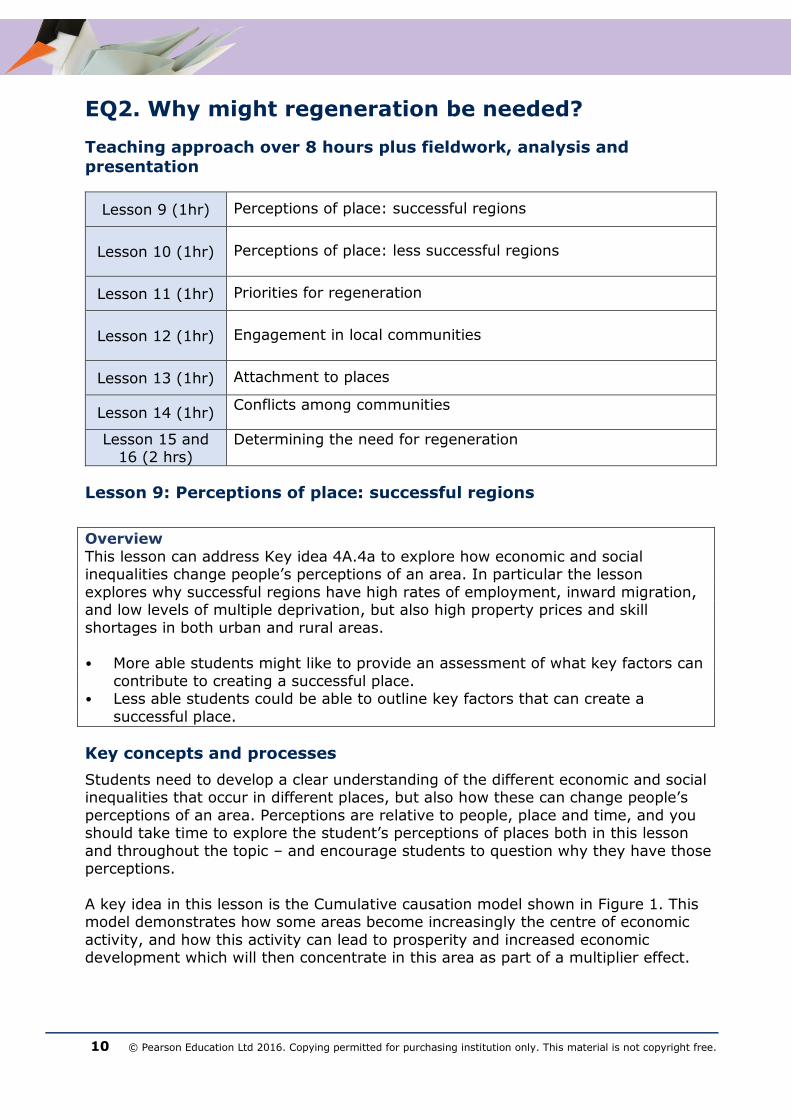
A key idea in this lesson is the Cumulative causation model shown in Figure 1. This model demonstrates how some areas become increasingly the centre of economic
activity, and how this activity can lead to prosperity and increased economic development which will then concentrate in this area as part of a multiplier effect.
© Pearson Education Ltd 2016. Copying permitted for purchasing institution only. This material is not copyright free. 11
Figure 1 – Cumulative causation model
Case study: San Francisco
San Francisco is known as an international centre for commerce and innovation, particularly as a hub for the technology industry with IT and digital media companies
like Twitter and Dropbox having their headquarters there, alongside a large cluster of bioscience companies. The San Francisco Center for Economic Development has a lot
of information about the development of San Francisco, including its history, information on key sectors etc.
An article from City Lab discusses the diverging economy of LA and San Francisco covering issues around why San Francisco has been considered prosperous, but also
some of the more negative issues that have developed there. San Francisco is considered by many as prosperous and is one of the wealthiest cities in the USA, as discussed in this Time article, with low unemployment levels, however it is not a city
without problems.
A study of economic inequality in California showed that in San Francisco the average income of the top 1% of households in the city averages $3.6 million, 44 times the average income of the bottom 99%. The city is facing an affordability and
housing crisis. In 2015 the San Francisco Bay area created 64,000 jobs but only added 5,000 new homes, and the average house in San Francisco now costs over
1
1
1
1
1
1
Introduction of a new industry or
expansion of a firm
Similar or related industries
attracted
Creation of
links to other
industries that
supply raw
materials or
parts needed
Creation of
links to other
industries that
process or use
good produced
Innovation
Creates more
jobs in wider
industries
including
construction
High level of
skilled workers
Increased
demand for
shops and
services
Increased
population
Increased
income for the
area from taxes
Growth of the
tertiary sector
and further
construction
Area becomes
attractive for
business to
locate
1
1
1
1
1
1
12 © Pearson Education Ltd 2016. Copying permitted for purchasing institution only. This material is not copyright free.
$1.25 million. These newspaper articles are all useful to explore these issues of development and inequality in San Francisco:
Quartz: San Francisco has become one huge metaphor for economic inequality in
America. Forbes: Technology and Inequality in San Francisco Quartz: Rampant wealth inequality in Silicon Valley could make San Francisco a
ghost town. NPR collection of articles on income inequality in the San Francisco Bay Area
City Lab: How to fix San Francisco The neighbourhood of Tenderloin, a 30 block district close to the financial district, is
often highlighted in discussions of inequality. While the neighbourhood has traditionally had a lot of single room occupancy residences for low income workers,
the arrival of tech companies in the area has led to gentrifications and pushed up prices so that many existing residents can no longer afford to live there. The following articles are helpful for exploring these issues:
New York Times: Where to see the inequality gap wrought by the Tech Boom Financial Times: Tale of two valleys: Silicon Valley fight over inequality
Time: San Francisco ‘Tech Tax’ proposal shows ‘deep divide’ in the city.
Case study: M4 Corridor An alternative case study you could consider is the M4 corridor, an area next to the
M4 motorway in the UK which runs from Heathrow Airport in the east to Bristol in the west, and is considered a major technology hub.
The BBC Bitesize article provides an overview of the M4 corridor area. This article from the Telegraph provides a map and commentary of industry in
the area. This article from the Economist provides a discussion of the issues the M4
corridor creates.
Guidance on teaching
It is useful to begin this lesson with students mind mapping characteristics of a ‘successful’ area to introduce the topic, and gauge what they consider
successful. Introduce the Cumulative causation model to discuss the ‘success’ of San
Francisco or another applicable area, such as the M4 corridor. Encourage students to discuss the social inequalities that this success will
bring – there are plenty of relatively deprived areas within parts of San
Francisco (e.g. Tenderloin). Ask students to identify the most significant facts behind the success of San
Francisco (or other chosen location), potentially using a diamond ranking exercise.

© Pearson Education Ltd 2016. Copying permitted for purchasing institution only. This material is not copyright free. 13
Lesson 10: Perceptions of place: less successful areas
Overview
This lesson can address Key idea 4A.4b to explore how economic and social
inequalities change people’s perceptions of an area. In particular the lesson explores why in some regions economic restructuring has triggered a spiral of decline, which
includes increasing levels of social deprivation. • More able students should be able to describe and explain how the process of
restructuring can trigger a spiral of decline. • Less able students should be able to identify how a spiral of decline can take
place.
Key concepts and processes
In this lesson students need a clear understanding of how some regions undergo
periods of economic restructuring and the impact this can have (for example changes in social deprivation). In particular they need an awareness of how this can trigger a spiral of decline in both urban and rural areas.
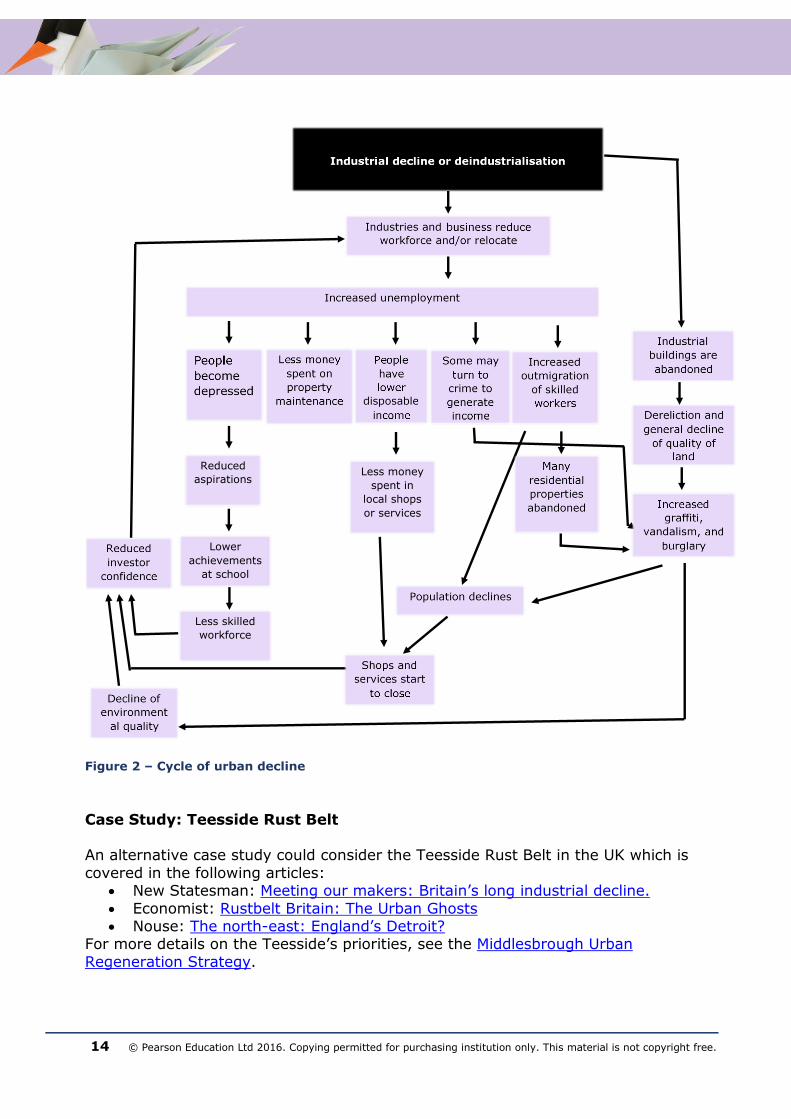
The spiral of decline is sometimes termed the negative multiplier effect, and occurs
when a sectoral change occurs in a region (this could be deindustrialisation in an urban area, leading to closure of factories and unemployment) or a decline in the primary sector in a rural area, again creating unemployment. Figure 2 (next page)
summarises the process.
Case study: The American Rust Belt
Many cities in the American rust belt (a heavy manufacturing region that generally borders the Great Lakes) have seen their populations shrink since the 1970s. Cities
such as Buffalo, Cleveland, Detroit and Pittsburgh have lost more than 40% of their populations according a commentary from the Federal Bank of Cleveland. While decline has been widespread over the region, the changes have been uneven.
An economic policy paper from the Federal Reserve Bank of Minneapolis charts the
competition and decline of the rust belt: Lack of competition in the 1950s in heavy manufacturing in the US meant
there was little incentive to innovate.
Decline of heavy manufacturing industry in the US ‘Rust belt’ beginning in the 1970s following recession.
Foreign imports increased and manufacturing shifted south which mean the Rust Belts share of jobs decreased. Some innovations from manufacturers in the region stabilised the situation a little, but at a much lower level of
production (and employment). Further recession in the 1980s and a continued decline of US manufacturing
since.
An Economic Commentary from Federal Reserve Bank of Cleveland Urban Decline in Rust-Belt Cities provides a discussion of how urban change has taken place since the 1970s which is also useful.
14 © Pearson Education Ltd 2016. Copying permitted for purchasing institution only. This material is not copyright free.
Figure 2 – Cycle of urban decline
Case Study: Teesside Rust Belt An alternative case study could consider the Teesside Rust Belt in the UK which is
covered in the following articles: New Statesman: Meeting our makers: Britain’s long industrial decline.
Economist: Rustbelt Britain: The Urban Ghosts Nouse: The north-east: England’s Detroit?
For more details on the Teesside’s priorities, see the Middlesbrough Urban
Regeneration Strategy.
Less money
spent in
local shops
or services
Reduced
aspirations
Lower
achievements
at school
Less skilled
workforce
© Pearson Education Ltd 2016. Copying permitted for purchasing institution only. This material is not copyright free. 15
Guidance on teaching
In a similar fashion to the previous lesson, it is useful to start the lesson by mind mapping the characteristics of an unsuccessful area. While many of the ideas may simply be the opposite of a successful area, try to tease out the differences for
example the decline of an industry in a particular industry may be driven by globalisation. The main exercise for the lesson could be to establish a discussion
around the less successful areas of the American Rust Belt or the Teesside Rust Belt.
What should Teesside’s priorities be as it attempts to move out of the cycle of
decline?
Lesson 11: Priorities for regeneration
Overview
This lesson covers key idea 4A.4c to explore the different priorities for regeneration due to significant variations in both economic and social inequalities including gated
communities, sink estates, commuter villages, and declining rural settlements.
More able students should be able to assess the different regeneration priorities for a named location.
Less able students should be able to identify different types of settlements which
would have different regeneration priorities.
Key concepts and processes
For this lesson students need to understand the different priorities for regeneration
due to economic and social inequalities. In particular students should develop knowledge of the priorities in four types of communities.
Gated Communities: where a residential community has controlled entrances, usually enclosed in perimeter walls. This Prezi presentation provides a useful
overview of issues related to gated communities. BBC: Gated community warning
A case study of a gated community in Barcelona. Sink Estates: the term given to a number of run-down housing estates. In 2016
David Cameron announced that £140 million would be spent on regeneration projects to replace the run-down housing with attractive and safe homes.
The UK government press release on the David Cameron’s pledge to transform sink estates.
Article by David Cameron on estate regeneration
Commuter Villages: settlements where a large proportion of residents commute
out of town for work. Declining Rural Settlements as a consequence of rural depopulation.
This BBC GCSE Bitesize article explores why rural settlements are declining, and the cycle of decline that is associated with it.
This briefing paper examines the long term trends in rural depopulation in the US.
Financial Times: Population of rural America continues to fall

16 © Pearson Education Ltd 2016. Copying permitted for purchasing institution only. This material is not copyright free.
Guidance on teaching
Building on the discussions from the previous lesson (American Rust Belt or Teseside) students prioritise a series of regeneration strategies, justifying their choices.
The main activity for this lesson could either be based around a teacher-led
discussion on the priorities for regeneration in four differing localities: gated communities, sink estates, commuter villages and declining rural settlements, or you could put students into groups to research them and then feedback into a class
discussion. Students need to develop knowledge of each of these types of localities so it is important that while groups are researching just one type, they have the
opportunity to learn about all of them, through class discussion for example. Students could then be set the task at the end of the lesson to write an essay based
on what they have learnt, and get another student to write a review of it for homework.
Lesson 12: Engagement in local communities
Overview
This lesson covers Key Idea 4A.5a to explore the significant variations in the lived
experience of places and engagement with them, from local and national election turnout, to development and support for community groups.
More able students should be able to assess the relationship between deprivation
and political engagement in communities.
Less able students could be asked to describe patterns of political engagement in the UK.
Key concepts and processes
Students need to develop an understanding of the variations of the lived experience of places and how people engage with them. This includes:
Being able to describe patterns of local and national election turnout. Being able to recognise any relationships between political engagement and
deprivation.
To explore political engagement in the UK following the 2015 election, see the 2015
Election maps from the BBC.
A range of data on voter turnout by constituency, as well as election turnout
by age can be accessed from UK political. A range of other data on election and referendums results can be accessed
from the Electoral Commission. Ipsos Mori provides reports which illustrate how different groups have varying
levels of engagement.
For this lesson which will explore the relationship between engagement and
deprivation, the Index of Multiple Deprivation Index tool can be used.

© Pearson Education Ltd 2016. Copying permitted for purchasing institution only. This material is not copyright free. 17
Guidance on teaching
You could begin the lesson by showing the class the graphic from this article which displays engagement levels in the EU referendum. Students can then discuss why they matter.
The main activity for the lesson is designed for students to investigate the
relationship between electoral turnout and levels of deprivation using some of the resources outlined above. You could ask students to complete a Spearman’s rank exercise to do this.
In particular students should not only explore the relationship with levels of
deprivation more generally, but consider how the difference in engagement between different groups within communities. Ensure students have an opportunity to share their opinions about why variations in engagement take place.
Lesson 13: Attachment to places
Overview
This lesson can cover Key Idea 4A.5b to explore the lived experience of, and attachment to places varies according to age, ethnicity, gender, length of residence (new migrants, students) and levels of deprivation. In turn the lesson should also
consider how these issues have an impact on the levels of engagement.
More able students should be able to explain the complexities of attachment to place and how this can impact on local engagement.
Less able students might be given a writing frame to consider different factors
that affect attachment to place.
Key concepts and processes
This lesson builds on the concept of varied lived experience of place to consider
different levels of attachment to place, and in particular how this varies between different populations. Students also need to recognise that this can impact on levels
of engagement with place too. A useful resource outlining the principles behind community engagement could be
used as a discussion starter.
Guidance on teaching
You could begin this lesson with a discussion over the factors that affect attachment to places.
This would involve discussing what factors give students a sense of belonging/pride in their local area and the reasons behind their pride.
Do students feel more attachment to an area other than the one they currently live in?
What factors influence this? The main activity involves group work to focus on different factors that affect
attachment to place: age, ethnicity, gender, levels of deprivation, length of residence. Students should then discuss the topics as a class.
18 © Pearson Education Ltd 2016. Copying permitted for purchasing institution only. This material is not copyright free.
Lesson 14: Conflicts among communities
Overview This lesson can cover Key Idea 4A.5c to explore how conflicts can occur among
contrasting groups in communities that have different views about the priorities and strategies for regeneration, these have complex causes (lack of political engagement
representation, ethnic tensions, inequality and lack of economic opportunity). It will also address 4A.6c to consider how different representations of your chosen local place could influence the perceived need for regeneration.
This can provide opportunities for using integrated skills to (7) evaluate different
sources of information (including music, film, art, literature) and appreciate why they create different representation of a local place.
More able students should be able to produce an assessment of the factors that caused the 2011 riots in England.
Less able students should be able to describe and explain some of the events that took place in the 2011 riots in England.
Key concepts and processes
This lesson focuses on a case study of the 2011 England riots as an example of how conflicts can occur between contrasting groups in communities. There are many
videos widely available online if you search for ‘2011 England riots’ which could be used to introduce the topic.
This article from the Guardian focuses on David Cameron’s speech on ‘broken society’ which explores his ideas about some of the social and economic problems
which may have been factors that led to the riots (and what he intended to do to solve them):‘Social problems that have been festering for decades have exploded in
our face’. There are a wide range of newspaper articles on the riots which you could use with
students: The Telegraph: Riots and the underclass lashes out.
BBC: England riots 2011 timeline Twitter feed from Our Tottenham provides a useful insight into local views
regarding developments in the area.
The Week: What caused the London riots- five theories. The Guardian: Music and exploring the riots
Huffington Post: Colour Mixed With Confusion: How artists responded to the 2011 England riots
If you intend to link this case study to regeneration more explicitly the Broadwater Farm Estate in Tottenham is a useful area to focus on when looking at regeneration
strategies in the area:
Tottenham Independent: Meeting held to object redevelopment of Broadwater Farm.
A history of Broadwater Farm provides an overview of priorities over time.
Inside Housing: article on how the estate has moved on following the riots. Evening Standard: Tottenham in £1 billion turnaround

© Pearson Education Ltd 2016. Copying permitted for purchasing institution only. This material is not copyright free. 19
Guidance on teaching
To start the lesson show a video clip of the 2011 London riots.
Discuss the factors that could cause individuals to resort to such extreme actions. Huge amounts of footage are available online. You could also use David Cameron’s
speech on ’broken society’.
The main activity should discuss why conflicts may occur between different groups within a community with different views about regeneration priorities.
These different views lead to different perceptions regarding the need for regeneration. You could link these ideas to those discussed about levels of
engagement from previous lessons. Students should complete a case study on the 2011 London riots, focusing on causes and regeneration.
To finish the lesson ask students what the most significant cause of the London riots was. You could use a ranking exercise to prioritise the causes, based on the
evidence found in the articles seen in the lesson. Ask the question ‘How should this affect regeneration targets in London?’.
Lessons 15 and 16: Determining the need for regeneration
Overview
This pair of lessons can cover Key Idea 4A.6b to develop an understanding of how different media can provide contrasting evidence questioning the need for regeneration in your chosen area, and understand how different representations of
your chosen local place could influence the perceived need for regeneration.
This can provide opportunities for using integrated skills to (5) test the strength of relationships through the use of scatter graphs and Spearman’s rank correlation, and
the (6) use of different newspaper sources to understand conflicting views about plans for regeneration.
More able students should be use a range of statistical techniques to assess the relationship between the need for regeneration and key economic and social
indicators. Less able students should be able to use statistical techniques to suggest
relationships between key economic and social indicators and the need for
regeneration.
Guidance on teaching
To start the lesson give students a range of news headlines about the same issue
from a variety of media sources, illustrating the different political slants of UK newspapers, ranging from the Socialist (left), Metro (centre) and to the Mail (Right).
It would be useful to have access to ICT for the main activity for these lessons. Students should collect evidence to evaluate the need for regeneration in their
chosen area. You could use datasets from Neighbourhood Statistics or ONS.
20 © Pearson Education Ltd 2016. Copying permitted for purchasing institution only. This material is not copyright free.
Students should be encouraged to produce a Spearman’s rank comparing high
unemployment with poor health. GIS software such as ArcGIS could be used to map the data to show spatial differences.
Discuss how different sources such as newspaper, TV documentaries and online video clips of the same locality can generate different perceptions of an area. Ideally
base this on your students chosen area.
End the pair of lessons with a discussion of what the priorities for regeneration should be for your local area? Is your chosen area facing a spiral of decline? How do you know?
Key vocabulary for EQ2
Regeneration
Cumulative causation Cycle of decline
Multiplier effect Negative multiplier effect
Spiral of decline
Sink estate Gate communities
Commuter Villages Lived experience
Studentification
EQ3. How is regeneration managed?
Teaching approach over 7 hours
Lesson 17 (1hr) Regeneration and infrastructure
Lesson 18 (1hr) UK government decisions
Lesson 19 (1hr) Creating sympathetic business environments
Lesson 20 (1hr) Urban and rural regeneration strategies and local interest groups
Lesson 21 (1hr) Presentations
Lesson 22
(1 hr) Rebranding and re-imaging
Lesson 23
(1 hr) Rural rebranding strategies

© Pearson Education Ltd 2016. Copying permitted for purchasing institution only. This material is not copyright free. 21
Lesson 17: Regeneration and infrastructure
Overview
This lesson will cover key idea 4A.7a to consider how infrastructure investment (high speed rail, airport development) is used in order to maintain growth and improve
accessibility to regenerate regions. More able students might evaluate the importance of infrastructure in
regenerating a named region. Less able students would be able to describe different types of infrastructure
investment which have been used as part of regeneration programmes.
Key concepts and processes
For this lesson students need to develop an understanding of the role of
infrastructure in regeneration: How does infrastructure maintain growth in regions?
How does infrastructure improve the ability to regenerate regions What conflicts does infrastructure development cause?
Two case studies which could be used for this in the UK are the Heathrow Airport expansion and HS2.
Case study: Heathrow Airport expansion
There have been several proposals which intend to increase capacity at Heathrow airport. While the proposals at various stages have been well supported by business, aviation industry, Chambers of Commerce and many other organisations, it has
received significant resistance both from local residents and environmental groups but also from political parties. Reports submitted to the Airport Commission on the
proposed expansion are available from the Heathrow website. The issue is frequently discussed in the media:
Financial Times: Heathrow expansion to offer greatest economic benefit
Sky News: Airport expansion – the case for and against Collection of articles from the Guardian: Heathrow third runway
BBC: Heathrow Airport expansion: Why the renewed delay? BBC: Heathrow runway expansion: Green spaces design revealed
Case study: HS2 High speed 2 (HS2) is a high speed railway designed to link London, Birmingham,
the East Midlands, Leeds, Sheffield, and Manchester. You can view an interactive map of the proposed route, as well as a wide range of articles from the UK government on the railway. The railway has been a topic of contention since the
initial proposals based on environmental, economic and social concerns, some of which are discussed in the following places:
Sky News: HS2: Cases for and against high-speed rail YouGov: For and against High Speed Rail
Stop HS2 campaign website.
Guidance on teaching
To begin the lesson start by discussing the importance of transport infrastructure in attracting investment.

22 © Pearson Education Ltd 2016. Copying permitted for purchasing institution only. This material is not copyright free.
How well developed is the transport infrastructure in your region? How does it compare to the rest of the UK?
The main activity of the lesson should involve using a variety of case study material
to be analysed discussing government investment in UK transport infrastructure. Case studies could include expansion of Heathrow airport or HS2, you do not need to cover both.
Students could undertake a cost-benefit analysis exercise for each project, focusing
on the financial, social and environmental costs versus the benefits of the proposal. Students could be encouraged to explore the costs/benefits for the areas affected by the investments as well as the wider UK, for instance are some areas benefitting to
the detriment of others?
To finish the lesson divide the students into two groups, for and against. Five minute discussion: Is HS2 a blessing or a curse?
Lesson 18: UK government decisions
Overview
A second lesson can address key idea 4A.7b and c. Firstly, this lesson will explore how the rate and type of development affecting economic regeneration of both rural and urban regions. Secondly, this lesson will examine UK government decisions
about international migration and the deregulation of capital markets which have significant impacts on the potential for growth and both direct and indirect
investment. More able students might be asked to evaluate the role of house building on
regeneration of urban regions in the UK. Less able students might be able to highlight ways in which house building can
contribute to regeneration in urban regions in the UK.
Key concepts and processes
As outlined in the overview this lesson requires students to develop a clear understanding of how planning laws, house-building targets, housing affordability,
and permission for fracking can affect rural regeneration, and the different ways in which they do so. Additionally, students need to be able to recognise how changes in
international migration affected by government decisions as well as deregulation of capital markets can impact on how the country develops, due to effects on investment. The following resources are useful to gain an overview of each of these
issues:
Fracking: Developing shale oil and gas in the UK from the UK government
Guardian article North Yorkshire council backs first UK fracking tests for five years

© Pearson Education Ltd 2016. Copying permitted for purchasing institution only. This material is not copyright free. 23
House Building:
Ponteland residents say no to building on the green belt. Independent: Housing minister Brandon Lewis says target is a million new
homes by 2020. Deregulation:
Guardian: Margaret Thatcher’s deregulation of the City a myth Financial Times: Bank deregulation part of Margaret Thatcher’s legacy
Financial Times: What will Brexit mean for the City of London? International migration:
Migration Observatory: The Labour Markets Effects of Immigration Migration Observatory: Migration and Brexit
FullFact.org: UK Migration Policy since the 2010 General Election
Guidance on teaching
In order to introduce the key concepts and processes for the lesson (fracking development, new house building, financial market deregulation and international migration) show students some newspaper headlines and ask them to feedback their
prior knowledge on the issues.
The main activity for the lesson should be organised like a market place activity. Organise four stations, one for each of the topics. Students can then learn about each of these issues in turn. Or you could decide to allocate a different issue to
groups, and then share the findings in class discussion. For fracking students should consider why the government is so keen to
pursue this strategy, as well as covering the environmental and social objections.
For house building, students could be given a local case study focusing on the
arguments for and against house building in their local area. For deregulation students could focus on the arguments for and against
deregulation of the financial sector and the free movement of labour. For international migration students should examine how migration has
significant impacts on the labour market and UK growth and how the government’s policy may be adjusted post-Brexit.
Lesson 19: Creating sympathetic business environments
Overview This lesson can cover key idea 4A.8a to examine how local governments compete to create sympathetic business environments with local plans designating areas for development for a range of domestic and foreign investors (science parks).
More able students should be able to assess the importance of science parks for
creating innovation and growth in the UK. Less able students should be able to provide examples of where science parks
have been positive developments in the UK.

24 © Pearson Education Ltd 2016. Copying permitted for purchasing institution only. This material is not copyright free.
Key concepts and processes
It is important that students understand how local governments aim to attract inward investment. This should include an understanding of what Enterprise Zones are in the UK, and the role of science parks as a particular method of attracting
investment.
Enterprise Zones: Enterprise zones are ‘designated areas across England that provide tax breaks and Government support’ which were designed to be part of the governments long term
economic plan to support business growth in the UK, and in particular attract more investment, to create jobs and sustainable growth. More information about
Enterprise Zones is available from the Government website. Up to 48 Enterprise Zones are planned to be in place in England by 2017.
Science Parks: Science Parks are designated areas which have been created to promote innovation,
and act as hubs for advances in high technology. They are intended to: encourage the start-up and incubation of innovation-led, high-growth knowledge-based business; provide an environment where international businesses can develop links
with knowledge centres; be an area where links with universities and higher education institutes are made with businesses. A list of UK Science Parks is available
here. Examples of some science park websites:
Sci-Tech Daresbury: http://www.sci-techdaresbury.com/ Cheshire Science Corridor: http://cheshiresciencecorridorez.com/
Harlow: http://harlowez.org.uk/
Guidance on teaching
Begin by discussing with students how local authorities might attempt to make their area more attractive to inward investment. Provide students with the information on Enterprise Zones from HM Government.
Science parks will form the focus of the main activity in the lesson. As a specific form
of encouraging investment, science parks are often located in Enterprise Zones. Students should research a science park and produce a short PowerPoint presentation covering the names of companies located there, the advantages in
terms of investors locating there and the methods local authorities have used to encourage investment.
It may be possible to contact a company who has located on a nearby park to ascertain this information, but science parks will often have their own website.
Finish with a group discussion to examine the success of your chosen science park:
has it achieved its initial aims?
© Pearson Education Ltd 2016. Copying permitted for purchasing institution only. This material is not copyright free. 25
Lesson 20: Urban and rural regeneration strategies and local
interest groups
Overview This lesson can cover key idea 4A.8b and C. This will examine how local interest groups (Chambers of Commerce, local preservation societies, trade unions) play a
key role in decision making about regeneration; and the different types of regeneration strategies. This should include a focus on the London 2012 Olympic
Games and Powys Regeneration Partnership. More able students might be asked to assess the roles of particular stakeholders
for a regeneration strategy of your choice. Less able students might be asked to outline the key roles of stakeholders in a
regeneration strategy of your choice.
Key concepts and processes
Students need to develop an understanding of the different roles of decision makers
in regeneration processes and the tensions that can occur between them. To do this students should develop a knowledge of different regeneration strategies. As
students will be investigating different case studies in these lessons they will not cover all the strategies, so it would be useful if different case studies made by class members could be shared so students develop knowledge of a range of strategies.
Sport-led regeneration (e.g. London Olympic Park or Manchester Etihad stadium)
There are a range of resources available which consider the role of sport in regeneration:
Scottish Executive: The Role of Sport in Regenerating Deprived Areas. Populous: Creating Communities: Thirty Years of sports-led regeneration.
London Assembly: The Regeneration Game - Stadium-led regeneration.
Considering the situation in Rio and the 2016 Olympic games. Examining some impacts of the 2012 Olympic Games: London’s Olympic Legacy.
Retail-led plans (e.g. Liverpool One, Trinity Leeds)
According to a recent consultancy report: ‘Retail-led regeneration is an important mechanism to revitalise communities by providing jobs, promoting economic growth
and creating attractive places to draw people into an area. It also has an important role to play in place-making as an element of wider urban regeneration’.
The report explores five case studies (Dalton Park, County Durham; Glasgow Fort; The Centre Feltham; Mailbox, Birmingham; Castle Vale, Birmingham) to display that
the main impacts can be: accessibility to jobs and training for local people, improved pride of place, better integration and cohesion; living in neighbourhoods; accessibility; cleaner and safer environment; better quality of life; connectivity; and
opportunity for supporting SME’s and local business.
Culture-led regeneration (Newcastle Quayside, Albert Docks) ‘The use of culture as a tool to stimulate local economic development and urban regeneration has been much practised over the past 20-30 years. It is based on the
premise of creating distinctive cities that are attractive and inviting to the skilled workers who are needed to fuel the knowledge economy’ – see CLES, p.1.
26 © Pearson Education Ltd 2016. Copying permitted for purchasing institution only. This material is not copyright free.
This video provides a brief introduction to the concept of culture-led
regeneration. The Centre for Local Economic Strategies has produced a report on Culture
Led Regeneration & Local Art Communities. A report from the University of Warwick explores the emergence of culture-led
regeneration as a concept.
Tourism and leisure-led regeneration (Powys, York, Salford Quays)
In some places a focus on tourism and leisure-led regeneration is thought to create opportunities to improve public spaces, not only in showcase city centres and waterfronts, but in disadvantaged estates where improvements could drastically
improve people’s quality of life.
A report from SEI International explores case studies of York, Salford and Hackney. There are a wide range of case studies both in the UK and abroad that could be explored for this type of regeneration. For example, Belfast City Council has a range
of leisure-led regeneration projects planned.
Public and private rural diversification Economic development in rural areas where new activities are taking place to
counteract declining incomes from primary sector activities, in an effort to generate new revenue streams, job opportunities and make living in rural areas more sustainable.
There is guidance for farmers on diversifying farming businesses from the UK government, from suggestions around alternative agricultural projects to
diversification out of agriculture, as well as suggestions about how to develop ideas for diversification and how they might gain funding to support them.
There are a range of useful case studies provided on the Farming Futures website. Regeneration is not just an activity that takes place in urban areas, and Rural
Regeneration Zone outlines key components of rural regeneration strategies: economy, infrastructure, affordable housing, access to services, conservation of the environment, protection of historical and natural heritage. The Rural Regeneration Unit, a social enterprise, designs and delivers social and
economic projects to help regenerate communities, in part through promoting sustainable links between rural and urban communities.
This article from the Guardian also discusses how regeneration is important in rural areas and needs to include physical, social, economic and environmental issues to be
successful. An interesting case study for this section is the Powys Regeneration Partnership,
which aims to: add value to local identity and natural and cultural resources
facilitate pre-commercial development, business partnerships and short supply chains
explore new ways of providing non-statutory local services
provide renewable energy at community level exploit digital technology.

© Pearson Education Ltd 2016. Copying permitted for purchasing institution only. This material is not copyright free. 27
Guidance on teaching
To start students could draw a spider diagram detailing as many regeneration strategies as possible, with examples. For example sport-led regeneration – Olympic Park; or cultural regeneration – Liverpool, Newcastle, Glasgow. You could provide
images of various regenerated areas to stimulate discussion.
The main activity investigates each of these types in more depth. Split students into pairs and allocate them a different regeneration strategy.
Students can then collect data focusing on how the areas in their case studies have been regenerated, and how this has impacted on different stakeholders, to be
presented in a later lesson.
Lesson 21: Presentations
Overview
This lesson addresses 4A.8a, 8b and 8c around how local government policies aim to
represent areas as being attractive for inward investment. In this lesson students
can deliver their regeneration presentations from the previous lesson.
Lesson 22: Rebranding and re-imaging
Overview This lesson will address 4.9a and 9b. The will examine how rebranding involves re-imaging places using a variety of media. In particular for the UK, students will
develop an understanding of how for UK deindustrialised cities rebranding can stress the attraction of places, creating specific place identity building on their industrial
heritage; this can attract national and international tourists and visitors, using the example of Glasgow ‘Scotland with Style’.
This can provide opportunities for developing integrated skills around exploration of discursive/creative media sources to find out how place identity has been part of
rebranding. More able students might be asked to compare and contrast two urban
rebranding strategies in the UK.
Less able students might be asked to explain the rebranding process.
Key concepts and processes
Students need to develop a clear understanding of the concepts of rebranding, how it relates to regeneration and how it can be used to make areas appear more
attractive.
They also need to be able to explain how rebranding has been used in examples of UK deindustrialised cities.
28 © Pearson Education Ltd 2016. Copying permitted for purchasing institution only. This material is not copyright free.
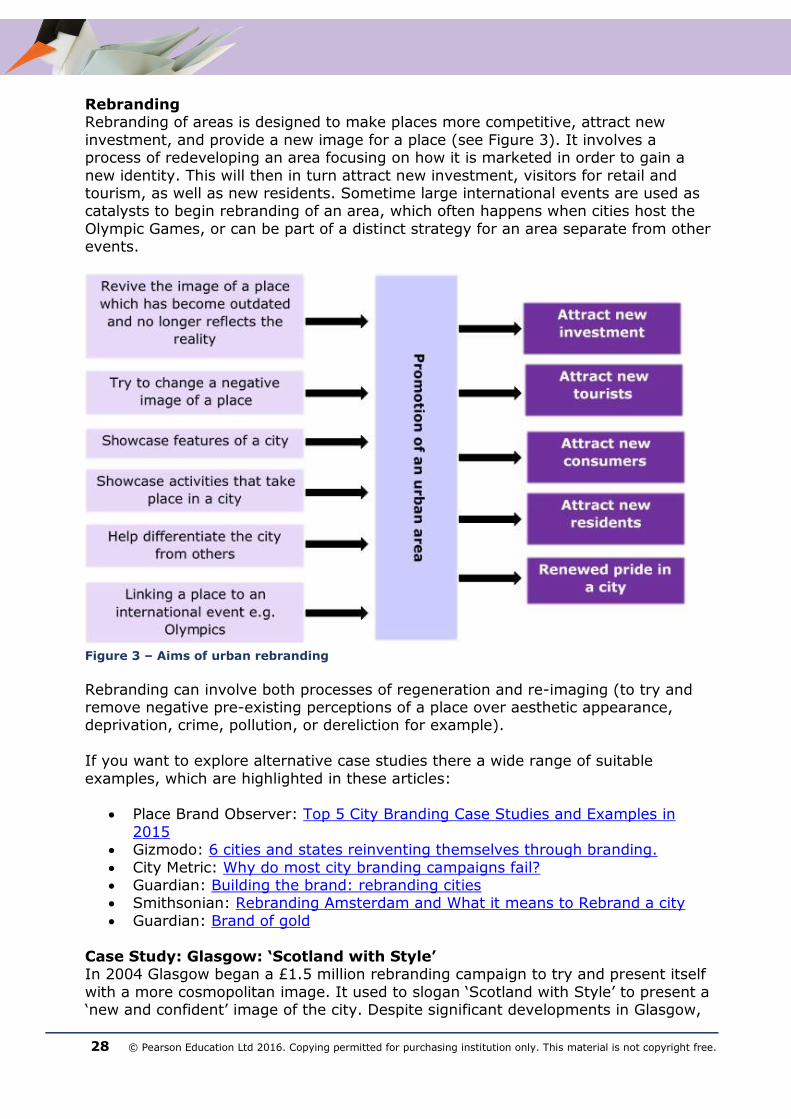
Rebranding Rebranding of areas is designed to make places more competitive, attract new
investment, and provide a new image for a place (see Figure 3). It involves a process of redeveloping an area focusing on how it is marketed in order to gain a
new identity. This will then in turn attract new investment, visitors for retail and tourism, as well as new residents. Sometime large international events are used as catalysts to begin rebranding of an area, which often happens when cities host the
Olympic Games, or can be part of a distinct strategy for an area separate from other events.
Figure 3 – Aims of urban rebranding
Rebranding can involve both processes of regeneration and re-imaging (to try and remove negative pre-existing perceptions of a place over aesthetic appearance, deprivation, crime, pollution, or dereliction for example).
If you want to explore alternative case studies there a wide range of suitable
examples, which are highlighted in these articles:
Place Brand Observer: Top 5 City Branding Case Studies and Examples in
2015 Gizmodo: 6 cities and states reinventing themselves through branding.
City Metric: Why do most city branding campaigns fail? Guardian: Building the brand: rebranding cities Smithsonian: Rebranding Amsterdam and What it means to Rebrand a city
Guardian: Brand of gold
Case Study: Glasgow: ‘Scotland with Style’ In 2004 Glasgow began a £1.5 million rebranding campaign to try and present itself
with a more cosmopolitan image. It used to slogan ‘Scotland with Style’ to present a ‘new and confident’ image of the city. Despite significant developments in Glasgow,

© Pearson Education Ltd 2016. Copying permitted for purchasing institution only. This material is not copyright free. 29
and a growing economy many people held negative perceptions of the city and it was felt that it was time for the city to re-launch itself to make the world aware of what it
had to offer. One of the initial adverts launched as part of the campaign was a slogan, ‘Glasgow: The New Black’.
More information about this case study is available from:
Guardian: Glasgow rebrands itself as city of style BBC: Glasgow unveils £1.5m rebranding
Hidden Glasgow forums If you have access to the materials from Pumpkin Interactive there is good video
resource on #Regenerating a City: The Rebranding of Glasgow’, but there are also a number of useful videos on YouTube.
Guidance on teaching
To begin the lesson students should define the difference between rebranding and
re-imaging. Display before and after images of cities that have experienced deindustrialisation, illustrating how rebranding and re-imaging have taken place. Many northern cities such as Manchester, Glasgow, Liverpool, Leeds or Newcastle
could be used.
For the main activity provide students with case study material on rebranding in Glasgow. Students should analyse the material provided, in particular investigating the causes of deindustrialisation in Glasgow, the strategies used to rebrand the city
and the impacts (social, economic and environmental, both positive and negative) that this rebranding has had.
To end the lesson it is useful to ask the question ‘What have been the most effective regeneration projects implemented in Glasgow?’
Lesson 23: Rural rebranding strategies
Overview
This lesson will address 4.9c to examine how there are a range of rural rebranding strategies in the post-production countryside based on heritage and literary
associations, farm diversification and specialised products, outdoor pursuits and adventure in both accessible and remote areas. You should examine the examples of ‘Bronte country’ and Kielder Forest.
More able students should be able to assess to what extent rural rebranding
strategies are key to successful growth in the post-production countryside. Less able students should be able to describe examples of rural rebranding
strategies.
Key concepts and processes
For this lesson students need to understand the concept of rural rebranding, and the
various strategies that can take place as a part of this. As part of this students need to be able to explain how different strategies deployed in rural areas can make these areas more attractive.
30 © Pearson Education Ltd 2016. Copying permitted for purchasing institution only. This material is not copyright free.
Rural rebranding strategies can generally be grouped into three broad areas:
Heritage and literacy associations: capitalising on heritage in a rural area
or links with locations that provide inspiration in literature (a recent example could be how Northern Ireland is using Game of Thrones as a tool to market the area for tourism – see the Discover Northern Ireland website).
Farm diversification and specialised products: introducing new activities for arable land to seek out new revenue streams. For example a tourist
attraction in Bideford, the Big Sheep. Outdoor pursuits and adventure in accessible and remote areas.
The Fieldwork Studies Council have a very useful section on rural rebranding and how it can be managed.
Two case studies with different strategies for rural rebranding:
‘Bronte’ Country An area which covers West Yorkshire, and the East Lancashire Pennines in England.
This area is known as the region that was the inspiration for the literature written by the Bronte sisters (Charlotte, Emily and Anne).
An overview of the area is provided on the Bronte Country website. Attractions in the region are also documented on the Visit Bradford website.
Article from the local news documenting how a new Bronte bus route is designed to promote the area’s attractions.
Kielder Forest Kielder forest, located in Northumberland is one of England’s largest forests (and
also home to the largest remaining population of red squirrels). In 2011 a trust was established to manage the area, the Kielder Partnership which had objectives to
ensure the sustainable development of the forest for public benefit, develop leisure activities in the interests of social welfare, engage the public in the natural environment and promote the creation of works of art.
More details about the activities here, and some of the successes of the
partnership are detailed here.
Further information on Kielder Forest is available from the Visit Kielder
website.
Guidance on teaching
To begin the lesson you could ask students to draw a spider diagram illustrating the different regeneration strategies available to rural area.
The main activity could involve students producing case studies of two contrasting rural rebranding strategies focusing on the need for rebranding in these areas and
the impacts of rebranding strategies.
Students could be encouraged to investigate the positive and negative effects of the changes in the two areas.
© Pearson Education Ltd 2016. Copying permitted for purchasing institution only. This material is not copyright free. 31
To finish the lesson you could engage the class in a discussion:
What are the most successful regeneration strategies adopted by the rural areas studied?
How do we know they are successful?
Key vocabulary for EQ3
Regeneration Management
Infrastructure Rebranding
Re-imaging Northern Powerhouse
Rural Regeneration
Diversification Post-production
Stakeholders
EQ4. How successful is regeneration?
Teaching approach over 5 hours
Lesson 24 (2hr) Assessing the success of economic regeneration
Lesson 25 (1hr) Assessing social progress and regeneration
Lesson 26 (1hr) Judging success in urban regeneration
Lesson 27 (1hr) Judging success in rural regeneration
Lesson 24: Assessing the success of economic regeneration
Overview
The first lesson for this EQ covers key issue 4A.10a to examine how the success of economic regeneration can be assessed using measures of income, poverty and
employment (both relative and absolute changes) both within areas and by comparison to other more successful areas.
More able students should be able to evaluate the various ways the success of economic regeneration can be assessed.
Less able students should be able to identify key measures which can be used to assess the success of economic regeneration.
Key concepts and processes
Students need a clear understanding of the different indicators which could be used to measure the success of regeneration. These can include measures of income, poverty, and employment. Students should already have used the Neighbourhood

32 © Pearson Education Ltd 2016. Copying permitted for purchasing institution only. This material is not copyright free.
statistics website in this topic and so should be familiar with how to use the data on this platform to explore different areas.
Guidance on teaching
To begin the lesson students should make a list of economic and social indicators
that they would expect to improve following a successful regeneration project.
The main activity focuses on investigating different indicators to measure the success of economic regeneration. Using Neighbourhood statistics students should analyse two contrasting regeneration schemes. An economic indicator such as
average income in 2001 could be provided for electoral wards within a town you have studied, and compared to the 2011 figure, the difference can then be
discussed. This activity could be developed by mapping the data onto a ward map of the area
(available online) and producing a choropleth map. Students could then investigate areas that have experienced significant positive changes that have had any
regeneration schemes implemented within the ten-year period. To finish, ask students to consider for a chosen area that has benefitted economically
from regeneration, what, if any, are the social costs?
Lesson 25: Assessing social progress and regeneration
Overview The lesson moves on to address 4A.10b and c to consider social progress by
exploring social measures of deprivation and demographic changes before examining how regeneration might considered successful.
This can provide opportunities to develop integrated skills around (9) the
interpretation of photographic and map evidence showing ‘before and after’ cross-sections of regenerated urban and rural places.
More able students should be able to evaluate how successful a regeneration project has been.
Less able students should be able to suggest positive and negative impacts of a
regeneration project.
Key concepts and processes
Similar to the previous lesson, students need to gain an understanding of the different ways social progress can be measured, in terms of different indicators that
could be used or other sources of evidence. In this lesson students should recognise the links between the Index of Multiple Deprivation and evidence of social progress.
Guidance on teaching
To begin with have students in pairs or small groups, produce a list of social indicators that could be used to measure how successful the regeneration of an area
has been.
© Pearson Education Ltd 2016. Copying permitted for purchasing institution only. This material is not copyright free. 33
For the main activity using IMD data, students should investigate how successful a
regeneration project has been, both socially and environmentally. Using the Deprivation Mapper, students can produce Excel spreadsheets showing the different
IMD domains for all English LSOAs (lower layer super output areas). When focusing on social progress, students should use life expectancy and
reductions in health deprivation (see specification). Improvements in the living environment can be investigated by focusing on levels of pollution and reductions in
abandoned or derelict land. Students can also make use of online newspaper accounts, blog entries, Twitter
feeds etc. to make a judgement regarding the degree of success. A further investigation could also use ‘before and after’ photographs of regenerated locations.
Francis Firth is a good place to look for ‘before and after’ photographs of 7,000 locations around the UK.
For comparing environmental change in an area Old Maps can be useful. Old GOAD maps are another option.
Lesson 26: Judging success in urban regeneration
Overview The lesson addresses 4A. 11a, b and c to examine how different urban stakeholders have different criteria for judging the success of urban regeneration. This includes:
studying strategies used in the regeneration or an urban place (Salford Quays); the changes can be judged using a range of economic, social and demographic environmental variables; and how different stakeholders will assess success using
contrasting criteria.
This provides opportunities for developing integrated skills around the (10) interrogation of blog entries and other social media to understand different views of the success of regeneration projects.
More able students could assess the relative importance of different stakeholders
in the regeneration of Salford.
Less able students could outline how Salford has been regenerated.
Key concepts and processes
For this lesson students should gain a clear understanding of the different criteria for
judging the success of urban regeneration (economic, social, demographic and environmental). It is important that they understand that different stakeholders will
judge regeneration successes in different ways, depending on their experiences of place, and how they see the role of particular places. There are likely to be great differences between the views of local and national governments, local businesses
and residents.
34 © Pearson Education Ltd 2016. Copying permitted for purchasing institution only. This material is not copyright free.
Case Study: Salford There are many case studies you could choose for the activity in this lesson; Salford provides one example. The regeneration of Salford Quays centred around the £550 million MediaCityUK development in the area is well known.
This forms part of a larger regeneration plan for Salford, documented on the Salford
City Council website. There are further ambitious targets for regeneration in the region, showing that the regeneration process can be long term, and not a short lived project. The regeneration prospectus: ‘2025 Salford: A modern global city
documents the different components of this process. It highlights its key achievements including: MediaCityUK, creation of jobs in Port Salford, a new Salford
City Stadium, and revitalisation of canal areas as just some examples. But also highlights projects for the future including: a new high school, new environmentally friendly homes and affordable housing, improvements to transport.
For more information on regeneration in Salford there are numerous articles, reports and commentaries, including:
Article from the Telegraph: From dirty old town to shiny city Quays culture blog.
UK Government: Regeneration project: Media City - Salford Manchester Evening News: £650 million regeneration of Salford City Centre is
on track. BBC: Salford’s regeneration praised Telegraph: Media City: Can the BBC save Salford?
Manchester evening news: Green light given to £140m Salford Quays development for up to 800 new homes
Manchester Evening News: Regional Review - Salford.
Guidance on teaching
To begin ask students to make a list of stakeholders involved in urban regeneration.
Introduce the roles of different stakeholders in urban regeneration such as planner, national and local governments, individuals, local businesses and residents.
Students should write down the kind of viewpoints each of these stakeholders is
likely to have towards regeneration and discuss how, in some cases, they may conflict.
The lesson can then be used to explore a case study to investigate these issues. You can either provide students with a range of resources on Salford and encourage
them to produce a conflict matrix focusing on differing viewpoints towards regeneration, or you could ask students to investigate themselves.
You could then hold a class discussion about how different stakeholders can have different success criteria regarding urban regeneration. A final question for the
lesson could be: ‘Has Salford regenerated successfully?’.
© Pearson Education Ltd 2016. Copying permitted for purchasing institution only. This material is not copyright free. 35
Lesson 27: Judging success in rural regeneration
Overview The lesson addresses 4A.12a, b and c to consider how different rural stakeholders
have different criteria for judging the success of rural regeneration. This includes studying strategies used in the restructuring of a rural place, such as the North
Antrim Coast, and the contested nature of these decisions within local communities. This lesson has the potential to meet integrated skills that require students to
conduct an analysis of contrasting newspaper reports about a change including opinions about that change.
More able students could assess the relative importance of different stakeholders
in the regeneration of the North Antrim Coast.
Less able students could outline how the North Antrim Coast has been
regenerated.
Key concepts and processes
Similar to the previous lesson students need to gain a clear understanding of the different criteria for judging success of rural regeneration. It is important that they
understand that different stakeholders will judge regeneration successes in different ways, depending on their experiences of place, and how they see the role of
particular places.
Case Study: North Antrim Coast One case study possibility for this lesson is the North Antrim Coast, looking at the different regeneration strategies proposed.
One particular strategy that has been used in the region is the development of golf
courses. The development of one course in particular caused a lot of conflict among different stakeholders, the Bushmills Dunes Golf Resort and Spa at Runkerry. The National Trust opposed the plan, while the Department of Environment planners
recommended it should go ahead in 2012. As of 2015 it appeared the golf resort would not go ahead due to continued conflict and strong opposition to the plans,
particularly from environmentalists due to the plans for the course to be 500m away from the Giant’s Causeway, a UNESCO world heritage site.
BBC: Antrim coast regeneration plan. The Independent: Environmentalists call Giant’s Causeway golf course
‘inherently and fundamentally wrong’. Golf Business News: New golf resort will boost Ireland’s north coast economy. BBC News: Runkerry gold resort plan gets green light.
Guardian: National Trust attempts to block £100 million Giant’s Causeway golf course.
BBC News: Runkerry golf resort plan has foundered. Marinet: Can Northern Ireland’s Giant’s Causeway accommodate a golf
course?
You’ve Been Trumped, a documentary which focuses on golf resort construction in
Aberdeenshire, is also worth watching for further examples of where this type of development can cause conflict.
36 © Pearson Education Ltd 2016. Copying permitted for purchasing institution only. This material is not copyright free.
Guidance on teaching
This lesson follows a similar format to the previous on urban regeneration. You could begin the lesson by showing students the trailer to the award-winning
documentary A Dangerous Game. This documentary focuses on the negative impact of sport-led regeneration in rural areas, specifically the construction of golf courses.
Students should investigate specific regeneration strategies within a rural area, such as the proposed Bushmills Dunes golf resort within County Antrim. Put students into
groups, each representing a stakeholder in the area. Student groups should prepare a persuasive argument, citing their reasons for and against the development.
After a group discussion of the arguments for and against the development, students should decide whether the proposal should go ahead, giving evidence for their final
decision. Should concessions be made to the other stakeholders affected?
Key vocabulary for EQ4
Assessing regeneration success
NIMBYism
Regeneration
Conflict
Stakeholders
Diversification
Recommended