
Monitoring Cloudflare's planet-scaleedge network with PrometheusMatt Bostock

@mattbostockPlatform Operations
Prometheus for monitoring
● Alerting on critical production issues
● Incident response
● Post-mortem analysis
● Metrics, but not long-term storage
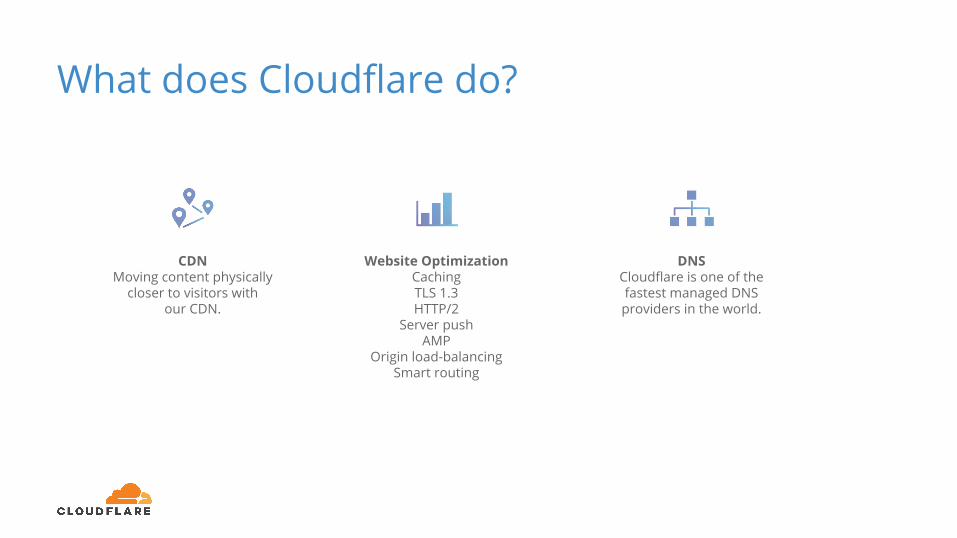
What does Cloudflare do?
CDNMoving content physically
closer to visitors with our CDN.
Website OptimizationCachingTLS 1.3HTTP/2
Server pushAMP
Origin load-balancingSmart routing
DNSCloudflare is one of the fastest managed DNS providers in the world.

115+Data centers globally
1.2MDNS requests/second
10%Internet requests
every day
5MHTTP requests/second
websites, apps & APIs in 150 countries
6M+
Cloudflare’s anycast edge network
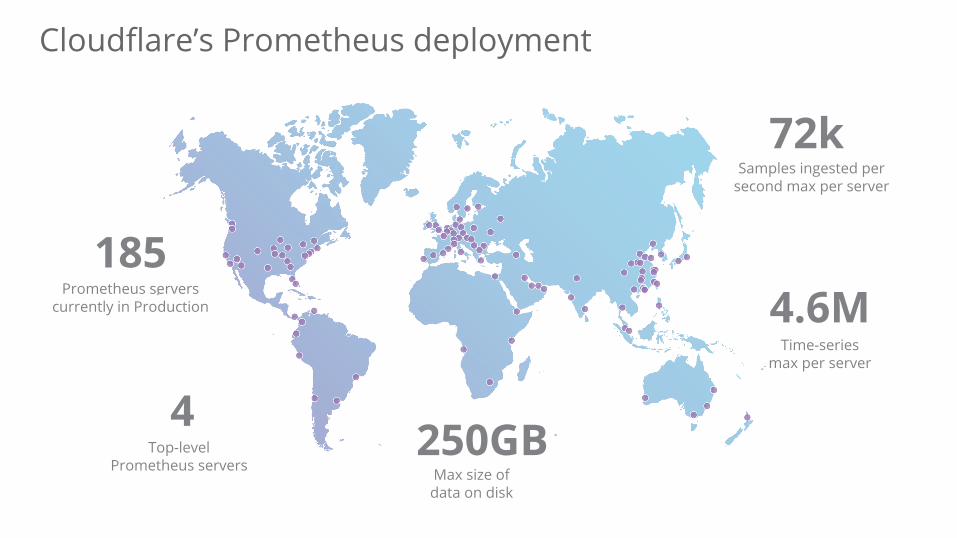
4.6MTime-series
max per server
4Top-level
Prometheus servers
185Prometheus servers
currently in Production
72kSamples ingested per
second max per server
Max size ofdata on disk
250GB
Cloudflare’s Prometheus deployment
Edge Points of Presence (PoPs)
● Routing via anycast
● Configured identically
● Independent
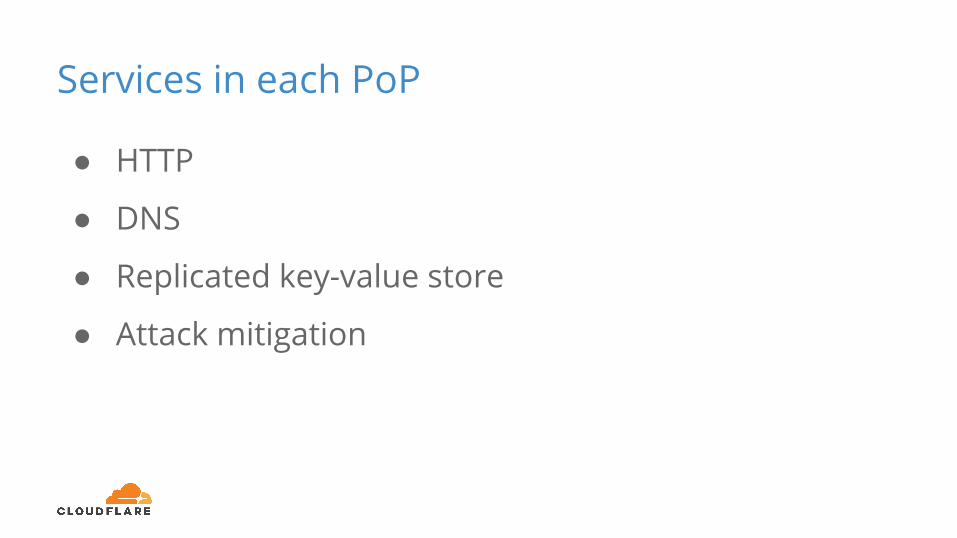
Services in each PoP
● HTTP
● DNS
● Replicated key-value store
● Attack mitigation
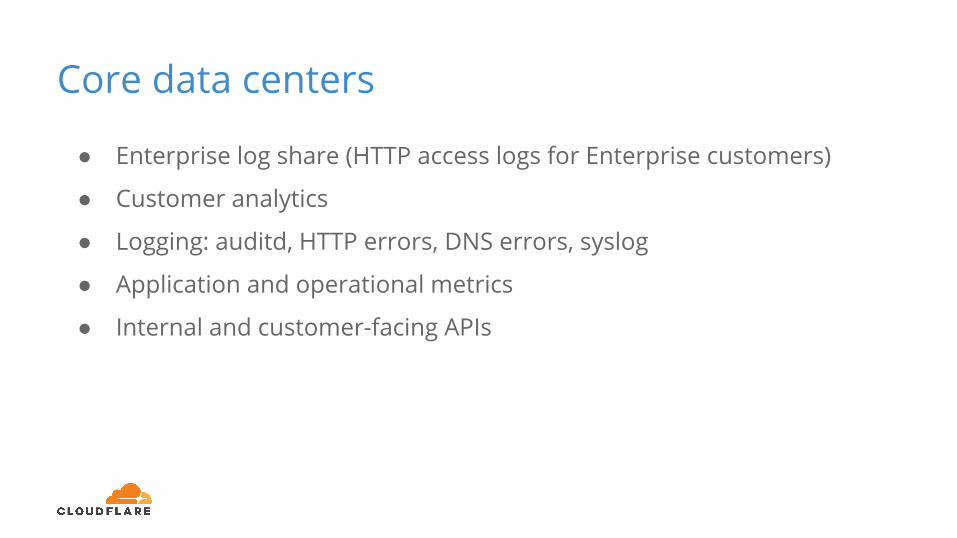
Core data centers
● Enterprise log share (HTTP access logs for Enterprise customers)
● Customer analytics
● Logging: auditd, HTTP errors, DNS errors, syslog
● Application and operational metrics
● Internal and customer-facing APIs
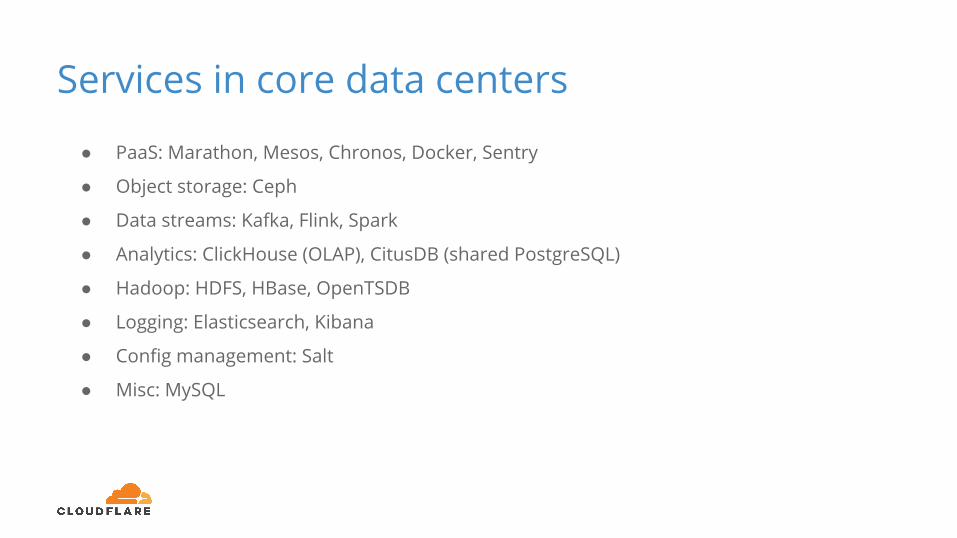
Services in core data centers
● PaaS: Marathon, Mesos, Chronos, Docker, Sentry
● Object storage: Ceph
● Data streams: Kafka, Flink, Spark
● Analytics: ClickHouse (OLAP), CitusDB (shared PostgreSQL)
● Hadoop: HDFS, HBase, OpenTSDB
● Logging: Elasticsearch, Kibana
● Config management: Salt
● Misc: MySQL

Prometheus queries
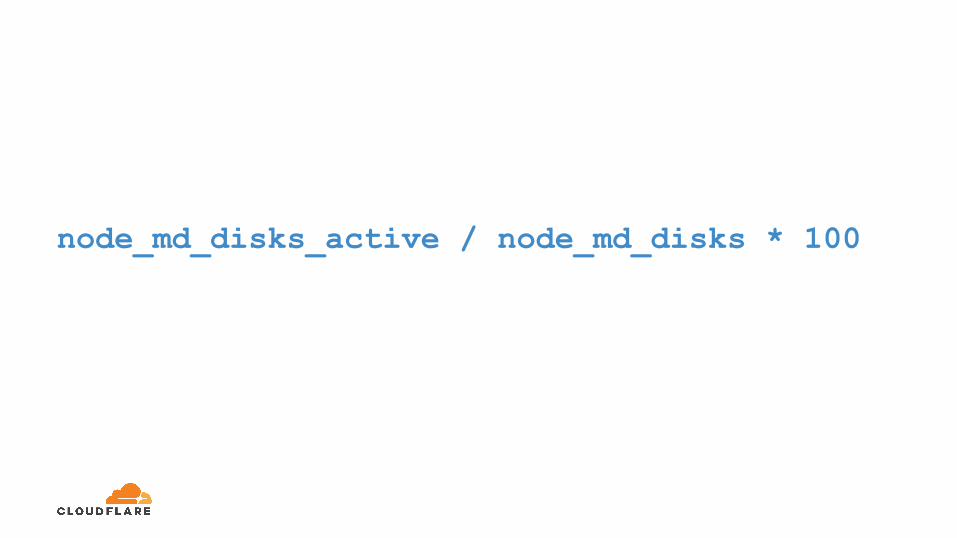
node_md_disks_active / node_md_disks * 100
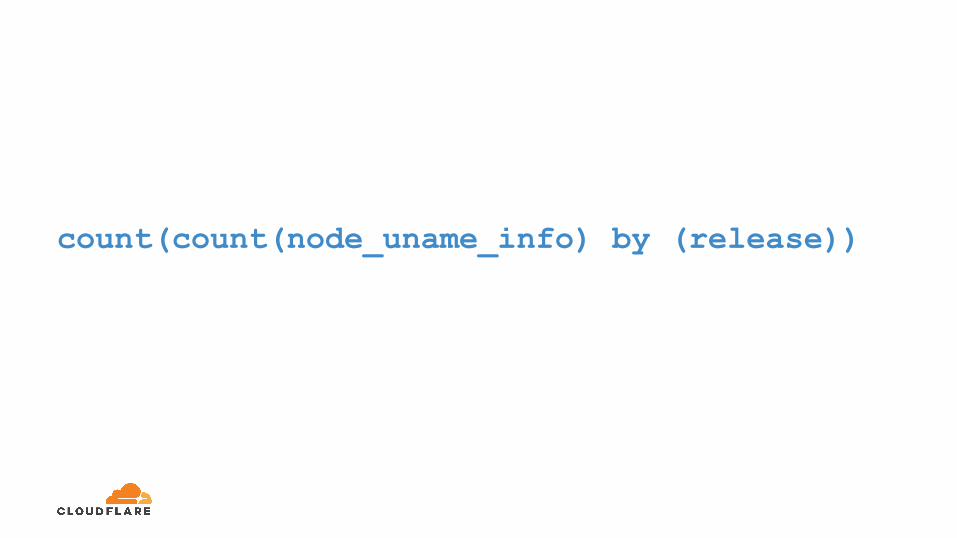
count(count(node_uname_info) by (release))
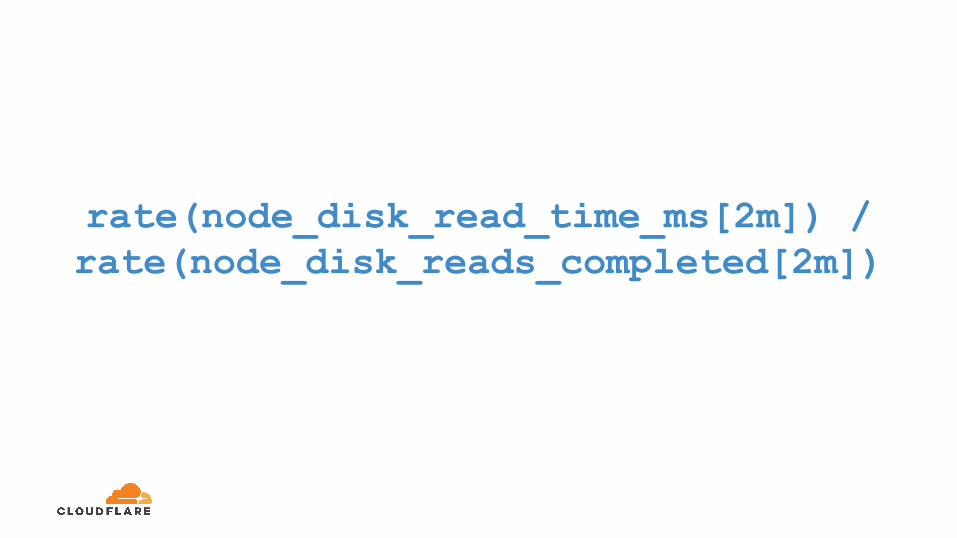
rate(node_disk_read_time_ms[2m]) / rate(node_disk_reads_completed[2m])

Metrics for alerting
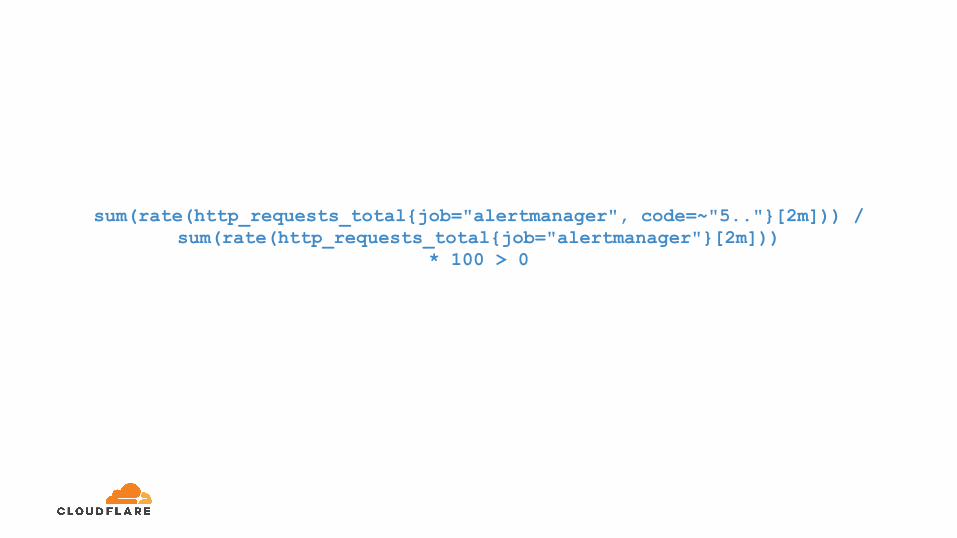
sum(rate(http_requests_total{job="alertmanager", code=~"5.."}[2m])) / sum(rate(http_requests_total{job="alertmanager"}[2m]))
* 100 > 0
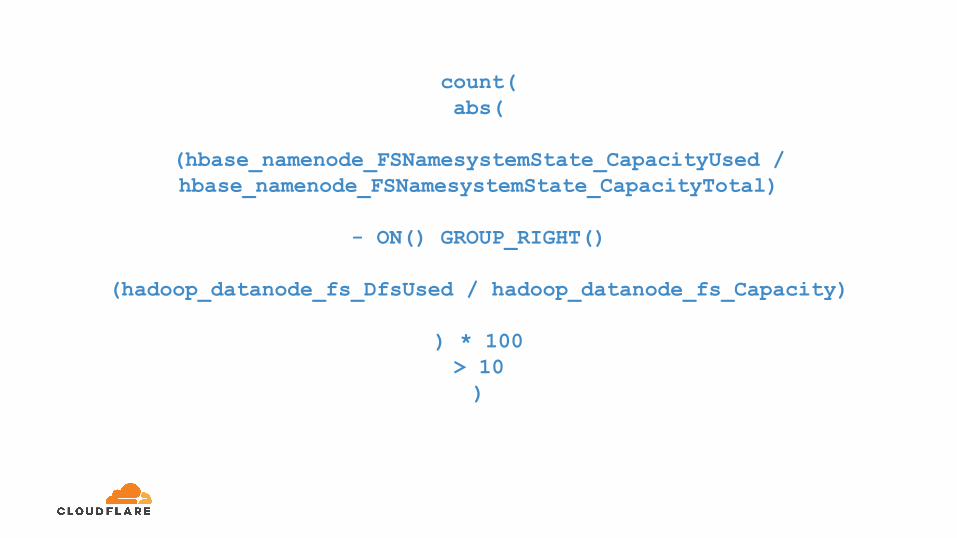
count(abs(
(hbase_namenode_FSNamesystemState_CapacityUsed / hbase_namenode_FSNamesystemState_CapacityTotal)
- ON() GROUP_RIGHT()
(hadoop_datanode_fs_DfsUsed / hadoop_datanode_fs_Capacity)
) * 100> 10)

Prometheus architecture
Before, we used Nagios
● Tuned for high volume of checks
● Hundreds of thousands of checks
● One machine in one central location
● Alerting backend for our custom metrics
pipeline
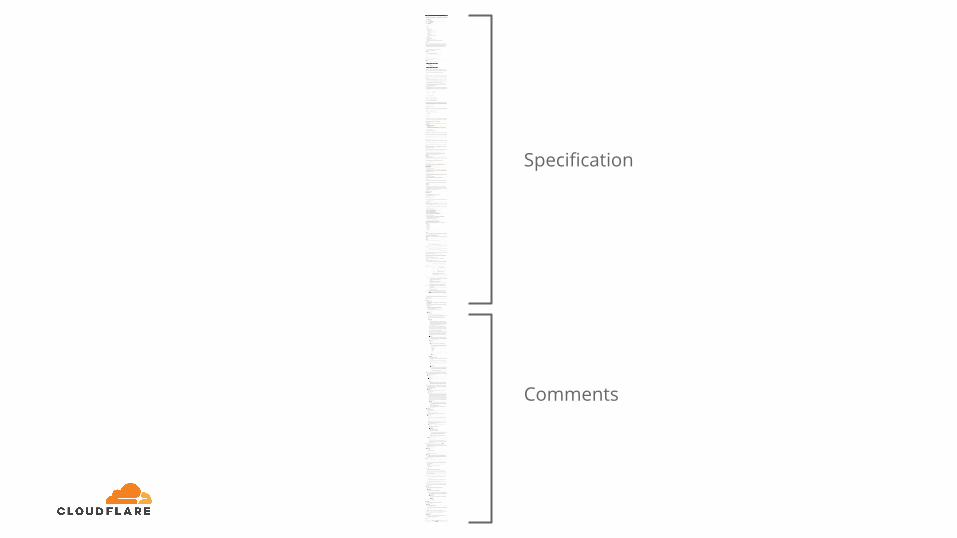
Specification
Comments
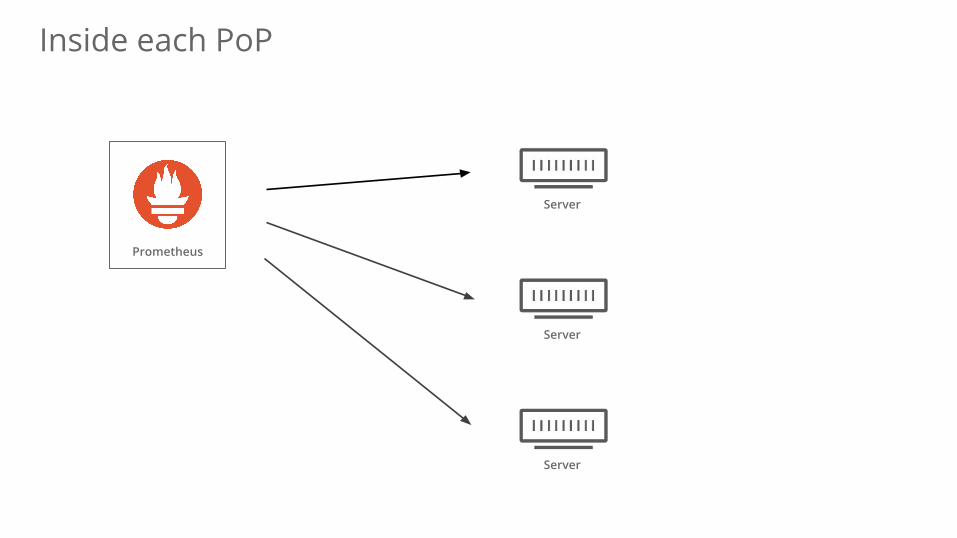
Inside each PoP
Server
Server
Server
Prometheus
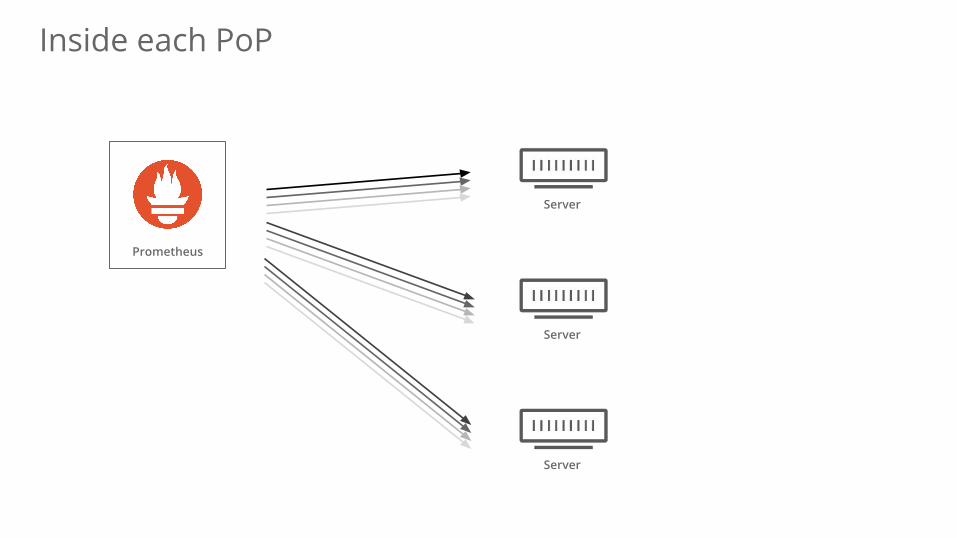
Inside each PoP
Server
Server
Server
Prometheus
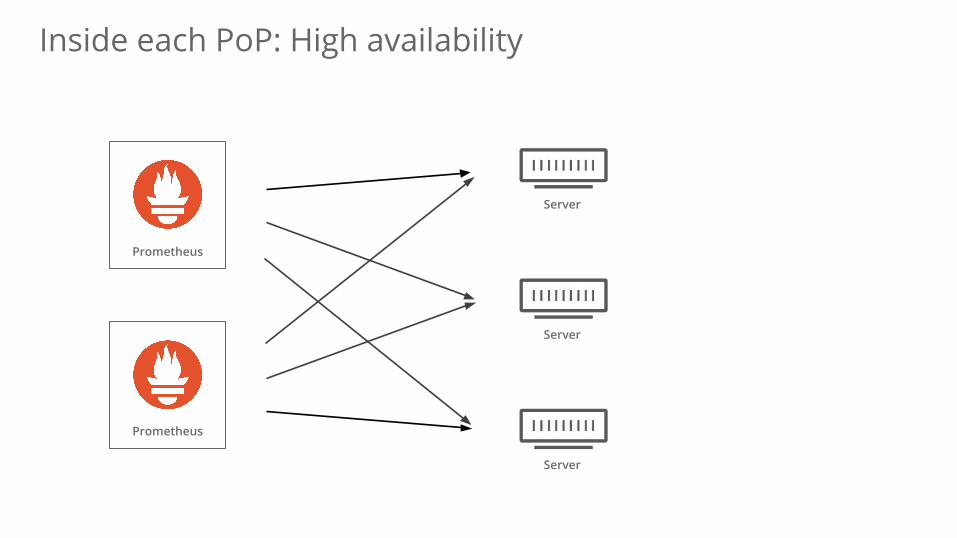
Inside each PoP: High availability
Prometheus
Server
Server
Server
Prometheus
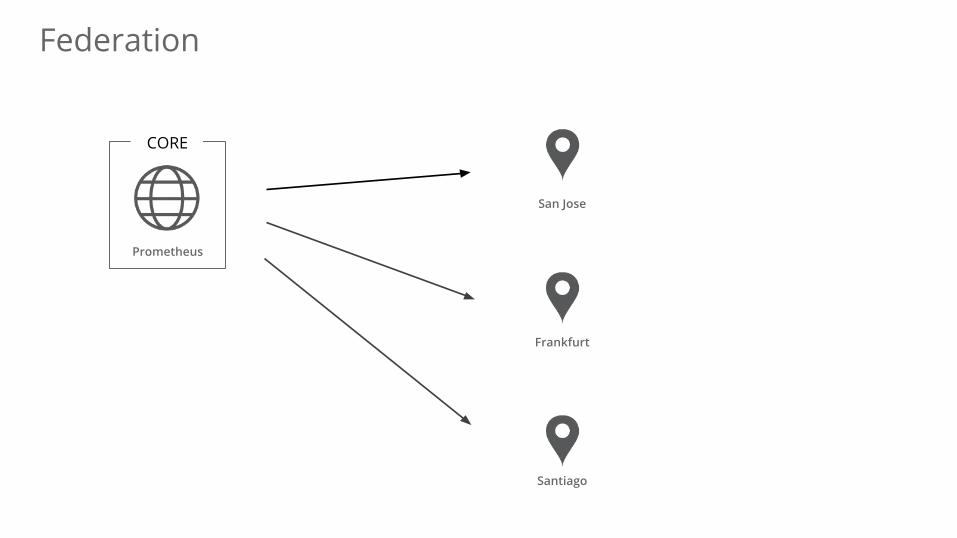
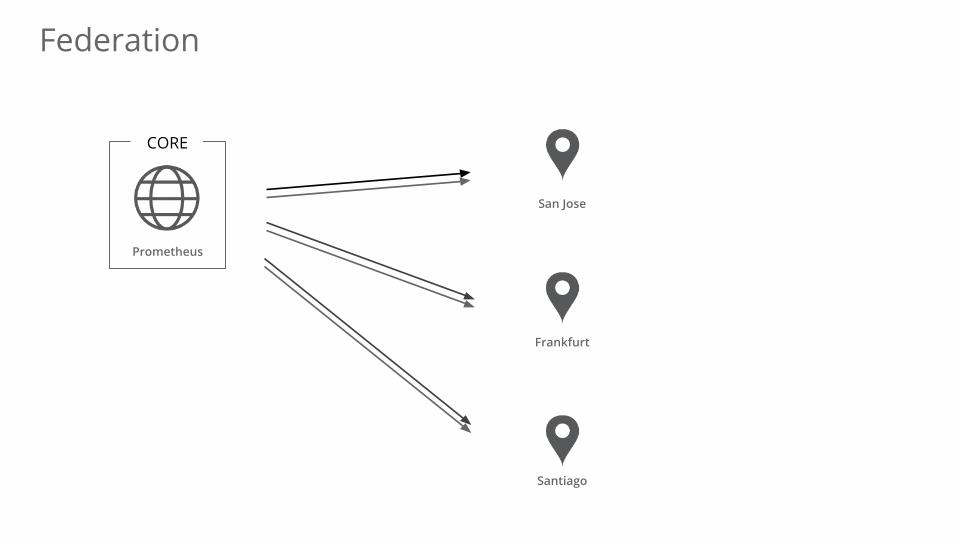
Federation
San Jose
Frankfurt
Santiago
Prometheus
CORE
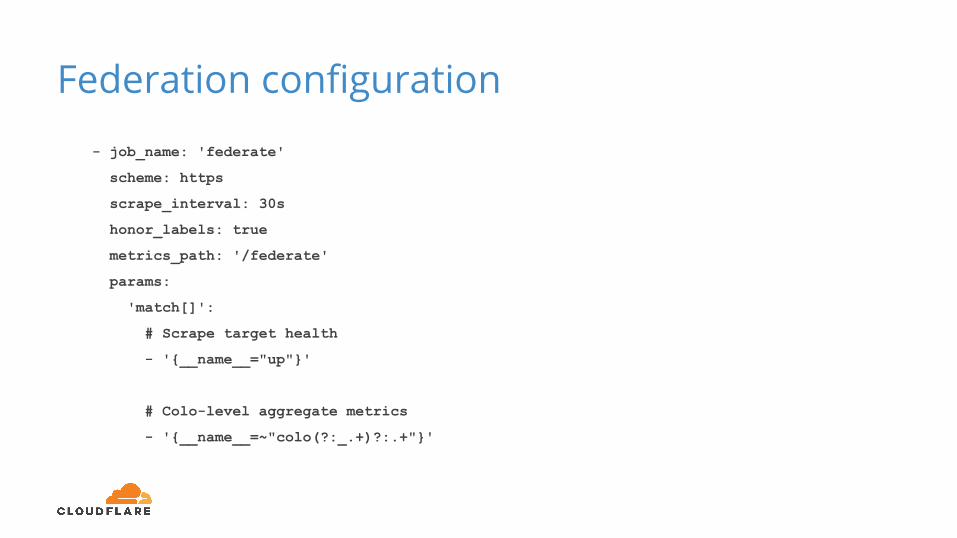
Federation configuration - job_name: 'federate'
scheme: https
scrape_interval: 30s
honor_labels: true
metrics_path: '/federate'
params:
'match[]':
# Scrape target health
- '{__name__="up"}'
# Colo-level aggregate metrics
- '{__name__=~"colo(?:_.+)?:.+"}'
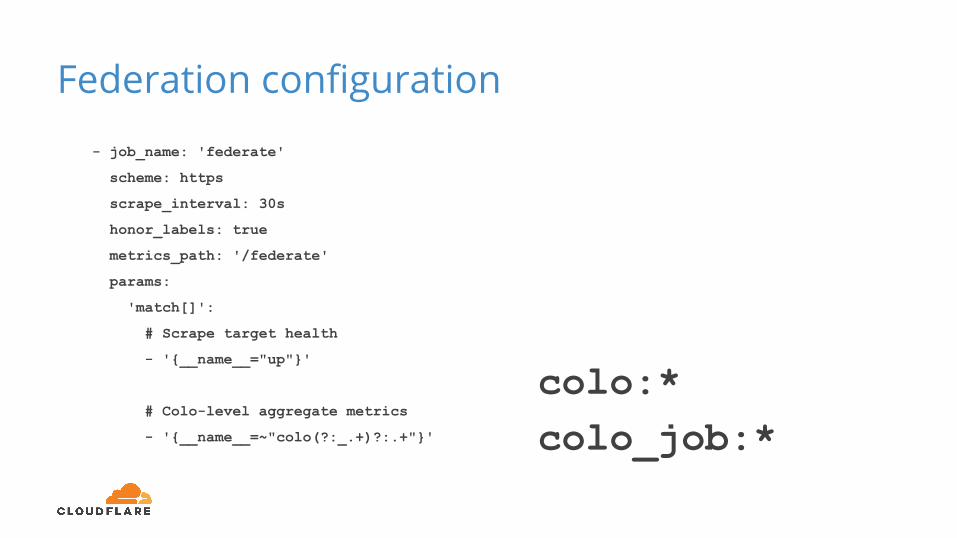
Federation configuration - job_name: 'federate'
scheme: https
scrape_interval: 30s
honor_labels: true
metrics_path: '/federate'
params:
'match[]':
# Scrape target health
- '{__name__="up"}'
# Colo-level aggregate metrics
- '{__name__=~"colo(?:_.+)?:.+"}'
colo:*colo_job:*
Federation
San Jose
Frankfurt
Santiago
Prometheus
CORE
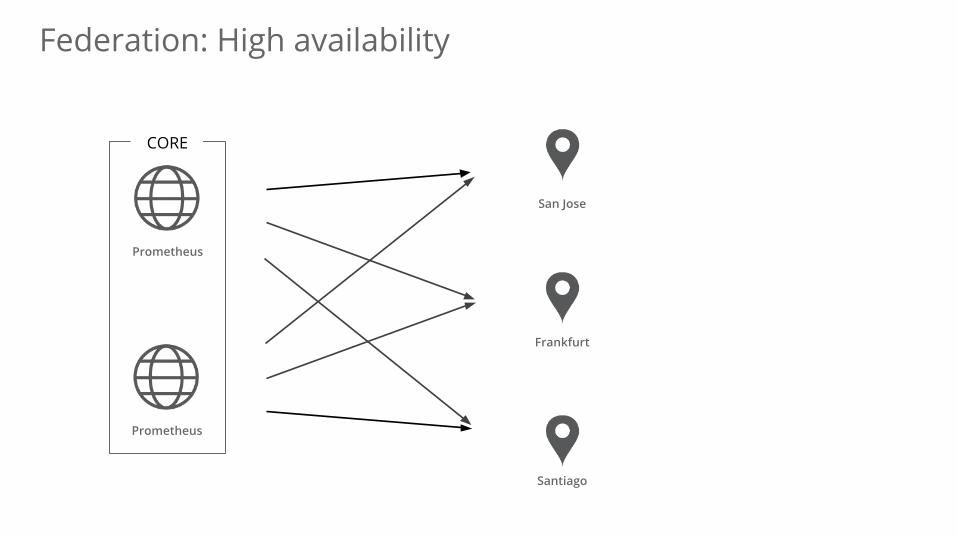
Federation: High availability
Prometheus
Prometheus
San Jose
Frankfurt
Santiago
CORE
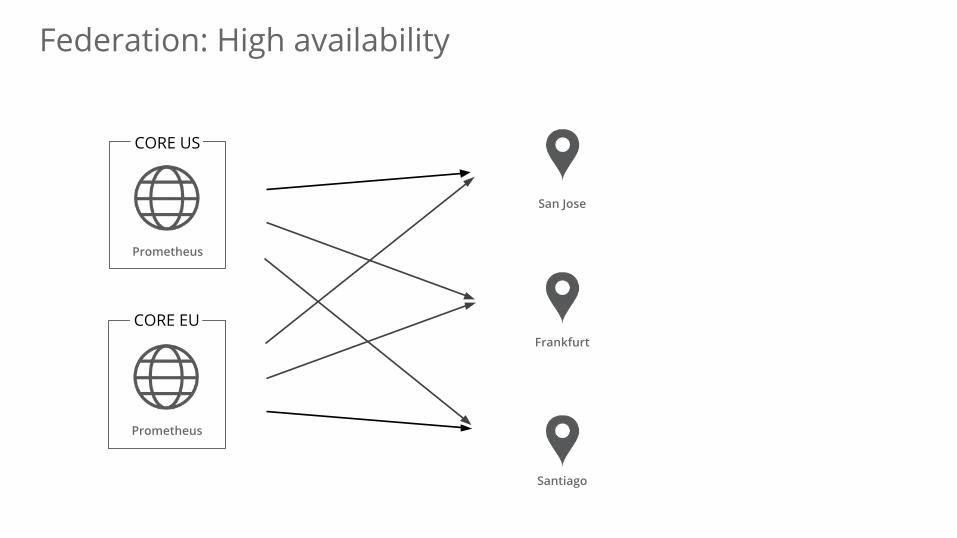
Federation: High availability
Prometheus
Prometheus
San Jose
Frankfurt
Santiago
CORE US
CORE EU
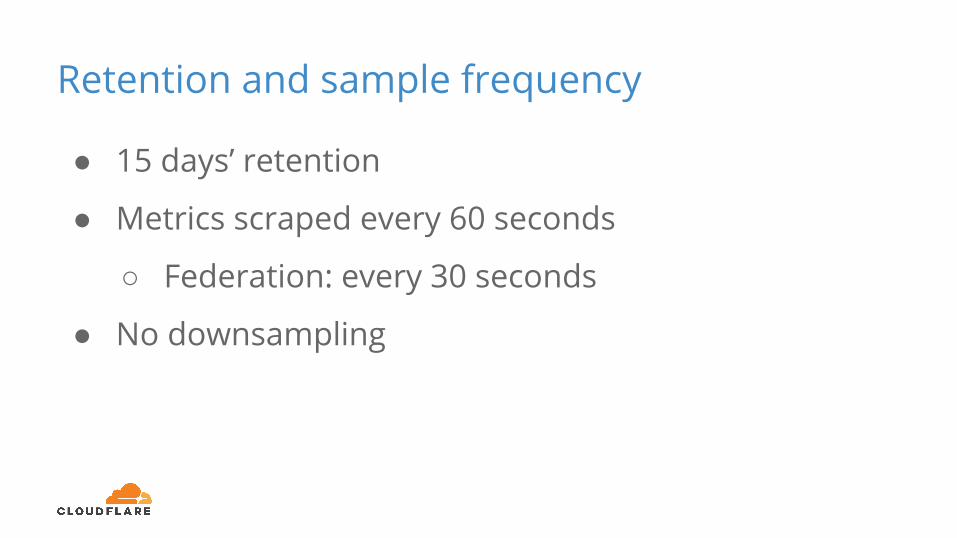
Retention and sample frequency
● 15 days’ retention
● Metrics scraped every 60 seconds
○ Federation: every 30 seconds
● No downsampling
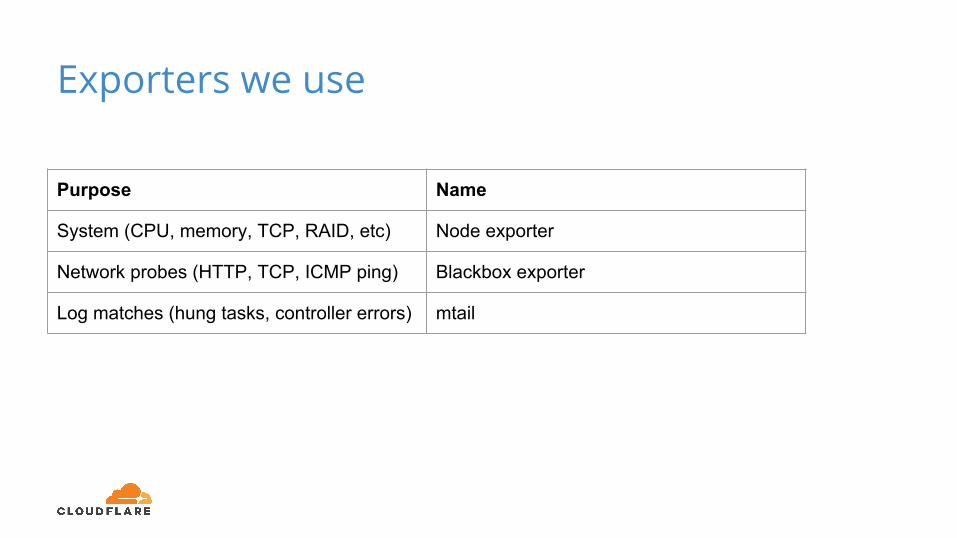
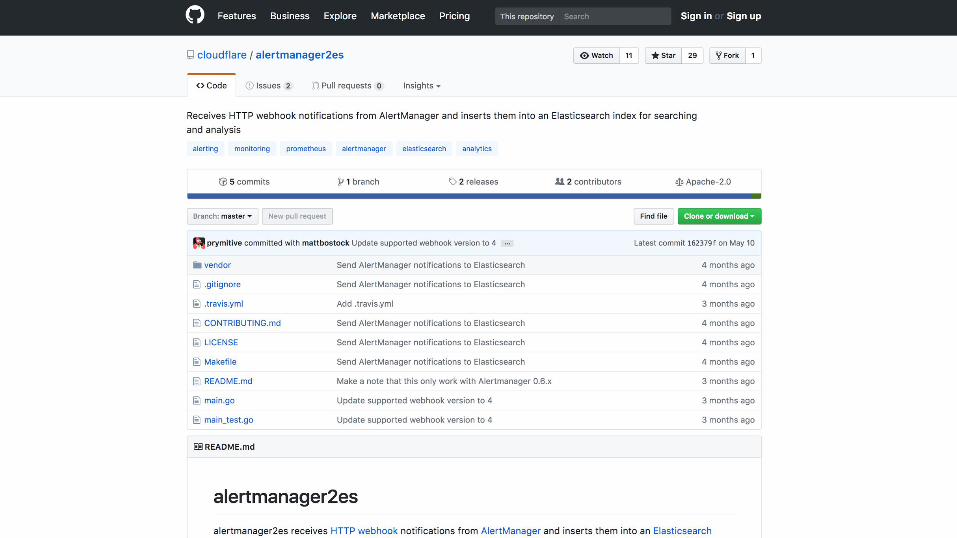
Exporters we use
Purpose Name
System (CPU, memory, TCP, RAID, etc) Node exporter
Network probes (HTTP, TCP, ICMP ping) Blackbox exporter
Log matches (hung tasks, controller errors) mtail
Deploying exporters
● One exporter per service instance
● Separate concerns
● Deploy in same failure domain

Alerting
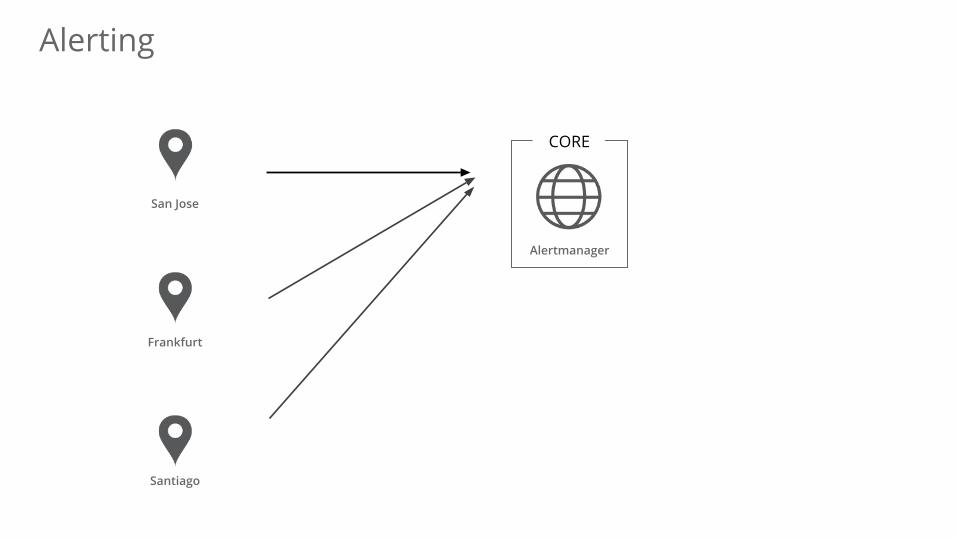
Alerting
Alertmanager
San Jose
Frankfurt
Santiago
CORE
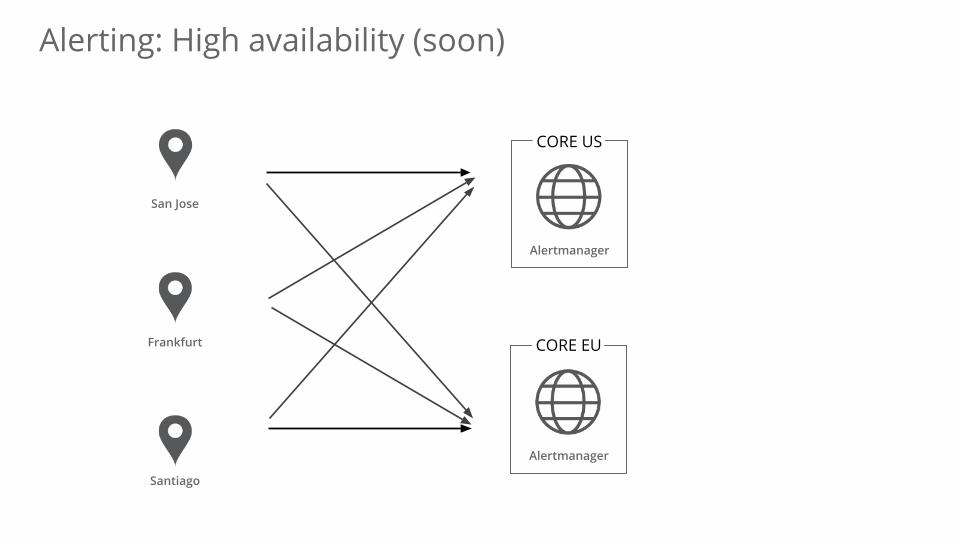
Alerting: High availability (soon)
Alertmanager
Alertmanager
San Jose
Frankfurt
Santiago
CORE US
CORE EU
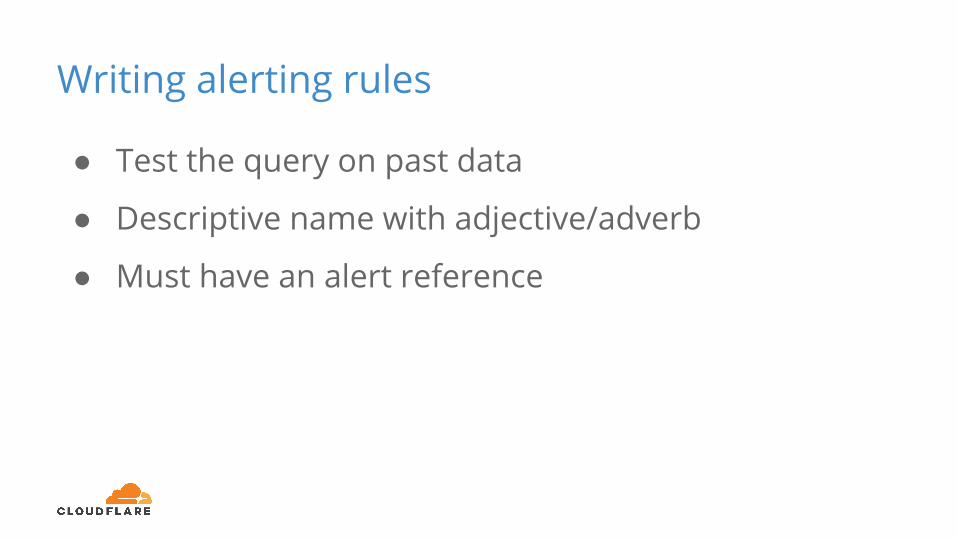
Writing alerting rules
● Test the query on past data
Writing alerting rules
● Test the query on past data
● Descriptive name with adjective or adverb
RAID_Array
RAID_Health_Degraded
Writing alerting rules
● Test the query on past data
● Descriptive name with adjective/adverb
● Must have an alert reference
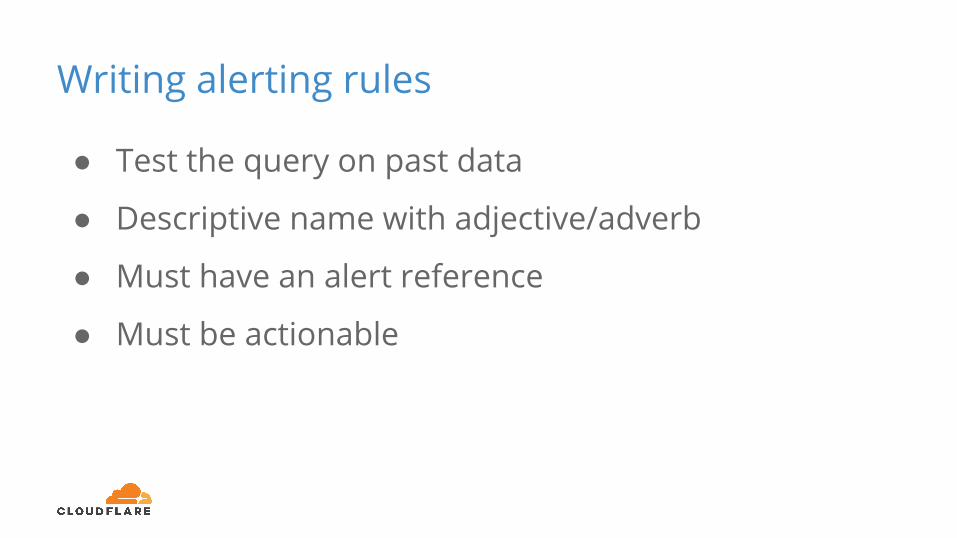
Writing alerting rules
● Test the query on past data
● Descriptive name with adjective/adverb
● Must have an alert reference
● Must be actionable
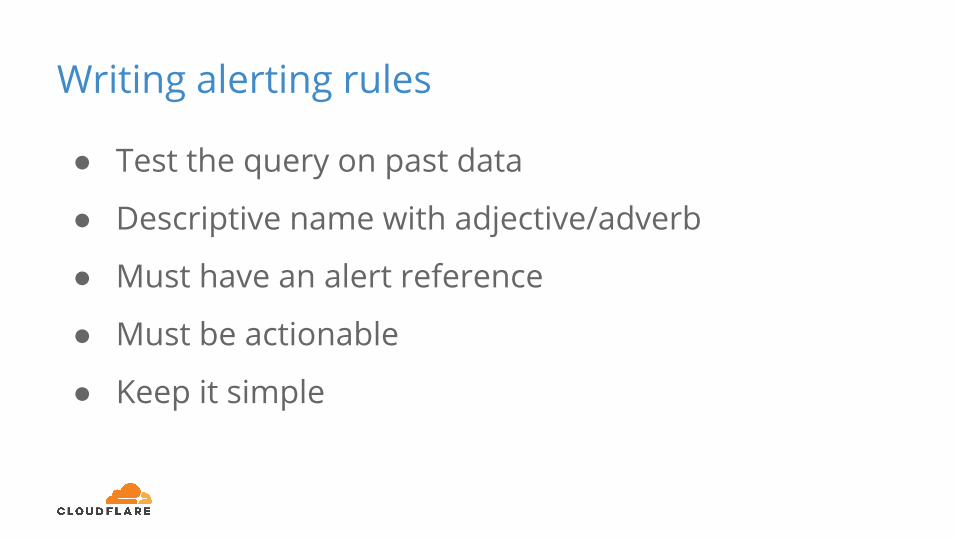
Writing alerting rules
● Test the query on past data
● Descriptive name with adjective/adverb
● Must have an alert reference
● Must be actionable
● Keep it simple
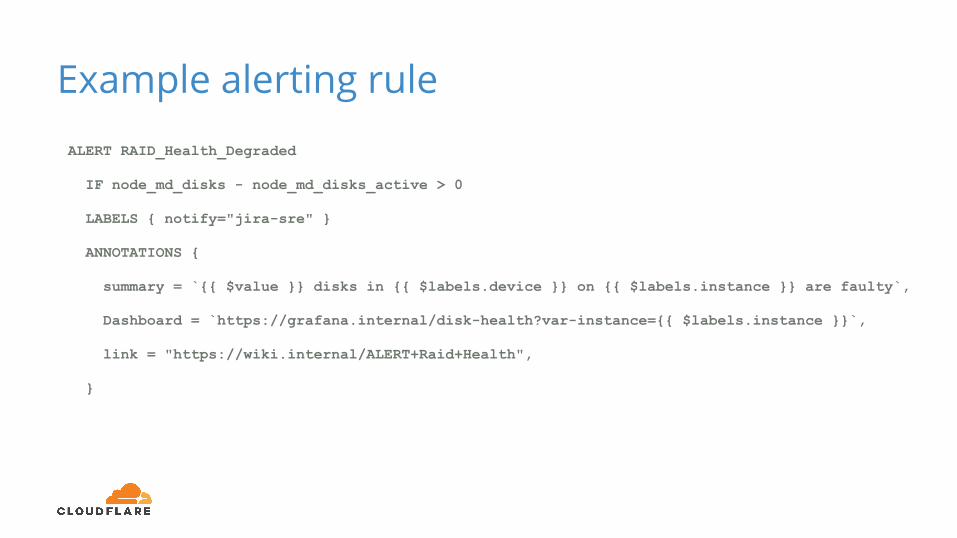
Example alerting ruleALERT RAID_Health_Degraded
IF node_md_disks - node_md_disks_active > 0
LABELS { notify="jira-sre" }
ANNOTATIONS {
summary = `{{ $value }} disks in {{ $labels.device }} on {{ $labels.instance }} are faulty`,
Dashboard = `https://grafana.internal/disk-health?var-instance={{ $labels.instance }}`,
link = "https://wiki.internal/ALERT+Raid+Health",
}

Monitoring your monitoring
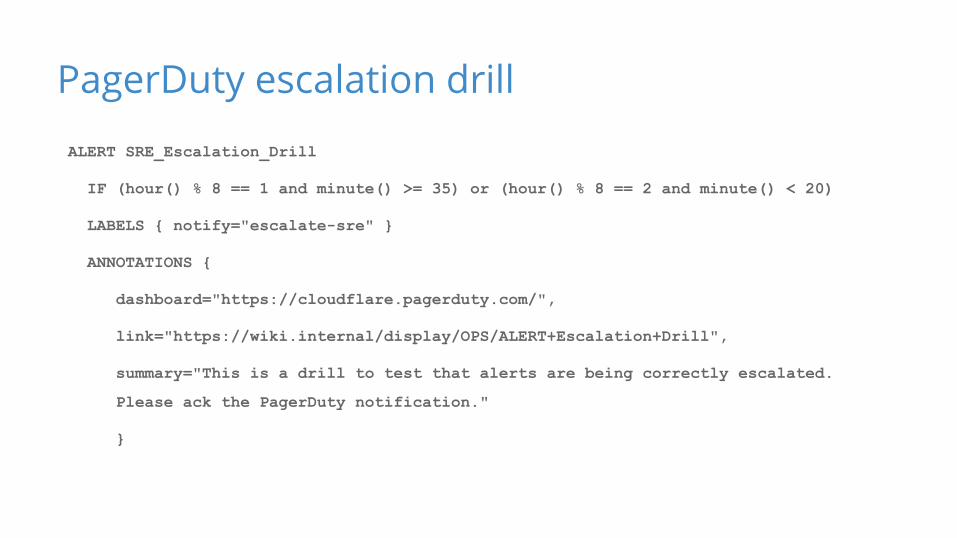
PagerDuty escalation drillALERT SRE_Escalation_Drill
IF (hour() % 8 == 1 and minute() >= 35) or (hour() % 8 == 2 and minute() < 20)
LABELS { notify="escalate-sre" }
ANNOTATIONS {
dashboard="https://cloudflare.pagerduty.com/",
link="https://wiki.internal/display/OPS/ALERT+Escalation+Drill",
summary="This is a drill to test that alerts are being correctly escalated.
Please ack the PagerDuty notification."
}
Monitoring Prometheus
● Mesh: each Prometheus monitors other
Prometheus servers in same datacenter
● Top-down: top-level Prometheus servers
monitor datacenter-level Prometheus servers
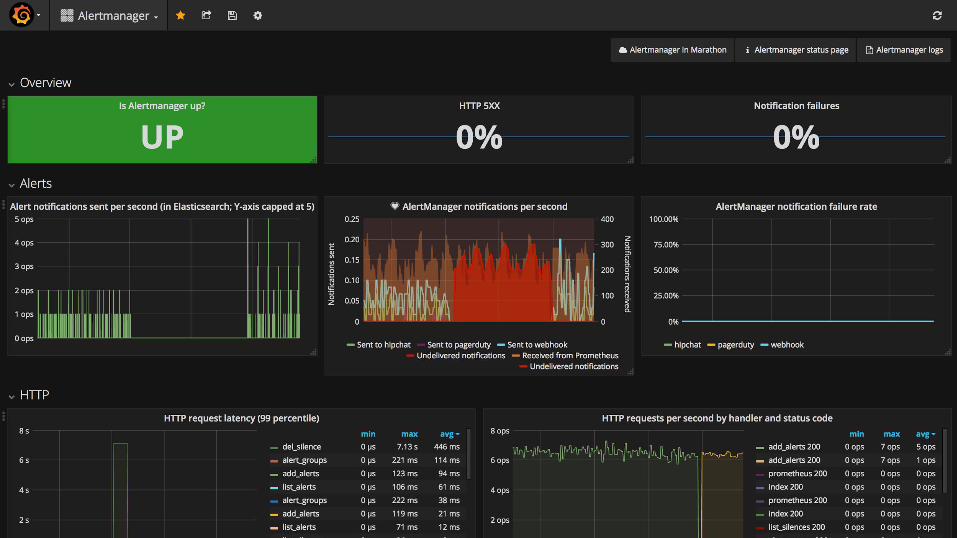
Monitoring Alertmanager
● Use Grafana’s alerting mechanism to page
● Alert if notifications sent is zero even though
notifications were received
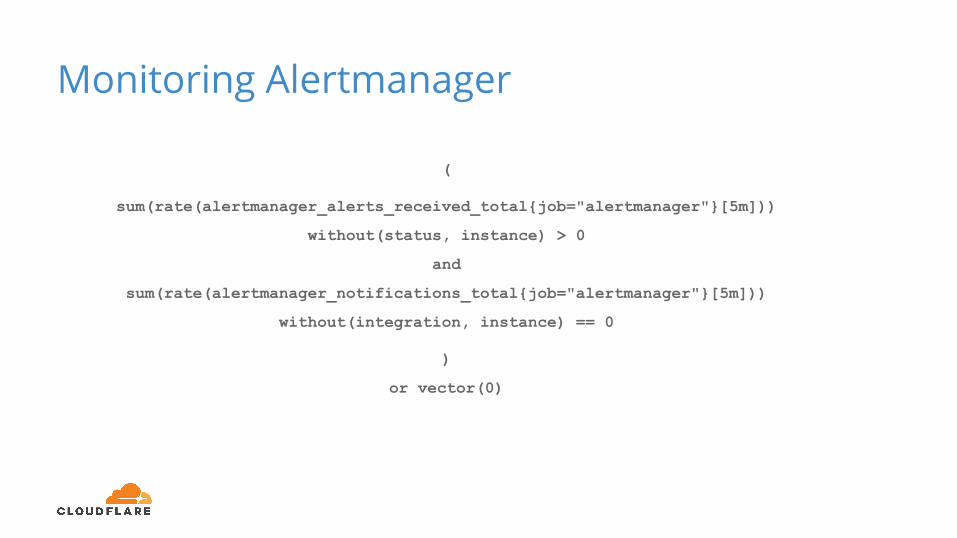
Monitoring Alertmanager
(
sum(rate(alertmanager_alerts_received_total{job="alertmanager"}[5m]))
without(status, instance) > 0
and
sum(rate(alertmanager_notifications_total{job="alertmanager"}[5m]))
without(integration, instance) == 0
)
or vector(0)

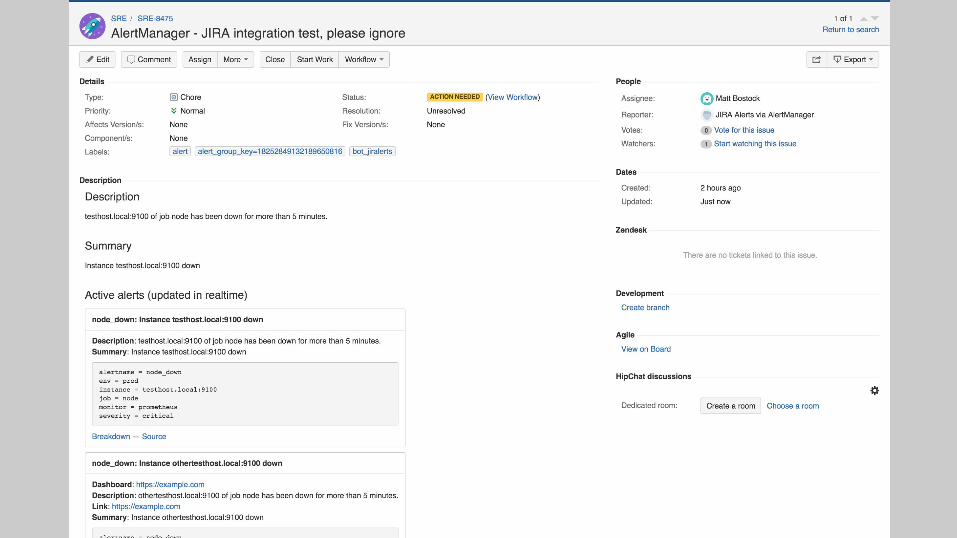
Alert routing
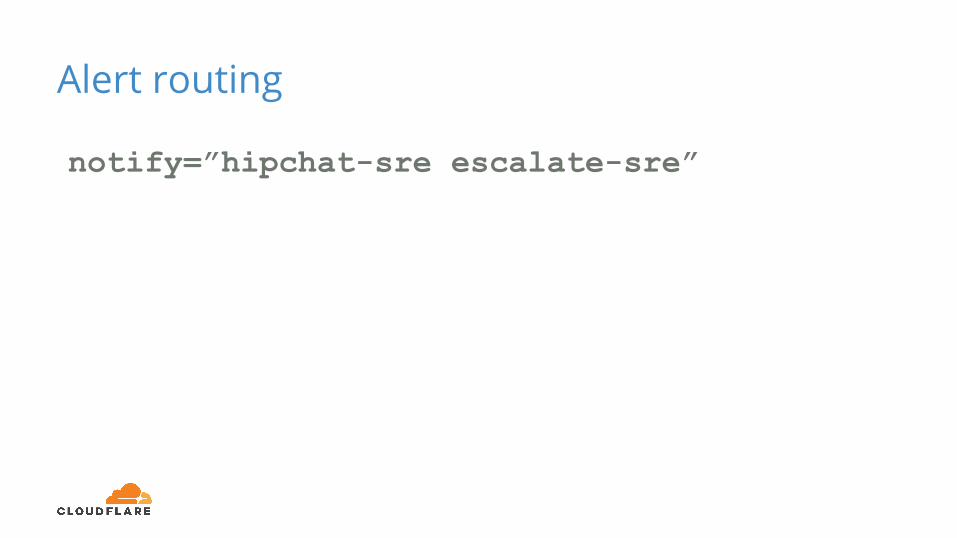
Alert routing
notify=”hipchat-sre escalate-sre”
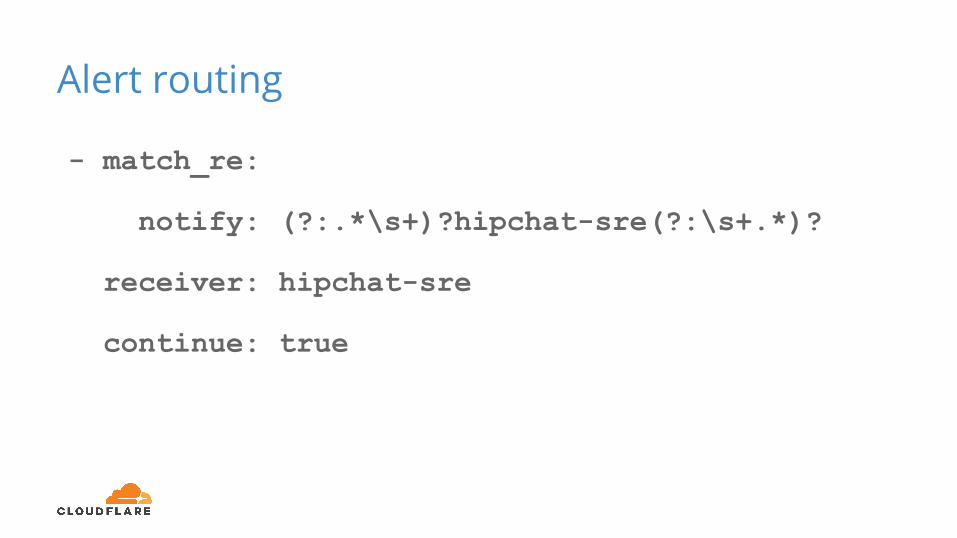
Alert routing
- match_re:
notify: (?:.*\s+)?hipchat-sre(?:\s+.*)?
receiver: hipchat-sre
continue: true

Routing tree
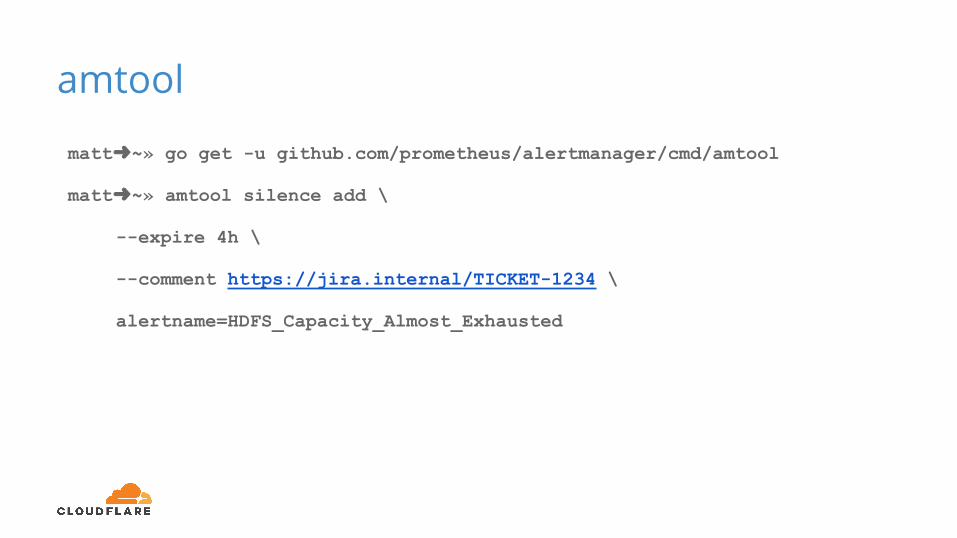
amtool
matt➜~» go get -u github.com/prometheus/alertmanager/cmd/amtool
matt➜~» amtool silence add \
--expire 4h \
--comment https://jira.internal/TICKET-1234 \
alertname=HDFS_Capacity_Almost_Exhausted

Pain points
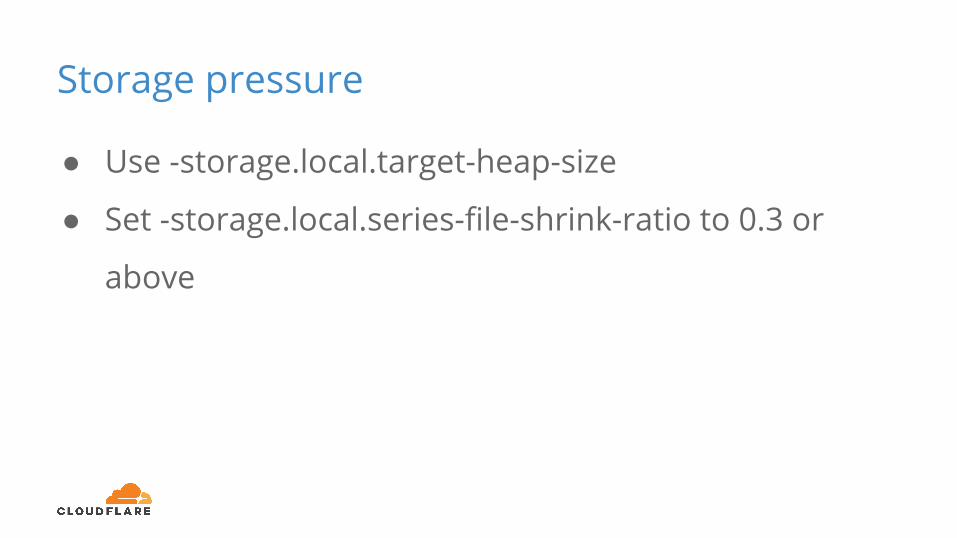
Storage pressure
● Use -storage.local.target-heap-size
● Set -storage.local.series-file-shrink-ratio to 0.3 or
above
Alertmanager races, deadlocks, timeouts,oh my
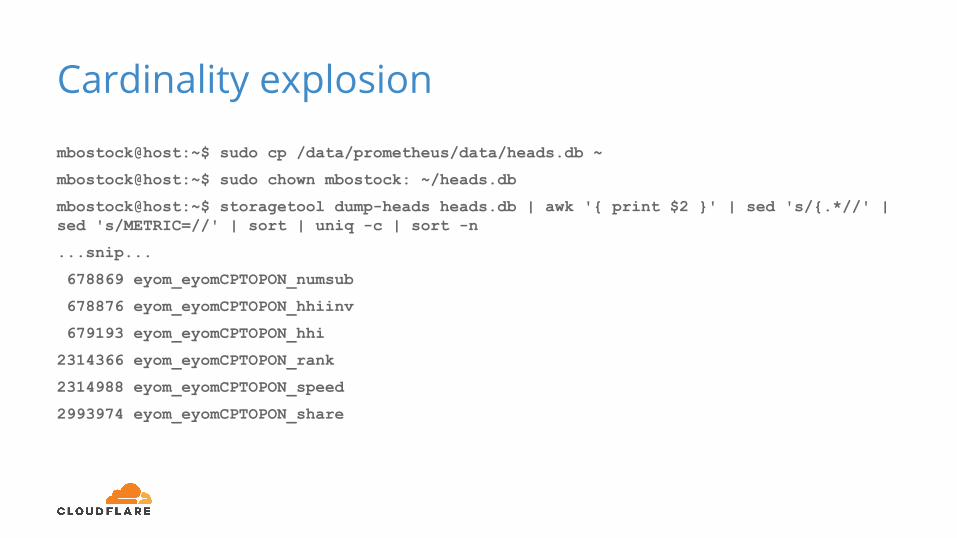
Cardinality explosion
mbostock@host:~$ sudo cp /data/prometheus/data/heads.db ~
mbostock@host:~$ sudo chown mbostock: ~/heads.db
mbostock@host:~$ storagetool dump-heads heads.db | awk '{ print $2 }' | sed 's/{.*//' | sed 's/METRIC=//' | sort | uniq -c | sort -n
...snip...
678869 eyom_eyomCPTOPON_numsub
678876 eyom_eyomCPTOPON_hhiinv
679193 eyom_eyomCPTOPON_hhi
2314366 eyom_eyomCPTOPON_rank
2314988 eyom_eyomCPTOPON_speed
2993974 eyom_eyomCPTOPON_share
Standardise on metric labels early
● Especially probes: source versus target
● Identifying environments
● Identifying clusters
● Identifying deployments of same app in different
roles

Next steps
Prometheus 2.0
● Lower disk I/O and memory requirements
● Better handling of metrics churn
Integration with long term storage
● Ship metrics from Prometheus (remote write)
● One query language: PromQL
More improvements
● Federate one set of metrics per datacenter
● Highly-available Alertmanager
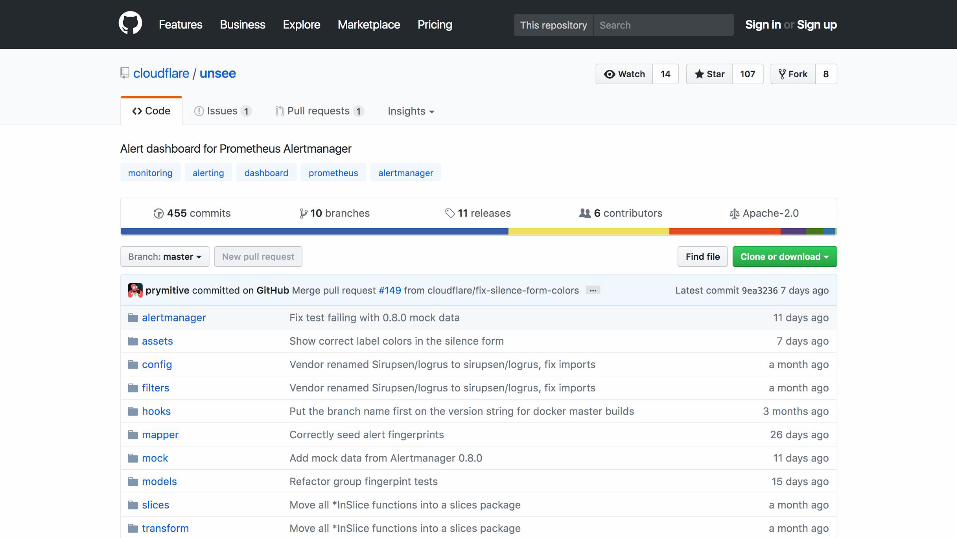
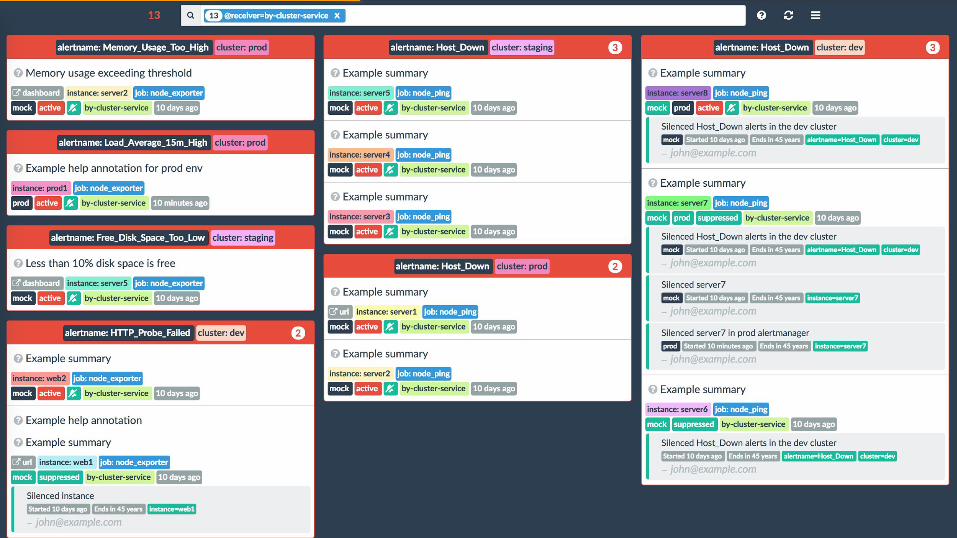
● Visual similarity search
● Alert menus; loading alerting rules dynamically
● Priority-based alert routing
More information
blog.cloudflare.com
github.com/cloudflare
Try Prometheus 2.0: prometheus.io/blog
Questions? @mattbostock
Thanks!
blog.cloudflare.com
github.com/cloudflare
Try Prometheus 2.0: prometheus.io/blog
Questions? @mattbostock
Recommended