Effect of surface protrusion on plasma sheath properties in atmosphericmicrodischarges
Yangyang Fu,1,2,a) Peng Zhang,2 John P. Verboncoeur,1,2 Andrew J. Christlieb,1,2,3
and Xinxin Wang4
1Department of Computational Mathematics, Science and Engineering, Michigan State University,East Lansing, Michigan 48824, USA2Department of Electrical and Computer Engineering, Michigan State University, East Lansing,Michigan 48824, USA3Department of Mathematics, Michigan State University, East Lansing, Michigan 48824, USA4Department of Electrical Engineering, Tsinghua University, Beijing 10084, China
(Received 2 November 2017; accepted 11 January 2018; published online 29 January 2018)
The electric field enhancement due to the presence of cathode surface protrusion is investigated in
atmospheric microdischarges with the goal of identifying the plasma sheath properties (such as
cathode sheath thickness and electric field distortion). The electric field enhancement caused by
surface protrusion is examined by adjusting the aspect ratio and the protrusion size. It is found that
the cathode electric field enhancement depends strongly (weakly) on the aspect ratio (size) of the
protrusion when it is much smaller than the discharge gap distance. In particular, the axial electric
field in both vacuum and discharges becomes nonlinear with the protrusion on the cathode. The
cathode sheath thicknesses obtained by two different methods are compared. With the same axial
(or radial) protrusion dimension, increasing the aspect ratio will result in a significant decrease in
the sheath thickness, whereas increasing the axial protrusion size with an unchanged aspect ratio
will only lead to a slight decrease in the sheath thickness. The results contribute to predicting the
relative plasma sheath properties from the geometrical parameter of the surface protrusion in
atmospheric microdischarges. Published by AIP Publishing. https://doi.org/10.1063/1.5011768
I. INTRODUCTION
Microdischarges have received considerable attention
because of their wide industrial applications, including
plasma display panels (PDPs), ion sources, microelectrome-
chanical systems (MEMS), and microchips.1–4 These dis-
charges have been investigated by many researchers through
experimental diagnostics, analytical methods, and numerical
simulations in the past few decades.5–10 Due to the greatly
reduced discharge dimensions, the size of a microdischarge
device is usually limited by the basic plasma characteristic
length, such as the sheath length or the Debye length. The
discharge properties in the micron-scale gaps at high pres-
sure cannot be easily predicted, especially with the presence
of the surface roughness and/or surface protrusions on the
electrode. In the manufacturing process of the micro-scale
gas discharge devices, the roughness or the protrusions on
the cathode surface are sometimes inevitable. This greatly
affects the plasma discharge properties where the sheath
properties (such as sheath thickness) are critical.
Surface protrusion on the electrode usually leads to an
electric field enhancement, which has profound effects on
the gas breakdowns and high-pressure stable microdi-
scharges. In previous studies, Ang et al. analyzed the average
electric field enhancement with the presence of a sharp tip in
a micron gap through a numerical experiment.11 A compre-
hensive analysis of the field distribution and the current
emission with the presence of a sharp tip in a finite cathode-
anode gap was given by Lin et al.12 Venkattraman investi-
gated the effects of saw-tooth asperity in a channel on the gas
breakdown in micro-scale gaps with the field emission mecha-
nism.13,14 Levko and Raja conducted a fluid modeling of
nanosecond pulsed xenon micro-discharge with spherical-
protrusion electrodes.15 It was previously realized that the dis-
charge behavior depends strongly not only on the cathode
dimension, the working gas, or the incident power like in the
low-pressure cathodes but also on the electrode material, sur-
face roughness, and protrusions.16,17 As for the steady-state
microdischarges at atmospheric pressure, the sheath thickness
plays a significant role in the discharge properties, which
would be largely affected by the electric field enhancement
due to the presence of the surface protrusion. Despite exten-
sive studies in microdischarges, the effects of the surface pro-
trusion (roughness) on the plasma sheath properties are poorly
understood, especially in the atmospheric regime.
In order to determine the plasma sheath in microdi-
scharges, Shi and Kong derived a 14% reduction rule on the
electric field distribution to define the plasma sheath thick-
ness in both direct-current (DC) and radio-frequency (RF)
discharges.18,19 The 14% rule determines the sheath thickness
as the distance between the cathode surface and the spatial
position where the cathode electric field is at a magnitude
that is 14% of the electric field at the cathode surface. This is
in the region near the cathode where a linear electric filed dis-
tribution is valid. The 14% rule was validated by Zhang et al.in plane-parallel electrode gaps.20 Following their work, Shi
and Kong continued the investigation of the sheath thickness
a)Author to whom correspondence should be addressed: [email protected].
edu
1070-664X/2018/25(1)/013530/7/$30.00 Published by AIP Publishing.25, 013530-1
PHYSICS OF PLASMAS 25, 013530 (2018)

in radio-frequency atmospheric micro-plasmas and found that
the discharge shows a glow-like plasma structure and the
sheath characteristics are independent of the gap size when
the electrode gap is significantly greater than the sheath thick-
ness.21,22 In all these studies, the 14% reduction rule is used
in discharges without considering the effect of the surface
protrusion.
In this paper, we focus on the effects of the surface pro-
trusion on the cathode plasma sheath properties (mainly on
the sheath thickness) in atmospheric microdischarges by a
two-dimensional fluid model. The model of a parallel-plate
electrode configuration with a relatively small surface protru-
sion on the cathode is established in argon discharges at
atmospheric pressure. The electric field enhancements are
investigated by simulations with three groups of different sur-
face protrusions, which are defined with different geometrical
sizes and aspect ratios. In Sec. II, the parameters of surface
protrusions and the description of the fluid model are given.
In Sec. III, the 14% reduction rule and the quasineutrality-
based method are used to determine the sheath thickness. The
results from the two methods are compared. Also presented
are the distributions of the vacuum electric field and the elec-
tric field in steady-state discharges. The cathode sheath thick-
nesses obtained by the two methods are also compared.
Finally, concluding remarks are given in Sec. IV.
II. MODEL DESCRIPTION
The schematic of the simulation arrangement is shown
in Fig. 1. The configuration of the micro-discharge model
with a single surface protrusion on the grounded cathode is
shown in Fig. 1(a). A DC voltage is applied on the micron-
gap through a ballast resistor Rb of 100 kX. The micron-gap
length d is 800 lm, and the electrode radius R is 500 lm. In
Fig. 1(b), the parameters a and b are used to define the geom-
etry of the surface ellipsoidal protrusion. The aspect ratio a/bcan be used to identify the geometry shape. The protrusion
will be hemispherical when a/b¼ 1.0 and hemi-ellipsoidal
when a 6¼ b. The electric field enhancement and the cathode
sheath thickness are investigated for different cases in Fig.
1(c). In group A (A1–A4), the protrusions are all hemispheri-
cal and enlarged, keeping a/b¼ 1.0; in group B (B1–B4),
the protrusions are enlarged with a/b increasing from 0.5 to
2.0 with b fixed; in group C (C1–C4), the protrusions are
enlarged with a/b decreasing from 2.0 to 0.5 with a fixed.
The protrusion size is chosen in a range of 25–100 lm which
is comparable to the cathode sheath thickness in atmospheric
pressure discharges.18 The protrusion parameters for groups
A, B, and C are shown in Table I. The effects of the aspect
ratio and protrusion size on the sheath properties can be com-
pared based on these designed cases. In such a way, a domi-
nant impact factor on the electric field enhancement and
sheath properties can be identified.
The fluid model of plasma consists of a set of coupled
equations, including the species continuity equation, electron
energy conservation equation, and Poisson’s equation, which
are solved self-consistently.23–25 It was previously employed
to investigate the plasma sheath properties in diversified sit-
uations.26–30 The detailed description of the fluid model can
be found in our former studies.31,32 A short description is
made here for completeness. Since the present plasma simu-
lations are carried out in a low-temperature (approximate to
the room-temperature) region where plasma heating is found
to be small, a constant temperature of the heavy particles of
300 K is assumed. The electron emission due to field emis-
sion is neglected since the field emission starts to contribute
to the total electron emission from the cathode when the
electric field becomes on the order of 109 V/m or larger.33–35
In the cases studied here, the magnitude of the cathode elec-
tric field (106–107 V/m) allows us to neglect the field emis-
sion processes.
At the cathode boundary, the electric potential is u¼ 0
and the secondary electron emission mechanism due to ion
bombardments is included. The normal flux of electrons Ce
emitted by the cathode is related to the flux of incident ions
Ci in terms of an effective secondary emission coefficient
which is fixed at 0.1.36,37 Relevant reactions and their
FIG. 1. Schematic of the simulation
setup: (a) the micro-discharge gap with
an external DC circuit where Rb is the
ballast resistor; (b) geometry of the
surface protrusion; and (c) three groups
(A: A1–A4, B: B1–B4, and C: C1–C4)
of the designed protrusions.
TABLE I. Parameters of the designed protrusions.
Group no. Parameter Linear dimension (lm)
Group A a 25 50 75 100
b 25 50 75 100
Group B a 25 50 75 100
b 50 50 50 50
Group C a 100 100 100 100
b 50 66.7 100 200
013530-2 Fu et al. Phys. Plasmas 25, 013530 (2018)

coefficients for argon plasma chemistry are taken from Ref.
38. The cross sections of electron impact reactions are origi-
nally referred from Biagi database, and the Boltzmann solver
(BOLSIGþ) is used.39,40 At the anode boundary, the electric
potential is obtained by relation u¼U0� I�Rb. For the
boundary at r¼R, the surface charge density rs is specified
by n�D¼ rs, where n is the unit normal vector, D is the elec-
tric displacement field, and the balance equation for rs is
drs/dt¼ e�(Ci�Ce).41 The fluxes of the excited species are
changed by the quenching reactions at the boundary surfa-
ces.42 The equations are solved time-dependently, and the
results are obtained when the discharge reaches the steady-
state. In the simulation, the gap voltage at the steady-state
with different protrusions can be kept constant by adjusting
the applied source voltage. To achieve effective comparisons
between different cases, the sheath properties are character-
ized in steady-state discharges with the same gap voltage.
III. RESULTS AND DISCUSSION
Determining the sheath properties near plasma bound-
aries is a task as old as the discipline of plasma physics.43,44
Even now, due to the wide range of physical conditions, it is
still hard to obtain a universal determination of the critical
point of the sheath boundaries.45,46 For one specific situa-
tion, the sheath boundary can still be identified by some fea-
sible methods with limited approximations. Here, we adopt
the determination methods of sheath thickness by using the
14% reduction rule and the quasineutrality-based method.
According to the theory for a typical DC plasma sheath
region, the axial electric field usually decreases linearly,
which is widely confirmed by one-dimensional and two-
dimensional modeling in discharges in plane-parallel
gaps.42,47 Due to the nonlinear reduction of the electric field
near the sheath boundary, the 14% reduction rule is derived
to remove the differential effect.18 The 14% reduction rule
can be used when the linear electric filed distribution is
valid in the cathode region. However, this linear characteris-
tic of the electric field may not be always valid due to the
presence of the surface protrusion on the cathode. In this sit-
uation, the 14% reduction rule might be less applicable. On
the other hand, considering the inner structure of the plasma
sheath, the sheath boundary is the spatial location where the
quasineutrality becomes invalid. The plasma sheath thick-
ness can be essentially identified by finding the critical posi-
tion where the departures from the quasineutrality condition
(macroscopic electric neutrality) occur.44,48
Figure 2 shows the general effect of surface protrusions
on electric potential distributions near the cathode protrusion
region (r� 200 lm and z� 200 lm) with and without the
discharges. Without the surface protrusion, the equipotential
lines are in parallel, as shown in Figs. 2(a) and 2(f). In the
cases with a surface protrusion, as shown in Figs. 2(b)–2(e)
and 2(g)–2(j), the electric equipotential lines are significantly
distorted near the protrusion apex, resulting in an enhanced
electric field. It can be seen that the shape of the equipoten-
tial lines in the gap with and without discharge is quite simi-
lar near the cathode surface of a given protrusion. In the
discharge with a surface protrusion, the sheath expands radi-
ally from the protrusion tip in a nonlinear fashion, as shown
in Figs. 2(b)–2(e). The effect of the surface protrusion is
gradually smoothed away from the cathode sheath region,
which is similar to the result of previous sheath modeling
with a rough cathode surface.49
Figure 3 shows the axial distributions of the electric field
Edis and the charged particle densities (electron density ne
and ion density ni) in the plane-parallel gap with and without
cathode protrusion, respectively. In Fig. 3(a), the electric
field decreases linearly in the plane-parallel gap, while in
Fig. 3(b), the electric field shows a severe nonlinear distribu-
tion with a hemispherical protrusion (a¼ 100 lm) on the
cathode. In Fig. 3(a), the 14% rule shows good consistency
with the quasineutrality method in identifying the sheath
thickness. Here, the condition ne¼ 90% ni is used for the
quasineutrality. However, due to the nonlinearity of the elec-
tric field, the 14% rule truncates the sheath thickness with an
error Dz, as shown in Fig. 3(b). Obviously, this method will
lead to an underestimation of the sheath thickness when the
electric field drops in a more steep way in the cathode region.
Therefore, the quasineutrality method is recommended,
while the 14% rule is not well applied when the surface pro-
trusion appears on the cathode.
FIG. 2. The electric potential distributions with (top) and without (bottom) discharge near a hemispherical protrusion with a¼ b from 0 to 100 lm. The gap
voltage in cases (a)–(j) is kept at 150 V.
013530-3 Fu et al. Phys. Plasmas 25, 013530 (2018)
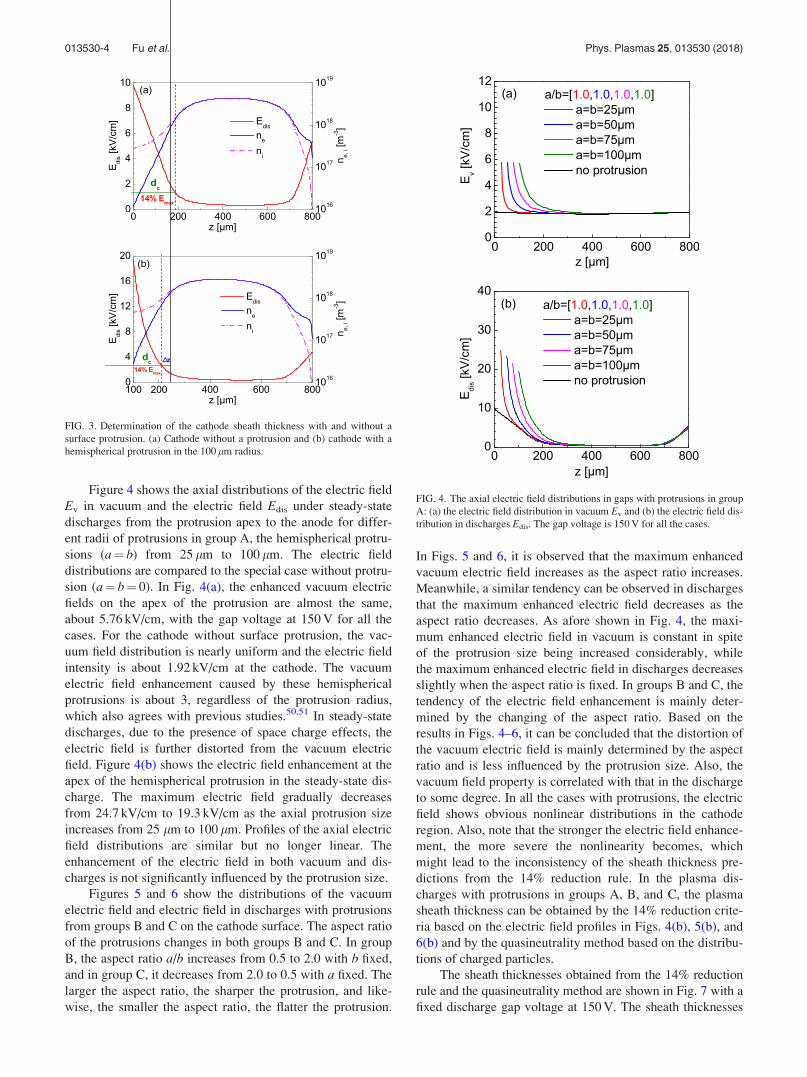
Figure 4 shows the axial distributions of the electric field
Ev in vacuum and the electric field Edis under steady-state
discharges from the protrusion apex to the anode for differ-
ent radii of protrusions in group A, the hemispherical protru-
sions (a¼ b) from 25 lm to 100 lm. The electric field
distributions are compared to the special case without protru-
sion (a¼ b¼ 0). In Fig. 4(a), the enhanced vacuum electric
fields on the apex of the protrusion are almost the same,
about 5.76 kV/cm, with the gap voltage at 150 V for all the
cases. For the cathode without surface protrusion, the vac-
uum field distribution is nearly uniform and the electric field
intensity is about 1.92 kV/cm at the cathode. The vacuum
electric field enhancement caused by these hemispherical
protrusions is about 3, regardless of the protrusion radius,
which also agrees with previous studies.50,51 In steady-state
discharges, due to the presence of space charge effects, the
electric field is further distorted from the vacuum electric
field. Figure 4(b) shows the electric field enhancement at the
apex of the hemispherical protrusion in the steady-state dis-
charge. The maximum electric field gradually decreases
from 24.7 kV/cm to 19.3 kV/cm as the axial protrusion size
increases from 25 lm to 100 lm. Profiles of the axial electric
field distributions are similar but no longer linear. The
enhancement of the electric field in both vacuum and dis-
charges is not significantly influenced by the protrusion size.
Figures 5 and 6 show the distributions of the vacuum
electric field and electric field in discharges with protrusions
from groups B and C on the cathode surface. The aspect ratio
of the protrusions changes in both groups B and C. In group
B, the aspect ratio a/b increases from 0.5 to 2.0 with b fixed,
and in group C, it decreases from 2.0 to 0.5 with a fixed. The
larger the aspect ratio, the sharper the protrusion, and like-
wise, the smaller the aspect ratio, the flatter the protrusion.
In Figs. 5 and 6, it is observed that the maximum enhanced
vacuum electric field increases as the aspect ratio increases.
Meanwhile, a similar tendency can be observed in discharges
that the maximum enhanced electric field decreases as the
aspect ratio decreases. As afore shown in Fig. 4, the maxi-
mum enhanced electric field in vacuum is constant in spite
of the protrusion size being increased considerably, while
the maximum enhanced electric field in discharges decreases
slightly when the aspect ratio is fixed. In groups B and C, the
tendency of the electric field enhancement is mainly deter-
mined by the changing of the aspect ratio. Based on the
results in Figs. 4–6, it can be concluded that the distortion of
the vacuum electric field is mainly determined by the aspect
ratio and is less influenced by the protrusion size. Also, the
vacuum field property is correlated with that in the discharge
to some degree. In all the cases with protrusions, the electric
field shows obvious nonlinear distributions in the cathode
region. Also, note that the stronger the electric field enhance-
ment, the more severe the nonlinearity becomes, which
might lead to the inconsistency of the sheath thickness pre-
dictions from the 14% reduction rule. In the plasma dis-
charges with protrusions in groups A, B, and C, the plasma
sheath thickness can be obtained by the 14% reduction crite-
ria based on the electric field profiles in Figs. 4(b), 5(b), and
6(b) and by the quasineutrality method based on the distribu-
tions of charged particles.
The sheath thicknesses obtained from the 14% reduction
rule and the quasineutrality method are shown in Fig. 7 with a
fixed discharge gap voltage at 150 V. The sheath thicknesses
FIG. 3. Determination of the cathode sheath thickness with and without a
surface protrusion. (a) Cathode without a protrusion and (b) cathode with a
hemispherical protrusion in the 100 lm radius.
FIG. 4. The axial electric field distributions in gaps with protrusions in group
A: (a) the electric field distribution in vacuum Ev and (b) the electric field dis-
tribution in discharges Edis. The gap voltage is 150 V for all the cases.
013530-4 Fu et al. Phys. Plasmas 25, 013530 (2018)

from the 14% reduction rule and from the quasineutrality
method are quite different. With the presence of the cathode
protrusions, the values of the sheath thicknesses dc from
the 14% rule are lower than those from the quasineutrality
method. In Fig. 7(a), for the hemispherical protrusion in group
A, when the axial protrusion dimension a increases from 25
to 100 lm with a constant aspect ratio, the sheath thickness
decreases at first and then is kept nearly constant, about
140 lm with the quasineutrality method and 100 lm with the
14% rule. This indicates that further increasing the protrusion
size may not bring a significant impact on the sheath thick-
ness. In Fig. 7(b), for the protrusions in groups B and C, the
sheath thickness decreases with the increase in the a/b ratio
from 0.5 to 2.0. Note that, in group B, the radial dimension bis kept the same and the axial dimension a increases from 25
to 100 lm, whereas in group C, the axial dimension a is kept
the same and the radial dimension b increases from 25 to
100 lm. It can be observed that, for both groups B and C, the
difference between the sheath thicknesses from two different
methods is enlarged as the a/b ratio increases. It means that
the difference in the sheath thickness from the two methods
becomes smaller when the protrusion is flatter. The variation
range of the sheath thicknesses caused by the aspect ratio can
reach 100 lm with the increase in a/b from 0.5 to 2.0. As for
the effect of the protrusion size, taking the protrusion B1 and
C4 shown in Fig. 1(c), for example, protrusion C4 is four
times as large as protrusion B1. As shown in Fig. 7(b), the dif-
ference of the sheath thickness caused by B1 and C4 is only
around 20 lm from the 14% reduction rule and even less
from the quasineutrality method. This is much less than the
difference caused by the aspect ratio, which indicates that the
aspect ratio has a more dominant impact on the sheath thick-
ness than the protrusion size.
Based on the discussion above, it can be confirmed that as
the protrusion size increases, the smaller a/b ratio will result in
a larger sheath thickness; on the other side, the larger a/b ratio
will lead to a smaller sheath thickness. The protrusion aspect
ratio is identified as the more dominant impact factor on the
sheath properties than the protrusion size. Although the sheath
thicknesses from the two methods are different, the general
tendencies are found to be similar, which are still useful in
qualitative predictions. As shown in Figs. 4–6, the tendency of
the electric field distributions with and without discharge is
similar, and as shown in Fig. 7, the cathode sheath thickness is
found to be related to the uniformity of the electric field distri-
bution inside the discharge gap. The tendency of the relative
cathode sheath thickness could be generally estimated from the
vacuum field and the protrusion geometry parameters. This
property is similar to the space-charge-limited (SCL) current
flow in vacuum diodes, where the SCL current density can be
estimated by only using the cathode vacuum electric field.52,53
Further simulation shows that the general trends are consistent
for different gap voltages.
IV. CONCLUSION
In this work, the effect of a single small surface protru-
sion on the properties of the cathode plasma sheath in the
FIG. 5. The axial electric field distributions in gaps with protrusions in group
B: (a) the electric field distribution in vacuum Ev and (b) the electric field dis-
tribution in discharges Edis. The gap voltage is 150 V for all the cases.
FIG. 6. The axial electric field distributions in gaps with protrusions in group
C: (a) the electric field distribution in vacuum Ev and (b) the electric field dis-
tribution in discharges Edis. The gap voltage is 150 V for all the cases.
013530-5 Fu et al. Phys. Plasmas 25, 013530 (2018)

atmospheric microdischarges was investigated. The plasma
sheath thickness is significantly influenced by the presence
of a surface protrusion even though its geometrical size
is much smaller than the whole gap. With the protrusion
on the cathode surface, both the vacuum electric field
and electric field in discharges are largely enhanced and
become nonlinear in the cathode region. From the pre-
sented cases, it was found that the 14% rule gives lower
estimated values of the sheath thickness than those given
by the quasineutrality method. The tendencies of the sheath
thickness from two methods are similar, and the difference
between them is mainly determined by the aspect ratio:
the larger aspect ratio, the larger the resulted difference
in sheath thickness. When the protrusion is hemispherical
(with a constant aspect ratio), as the protrusion size
increases, the enhancement of the vacuum field is constant
and slightly decreases in the discharge gap. With the same
axial (or radial) protrusion dimension, increasing the
aspect ratio will lead to an obvious decrease in the sheath
thickness, which means that the sheath thickness becomes
smaller when the protrusion is sharper. The effect of the
protrusion’s aspect ratio on the electric field enhancement
and the sheath thickness is more significant than that of the
protrusion size. The results of this study are beneficial to
predict the relative plasma sheath properties from the geo-
metrical parameters of the surface protrusion in atmo-
spheric microdischarges.
ACKNOWLEDGMENTS
This work was supported by the Air Force Office of
Scientific Research (AFOSR), the Department of Energy
(DOE) Office of Fusion Energy Science, and the DOE
Plasma Science Center Grant No. DE-SC0001939. Peng
Zhang was supported by AFOSR Grant No. FA9550-14-1-
0309 through a subcontract from the University of Michigan
and by AFOSR YIP Award No. FA9550-18-1-0061. The
authors would also like to thank the National Natural
Science Foundation for the support of the research under
Contract No. 51777114.
1J. P. Boeuf, J. Phys. D: Appl. Phys. 36, R53 (2003).2J. Franzke, K. Kunze, M. Miclea, and K. Niemax, J. Anal. At. Spectrom.
18, 802 (2003).3Y. C. Hong and H. S. Uhm, Appl. Phys. Lett. 89, 221504 (2006).4K. H. Becker, K. H. Schoenbach, and J. G. Eden, J. Phys. D: Appl. Phys.
39, R55 (2006).5A. Semnani, A. Venkattraman, A. A. Alexeenko, and D. Peroulis, Appl.
Phys. Lett. 102, 174102 (2013).6J. P. Boeuf, L. C. Pitchford, and K. H. Schoenbach, Appl. Phys. Lett. 86,
071501 (2005).7B. J. Lee, H. Rahaman, I. Petzenhauser, K. Frank, and K. P. Giapis, Appl.
Phys. Lett. 90, 241502 (2007).8K. H. Schoenbach and W. Zhu, IEEE J. Quantum Electron. 48, 768
(2012).9M. Moselhy, W. Shi, R. H. Stark, and K. H. Schoenbach, Appl. Phys. Lett.
79, 1240 (2001).10A. M. Loveless and A. L. Garner, IEEE Trans. Plasma Sci. 45, 574 (2017).11S. Sun and L. K. Ang, J. Appl. Phys. 113, 144902 (2013).12J. Lin, P. Y. Wong, P. Yang, Y. Y. Lau, W. Tang, and P. Zhang, J. Appl.
Phys. 121, 244301 (2017).13A. Venkattraman, J. Phys. D: Appl. Phys. 47, 425205 (2014).14A. Venkattraman, Phys. Plasmas 20, 113505 (2013).15D. Levko and L. L. Raja, Phys. Plasmas 23, 073513 (2016).16H. Bar�ankov�a and L. B�ardos, Vacuum 87, 128 (2013).17M. P. Gomes, B. N. Sismanoglu, and J. Amorim, Braz. J. Phys. 39, 25
(2009).18J. J. Shi and M. G. Kong, J. Appl. Phys. 94, 5504 (2003).19J. J. Shi and M. G. Kong, IEEE Trans. Plasma Sci. 33, 624 (2005).20C. W. Yao, H. C. Ma, Z. S. Chang, P. Li, H. B. Mu, and G. J. Zhang, Acta
Phys. Sin. 66, 025203 (2017).21J. J. Shi and M. G. Kong, Phys. Rev. Lett. 96, 105009 (2006).22J. J. Shi and M. G. Kong, Appl. Phys. Lett. 87, 201501 (2005).23E. A. Bogdanov, V. I. Demidov, A. A. Kudryavtsev, and A. I. Saifutdinov,
Phys. Plasmas 22, 024501 (2015).24Y. Fu, H. Luo, X. Zou, and X. Wang, IEEE Trans. Plasma Sci. 42, 1544
(2014).25P. G. C. Almeida, M. S. Benilov, and M. J. Faria, Plasma Sources Sci.
Technol. 19, 025019 (2010).26U. Shumlak, R. Lilly, N. Reddell, E. Sousa, and B. Srinivasan, Comput.
Phys. Commun. 182, 1767 (2011).27I. Rafatov, E. A. Bogdanov, and A. A. Kudryavtsev, Phys. Plasmas 19,
093503 (2012).28T. Gyergyek and J. Kovacic, Phys. Plasmas 22, 043502 (2015).29M. Gohain and P. K. Karmakar, Europhys. Lett. 112, 45002 (2015).30Y. Fu, H. Luo, X. Zou, and X. Wang, Phys. Plasmas 22, 023502 (2015).31Y. Fu, H. Luo, X. Zou, and X. Wang, Plasma Sources Sci. Technol. 23,
065035 (2014).32Y. Fu, J. P. Verboncoeur, A. J. Christlieb, and X. Wang, Phys. Plasmas 24,
083516 (2017).33A. Venkattraman and A. A. Alexeenko, Phys. Plasmas 19, 123515 (2012).34Y. Feng and J. P. Verboncoeur, Phys. Plasmas 13, 073105 (2006).35Y. Feng, J. P. Verboncoeur, and M. C. Lin, Phys. Plasmas 15, 043301
(2008).36A. Derzsi, I. Korolov, E. Sch€ungel, Z. Donk�o, and J. Schulze, Plasma
Sources Sci. Technol. 24, 034002 (2015).37A. Berkane, S. Rebiai, F. Bouanaka, and H. Bahouh, Phys. Scr. 90,
065602 (2015).
FIG. 7. The dependence of sheath thickness dc on the protrusion dimension
and aspect ratio a/b with a fixed gap voltage at 150 V. (a) Sheath thickness
as a function of the protrusion dimension with protrusions in group A and
(b) sheath thickness as a function of aspect ratio a/b with protrusions in
groups B and C.
013530-6 Fu et al. Phys. Plasmas 25, 013530 (2018)

38Y. Fu, J. P. Verboncoeur, and A. J. Christlieb, Phys. Plasmas 24, 103514
(2017).39See https://fr.lxcat.net for Biagi v8.9 database (retrieved on July 4, 2012).40G. J. M. Hagelaar and L. C. Pitchford, Plasma Sources Sci. Technol. 14,
722 (2005).41Y. Sakiyama and D. B. Graves, Plasma Sources Sci. Technol. 18, 025022
(2009).42T. Farouk, B. Farouk, D. Staack, A. Gutsol, and A. Fridman, Plasma
Sources Sci. Technol. 15, 676 (2006).43L. Tonks and I. Langmuir, Phys. Rev. 34, 876 (1929).44J. E. Allen, Plasma Sources Sci. Technol. 18, 014004 (2009).45A. V. Godyak and N. Sternberg, IEEE Trans. Plasma Sci. 18, 159
(1990).46R. N. Franklin, J. Phys. D: Appl. Phys. 36, R309 (2003).
47Y. Fu, H. Luo, X. Zou, K. Liu, and X. Wang, Acta Phys. Sin. 62, 205209
(2013).48J. A. Bittencourt, Fundamentals of Plasma Physics (Springer-Verlag, New
York, 2004), p. 279.49See https://www.particleincell.com/starfish/ for examples of Starfish
simulations.50J. H. Jeans, The Mathematical Theory of Electricity and Magnetism
(Cambridge University Press, Cambridge, 1920), p. 194.51P. Zhang, Y. Y. Lau, and R. M. Gilgenbach, J. Appl. Phys. 105, 114908
(2009).52Y. B. Zhu, P. Zhang, A. Valfells, L. K. R. Ang, and Y. Y. Lau, Phys. Rev.
Lett. 110, 265007 (2013).53P. Zhang, A. Valfells, L. K. Ang, J. W. Luginsland, and Y. Y. Lau, Appl.
Phys. Rev. 4, 011304 (2017).
013530-7 Fu et al. Phys. Plasmas 25, 013530 (2018)
Recommended