Estuarine, Coastal and Shelf Science 74 (2007) 579e584
Short Communication
Effects of freshwater flow on environmental factors and copepod densityin the Chikugo estuary, Japan
Md. Shahidul Islam*, Masaru Tanaka
Field Science Education and Research Center, Graduate School of Agriculture, Kyoto University, Kyoto 606-8502, Japan
Received 7 May 2007; accepted 14 May 2007
Available online 5 July 2007
Abstract
This study describes the effects of freshwater flow on the major environmental parameters (temperature, salinity, turbidity, chlorophyll-a andphaeopigment) and the density of the two most dominant copepods, a calanoid copepod Sinocalanus sinensis and a cyclopoid copepod Oithonadavisae, in the Chikugo River estuary in Ariake Bay, Japan. Freshwater flow negatively and significantly influenced salinity and phaeopigmentbut the influence on temperature, turbidity and chlorophyll-a was not significant. Freshwater flow also negatively and significantly influenced thedistance of turbidity maximum from the river mouth. Density of S. sinensis which is distributed in the upstream areas was negatively and sig-nificantly influenced by freshwater flow while the density of O. davisae which is distributed in the downstream areas was not influenced byfreshwater flow. The effects of freshwater flow appear to be associated with the spatio-temporal patterns of the dependent parameters. The stron-gest influences of freshwater flow occurred at the upper part of the estuary within 1e7 days and the influences weakened with space and time.� 2007 Elsevier Ltd. All rights reserved.
Keywords: freshwater flow; environmental factors; Sinocalanus sinensis; Oithona davisae; Chikugo estuary
www.elsevier.com/locate/ecss
1. Introduction
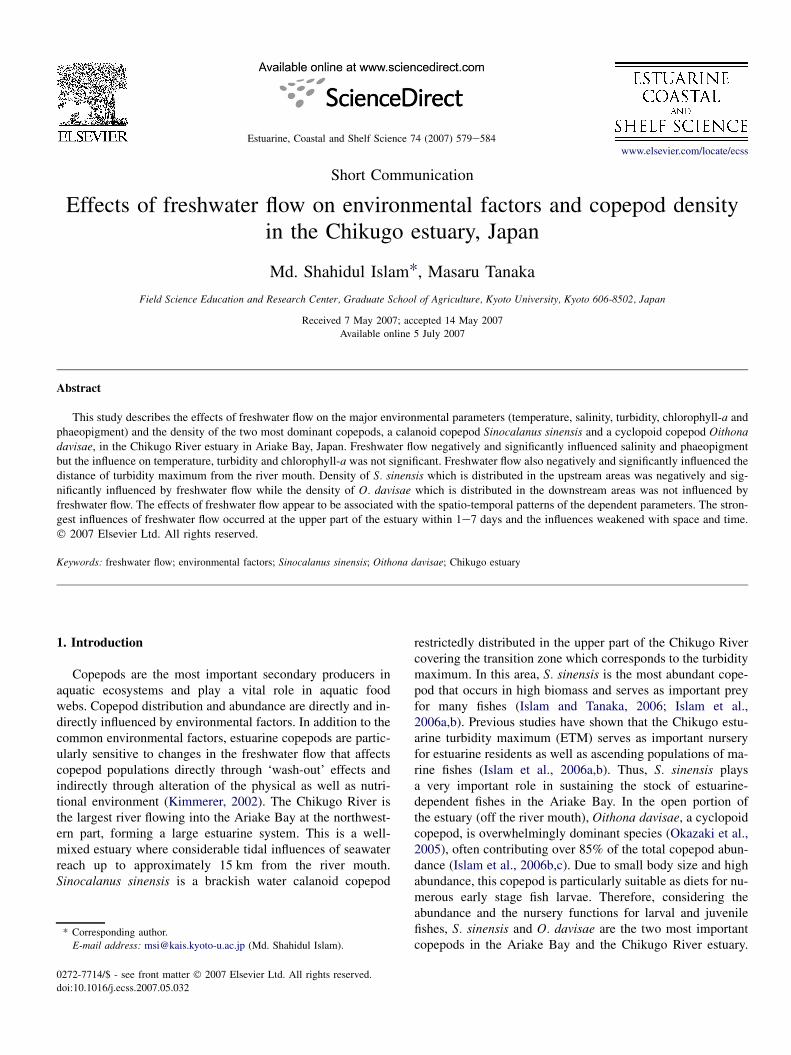
Copepods are the most important secondary producers inaquatic ecosystems and play a vital role in aquatic foodwebs. Copepod distribution and abundance are directly and in-directly influenced by environmental factors. In addition to thecommon environmental factors, estuarine copepods are partic-ularly sensitive to changes in the freshwater flow that affectscopepod populations directly through ‘wash-out’ effects andindirectly through alteration of the physical as well as nutri-tional environment (Kimmerer, 2002). The Chikugo River isthe largest river flowing into the Ariake Bay at the northwest-ern part, forming a large estuarine system. This is a well-mixed estuary where considerable tidal influences of seawaterreach up to approximately 15 km from the river mouth.Sinocalanus sinensis is a brackish water calanoid copepod
* Corresponding author.
E-mail address: [email protected] (Md. Shahidul Islam).
0272-7714/$ - see front matter � 2007 Elsevier Ltd. All rights reserved.
doi:10.1016/j.ecss.2007.05.032
restrictedly distributed in the upper part of the Chikugo Rivercovering the transition zone which corresponds to the turbiditymaximum. In this area, S. sinensis is the most abundant cope-pod that occurs in high biomass and serves as important preyfor many fishes (Islam and Tanaka, 2006; Islam et al.,2006a,b). Previous studies have shown that the Chikugo estu-arine turbidity maximum (ETM) serves as important nurseryfor estuarine residents as well as ascending populations of ma-rine fishes (Islam et al., 2006a,b). Thus, S. sinensis playsa very important role in sustaining the stock of estuarine-dependent fishes in the Ariake Bay. In the open portion ofthe estuary (off the river mouth), Oithona davisae, a cyclopoidcopepod, is overwhelmingly dominant species (Okazaki et al.,2005), often contributing over 85% of the total copepod abun-dance (Islam et al., 2006b,c). Due to small body size and highabundance, this copepod is particularly suitable as diets for nu-merous early stage fish larvae. Therefore, considering theabundance and the nursery functions for larval and juvenilefishes, S. sinensis and O. davisae are the two most importantcopepods in the Ariake Bay and the Chikugo River estuary.
580 Md. Shahidul Islam, M. Tanaka / Estuarine, Coastal and Shelf Science 74 (2007) 579e584
Effects of environmental factors on the density of these impor-tant copepods have been reported in our previous papers (Is-lam et al., 2006c). In this paper, we explore the effects offreshwater flow on the major environmental parameters andthe density of S. sinensis and O. davisae in the Chikugoestuary.
2. Material and methods
The study area (Fig. 1) and the sampling regimes have beendescribed in detail in our previous paper (Islam et al., 2006c).The environmental as well as the density data of Sinocalanussinensis and Oithona davisae are the same as presented in theprevious paper. In this short paper, we attempt to investigatethe effects of freshwater flow on the environmental parametersand the density of the two copepods. In addition to the envi-ronmental parameters described in the previous paper, sus-pended particulate matter (SPM, mg l�1) and relativefluorescence (RF) data have been given in this paper. To quan-tify SPM, a known volume of water was filtered onto a pre-weighed and pre-dried Whatman GF/F filter and the filterwas then oven dried at 45 �C for 24 h and SPM was calculatedby comparing the initial and final weights. RF was measuredusing a chlorophyll sensor (YSI 6025 Chlorophyll Probe;
Fig. 1. Map showing the location of the Ariake Bay and the Chikugo River
estuary; the points represent the sampling stations.
YSI Environmental, USA). The purpose of measuring SPMand RF was to compare with turbidity and chlorophyll-a ana-lyzed in the laboratory, with a view to explore the possibilityof using these measurements for continuous samplings. Simplelinear regression models were developed to calculate SPMfrom turbidity and chlorophyll-a from RF.
Mean daily freshwater discharge data were collected fromthe River Bureau, Ministry of Land, Infrastructure and Trans-port and were used as a measure of freshwater flow throughthe Chikugo River. The measurements of daily discharge aremade by the River Bureau at the Chikugo Oozeki Weir locatedat around 26 km upriver from the river mouth. The freshwaterflow data (denoted as F, m�3 s�1) were divided into four cat-egories: the flow on the previous day (F1) of the sampling date,mean flow for 7 days (F7), 15 days (F15) and 30 days (F30)prior to the sampling date. All the four categories of freshwa-ter flow data were used to observe their effects on copepoddensity.
Calibration models describing the relationships betweenturbidity and SPM and between RF and chlorophyll-a were es-tablished using simple linear regression method. The influenceof four levels of freshwater flow rates on the environmentalfactors as well as on the copepod density was evaluated usingPearson’s correlation coefficient.
3. Results
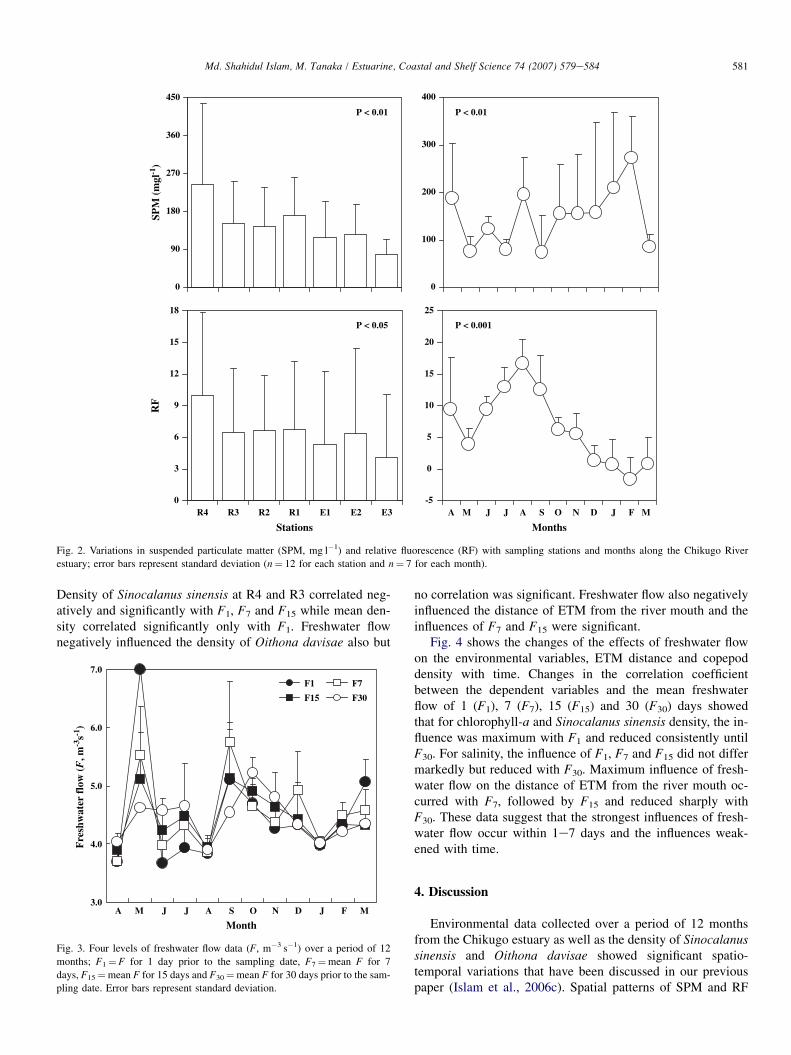
The highest mean SPM (242.9� 193.3 mg l�1) was re-corded at R4 and SPM decreased significantly (P< 0.05) to-ward downstream with the lowest mean value(77.7� 35.9 mg l�1) at E3 (Fig. 2). SPM showed significantmonthly variations (P< 0.01), with the lowest value(74.3� 77.9 mg l�1) in September and the highest value(272.8� 85.5 mg l�1) in February. The highest value for RF(9.9� 7.9) was recorded at R4 and the lowest value (4.1�5.9) was recorded at E3; monthly highest value (16.6� 3.8)was recorded in August and the lowest value (�1.6� 3.3)was recorded in February. RF showed significant variationsamong stations (P< 0.05) as well as among months(P< 0.001) (Fig. 2). Significant positive linear relationshipswere observed between SPM and turbidity (SPM¼0.81NTUþ 49.08; R2¼ 0.76; P< 0.001; n¼ 84) and betweenchlorophyll-a and RF (chlorophyll-a¼ 0.54RFþ 4.28; R2¼0.62; P< 0.001; n¼ 79).
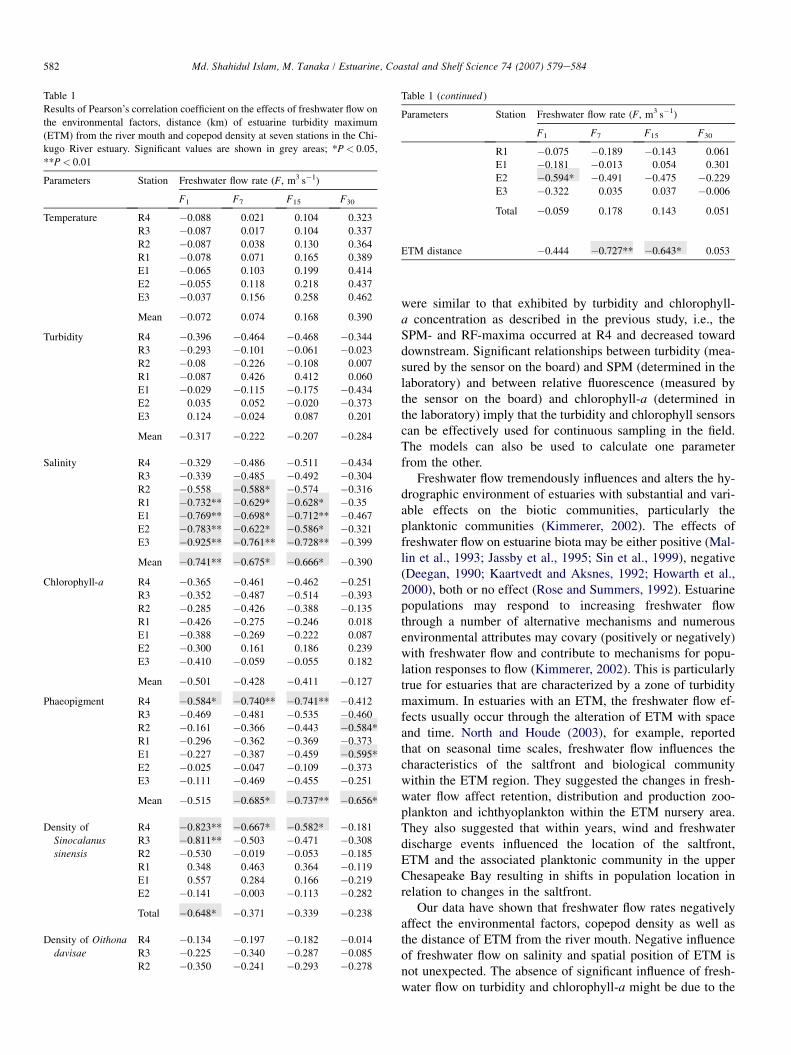
Mean (�SD) freshwater flows (F1, F7, F15 and F30) areshown in Fig. 3. Range of F1, F7, F15 and F30 was 3.7e7.0,3.7e5.7, 3.9e5.1 and 3.9e5.2 m3 s�1, respectively. Tempera-ture and turbidity were not significantly (P> 0.05) influencedby freshwater flow (Table 1). Salinity at all stations was neg-atively influenced by freshwater flow. Negative influence ofF1, F7 and F15 on salinity at R1eE3 and on mean salinitywas significant. Phaeopigment concentrations at R4 signifi-cantly correlated with F1, F7 and F15 and mean phaeopigmentconcentrations significantly correlated with all levels of fresh-water flow. Although chlorophyll-a concentrations at all sta-tions as well as mean chlorophyll-a correlated negativelywith freshwater flow, none of the values was significant.
581Md. Shahidul Islam, M. Tanaka / Estuarine, Coastal and Shelf Science 74 (2007) 579e584
0
90
180
270
360
450
0
100
200
300
400
0
3
6
9
12
15
18
R4 R3 R2 R1 E1 E2 E3-5
0
5
10
15
20
25
A M J J A S O N D J F M
Stations
SPM
(m
gl-1
)
Months
RF
P < 0.01 P < 0.01
P < 0.05 P < 0.001
Fig. 2. Variations in suspended particulate matter (SPM, mg l�1) and relative fluorescence (RF) with sampling stations and months along the Chikugo River
estuary; error bars represent standard deviation (n¼ 12 for each station and n¼ 7 for each month).
Density of Sinocalanus sinensis at R4 and R3 correlated neg-atively and significantly with F1, F7 and F15 while mean den-sity correlated significantly only with F1. Freshwater flownegatively influenced the density of Oithona davisae also but
3.0
4.0
5.0
6.0
7.0
A M J J A S O N D J F M
F1 F7
F15 F30
Month
Fre
shw
ater
flo
w (
F, m
-3s-1
)
Fig. 3. Four levels of freshwater flow data (F, m�3 s�1) over a period of 12
months; F1¼ F for 1 day prior to the sampling date, F7¼mean F for 7
days, F15¼mean F for 15 days and F30¼mean F for 30 days prior to the sam-
pling date. Error bars represent standard deviation.
no correlation was significant. Freshwater flow also negativelyinfluenced the distance of ETM from the river mouth and theinfluences of F7 and F15 were significant.
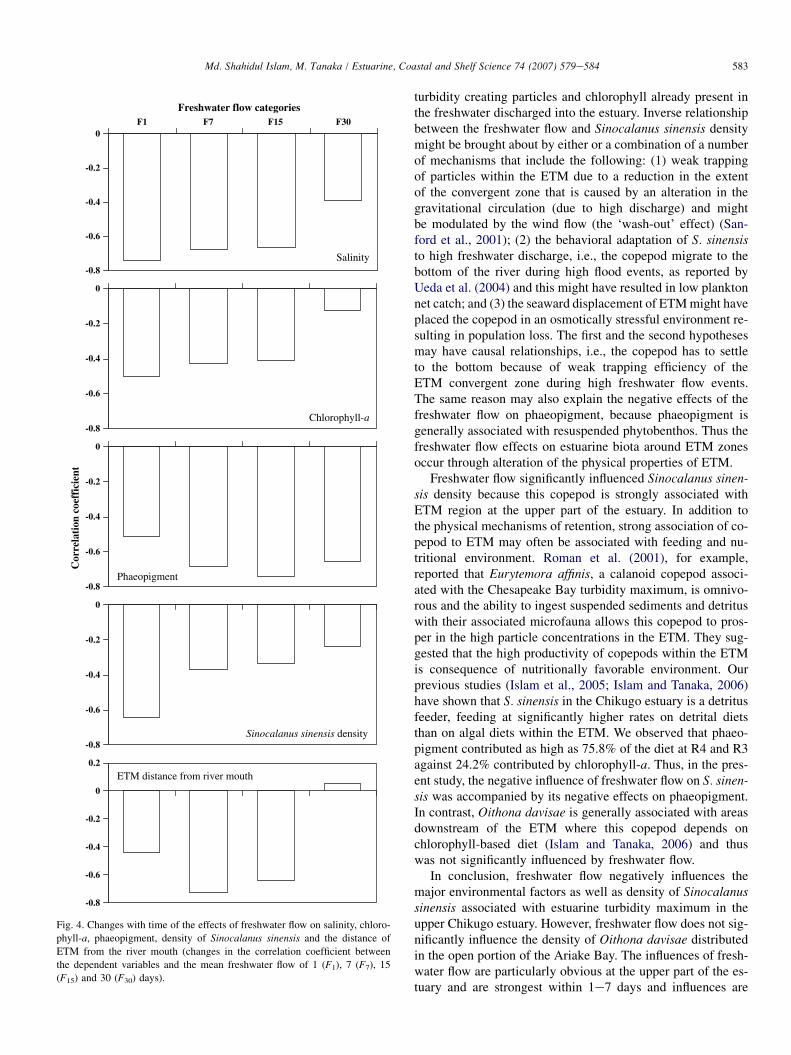
Fig. 4 shows the changes of the effects of freshwater flowon the environmental variables, ETM distance and copepoddensity with time. Changes in the correlation coefficientbetween the dependent variables and the mean freshwaterflow of 1 (F1), 7 (F7), 15 (F15) and 30 (F30) days showedthat for chlorophyll-a and Sinocalanus sinensis density, the in-fluence was maximum with F1 and reduced consistently untilF30. For salinity, the influence of F1, F7 and F15 did not differmarkedly but reduced with F30. Maximum influence of fresh-water flow on the distance of ETM from the river mouth oc-curred with F7, followed by F15 and reduced sharply withF30. These data suggest that the strongest influences of fresh-water flow occur within 1e7 days and the influences weak-ened with time.
4. Discussion
Environmental data collected over a period of 12 monthsfrom the Chikugo estuary as well as the density of Sinocalanussinensis and Oithona davisae showed significant spatio-temporal variations that have been discussed in our previouspaper (Islam et al., 2006c). Spatial patterns of SPM and RF
582 Md. Shahidul Islam, M. Tanaka / Estuarine, Coastal and Shelf Science 74 (2007) 579e584
Table 1
Results of Pearson’s correlation coefficient on the effects of freshwater flow on
the environmental factors, distance (km) of estuarine turbidity maximum
(ETM) from the river mouth and copepod density at seven stations in the Chi-
kugo River estuary. Significant values are shown in grey areas; *P< 0.05,
**P< 0.01
Parameters Station Freshwater flow rate (F, m3 s�1)
F1 F7 F15 F30
Temperature R4 �0.088 0.021 0.104 0.323
R3 �0.087 0.017 0.104 0.337
R2 �0.087 0.038 0.130 0.364
R1 �0.078 0.071 0.165 0.389
E1 �0.065 0.103 0.199 0.414
E2 �0.055 0.118 0.218 0.437
E3 �0.037 0.156 0.258 0.462
Mean �0.072 0.074 0.168 0.390
Turbidity R4 �0.396 �0.464 �0.468 �0.344
R3 �0.293 �0.101 �0.061 �0.023
R2 �0.08 �0.226 �0.108 0.007
R1 �0.087 0.426 0.412 0.060
E1 �0.029 �0.115 �0.175 �0.434
E2 0.035 0.052 �0.020 �0.373
E3 0.124 �0.024 0.087 0.201
Mean �0.317 �0.222 �0.207 �0.284
Salinity R4 �0.329 �0.486 �0.511 �0.434
R3 �0.339 �0.485 �0.492 �0.304
R2 �0.558 �0.588* �0.574 �0.316
R1 �0.732** �0.629* �0.628* �0.35
E1 �0.769** �0.698* �0.712** �0.467
E2 �0.783** �0.622* �0.586* �0.321
E3 �0.925** �0.761** �0.728** �0.399
Mean �0.741** �0.675* �0.666* �0.390
Chlorophyll-a R4 �0.365 �0.461 �0.462 �0.251
R3 �0.352 �0.487 �0.514 �0.393
R2 �0.285 �0.426 �0.388 �0.135
R1 �0.426 �0.275 �0.246 0.018
E1 �0.388 �0.269 �0.222 0.087
E2 �0.300 0.161 0.186 0.239
E3 �0.410 �0.059 �0.055 0.182
Mean �0.501 �0.428 �0.411 �0.127
Phaeopigment R4 �0.584* �0.740** �0.741** �0.412
R3 �0.469 �0.481 �0.535 �0.460
R2 �0.161 �0.366 �0.443 �0.584*
R1 �0.296 �0.362 �0.369 �0.373
E1 �0.227 �0.387 �0.459 �0.595*
E2 �0.025 �0.047 �0.109 �0.373
E3 �0.111 �0.469 �0.455 �0.251
Mean �0.515 �0.685* �0.737** �0.656*
Density of
Sinocalanus
sinensis
R4 �0.823** �0.667* �0.582* �0.181
R3 �0.811** �0.503 �0.471 �0.308
R2 �0.530 �0.019 �0.053 �0.185
R1 0.348 0.463 0.364 �0.119
E1 0.557 0.284 0.166 �0.219
E2 �0.141 �0.003 �0.113 �0.282
Total �0.648* �0.371 �0.339 �0.238
Density of Oithona
davisae
R4 �0.134 �0.197 �0.182 �0.014
R3 �0.225 �0.340 �0.287 �0.085
R2 �0.350 �0.241 �0.293 �0.278
were similar to that exhibited by turbidity and chlorophyll-a concentration as described in the previous study, i.e., theSPM- and RF-maxima occurred at R4 and decreased towarddownstream. Significant relationships between turbidity (mea-sured by the sensor on the board) and SPM (determined in thelaboratory) and between relative fluorescence (measured bythe sensor on the board) and chlorophyll-a (determined inthe laboratory) imply that the turbidity and chlorophyll sensorscan be effectively used for continuous sampling in the field.The models can also be used to calculate one parameterfrom the other.
Freshwater flow tremendously influences and alters the hy-drographic environment of estuaries with substantial and vari-able effects on the biotic communities, particularly theplanktonic communities (Kimmerer, 2002). The effects offreshwater flow on estuarine biota may be either positive (Mal-lin et al., 1993; Jassby et al., 1995; Sin et al., 1999), negative(Deegan, 1990; Kaartvedt and Aksnes, 1992; Howarth et al.,2000), both or no effect (Rose and Summers, 1992). Estuarinepopulations may respond to increasing freshwater flowthrough a number of alternative mechanisms and numerousenvironmental attributes may covary (positively or negatively)with freshwater flow and contribute to mechanisms for popu-lation responses to flow (Kimmerer, 2002). This is particularlytrue for estuaries that are characterized by a zone of turbiditymaximum. In estuaries with an ETM, the freshwater flow ef-fects usually occur through the alteration of ETM with spaceand time. North and Houde (2003), for example, reportedthat on seasonal time scales, freshwater flow influences thecharacteristics of the saltfront and biological communitywithin the ETM region. They suggested the changes in fresh-water flow affect retention, distribution and production zoo-plankton and ichthyoplankton within the ETM nursery area.They also suggested that within years, wind and freshwaterdischarge events influenced the location of the saltfront,ETM and the associated planktonic community in the upperChesapeake Bay resulting in shifts in population location inrelation to changes in the saltfront.
Our data have shown that freshwater flow rates negativelyaffect the environmental factors, copepod density as well asthe distance of ETM from the river mouth. Negative influenceof freshwater flow on salinity and spatial position of ETM isnot unexpected. The absence of significant influence of fresh-water flow on turbidity and chlorophyll-a might be due to the
Table 1 (continued )
Parameters Station Freshwater flow rate (F, m3 s�1)
F1 F7 F15 F30
R1 �0.075 �0.189 �0.143 0.061
E1 �0.181 �0.013 0.054 0.301
E2 �0.594* �0.491 �0.475 �0.229
E3 �0.322 0.035 0.037 �0.006
Total �0.059 0.178 0.143 0.051
ETM distance �0.444 �0.727** �0.643* 0.053
583Md. Shahidul Islam, M. Tanaka / Estuarine, Coastal and Shelf Science 74 (2007) 579e584
-0.8
-0.6
-0.4
-0.2
0F1 F7 F15 F30
-0.8
-0.6
-0.4
-0.2
0
-0.8
-0.6
-0.4
-0.2
0
-0.8
-0.6
-0.4
-0.2
0
-0.8
-0.6
-0.4
-0.2
0
0.2
Cor
rela
tion
coe
ffic
ient
Freshwater flow categories
Salinity
Chlorophyll-a
Phaeopigment
Sinocalanus sinensis density
ETM distance from river mouth
Fig. 4. Changes with time of the effects of freshwater flow on salinity, chloro-
phyll-a, phaeopigment, density of Sinocalanus sinensis and the distance of
ETM from the river mouth (changes in the correlation coefficient between
the dependent variables and the mean freshwater flow of 1 (F1), 7 (F7), 15
(F15) and 30 (F30) days).
turbidity creating particles and chlorophyll already present inthe freshwater discharged into the estuary. Inverse relationshipbetween the freshwater flow and Sinocalanus sinensis densitymight be brought about by either or a combination of a numberof mechanisms that include the following: (1) weak trappingof particles within the ETM due to a reduction in the extentof the convergent zone that is caused by an alteration in thegravitational circulation (due to high discharge) and mightbe modulated by the wind flow (the ‘wash-out’ effect) (San-ford et al., 2001); (2) the behavioral adaptation of S. sinensisto high freshwater discharge, i.e., the copepod migrate to thebottom of the river during high flood events, as reported byUeda et al. (2004) and this might have resulted in low planktonnet catch; and (3) the seaward displacement of ETM might haveplaced the copepod in an osmotically stressful environment re-sulting in population loss. The first and the second hypothesesmay have causal relationships, i.e., the copepod has to settleto the bottom because of weak trapping efficiency of theETM convergent zone during high freshwater flow events.The same reason may also explain the negative effects of thefreshwater flow on phaeopigment, because phaeopigment isgenerally associated with resuspended phytobenthos. Thus thefreshwater flow effects on estuarine biota around ETM zonesoccur through alteration of the physical properties of ETM.
Freshwater flow significantly influenced Sinocalanus sinen-sis density because this copepod is strongly associated withETM region at the upper part of the estuary. In addition tothe physical mechanisms of retention, strong association of co-pepod to ETM may often be associated with feeding and nu-tritional environment. Roman et al. (2001), for example,reported that Eurytemora affinis, a calanoid copepod associ-ated with the Chesapeake Bay turbidity maximum, is omnivo-rous and the ability to ingest suspended sediments and detrituswith their associated microfauna allows this copepod to pros-per in the high particle concentrations in the ETM. They sug-gested that the high productivity of copepods within the ETMis consequence of nutritionally favorable environment. Ourprevious studies (Islam et al., 2005; Islam and Tanaka, 2006)have shown that S. sinensis in the Chikugo estuary is a detritusfeeder, feeding at significantly higher rates on detrital dietsthan on algal diets within the ETM. We observed that phaeo-pigment contributed as high as 75.8% of the diet at R4 and R3against 24.2% contributed by chlorophyll-a. Thus, in the pres-ent study, the negative influence of freshwater flow on S. sinen-sis was accompanied by its negative effects on phaeopigment.In contrast, Oithona davisae is generally associated with areasdownstream of the ETM where this copepod depends onchlorophyll-based diet (Islam and Tanaka, 2006) and thuswas not significantly influenced by freshwater flow.
In conclusion, freshwater flow negatively influences themajor environmental factors as well as density of Sinocalanussinensis associated with estuarine turbidity maximum in theupper Chikugo estuary. However, freshwater flow does not sig-nificantly influence the density of Oithona davisae distributedin the open portion of the Ariake Bay. The influences of fresh-water flow are particularly obvious at the upper part of the es-tuary and are strongest within 1e7 days and influences are
584 Md. Shahidul Islam, M. Tanaka / Estuarine, Coastal and Shelf Science 74 (2007) 579e584
weakened with space and time. The effects of freshwater flowon copepod density appear to take place through alteration ofthe physical and/or nutritional environment.
Acknowledgements
This research was supported by the research grant providedby the Japanese Government Ministry of Education, Culture,Sports, Science and Technology (Monbukagakusho, MEXT).We are grateful to Dr. Jun Shoji of Hiroshima University forcollecting and providing the freshwater discharge data.
References
Deegan, L.A., 1990. Effects of estuarine environmental conditions on popula-
tion dynamics of young-of-the-year gulf menhaden. Marine Ecology Prog-
ress Series 68, 195e205.
Howarth, R.W., Swaney, D.P., Butler, T.J., Marino, R., 2000. Climatic control
on eutrophication of the Hudson River estuary. Ecosystems 3, 210e215.
Islam, M.S., Tanaka, M., 2006. Spatial variability in the nursery function along
a temperate estuarine gradient: role of detrital versus algal trophic path-
way. Canadian Journal of Fisheries and Aquatic Sciences 63, 1848e1864.
Islam, M.S., Hibino, M., Tanaka, M., 2006a. Distribution and diets of larval
and juvenile fishes: influence of salinity gradient and turbidity maximum
in a temperate estuary in upper Ariake Bay, Japan. Estuarine, Coastal
and Shelf Science 68, 62e74.
Islam, M.S., Hibino, M., Ohta, T., Nakayama, K., Tanaka, M., 2006b. Long-
term patterns in the diets of Japanese temperate bass Lateolabrax japonicus
larvae and juveniles in Chikugo estuarine nursery ground in Ariake Bay,
Japan. Estuaries and Coasts 29, 524e534.
Islam, M.S., Ueda, H., Tanaka, M., 2006c. Spatial and seasonal variations in
copepod communities related to turbidity maximum along the Chikugo
estuarine gradient in the upper Ariake Bay, Japan. Estuarine, Coastal
and Shelf Science 68, 113e126.
Islam, M.S., Ueda, H., Tanaka, M., 2005. Spatial distribution and trophic
ecology of dominant copepods associated with turbidity maximum along
the salinity gradient and in a highly embayed estuarine system in Ariake
Sea, Japan. Journal of Experimental Marine Biology and Ecology 316,
101e115.
Jassby, A.D., Kimmerer, W.J., Monismith, S.G., Armor, C., Cloern, J.E.,
Powell, T.M., Schubel, J.R., Vendlinski, T.J., 1995. Isohaline position as a hab-
itat indicator for estuarine populations. Ecological Applications 5, 272e289.
Kaartvedt, S., Aksnes, D.L., 1992. Does freshwater discharge cause mortality
of fjord-living zooplankton. Estuarine, Coastal and Shelf Science 34,
305e313.
Kimmerer, W.J., 2002. Effects of freshwater flow on abundance of estuarine
organisms: physical effects or trophic linkage? Marine Ecology Progress
Series 243, 39e55.
Mallin, M.A., Paerl, H.W., Rudek, J., Bates, P.W., 1993. Regulation of estua-
rine primary production by watershed rainfall and river flow. Marine Ecol-
ogy Progress Series 93, 199e203.
North, E.W., Houde, E.D., 2003. Linking ETM physics, zooplankton prey, and
fish early-life histories to white perch (Morone americana) and striped bass
(M. saxatilis) recruitment success. Marine Ecology Progress Series 260,
219e236.
Okazaki, Y., Hosoe, Y., Nonaka, Y., Nakata, H., 2005. Spatial and temporal
distribution of copepod in Ariake Bay. Bulletin of the Japanese Society
of Fisheries Oceanography 69, 10e17.
Roman, M.R., Holliday, D.V., Sanford, L.P., 2001. Temporal and spatial pat-
terns of zooplankton in the Chesapeake Bay turbidity maximum. Marine
Ecology Progress Series 213, 215e227.
Rose, K.A., Summers, J.K., 1992. Relationships among long-term fisheries
abundances, hydrographic variables, and gross pollution indicators in
northeastern U.S. estuaries. Fisheries Oceanography 1, 281e293.
Sanford, L.P., Suttles, S.E., Halka, J.P., 2001. Reconsidering the physics of the
Chesapeake Bay estuarine turbidity maximum. Estuaries 24, 655e669.
Sin, Y., Wetzel, R.L., Anderson, I.C., 1999. Spatial and temporal characteris-
tics of nutrient and phytoplankton dynamics in the York River estuary, Vir-
ginia: analyses of long-term data. Estuaries 22, 260e275.
Ueda, H., Terao, A., Tanaka, M., Hibino, M., Islam, M.S., 2004. How can riv-
ereestuarine planktonic copepods survive river floods? Ecological Re-
search 19, 625e632.
Recommended