The Pennsylvania State University
The Graduate School
EFFECTS OF PELLET QUALITY TO ON-FARM NUTRIENT SEGREGATION AND
SUBSEQUENT BROILER PERFORMANCE AND MONITORING TURKEY BREAST
MEAT QUALITY USING INSTRUMENTAL ANALYSES
A Thesis in
Animal Science
by
Courtney Poholsky
© 2021 Courtney Poholsky
Submitted in Partial Fulfillment
of the Requirements
for the Degree of
Master of Science
May 2021

ii
The thesis of Courtney Poholsky was reviewed and approved by the following:
John W. Boney
Assistant Professor of Poultry Science
Thesis Advisor
Paul H. Patterson
Professor of Poultry Science
Edward W. Mills
Associate Professor of Meat Science
Adele M. Turzillo
Professor and Head of the Department of Animal Science

iii
ABSTRACT
Researchers have continuously demonstrated the benefits of improving pellet quality
(PQ) on bird performance. However, the demand for daily mill tonnage (throughput) and other
challenges often supersede the use of manufacturing techniques that improve PQ. Additional
benefits to improving PQ must be presented. It has been suggested that improving PQ reduces
dietary nutrient segregation, yet this idea requires further investigation. Therefore, a study was
conducted to investigate the effects of PQ to on-farm nutrient segregation in commercial broiler
houses varying in feed line length. Four experiments (Exp) were performed, each including four
replicate feed lines segmented into eight regions. A commercial broiler finisher diet was
manufactured using techniques to create either poor pellet quality (PPQ) or improved pellet
quality (IPQ) feeds. Exp1 and Exp2 were conducted to investigate how PPQ and IPQ feed
contributes to nutrient segregation in a 152-m feed line, respectively. Exp3 and Exp4 used the
same PPQ and IPQ feed, respectively, but were carried out in a 152-m house with split feed lines,
76-m long. Feed samples were taken from each feed pan per Exp. Pellets and fines were analyzed
separately to determine pellet-to-fine ratios (P:F), pellet survivability, and nutrient concentrations.
Results indicated that improving PQ decreased amino acid (AA) and phytase segregation,
regardless of feed line length. In addition, augering feed throughout shorter feed lines reduced
nutrient segregation, regardless of PQ. Nutrient segregation is likely to affect bird performance
and flock uniformity. The amount of nutrients broilers receive may be dependent upon their
location in the house. Therefore, a subsequent study was conducted to analyze the effects of PQ
and dietary AA density on broiler performance. Diets were provided to broilers in 3 phases from
0 to 14, 14 to 28, and 28 to 42 d of age, in which treatments of standard and reduced AA densities
were used. Starter diets were fed as crumbles and differed only in AA density. Grower and
finisher diets varying in AA density were manufactured to consist of approximately 80% pellets

iv
and 20% fines, of which calculated portions were ground to create three treatments varying in P:F
(80:20; 65:35; and 50:50) for each AA density. Overall results showed that broilers fed the
standard AA dense diet exhibited superior live weight gain (LWG) and feed conversion ratio
(FCR) compared to birds fed the reduced AA density diet. Due to an unexpected health challenge,
it is possible that E. coli infection negated performance benefits common to improved PQ in this
experiment. A third study was conducted independently of the two previously mentioned studies,
in which a method was developed for characterizing turkey breast meat. Growing demand for
poultry products has put pressure on nutritionists, breeders, and growers to increase the growth
potential of birds. Increased growth rate has contributed to higher yields and improved feed
efficiency at the expense of meat quality parameters associated with muscle myopathies. The
turkey industry specifically has experienced an increase in the prevalence of pale, soft, and
exudative (PSE) meat. Thus, two Exp were conducted to establish a method for monitoring breast
meat quality attributes of various tom turkey strains. Three commercially available strains (A, B,
and C) were harvested at 17 weeks of age to examine left and right pectoralis major muscles for
Exp1. Color, cook yield, and Warner-Bratzler shear (WBS) force were analyzed in this
experiment. In Exp2, two commercially available strains and two experimental strains of tom
turkeys (A and B, and D and E, respectively) were harvested at 17 weeks of age. Additional
analyses performed for this experiment included pH and drip loss determination. Harvesting and
sample preparation methods were similar for each Exp. Correlations among L* value and other
meat quality parameters were apparent in both Exp. Results also suggested that meat quality may
be affected by strain. This methodology for breast muscle characterization may be appropriate for
establishing baseline values for meat quality attributes that may be used to monitor the onset of
PSE in future generations of commercial turkeys.

v
TABLE OF CONTENTS
LIST OF FIGURES ................................................................................................................. viii
LIST OF TABLES ................................................................................................................... ix
ABBREVIATIONS ................................................................................................................. xi
ACKNOWLEDGEMENTS ..................................................................................................... xii
Chapter 1 LITERATURE REVIEW ....................................................................................... 1
PELLET QUALITY ........................................................................................................ 1 Performance Benefits ............................................................................................... 1 Factors Affecting Pellet Quality ............................................................................... 3 Assessment of Pellet Quality .................................................................................... 6
FEED PARTICLE AND NUTRIENT SEGREGATION ................................................ 8 Mash Feed ................................................................................................................ 9 Pelleted Feed ............................................................................................................ 10
MUSCLE GROWTH AND POULTRY MEAT QUALITY ........................................... 12 Color and pH ............................................................................................................ 13 Water-Holding Capacity .......................................................................................... 15 Texture ..................................................................................................................... 16 PSE-Like Conditions ................................................................................................ 18
REFERENCES................................................................................................................. 19
Chapter 2 EFFECTS OF PELLET QUALITY TO ON-FARM NUTRIENT
SEGREGATION IN COMMERCIAL BROILER HOUSES VARYING IN FEED
LINE LENGTH ................................................................................................................ 29
ABSTRACT ..................................................................................................................... 29 INTRODUCTION ........................................................................................................... 30 MATERIALS AND METHODS ..................................................................................... 32
Experimental Design ................................................................................................ 32 Experimental Diet Preparations ............................................................................... 33 152-m Feed Lines: Feed Sampling Procedure ......................................................... 34 76-m Feed Lines: Feed Sampling Procedure ........................................................... 35 Feed Sample Analysis .............................................................................................. 35 Statistical Analysis ................................................................................................... 36
RESULTS AND DISCUSSION ...................................................................................... 37 Experiment 1 (PPQ-152m) ....................................................................................... 37 Experiment 2 (IPQ-152m) ........................................................................................ 38 Experiment 3 (PPQ-76m) ......................................................................................... 39 Experiment 4 (IPQ-76m) .......................................................................................... 40
Pellet Quality and Feed Line Length Means ............................................................ 41 Pellet Quality Means in 152-m Feed Lines ...................................................... 41 Pellet Quality Means in 76-m Feed Lines ........................................................ 42

vi
Feed Line Length Means Using Poor Pellet Quality Feed ............................... 43 Feed Line Length Means Using Improved Pellet Quality Feed ....................... 43
CONCLUSIONS .............................................................................................................. 44 ACKNOWLEDGEMENTS ............................................................................................. 44 REFERENCES................................................................................................................. 44
Chapter 3 EFFECTS OF AMINO ACID DENSITY AND PELLET QUALITY ON
BROILER PERFORMANCE AND CARCASS CHARACTERISTICS ........................ 62
ABSTRACT ..................................................................................................................... 62 INTRODUCTION ........................................................................................................... 63 MATERIALS AND METHODS ..................................................................................... 65
Diet Compositions and Feed Manufacturing............................................................ 65 Bird Husbandry ........................................................................................................ 66 Measurements .......................................................................................................... 67 Statistical Analysis ................................................................................................... 67
RESULTS AND DISCUSSION ...................................................................................... 68 Starter Phase (d0-14) ................................................................................................ 68 Grower Phase (d14-28) ............................................................................................ 68 Finisher Phase (d28-42) ........................................................................................... 69 Overall Performance Data (d0-42) ........................................................................... 71 Processing (d43) ....................................................................................................... 72
CONCLUSIONS .............................................................................................................. 73 ACKNOWLEDGEMENTS ............................................................................................. 73 REFERENCES................................................................................................................. 73
Chapter 4 A METHOD FOR CHARACTERIZING TURKEY BREAST MUSCLE
USING INSTRUMENTAL QUALITY MEASUREMENTS ......................................... 87
ABSTRACT ..................................................................................................................... 87 INTRODUCTION ........................................................................................................... 88 MATERIALS AND METHODS ..................................................................................... 90
Experiment 1 ............................................................................................................ 90
Sample Preparation ........................................................................................... 89 Color Measurements ......................................................................................... 90 Cook Yield ....................................................................................................... 90 Warner-Bratzler Shear Force ............................................................................ 91 Experiment 2 ............................................................................................................ 92
Sample Preparation ........................................................................................... 91 pH ..................................................................................................................... 92
Drip Loss .......................................................................................................... 92
STATISTICAL ANALYSIS ............................................................................................ 94 RESULTS AND DISCUSSION ...................................................................................... 94
Experiment 1 ............................................................................................................ 94
Experiment 2 ............................................................................................................ 95
CONCLUSIONS .............................................................................................................. 97 REFERENCES................................................................................................................. 97

vii
Chapter 5 CONCLUSIONS AND FUTURE WORK ............................................................. 110

viii
LIST OF FIGURES
Figure 2-1: Diagram of replicate feed line regions at each farm. Commercial houses at
farm 1 consisted of four 152-m-long feed lines equipped with 192 feed pans per line.
Eight regions were created in order to define nutrient segregation. Each region
consisted of 24 feed pans, with region 1 starting at the feed hopper and region 8
ending at the feed line motor. In the diagram, a single feed pan represents six feed
pans. The 152-m-long commercial house at farm 2 consisted of two rows of split
(middle house fed) feed lines, creating four 76-m-long feed lines with 95 feed pans
per line. Feed was augered into centrally located feed hoppers and pulled to either
end of the house. Each region consisted of 12 feed pans, once again with region 1
starting at the feed hopper and region 8 ending at the feed line motor. Arrows
indicate feed flow direction at each farm. ........................................................................ 50
Figure 2-2: Descriptive depiction of percentage of pellets in feed pans across 152-m feed
lines. Percentage of pellets was determined using a modified particle size
separator (Modified Penn State Particle Separator, Agricultural and Biological
Engineering Department, University Park, PA) fitted with a No. 5 American Society
for Testing and Materials screen. For each experiment, the percentage of pellets in
feed pans across the 152-m feed line have been fitted with trendlines to describe
general feed flow trends. .................................................................................................. 52
Figure 2-3: Descriptive depiction of percentage of pellets in feed pans across 76-m feed
lines. Percentage of pellets was determined using a modified particle size
separator (Modified Penn State Particle Separator, Agricultural and Biological
Engineering Department, University Park, PA) fitted with a No. 5 American Society
for Testing and Materials screen. For each experiment, the percentage of pellets in
feed pans across the 76-m feed line have been fitted with trendlines to describe
general feed flow trends ................................................................................................... 53
Figure 4-1: The relationship between L* value and Warner-Bratzler shear value of
turkey breast meat from experiment 1 (WBS value = 69.104 – 0.932* L* value;
R2=0.179; P=0.003). The regression line represents raw data. ........................................ 104
Figure 4-2: The relationship between L* value and pH value of turkey breast meat from
experiment 2 (pH = 7.0356 – 0.023* L* value; R2=0.2166; P=0.001). The regression
line represents raw data. ................................................................................................... 107
Figure 4-3: The relationship between L* value and cook yield of turkey breast meat from
experiment 2 (cook yield = 89.164 – 0.3436* L* value; R2=0.1635; P=0.004). The
regression line represents raw data. ................................................................................. 108

ix
LIST OF TABLES
Table 2-1: Descriptive feed quality analysis of broiler finisher feed ...................................... 51
Table 2-2: Effects of PPQ feed on nutrient segregation across eight regions of a 152-m
feed line (Exp1 PPQ-152m). ............................................................................................ 54
Table 2-3: Effects of IPQ feed on nutrient segregation across eight regions of a 152-m
feed line (Exp2 IPQ-152m) .............................................................................................. 55
Table 2-4: Effects of PPQ feed on nutrient segregation across eight regions of a 76-m
feed line (Exp3 PPQ-76m). .............................................................................................. 56
Table 2-5: Effects of IPQ feed on nutrient segregation across eight regions of a 76-m
feed line (Exp4 IPQ-76m) ................................................................................................ 57
Table 2-6: Pellet quality means after augering feed through a 152-m feed line. .................... 58
Table 2-7: Pellet quality means after augering feed through a 76-m feed line ....................... 59
Table 2-8: Feed line length means using PPQ feed. ............................................................... 60
Table 2-9: Feed line length means using IPQ feed. ................................................................ 61
Table 3-1: Experimental diet compositions for starter, grower, and finisher periods.. ........... 78
Table 3-2: Analyzed nutrients for experimental diets. ............................................................ 80
Table 3-3: Descriptive feed quality analysis of experimental diets.. ...................................... 81
Table 3-4: Influence of amino acid density and pellet quality on broiler performance, d
0-14 data. .......................................................................................................................... 82
Table 3-5: Influence of amino acid density and pellet quality on broiler performance, d
14-28 data.. ....................................................................................................................... 83
Table 3-6: Influence of amino acid density and pellet quality on broiler performance, d
28-42 data.. ....................................................................................................................... 84
Table 3-7: Influence of amino acid density and pellet quality on broiler performance,
overall performance data (d 0-42).. .................................................................................. 85
Table 3-8: Influence of amino acid density and pellet quality on d 43 broiler processing
parameters performance... ................................................................................................ 86
Table 4-1: Instrumental meat quality parameters of breast muscle from three tom turkey
strains harvested at 17 weeks of age (Exp 1)... ................................................................ 102

x
Table 4-2: Correlation coefficients between L*, a*, and b* values, cook yield, and WBS
values of breast meat from three tom turkey strains (Exp 1)... ........................................ 103
Table 4-3: Instrumental meat quality parameters of breast muscle from four tom turkey
strains harvested at 17 weeks of age (Exp 2)... ................................................................ 105
Table 4-4: Correlation coefficients between L*, a*, and b* values, pH, drip loss, cook
yield, and WBS values of breast meat from four tom turkey strains (Exp 2)... ............... 106
Table 4-5: Average values for various meat quality parameters specific to tom turkey
strain. ................................................................................................................................ 109

xi
ABBREVIATIONS
µm = Microns
AA = Amino acid
BW = Body weight
BWG = Body weight gain
C = Celsius
CV = Coefficient of variation
FCR = Feed conversion ratio, corrected for mortality
FI = Feed intake
g = Gram
IPQ = Improved pellet quality
kg = Kilogram
LWG = Live weight gain
m = Meter
mPDI = Modified pellet durability index
NHPT = New Holmen pellet tester
P:F = Pellet-to-fine ratio
PDI = Pellet durability index
PPQ = Poor pellet quality
PQ = Pellet quality
PSE = Pale, soft, and exudative
RPM = Revolutions per minute
WBS = Warner-Bratzler shear
WHC = Water-holding capacity

xii
ACKNOWLEDGEMENTS
I would first like to thank my advisor, Dr. John Boney, for being a great mentor and
presenting me with such an amazing opportunity. The guidance, valuable advice, and effort
invested did not go unnoticed. I would also like to express my appreciation for Dr. Mills and Dr.
Patterson for being valuable members of my committee and for sharing their knowledge with me.
To my lab mates Logan and Alyssa, you both made the long, laborious workdays bearable. Thank
you for the laughs and for being some of the most hard-working people I know. A special thanks
to Stephanie, the designated “lab mom”, who helped the lab stay on track when we were
performing multiple studies at once. I also greatly appreciate the help of the undergraduate team
members for the long hours of weighing birds and mixing feed. On that same note, I must thank
the farm crew at the poultry facility for assisting in the set-up and tear-down of each project. Last
but certainly not least, I would like to thank my parents and grandparents for being supportive in
everything I do. The unconditional love and support I receive makes me believe that anything is
possible.

1
Chapter 1
LITERATURE REVIEW
PELLET QUALITY
Feed costs account for a majority (60-70%) of the total expenses associated with broiler
production (Behnke, 1996). Furthermore, feed ingredients contribute to 70-90% of the cost of
feed production (Jones, 1989). Modern commercial broilers are fed predominately pelleted diets,
and although further processing of the feed involves added expenses, pelleting provides an
opportunity to improve broiler performance (Behnke, 1994). Pelleting has been developed to
improve nutrient utilization while also meeting customer expectations. The feed manufacturing
process involves combining ingredients via batching, mixing, grinding, steam-conditioning,
pelleting, cooling, and bagging (Abdollahi et al., 2012). The pelleting procedure is defined as the
agglomeration of smaller particles into larger particles by mechanical means combining heat,
moisture, and pressure (Abdollahi et al., 2012). Once ingredients are ground and mixed, the mash
is conditioned by applying controlled amounts of steam. The conditioned mash is then extruded
through a pellet die where the hot pellets then pass through a cooler/dryer device. The finished
product is packaged and transported to commercial poultry facilities.
Performance Benefits
Providing broilers with pelleted feed is associated with a variety of enhanced
performance metrics that are well documented in the literature. Improvements in growth and feed
efficiency for birds fed pelleted feed compared to mash was described by Patton and colleagues

2
in 1937 (Patton et al., 1937). Jensen et al. (1962) further defined the benefits of pelleting,
concluding that pellet-fed chickens and poults spent significantly less time and energy ingesting
feed compared to those fed mash. Hussar and Robblee (1962) concluded that chicks consumed
15% more feed and gained 25% more weight when fed a pelleted ration compared to those fed
the same ration in mash form. Researchers at this time believed that improved bird performance
due to pelleting was caused by the increase in density of the feed, allowing for greater feed intake
(Hussar and Robblee., 1962). However, Lindblad et al. (1955) observed an increase in the growth
rate of chicks fed pelleted diets without increased feed consumption. In 1994, Behnke outlined
several pelleting attributes that may contribute to bird performance, such as decreased feed
wastage, destruction of pathogenic organisms, improved palatability, and decreased apprehension
energy expenditure.
Simply providing pelleted feed is not enough to ensure enhanced bird performance; the
quality of the pellets must also be considered. Pellet quality (PQ) can be improved by simply
limiting the amount of fines present in the feed, which can be done by employing feed
manufacturing techniques that create more durable pellets. Proudfoot and Sefton (1978) reported
a reduction in body weight, reduced feed consumption, inferior feed efficiency, and lower
monetary returns for birds fed 100% fines compared to those fed a diet containing 45% fines
during the finisher phase. Mckinney and Tetter (2004) studied the effects of varying PQ as a non-
nutritive variable and concluded that improved PQ reduces bird energy expenditure. This study
indicates that PQ improvements provide an effective caloric value. More recently, Corzo et al.
(2011) observed decreased feed intake (FI), improved feed efficiency, and maintained live weight
gain (LWG) when feeding broilers 64% pellets compared to feeding 32% pellets. Conversely,
Lilly and coauthors (2011) demonstrated that increased pellet-to-fine ratios (P:F) increased FI and
LWG and had little effect on decreasing feed conversion ratio (FCR). This research provides
poultry integrators justification for adopting feed manufacturing techniques that improve PQ.

3
Factors Affecting Pellet Quality
Diet formulation is considered one of the most important factors that influences PQ
(Behnke, 2001; Reimer, 1992). Zarate et al. (2004) investigated this idea by studying the
differences in PQ among diets formulated with different corn types. They concluded that diets
with waxy corn and high-oil corn exhibited improved PQ compared to dent corn. Van Rooy
(1986) and Wilson (1994) explained that pellet durability and hardness are influenced by
ingredient composition of the diet, which is likely due to the changes that the ingredients may
undergo when they are subjected to physical shear and compression during the pelleting process.
The magnitude of these changes increases with conditioning temperature prior to pelleting, and
the pelleting process itself (Thomas et al., 1998).
Fat is a dietary ingredient that can also affect PQ. Fat addition can reduce the friction
between the pellet die holes and the mash ingredients, decreasing compressional forces made
upon the feed particles inside the die holes (Kulig and Laskowski., 2008). McKinney et al. (2001)
found that the amount of pellets in a feed decreased from 900 g/kg to 490 g/kg of feed as fat
inclusion increased from 0 g/kg to 50 g/kg of feed. In a similar study, Muramatsu and cohorts
(2013) created four dietary treatments varying in fat inclusion (15, 25, 35, and 45 g/kg of feed)
and found that the amount of pellets decreased as fat inclusion surpassed 35 g/kg of feed, and
pellet durability index (PDI) decreased as fat inclusion levels exceeded 15 g/kg of feed. It should
be noted that both studies added dietary fat to the mixer prior to pelleting. A review article by
Loar and Corzo (2011) emphasized that adding a percentage of dietary fat post-pelleting can lead
to improvements in physical PQ. A popular practice in feed manufacture is the application of
dietary fat post-pelleting, resulting in a decrease in fat added at the mixer.
Added fat can also influence the properties of other feed constituents. For example,
inhibition of starch gelatinization may occur in the presence of lipids (Wood, 1987; Briggs et al.,

4
1999). Starch gelatinization is a reaction in feed manufacturing that is known to improve PQ
(Briggs et al., 1999). Starch is able to be modified pre-manufacturing, in which it is included in
the diet as pre-gelatinized starch. It can also be manipulated during the feed manufacturing
process when steam is injected into the feed at the conditioner (Briggs et al., 1999). Wood (1987)
showed that as the amount of pre-gelatinized starch in the diet increases, as does PQ.
Furthermore, Wood investigated the impact of raw vs denatured protein and raw vs pregelatinized
starch on pellet durability and hardness. He found that rations containing 40% raw starch:60%
raw protein had an average PDI of 85, whereas rations containing 40% pregelatinized starch:60%
raw protein had an average PDI of 94 (Wood, 1987). Thus, the effect of pregelatinized starch was
more prominent with added denatured protein. In summary, this work highlights the importance
of considering the potential negative effects of feed ingredients on PQ when formulating broiler
diets.
Incorporating the use of binding agents is another strategy to improve PQ. This can be as
simple as adding water at the mixer. Enhanced pellet durability achieved by increasing the
moisture content of the feed is well documented (Fairchild and Greer, 1999; Moritz et al., 2001;
Moritz et al., 2002; Lundblad et al., 2009). Notably, water addition is associated with lubricating
effects that may decrease the frictional heat generated inside the die holes, decreasing starch
gelatinization. Moritz et al. (2003) observed decreased starch gelatinization and increased pellet
durability when water was added to a maize-based broiler diet. An explanation for the improved
PQ in diets where water is added at the mixer could be due to better moisture penetration to the
starch granules, resulting in a lower and more even starch gelatinization throughout the pellet
(Moritz et al., 2003). However, starch gelatinization is not the main factor for determining PQ.
Lundblad et al. (2009) reported that adding 120 g water/kg at the mixer increased PDI and
modified pellet durability index (mDPI) by 10% in barley-based diets. Conversely, Hott and
cohorts (2008) found no effect of moisture addition on the PDI of broiler diets manufactured at a

5
pilot feed mill. Although research supports PQ improvements with moisture addition, the
negative effects produced from high levels of water addition such as nutrient dilution and mold
spore proliferation must also be considered.
Steam-conditioning is a major factor in the pelleting process and can be manipulated to
improve PQ. Bartikoski (1962) stated that using steam to add moisture and heat to mash
improved PQ and increased production rate. In a review on criteria for PQ, Thomas and Van der
Poel (1996) explained that proper agglomeration of nutrients and high PQ are achieved by using
high steam-conditioning temperatures. Heat application during conditioning may aid in the
destruction of pathogens and anti-nutritive factors found in certain feedstuffs. However, nutrient
availability and enzyme activity may be compromised when increasing steam-conditioning
temperature above a certain threshold. Skoch and collogues (1981) concluded that increased
steam-conditioning reduced mechanical friction of the pellet die as well as electrical energy
consumption, and improved pellet durability. However, they discovered that pelleting with steam
at 80°C compared to 65°C increased total energy consumption at the mill. Throughput and pellet
durability improvements may justify the use of additional energy usage. Loar et al. (2014)
improved PQ by increasing steam conditioning temperatures from 74°C to 85°C and from 74°C
to 96°C. However, a 2.5% decreased in methionine digestibility was observed when conditioning
temperatures surpassed 74°C. Cutlip and colleagues (2008) examined the effects of varying
steam-conditioning temperatures on broiler performance and found that broilers fed pelleted diets
conditioned at 93.3˚C demonstrated decreased FI, similar LWG, and a 20-point improvement in
FCR compared to broilers fed pelleted feed conditioned at 82.2˚C. These authors attributed these
results to the increased PDI and mPDI of the diet steam conditioned at 93.3˚C. Additional
research performed by Mortiz et al. (2003) revealed that feeding broilers pelleted diets differing
by 4 percentage points in PDI improved FCR by 2 points and maintained LWG. This work
suggests that performance benefits associated with feeding pellets are enhanced when PQ is

6
increased, which can be accomplished using optimal steam-conditioning temperature. Though
many individuals question whether the benefits of using pelleted feed justifies the additional costs
associated with pellet production, researchers believe that the cost is offset by improved animal
performance. The challenge of improving profitability in the broiler industry is understanding the
relationship between feed manufacturing strategies, PQ, and nutrient availability.
Assessment of Pellet Quality
The physical quality of pellets is important for a variety of reasons. Thomas et al. (1998)
reasoned that pellets must have some standard of durability and hardness in order to withstand
agitation via transport. Pellets of high physical quality are said to contribute to improved bird
performance parameters. This statement is supported by the work of Dozier et al. (2010) who
discovered that broilers fed high-quality pellets (88% PDI) had greater cumulative BWG and
consumed more feed than bird fed low-quality pellets (66% PDI).
Pellet quality can be defined as the ability for pellets to endure attrition during bagging,
storage, and transport without breaking down and to be presented to birds in commercial facilities
without creating a high amount of fines (Thomas and Van der Poel, 1996). Fragmentation and
abrasion are two forces by which pellets can be degraded (Thomas and Van der Poel, 1996).
Ultimately, PQ can be measured using several methods. Indirect testing methods allow feed
manufacturers to predict PQ and modify pellet production accordingly (Thomas and Van der
Poel, 1996). One of the first indirect methods used to test pellets in the feed industry was the use
of the Stokes® Tablet Hardness Tester (McCormick and Shellenberger, 1960). This machine was
initially used to test the strength of drug tablets. This test, however, does not subject the pellet to
conditions that would occur in the mill, and the amount of force used by the machine was not
always accurate.

7
To oppose the drawbacks of the Tablet Hardness Tester, Pfost et al. (1962) performed
several experiments in order to develop a standard method and equipment for analyzing PQ. A
tumble box model was used in which a 500-g pellet sample was tumbled for 10 minutes with a
rotating speed of 50 revolutions per minutes (RPM). These specifications produced the most
accurate and consistent results. This work ultimately led to the development of the system and
methods described in ASAE Standard S269.4: Cubes, Pellets, and Crumbles: Definitions and
Methods for Determining Density, Durability, and Moisture Content (ASAE, 1997). This method
allows for PDI determination, expressed as the percentage of intact pellets that remain after a
sample has been tumbled and sifted. Some researchers have modified the standard PDI method by
adding items to the tumble box compartments to create rougher handling conditions that may
better represent a company’s feed manufacturing and delivery processes. Cavalcanti and Behnke
(2005) added five hex nuts to the chambers and found that modified PDI (mPDI) was more
sensitive to higher levels of fat compared to standard PDI.
The Holmen pellet tester was developed in England for those who performed pellet
durability tests on a regular basis (Thomas and Van der Poel, 1996). This machine subjects a 100-
g pellet sample to an air stream for 30 seconds and up to 2 minutes if desired. This causes the
pellets to undergo impact and shear forces due to the pneumatic conveyance of the machine. The
fines are automatically removed through the perforated screen, so sifting the sample afterwards is
not necessary. Updated versions of the Holmen pellet tester have been manufactured by TekPro
(Norfolk, GBR) and are currently used in the United States. These New Holmen pellet tester
(NHPT) devices are more portable, and the tests are faster compared to the tumble box.
There is little research comparing the machines used to determine pellet durability.
However, there are some data comparing the original models of the NHPT and tumbling box
devices. In 1990, McKee reported a linear decrease in durability using the Holmen durability
tester, ranging from 95% to 50% with increasing testing time up to 5 minutes (McKee, 1990).

8
After testing the Pfost tumbling can, McKee described a curvilinear decrease in durability,
ranging from 98% to 91% with increasing time up to 20 minutes. These results indicate that the
Holmen machine provides a wider range of values in a shorter duration compared to the Pfost
tumbling can. Winowiski (1998) compared the original Holmen machine to the NHPT and tumble
box machines. Data revealed that the NHPT correlated well with the tumble box method and the
original Holmen machine, but it was evident that the NHPT was more destructive compared to
the standard or modified PDI tests (Winowski, 1998). Additional research investigating the
accuracy and repeatability of the NHPT and tumble box devices using a variety of PQ to compare
the two methods is merited.
FEED PARTICLE AND NUTRIENT SEGREGATION
Segregation of feed particles may occur at the feed mill, during transportation, within
feed bins, and across feed lines during feed augering (Moritz, 2013). Because various feed
particles in a complete diet may differ in terms of nutrient composition, nutrient segregation is
said to follow feed particle segregation. This phenomenon may lead to an uneven distribution of
nutrients to birds in commercial facilities, which can ultimately affect overall flock performance.
The degree of nutrient segregation, however, may be affected by feed form and feed quality.
Diet uniformity is an important aspect of feed production, and management of ingredient
distribution begins at the feed mill by measuring mixer coefficient of variation (CV) (Wilcox and
Balding, 1986; Beumer, 1991). Ensminger et al. (1990) highlighted the importance of providing a
well-balanced diet early on by explaining that it is necessary to have the appropriate quantity of
essential nutrients in a small ration because chicks only consume a few grams of feed each day.
Diet uniformity can be measured by using an ingredient marker (synthetic amino acids, added
enzymes etc.) and determining if its distribution throughout the feed indicates adequate mixing

9
(Eisenberg, 1992). A CV of 10% is an acceptable level of variation that distinguishes uniform
from nonuniform mixes. Wicker and Poole (1991) investigated the influence of mix time on
nutrient uniformity by mixing a 5-ton batch of feed in a typical 5-ton mixer at different times
using methionine as a marker. These researchers found that CV improved dramatically from
34.6% to 2.6% when mix time was increased. The effect of mix uniformity on broiler
performance was evaluated by McCoy et al. (1994), who reported an increase in average daily
gain (ADG), average daily feed intake (ADFI), and gain:feed during the grower phase as mix
time increased. This research supports the improvement of diet uniformity and subsequent bird
performance when increasing mix time but does not consider how nutrients segregate after the
feed leaves the feed mill.
Mash Feed
Mash feed is commonly produced for use in the laying hen industry due to its
manufacturing simplicity and economics. However, mash is composed of a wide range of particle
sizes that could segregate. Particle segregation can be defined as larger particles separating from
smaller particles in a complete feed mixture. The particle size variation observed in mash diets is
due to the types of ingredients used, specifically cereal grains, and the feed manufacturing
methods used to produce the complete feed. When determining the influence of particle size on
bird performance, particle size uniformity must also be recognized. This is important to note
because chickens are known to preferentially select larger feed particles compared to smaller ones
(Schiffman, 1998). A diet that is more uniform in terms of feed particle sizes may reduce the time
and energy spent selecting larger particles. A more uniform diet may can also contribute to
enhancements in bird performance. Nir and coauthors (1994) have shown that diets with lower
geometric standard deviation (GSD) resulted in improved weight gain and feed efficiency in birds

10
fed maize-soybean mash diets. However, Deaton et al. (1989) compared the performance of
laying hens fed various particle sizes of ground corn and observed no effect on hen performance
over 3 consecutive trials. Compared to pelleted or crumbled diets, data explicitly suggests that
grain particle size is more variable in mash feed and elicits more sorting/preferential selection of
larger particles by the bird. Should nutrients segregate in mash feed, bird sorting may lead to
selection of feed particles that do not contain the proper concentrations of necessary nutrients.
The literature is saturated with data on the effect of feed particle size in mash diets on
bird performance. However, little work has been conducted to determine how mash feed particles
segregate in commercial facilities and moreover, how segregation affects bird performance and
flock uniformity. It has been suggested that mash feed is more prone to nutrient segregation
compared to pelleted feed (Scheideler, 1991). A study conducted by Tang and cohorts (2006)
determined the effect of feed trough delivery systems on feed particle segregation, nutrient
composition, and subsequent hen performance and egg quality parameters. The results indicated
that particle sizes below 1,180 µm percolated to the bottom of the feed trough and contained
greater concentrations of nutrients than larger feed particles. As a result, birds preferentially
selected the larger particles early on, which impacted nutritional intake (Tang et al., 2006). Based
on these results, considerations for reducing the size distribution of feed particles within a mash
diet should be made to minimize particle size segregation and consequent adverse effects on bird
performance.
Pelleted Feed
Compared to mash feed, there is less opportunity for selection and segregation of
different sized particles in pelleted feed (Jones et al., 1995). There is data that suggests that
offering crumbled or pelleted feed reduces any effect of ingredient particle size on bird
11
performance. However, some researchers believe that once the pellet enters the crop and
dissolves after consumption, the effect of ingredient particle size may be upheld even after
pelleting (Nir et al., 1995). Reece et al. (1986) found no significant effect on bird performance
when formulating broiler starter crumble diets using maize of differing particle sizes. Peron and
coauthors (2005) also found no effect on broiler performance when feeding pelleted diets
differing in wheat particle size (380 µm vs 955 µm). In contrast, Lott et al. (1992) found that
broilers fed pelleted diets made from fine ground maize (679 µm) exhibited significantly higher
weight gain and improved feed efficiency at 21 days of age compared to broilers fed pelleted
diets made with coarse ground maize (1,196 µm). Contradictory research reveals that the effect of
different grain particle sizes in pelleted diets have on bird performance may be depend on
changes in size distribution of grain types and cultivators after pelleting.
Feed transport and augering devices contribute to pellet degradation and consequently
nutrient segregation. Researchers from Kansas State University found that feed fines increased
from 9% to 14% to 20% from the pellet mill to the fat coater and then going into the bulk truck,
respectively (Jong, 2015). Scheideler (1991) was the first to investigate nutrient segregation in
commercial facilities and found that the average percentage of pellets decreased from 66.6% to
32.9% when comparing feed samples from a commercial feed mill and feed pans within
commercial poultry houses, respectively. Nutrient analysis from these samples showed that
pellets contained greater concentrations of protein and ash and lower concentrations of fat when
compared to fines samples (Scheideler, 1991).
The quality of pelleted feed becomes an important factor when considering mechanical
handling of the feed. More durable pellets should be able to better withstand attrition caused by
mechanical handling. Pellets that are less durable will break down more easily while traveling
within feed lines, causing an imbalanced distribution of feed particles. As a result, birds located in
different parts of the house may be presented feed differing in pellet-to-fine ratios (P:F), which

12
can ultimately affect growth rates and flock uniformity. This problem would likely be
exacerbated in facilities that utilize migration fences, limiting feed access to specific locations of
the feed line.
Recent studies mentioned earlier have determined the effects of feeding diets differing in
P:F to broilers (Proudfoot and Sefton, 1978; McKinney and Teeter, 2004; Corzo et al., 2011;
Lilly et al., 2011). Overall, it can be concluded that increasing the percentage of pellets in the diet
improves bird performance. Other studies have found that some feed ingredients/additives are
more concentrated in the fines when applied post-pelleting. Research conducted by West Virginia
University compared pellets and fines samples when phytase was applied post-pelleting and
found that the pellets contained 160 FTU/kg of phytase while the fines contained 860 FTU/kg of
phytase (Moritz, 2013). This data is supported by a recent study conducted by Sellers et al. (2020)
who investigated the effect of feed augering on nutrient segregation and subsequent broiler
performance and reported higher levels of phytase in feed pans with an increased percentage of
fines. These authors speculate that when phytase is applied post-pelleting it sloughs off the
outside of the pellet due to pellet deterioration, allowing phytase to segregate into the fines. Thus,
the amount of phytase that birds ingest may be dependent on feed pan location. This may lead to
discrepancies in flock body weight uniformity due to birds consuming different levels of phytase.
Overall, the degree of nutrient segregation may be influenced by feed form due to the variation in
different particle sizes of the feed. More work is needed to better understand nutrient segregation
and its effect on bird performance.
MUSCLE GROWTH AND POULTRY MEAT QUALITY
A remarkable change in the production of broiler chickens has been achieved via
extensive genetic selection for specific quantitative traits. Compared to broiler chickens marketed

13
in the 1940s, the modern broiler exhibits dramatically increased growth rate and efficiency
(Sherwood, 1977; Marks, 1979; Havenstein et al., 2003). Consumer preferences coupled with the
increased production of broilers are likely to be factors contributing to the higher per capita
consumption of chicken meat between 1960 (10.70 kg) and 2019 (43.14 kg; National Chicken
Council). However, the increase in growth and development of commercial poultry has resulted
in unintended effects, including an increased incidence of skeletal defects (Wise, 1970; Lilburn,
1994), metabolic alterations (Greenlees et al., 1989; Olkowski, 2007), and changes in skeletal
muscle development (Jacobson et al., 1969; Halvorson and Jacobson, 1970).
Researchers have identified the breast muscle as a target for meat technology research
due to its leanness and preference by consumers compared to other cuts. The growth of the
pectoralis major has increased at a rate faster than that of BW. Changes in genetic parameters
along with modern processing practices have led to the appearance of various abnormalities in
chicken breast muscle, such as white striping, PSE-like conditions, and wooden breast syndrome.
Such abnormalities contribute to quality issues such as undesirable color and texture, which are
critical meat quality attributes that are important to consumers.
Color and pH
Conforth (1995) explained that color is the most important attribute by which retailers
and consumers determine the meat quality or product acceptability. Appearance concerns can also
be a reason for product rejection at the processing plant prior to human consumption. In the past,
researchers have examined problems associated with red or pink color in uncooked and cooked
poultry meat (Froning and Hartung, 1967; Froning et al., 1968). More recently, incidences of pale
processed poultry breast tissue have been reported. Van Hoof (1979) and Barbut (1993) suggested
that the pectoralis major of chickens and turkeys can exhibit the same pale, soft, and exudative

14
(PSE) characteristics as seen in the pork industry. Until recently, it was thought that meat quality
defects in poultry meat were due to genetics, sex, and environmental factors. Researchers have
now attributed post-mortem biochemical changes in the bird during processing for the effects of
color and other meat quality attributes. Khan (1971) and Van Hoof (1979) studied post-mortem
glycolysis in poultry muscle and indicated that various stressors before and after slaughter can
contribute to variations in the rate of rigor mortis completion. Unlike the pork industry, the
poultry industry has yet to develop methods for evaluation of functional properties of raw meat.
The International Commission on Illumination (CIELAB) color measuring system has the
potential to provide fast color measurements that can evaluate meat quality in poultry. There are a
variety of color measuring instruments and spectrophotometers that support the CIELAB system.
This color space system expresses color as three values: L*, lightness, a*, redness, and b*,
yellowness. The poultry industry currently lacks evaluation tools that can separate poor quality
products from good quality products. Barbut (1993) suggested the use of color measuring devices
as a nondestructive means to monitor PSE occurrence in turkey meat. He found that the L* value
significantly correlated with pH, cooked gel strength, and cook loss. Because the measurement of
lightness is highly correlated with other functional meat properties it may be useful in identifying
PSE conditions in turkey flocks. Overall, color problems can be associated with bird age,
preslaughter stress, harvesting practices, additives, and other further processing parameters
(Froning, 1995). However, Barbut (2015) explains that the major factors influencing color inside
the muscle are myoglobin content, muscle fiber orientation, space between the muscle fibers, and
pH.
It is well documented that muscle pH and color are highly correlated. pH is normally
measured using a glass electrode at 24 hours postmortem or more. By 24 hours after slaughter the
pH should reach its final or ultimate value. A low ultimate pH is commonly associated with
higher lightness values. The reason for this interrelationship may be due to denaturation of

15
sarcoplasmic proteins (Bendall and Wismer-Pederson, 1962), enhanced reflectance from
myofibrils on the muscle surface (Hamm, 1961), and increased refraction through myofibrils
(Swatland, 2004). Muscle pH is also related to other meat quality attributes such as texture,
water-holding capacity, and cook loss (Fletcher, 1999). Upon the onset of rigor mortis, muscle
glycolysis switches to anaerobic metabolism, resulting in a buildup of lactic acid and subsequent
pH drop. The normal 24-hour postmortem muscle pH is 6.0-6.2 in poultry (Keeton and Osburn,
2010). The rate at which pH declines is an important factor for determining meat quality. A rapid
pH decline may lead to pH values that are close to the isoelectric point, negatively affecting meat
quality attributes. The isoelectric point is the pH at which molecules are electrically neutral and
affects the ability of muscle proteins to bind water, ultimately affecting water-holding capacity
(WHC) and texture (Miller, 2002).
Water-Holding Capacity
Water-holding capacity of meat is defined as the ability of raw muscle to retain water
when external pressures are applied (gravity, press force, and heating) (Aberle, 2001). This
functional property of meat is important as it affects both the yield and quality of the end product.
Belitz et al. (2004) explained that hydrophilic groups of proteins bind approximately 5% of the
water found in muscle, while the remaining 95% is held by capillary forces between the thick and
thin filaments. The meat’s ability to retain water is influenced by a number of factors.
Accelerated pH decline is a major factor related to WHC. A rapid decline in pH can result in a
low ultimate pH while the muscle is still warm, causing the denaturation of many proteins that
have water-binding capabilities. The stability of functional proteins in the meat are key in
influencing the moisture retention ability of the meat. Shrinkage of myofibrils and sarcomere
shortening can occur during the development of rigor mortis, leaving less space for water

16
(Diesburg et al., 1988). Researchers have revealed that drip loss can increase linearly as
sarcomere length within muscle cells decrease (Honikel, 1986).
A variety of methods exist for measuring WHC. These methods differ in terms of the
force applied to the sample. Free drip, bag drip (Penny, 1977; Honikel, 1986), cube drip, and
other related methods (Howard and Lowrie, 1956) apply no external force on the meat sample.
These methods can be time consuming but are still commonly used by researchers today.
Methods that apply mechanical forces include the use of a centrifuge (Wierbicki and Deatherage,
1958; Honikel and Hamm, 1987) and filter paper press (Grau and Hamm, 1957). Values obtained
from these methods are not directly comparable to the drip loss methods mentioned earlier. When
applying a mechanical force, a much greater amount of water is released as opposed to using
methods that apply no external force. Nonetheless, the methods used for measuring WHC are
dependent on the interest of researchers and the type of product that is being tested (fresh versus
processed).
Texture
Consumer satisfaction of poultry meat is ultimately dependent on texture. Tenderness can
be defined as the amount of force necessary to bite through a piece of meat (Coggins, 2012).
Fletcher (2003) described two major contributors to poultry meat tenderness as the state of
contractile units and the maturity of connective tissues. In the past, the contractile state of
myofibrillar proteins has not been a concern in terms of meat quality. However, due to a dramatic
increase in deboned meat in recent years, the concern of removing meat from the carcass prior to
rigor mortis completion has become a greater concern. This is because early deboning leads to
tougher meat due to induced sarcomere shortening (Stewart et al., 1984; Dawson et al., 1987;
Lyon and Lyon 1990). Muscles with shorter sarcomeres require a greater application of shear

17
force than those with longer sarcomeres (Kerth, 2013). Battula et al. (2008) revealed that the
force required to shear through cooked chicken breast, measured using a Warner-Bratzler shear
(WBS) device, increased with decreasing deboning times. Using a taste panel, Zhang and
coauthors (2020) found that consumers tended to prefer the texture of cooked breast meat that
was deboned at 24 hours postmortem compared to meat deboned less than 2 hours postmortem.
Although this research reveals that breast meat tenderness can be improved by increasing
deboning time, lengthening the meat aging process can be costly for processors due to throughput
demand. Therefore, researchers have examined electrical stimulation and marination to
potentially alleviate the negative impact of early deboning times on meat texture (Sams, 1990;
Lyon et al., 1998).
Machines that are commonly used for objective textural measurements of meat include
the WBS (Bratzler, 1932) and the Allo-Kramer compression-shear devices (Kramer et al., 1951).
Both tools measure the force it takes to shear through a given sample of meat. The WBS device
utilizes a single V-shaped blade and registers the maximum load necessary to shear through a
uniform core sample. Alternatively, the Allo-Kramer machine uses multiple blades to compress
and shear the sample. More recently, the use of the Meullenet-Owens Razor Shear (MORS) test
and instrumental Texture Profile Analysis (TPA) data has been used by various researchers (Lyon
et al., 2010). The MORS method is said to be more efficient for texture analysis of poultry meat
because it can be performed on intact muscle rather than small core samples (Lyon et al., 2010).
This machine utilizes a single razor blade that cuts the sample in four different locations in which
shear force and energy are reported. Alternatively, the TPA method is a compression test that is
able to analyze multiple textural attributes, such as hardness, springiness, cohesiveness, and
chewiness (Barbut, 2002; Lyon et al., 2010). When comparing the use of the TPA and WBS force
methods, research has suggested that the TPA data better explains and predicts sensory texture
(Caine et al., 2003; Huidobro et al., 2005).

18
Taste panels have been used in research studies for sensory analysis including textural
attributes. It has also been revealed that instrumental methods used for predicting tenderness can
correlate to sensory analysis from panelists (Lawrie and Ledward, 2014). Xiong et al. (2006)
found a high correlation between sensory results from a consumer-based taste panel and
instrumental results from the following methods: WBS test, Allo-Kramer shear test, and razor
blade method. A study conducted by Caine et al. (2003) revealed that correlations of sensory
assessment with WBS values of beef tenderness are variable (r values range from -0.32 to -0.94).
This variability is due to a multitude of factors including muscle type, cooking method, samples
preparation, shear apparatus, and panel type (consumer versus trained).
PSE-Like Conditions
There has been extensive work in the pork industry to study the problem of rapid post-
mortem pH decline, which is known to result in PSE-like meat. Several studies on the effect of
susceptible breeds, pre-slaughter stress and slaughtering methods which can increase the
incidence of PSE in pork have been published (Bendall and Swatland, 1988). The occurrence of
PSE-like conditions in turkeys has been suggested in the past (van Hoof, 1979), but was not
assessed until 15-20 years later. It has been stated that the pectoralis pH decline is faster in most
turkey muscle than the most severely pale, soft, and exudative porcine muscle (Addis, 1986).
Previous studies have indicated that various stresses and variations among birds can contribute to
a difference in the rate of postmortem glycolysis (Khan, 1971; Ma et al., 1971; van Hoof, 1979).
The time that it takes for the breast muscle to reach ultimate pH that is lower than normal is
thought to contribute to the poor quality of the meat. Sante et al. (1991) have reported that a high-
performance turkey variety exhibited a 1.4-fold faster postmortem pH decline than a slow
growing breed. Rapid postmortem glycolysis coupled with low pH due to lactic acid build up in

19
the muscle can negatively affect protein functionality, causing poor WHC (Shen et al., 2009;
Sams and McKee, 2010). These pathological alterations in the muscle may be aggravated by
stressful preslaughter conditions (Swatland, 1990; Sosnicki, 1993; Sosnicki et al., 1995). To
monitor this problem, Barbut (1993) proposed the use of a fast color measuring technique to
separate PSE meat from normal meat. Color measurements can be used to estimate the degree of
PSE-like conditions in turkey breast meat due to the high correlation between muscle pH and the
L* (lightness) value. Researchers have also described a positive correlation between muscle pH
and WHC (Judge et al., 1989; Barbut, 1996), and a negative correlation between L* values and
textural parameters of cooked turkey breast meat (Barbut 1993; Swatland and Barbut., 1995).
Breast muscle that is pale in color with poor WHC is characteristic of PSE conditions. In the
poultry industry, 5-40% of the total meat produced in a given processing plant may have
characteristics specific to PSE meat. In addition, a loss of $200 million to the turkey industry per
year is due to PSE conditions in further-processed products (Owens et al. 2009). Previous
research highlights the importance of establishing a method for characterizing breast tissue meat
quality in order to monitor PSE conditions in commercial turkey and broiler flocks.
REFERENCES
Abdollahi, M. R., V. Ravindran, T. J. Wester, G. Ravindran, and D. V. Thomas. 2012. Effect of
improved pellet quality from the addition of a pellet binder and/or moisture to a wheat-
based diet conditioned at two different temperatures on performance, apparent
metabolizable energy and ileal digestibility of starch and nitrogen in broilers. Anim. Feed
Sci. and Technol. 175:250-157.
Aberle, E. D., J. C. Forrest, D. E. Gerrard, E. W. Mills, H. B. Hedrick, M. D. Judge, and R. A.
Merkel. 2001. Principles of meat science. 4th ed. Kendall/Hunt Publishing Company,
Dubuque, IA.
Addis, P. B. 1986. Poultry muscle as food. Pages 371-404 in Muscle as Food. Acad. Press,
Athens, GA.

20
American Society of Agricultural Engineers, 1997. ASAE S269.4, Cubes, pellets, and
crumbles—Definitions and methods for determining density, durability, and moisture.
Standards 1997. Am. Soc. Agric. Eng., St. Joseph, MI. Because of use of a 5/32 × 1.25
in. die, pellets were sifted in a No. 6 American Society for Testing and Materials (ASTM)
screen. Five hundred grams of sifted pellets was placed in a dust-tight enclosure and
tumbled for 10 min at 50 rpm. The dimensions of the enclosure were as follows: 5 × 12 ×
12 in., with a 2 × 9 in. plate affixed diagonally along one of the 12 × 12 in. sides. The
tumbled samples were then sifted again [No. 6 (ASTM)] and weighed. The pellet
durability index was calculated by dividing the weight of pellets after tumbling by the
weight of pellets before tumbling then multiplying by 100. The modified pellet durability
index was determined in a similar manner with the exception of adding five hex nuts to
the pretumbled sample to obtain added pellet pressure.
Barbut, S. 1993. Colour measurements for evaluating the pale soft exudative (PSE) occurrence in
turkey meat. Food Res. Int. 26:39-43.
Barbut, S. 1996. Water and fat holding. Pages 187-225 in Methods of Testing Protein
Functionality. G.H. Hall, ed. Chapman & Hall, London.
Barbut, S. 2002. Measuring sensory and functional properties. Pages 467-511 in Poultry Products
Processing: An Industry Guide. CRC Press, Boca Raton, FL.
Barbut, S. 2015. The Science of Poultry and Meat Processing. Accessed Feb. 2016.
http://www.poultryandmeatprocessing.com/.
Bartikoski, R. 1962. The effect of steam on pellet durability. Pages 42-47 in Cost Reductions
Through In-Plant Production Controls. Feed Production School, Kansas City, MO.
Battula, V., M. W. Schilling, Y. Vizzier-Thaxton, J. M. Behrends, J. B. Williams, and T. B.
Schmidt. 2008. The effects of low-atmosphere stunning and deboning time on broiler
breast meat quality. Poult. Sci. 87:1202-1210.
Behnke, K. C. 1994. Factors affecting pellet quality. Pages 44-54 in Proc. Maryland Nutr. Conf.,
College Park, MD. Maryland Feed Ind. Counc. And Univ. College Park, MD.
Behnke, K. C. 1996. Feed manufacturing technology: Current issues and challenges. Anim. Feed
Sci. Technol. 62:49-57.
Behnke, K. C. 2001. Factors influencing pellet quality. Feed Tech. 5:19-22.
Belitz, H. D., W. Grosch, and P. Schieberle. 2004. Meat. Pages 566-618 in Food Chemistry.
Springer-Verlag, Germany.
Bendall, J. R. and H. J. Swatland. 1988. A review of the relationships of pH with physical aspects
of pork quality. Meat Sci. 24:85-126.

21
Bendall, J. R. and J. Wismer‐Pedersen. 1962. Some properties of the fibrillar proteins of normal
and watery pork muscle. J. Food Sci. 27:144-159.
Beumer, I. H. 1991. Quality assurance as a tool to reduce losses in animal feed production. Adv.
Feed Technol. 6:6-23.
Bratzler, L. J. 1949. Determining the tenderness of meat by use of the Warner-Bratzler method.
Proc. 2nd Reciprical Meat Conf., National Livestock and Meat Board, Chicago, IL.
Briggs, J. L., D. E. Maier, B. A. Watkins, and K. C. Behnke. 1999. Effects of ingredients and
processing parameters on pellet quality. Poult. Sci. 78:1464-1471.
Caine, W. R., J. L. Aalhus, D. R. Best, M. E. R. Dugan, and L. E. Jeremiah. 2003. Relationship
of texture profile analysis and Warner-Bratzler shear force with sensory characteristics of
beef rib steaks. Meat Sci. 64:333-339.
Cavalcanti, W. B., and K. C. Behnke. 2005. Effect of composition of feed model systems on pellet
quality: A mixture experimental approach. I. Cereal Chem. 82:455-461.
Coggins, P. C. 2012. Attributes of muscle foods: color, texture, flavor. Pages 35-44 in Handbook
of Meat, Poultry, and Seafood Quality. L. M. L. Nollet, ed. Wiley-Blackwell, Ames, IA.
Conforth, D. P. 1995. Color- its basis and importance. Pages 34-75 in Quality Attributes and 24
Their Measurement in: Meat, Poultry, and Fish Products: Advances in Meat Research. A.
M. Pearson, and T. R. Dutson eds. Springer, London.
Corzo, A., L. Mejia, and R. E. Loar II. 2011. Effect of pellet quality on various broiler production
parameters. J. Appl. Poult. Res. 20:68-74.
Cutlip, S. E., J. M. Hott, N. P. Buchanan, A. L. Rack, J. D. Latshaw, and J. S. Moritz. 2008. The
effect of steam-conditioning practices on pellet quality and growing broiler nutritional
value. J. Appl. Poult. Res. 17:249-261.
Dawson, P. L., D. M. Janky, M. G. Dukes, L. D. Thompson, and S. A. Woodward. 1987. Effect
of post-mortem boning time during simulated commercial processing on the tenderness
of broiler breast meat. Poult. Sci. 66:1331-1333.
De Huidobro, F. R., E. Miguel, B. Blazquez, and E. Onega. 2005. A comparison between two
methods (Warner-Bratzler and texture profile analysis) for testing either raw meat or
cooked meat. Meat Sci. 69:527-536.
Deaton, J. W., B. D. Lott, and J. D. Simmons. 1989. Hammer mill versus roller mill grinding of
corn for commercial egg layers. Poult. Sci. 68:1342-1344.
Diesbourg, L., H. J. Swatland, and B. M. Millman. 1988. X-ray diffraction measurements of
postmortem changes in the myofilament lattice of pork. J. Anim. Sci. 66:1048-1054.
22
Dozier III, W. A., K. C. Behnke, C. K. Gehring, and S. L. Branton. 2010. Effects of feed form on
growth performance and processing yields of broiler chickens during a 42-day production
period J. Appl. Poult. Res. 19:219-226.
Eisenberg, D. A.,1992. Microtracers and their uses in assuring the quality of mixed formula feeds.
Adv. Feed Technol. 7:78-85.
Ensminer, M. E., J. E. Oldfield, and W. W. Heinemann. 1990. Pages 8-120 in Feeds and
Nutrition. The Ensminger Publishing Company, Clovis, CA.
Fairchild, F. and D. Greer. 1999. Pelleting with precise mixer moisture control. Feed Int. 20:32-
36.
Fletcher, D. L. 1999. Poultry Meat Colour. Pages 159-175 in Poultry Meat Science. R.I.
Richardson and G. C. Mead, ed. CABI Publishing, New York, New York.
Fletcher, D. L. 2003. Poultry processing and products technology. University of Georgia.
Froning, G. W. 1995. Color of poultry meat. Poultry and Avian Biology Reviews 6:83-93.
Froning, G. W. and T. E. Hartung. 1967. Effects of age sex and strain on color and texture of
turkey meat. Poult. Sci. 46:1261. (abstr).
Froning, G. W., J. Daddario, and T. E. Hartung. 1968. Color and myoglobin concentration in
turkey meat as affected by age, sex and strain. Poult. Sci. 47:1827-1835.
Grau, R. and R. Hamm. 1957. Über das Wasserbindungs vermögen des Säugetier Muskels. Mitt
Über die Bestimmung der Wasserbindung des Muskels. Zeitschrift für Lebensmittel-
Untersuchung und -Forschung. 105:446-460.
Greenlees, K. J., P. Eyre, J. C. Lee, and C. T. Larsen. 1989. Effect of age and growth rate on
myocardial irritability in broiler chickens. Proc. Society for Experimental Biology and
Medicine. 190:282-285.
Halvorson, D. B. and M. Jacobson. 1970. Variations in development of muscles in chickens.
Poult. Sci. 49:132-136.
Hamm, R. 1960. Biochemistry of meat hydration. Advances in Food Research. 10:355-463.
Havenstein, G. B., P. R. Ferket, and M. A. Qureshi. 2003. Carcass composition and yield of 1957
versus 2001 broilers when fed representative 1957 and 2001 broiler diets. Poult. Sci.
82:1509-1518.
Honikel, K. O. and R. Hamm. 1987. Critical evaluation of methods detecting effects of
processing on meat protein characteristics. Pages 64-82 in Bermell, S. (ed.) Chemical
Changes During Food Processing. S. Bermell, ed. Proc. IUFoST Symposium. Consejo
Superior de Investigationes Cientificas, Valencia, Spain.
23
Honikel, K. O., C. J. Kim, R. Hamm, and P. Roncales. 1986. Sarcomere shortening of prerigor
muscles and its influence on drip loss. Meat Sci. 16:267-282.
Hott, J. M., N. P. Buchanan, S. E. Cutlip, and J. S. Moritz. 2008. The effect of moisture addition
with a mold inhibitor on pellet quality, feed manufacture, and broiler performance. J.
Appl. Poult. Res. 17:262-271.
Howard, A. and R. A. Lawrie. 1956. Physiological and biochemical effects of various pre-
slaughter treatments. Pages 18-51 in Department of Scientific and Industrial Research:
Food Investigation (Part II) Studies on Beef Quality. H. M. S. O., London, UK.
Hussar, N. and A. R. Robblee. 1962. Effects of pelleting on the utilization of feed by the growing
chicken. Poult. Sci. 41:1489-1493.
Jacosbson, M., J. V. Spencer, and D. B. Halvorson. 1969. Yields from meat-type chickens at five
ages. J. American Dietetic Assoc. 54:308-312.
Jon De Jong, et. al. 2015. Kansas State University, Midwest ASAS. 140. (Abstr).
Jones, F. T., K. E. Anderson, and P. R. Ferket. 1995. Effect of extrusion on feed characteristics
and broiler chicken performance. J. Appl. Poult. Res. 4:300-309.
Judge, M.D., E. D. Aberle, J. C. Forrest, H. B. Hedrick, and R. A. Merkel. 1989. Principles of
meat science. Page 127. 2nd ed. Kendall Hunt Publ., Dubuque.
Keeton, J. T., and W. N. Osburn. 2010. Formed and emulsion products. Pages 245-278 in Poultry
Meat Processing. C. M. Owens, C. Z. Alvarado, and A. R. Sams, ed. CRC Press, Boca
Raton, Florida.
Kerth, C. R. 2013. Meat tenderness. Pages 99-118 in The Science of Meat Quality. C. R. Kerth,
ed. Wiley-Blackwell, Ames, Iowa.
Khan, A. W. 1971. Effect of temperature during post‐mortem glycolysis and dephosphorylation
of high energy phosphates on poultry meat tenderness. J. Food Sci. 36:120-121.
Kramer, A., K. Aamlid, R. B. Guyer, and H. Rogers. 1951. New shear press predicts quality of
canned limas. Food Eng. 23:112-113.
Kulig, R., and J. Laskowski. 2008. Effect of conditioning parameters on pellet temperature and
energy consumption in the process of plant material pressing. Teka Komisji Motoryzacji i
Energetyki Rolnictwa. 8:105-111.
Lawrie, R. A., and D. Ledward. 2014. Lawrie’s meat science. Woodhead Publishing.
Lilburn, M. S. 1994. Skeletal growth of commercial poultry species. Poult. Sci. 73:897-903.
Lilly, K. G. S., C. K. Gehring, K. R. Beaman, P. J. Turk, M. Sperow, and J. S. Moritz. 2011.
Examining the relationships between pellet quality, broiler performance, and bird sex. J.
Appl. Poult. Res. 20:231-239.

24
Lindblad, G. S., J. R. Aitken, and W. G. Hunsaker. 1955. Studies on the use of barley in broiler
rations. Poult. Sci. 34:1208.
Loar, R. E. and A. Corzo. 2011. Effects of feed formulation on feed manufacturing and pellet
quality characteristics of poultry diets. World’s Poult. Sci. J. 67:19-28.
Loar, R. E., K. G. S. Wamsley, A. Evans, J. S. Moritz, and A. Corzo. 2014. Effects of varying
conditioning temperature and mixer-added fat on feed manufacturing efficiency, 28- to
42-day broiler performance, early skeletal effects, and true amino acid digestibility. J.
Appl. Poult. Res. 23:444-455.
Lott, B. D., E. J. Day, J. W. Deaton, and J. D. May. 1992. The effect of temperature, dietary
energy level, and corn particle size on broiler performance. Poult. Sci. 71:618-624.
Lyon, B. G., and C. E. Lyon. 1990. Texture profile of broiler pectoralis major as influenced by
post-mortem deboning time and heat method. Poult. Sci. 69:329-340.
Lyon, B. G., C. E. Lyon, J. F. Meullenet, and Y. S. Lee. 2010. Meat quality: Sensory and
instrumental evaluations. Pages 125-155 in Poultry Meat Processing. 2nd ed. Owens, C.
M., C. Z. Alvarado, and A. R. Sams, ed. CRC Press, Boca Raton, FL.
Lyon, C. E., B. G. Lyon, and J. A. Dickens. 1998. Effects of carcass stimulation, deboning time,
and marination on color and texture of broiler breast meat. J. Appl. Poult. Res. 7:53-60.
Ma, R. T. I., P. B. Addis, and E. Allen. 1971. Response to electrical stimulation and post-mortem
changes in turkey pectoralis major muscle. J. Food Sci. 36:125-9.
Management and Feed Manufacturing Technol. Short Course. p. 7. California Pellet Mill.
Marks, H. L. 1979. Growth rate and feed intake of selected and nonselected broilers. Growth.
43:80-90.
McCormick, F. J. and J. A. Shellenberger. 1960. Test to determine pellet hardness.
McCoy, R. A., K. C. Behnke, J. D. Hancock, and R. R. McEllhiney. 1994. Effect of mixing
uniformity on broiler chick performance. Poult. Sci. 73:443-451.
McKee, J. 1990. Vergelijkend onderzoek naar slijtvastheid van pellets De Molenaar. 93:273-275.
McKinney, L. J., and R. G. Teeter. 2004. Predicting effective caloric value of nonnutritive factors:
I. Pellet quality and II. Prediction of consequential formulation dead zones. Poult. Sci.
83:1165-1174.
McKinney, L. J., D. O. Skinner-Noble, and R. G. Teeter. 2001. Pellet quality effects on Broiler
growth and efficiency. Page 1086 in Animal Science Research Report. Oklahoma
Agricultural Experiment Station, Division of Agricultural Science and Natural Resources,
Oklahoma state Univ.

25
Miller R. K. 2002. Factors affecting the quality of raw meat. Pages 27-63 in Meat Processing:
Improving Quality. J. Kerry, J. Kerry, D. Ledward, ed. CRC Press, Boca Raton, Florida.
Moritz, J. S. 2013. Pellet quality performance tests: milling to bird performance. Proc. Arkansas
Nutr. Conf., Rogers, AR.
Moritz, J. S., K. J. Wilson, K. R. Cramer, R. S. Beyer, L. M. McKinney, W. B. Cavalcanti, and
X. 2002. Effect of formulation density, moisture, and surfactant, on feed manufacturing,
pellet quality, broiler performance. J. Appl. Poult. Res. 11:155-163.
Moritz, J. S., K. R. Cramer, K. J. Wilson, and R. S. Beyer. 2003. Feed manufacture and feeding
of rations with graded levels of added moisture formulated to different energy densities. J
Appl. Poult. Res. 12:371-381.
Moritz, J. S., R. S. Beyer, K. J. Wilson, K. R. Cramer, L. J. McKinney, and F. J. Fairchild. 2001.
Effect of moisture addition at the mixer to a corn-soybean-based diet on broiler
performance. J. Appl. Poult. Res. 10:347-353.
Muramatsu, K., A. Maiorka, I. C. M. Vaccari, R. N. Reis, F. Dahlke, A. A. Pinto, U. A. D.
Orlando, M. Bueno, and M. Imagawa. 2013. Impact of particle size, thermal processing,
fat inclusion and moisture addition on pellet quality and protein solubility of broiler
feeds. J. Ag. Sci. Tech. 3:1017.
Nir, I., R. Hillel, G. Shefet, and Z. Nitsan. 1994. Effect of grain particle size on performance:
Grain texture interactions. Poult. Sci. 73:781-791.
Nir, I., R. Hillel, I. Ptichi, and G. Shefet. 1995. Effect of particle size on performance .3. Grinding
pelleting interactions. Poult. Sci. 74:771-783.
Olkowski, A. A. 2007. Pathophysiology of heart failure in broiler chickens: structural,
biochemical, and molecular characteristics. Poult. Sci. 86:999-1005.
Owens, C. M., C. Z. Alvarado, and A. R. Sams. 2009. Research developments in pale, soft, and
exudative turkey meat in North America. Poult.Sci. 88:1513-1517.
Patton, J. W., H. H. Buskirk, and L A. Rauls, L.A. 1937. A study of the relative merits of pellets
and mash poultry feeds. Vet. Med. 32:423-427.
Penny, J. F. 1977. The effect of temperature on drip, denaturation, and extracellular space of pork
longissimus dorsi muscle. J. Sci. Food and Ag. 28:329-338.
Peron, A., D. Bastianelli, F. X. Oury, J. Gomez, and N. Carre. 2005. Effects of food deprivation
and particle size of ground wheat on digestibility of food components in broilers fed on a
pelleted diet. Br. Poult. Sci. 46:223-230.
Pfost, H. B., R. M. Allen, G. Gutekunst, W. Monti, and R. L. Stroup. 1962. Chapter 4: A
Standard Method of Measuring Pellet Quality. Proc. of the Feed Production School
sponsored by the Midwest Feed Manufacturers Association.

26
Proudfoot, F. G., and A. E. Sefton. 1978. Feed texture and light treatment effects on the
performance of chicken broilers. Poult. Sci. 57:408-416.
Reece, F. N., B. D. Lott, J. W. Deaton. 1986. Effects of environmental temperature and corn
particle size on response of broilers to pelleted feed. Poult. Sci. 65:636-641.
Reimer, L. 1992. Conditioning. Proc. Northern Crops Institute Feed Mill. Short Course. 7.
Sams, A. R. 1990. Electrical stimulation and high temperature conditioning of broiler carcasses.
Poult. Sci. 69:1781-1786.
Sams, A. R., and S. R. McKee. 2010. First processing; Slaughter through chilling. Pages 25-49 in
Poultry Meat Processing. C. M. Owens, C. Z. Alvarado, and A. R. Sams, ed. CRC Press,
Boca Raton, Florida.
Sante, V., G. Bielicki, M. Renerre, and A. Lacourt. 1991. Postmortem evaluation in Pectoralis
Superficialis muscle from two turkey breeds: a relationship between pH and color. Pages
465-468 in the 37th Int. Cong. Meat Sci. and Technol., Kulmbach, Germany.
Scheideler, S. E. 1991. Pelleting is important for broilers. Pages 1-7 in Proc. 18th Annu. Carolina
Poult. Nutr. Conf., Charlotte, NC. North Carolina State Univ., Raleigh.
Schiffman, H. R. 1968. Texture preference in the domestic chick. J. Comparative and
Physiological Psychology. 66:540.
Sellers, R. B., A. T. Brown, J. Boney, C. McDaniel, J. S. Moritz, and K. G. S. Wamsley. 2020.
Impact of feed form, liquid application method, and feed augering on feed quality, nutrient
segregation, and subsequent broiler performance. J. Appl. Poult. Res. 29:895-916.
Shen, Q. W., M. Du, and W. J. Means. 2009. Regulation of Postmortem Glycolysis and Meat
Quality. Page 194 in Applied Muscle Biology and Meat Science. M. Du and R. J.
McCormick, ed. CRC Press, Boca Raton, Florida.
Sherwood, D. H. 1977. Modern broiler feeds and strains: What two decades of improvement have
done. Feedstuffs. 49:70.
Skoch, E. R., K. C. Behnke, C. W. Deyoe, and S. F. Binder. 1981. The effect of steam-conditioning
rate on the pelleting process. Anim. Feed Sci. Technol. 6:83-90.
Sosnicki, A. A. 1993. Is the modem turkey prone to pale, soft, exudative (PSE) breast muscle
conditions? Meat Focus Int. 2:75-78.
Sosnicki, A. A., M. L. Greaser, M. Pietrzak, and E. Pospiech. 1995. Protein alterations in PSE
turkey breast and porcine muscle. Meat Focus Int. 5:193-195.
Stewart, M. K., D. L. Fletcher, D. Hamm, and J. E. Thomson. 1984. The effect of hot boning
broiler breast meat muscle on postmortem pH decline. Poult. Sci. 63:2181-2186.
Swatland, H. J. 1990. A note on the growth of connective tissues binding turkey muscle fibers
together. Can. Inst. Food Sci. Technol. J. 23:239-241.

27
Swatland, H. J. 2004. Progress in understanding the paleness of meat with a low pH: keynote
address. South African J. Anim. Sci. 34:1-7.
Swatland, H. J., and S. BARBUT. 1995. Optical prediction of processing characteristics of turkey
meat using UV fluorescence and NIR birefringence. Food Res. Int. 28:227-232.
Tang, P., P. H. Patterson, and V. M. Puri. 2006. Effect of feed segregation on the commercial hen
and egg quality. J. Appl. Poult. Res. 15:564-573.
Thomas, M., & van der Poel, A.F.B. 1996. Physical quality of pelleted animal feed. 1. Criteria for
pellet quality. Anim. Feed. Sci. Technol. 61:89-112.
Thomas, M., T. van Vliet, and A. F. B. van der Poel. 1998. Physical quality of pelleted animal
feed 3. Contribution of feedstuff components. Anim. Feed Sci. Technol. 70:59-78.
U. S. Chicken Industry Stats and Facts. Accessed Feb. 2016.
https://www.nationalchickencouncil.org/.
Van Hoof, J. 1979. Influence of ante- and peri-mortem factors on biochemical and physical
characteristics of turkey breast muscle. Vet. Quart. 1:29-36.
Van Rooy C. 1986 De invloed van technologische bewerkingen, in het bijzonder van pelleteren,
op de verteerbaarheid van mengvoeders bij varkens.
Wicker, D. L. and D. R. Poole. 1991. How is your mixer performing. Feed Man. 42:40.
Wierbicki, E., and F. F. Deatherage. 1958. Determination of water-holding capacity in fresh
meats. J. Ag. and Food Chemistry 6:387-392.
Wilcox, R. A. and J. L. Balding. 1986. Feed manufacturing problems: incomplete mixing and
segregation. C-Cooperative Extension Service. Bulletin C-555 Revised. Kansas State
University Cooperative Extension Service. Manhattan, KS.
Wilson, S. 1994. Feed quality control from specification to finished product Proc. 9th European
Poultry Conference I, Glasgow, UK.
Winowiski, T. 1998. Examining a new concept in measuring pellet quality: which test is best?
Feed Mgmt. 49: 23-26.
Wise, D. R. 1970. Comparisons of the skeletal systems of growing broiler and laying strain
chickens. Br. Poult. Sci. 11:333-339.
Wood, J. F. 1987. The functional properties of feed raw materials and the effect on the production
and quality of feed pellets. Anim. Feed Sci. Technol. 18:1.
Xiong, R., L. C. Cavitt, J. F. Meullenet, and C. M. Owens. 2006. Comparison of Allo-Kramer,
Warner-Bratzler and razor blade shears for predicting sensory tenderness of broiler breast
meat. J. Texture Stud. 37:179-199.
28
Zarate, A. J., E. T. Moran Jr, and H. L. Stilborn. 2004. Comparison of normal dent with waxy,
high-oil, and waxy-high-oil corns on pellet quality of associated feeds and response by
broilers. J. Appl. Poult. Res. 13:650-659.
Zhang, J., B. Bowker, Y. Yang, B. Pang, and H. Zhuang. 2020. Effects of deboning time and
thawing method interaction on sensory descriptive profiles of cooked chicken breast and
thigh meat. LWT. 120:108939.

29
Chapter 2
EFFECTS OF PELLET QUALITY TO ON-FARM NUTRIENT
SEGREGATION IN COMMERCIAL BROILER HOUSES VARYING IN
FEED LINE LENGTH
ABSTRACT
Improving pellet quality (PQ) by increasing the percentage of pellets in finished feed is
complicated. The hurdles of feed manufacturing are well documented. Researchers continue to
investigate the effects of PQ on various performance parameters, yet additional PQ benefits must
be presented to stimulate change in feed manufacturing practices. Therefore, the aim of this study
was to investigate the effects of PQ on nutrient segregation in commercial broiler houses differing
in feed line length. Four experiments (Exp) were performed, each including four replicate feed
lines segmented into eight regions. A commercial broiler finisher diet was manufactured using
techniques to create either poor pellet quality (PPQ) or improved pellet quality (IPQ) feeds. Exp1
and Exp2 were conducted to investigate how PPQ and IPQ feed contributes to nutrient
segregation in a 152-m feed line, respectively. Exp3 and Exp4 used the same PPQ and IPQ feed
but were carried out in a 152-m house with split feed lines, 76-m long. Feed samples were taken
from each feed pan per Exp. Pellets and fines were analyzed separately to determine pellet-to-fine
ratio (P:F), pellet survivability, and nutrient concentrations. Segregation of amino acids and
phytase were apparent in Exp1 (PPQ-152m), demonstrated by varying concentrations of amino
acids and phytase activity across the eight regions of the feed line (P<0.05). Phytase segregation
was not apparent in Exp2 (IPQ-152m) (P>0.05). Threonine and phytase segregation occurred in
Exp3 (PPQ-76m) (P<0.05) while no evidence of nutrient segregation was observed in Exp4 (IPQ-

30
76m) (P>0.05). These data suggest that investing in PQ improvements provides a more uniform
distribution of nutrients throughout the house.
INTRODUCTION
Feed ingredients and feed manufacturing account for 60-70% of production costs in an
integrated poultry operation. Modern commercial broilers are fed predominately pelleted diets,
and researchers have demonstrated how improving pellet quality (PQ), by increasing the
percentage of pellets in the diet, further enhances bird performance (Proudfoot and Sefton, 1978;
Dozier et al., 2010; Lilly et al., 2011; Corzo et al., 2011; Glover et al., 2016; Lemons and Moritz,
2016). Improving PQ can be achieved using numerous documented manufacturing techniques
(Behnke, 1994; Behnke, 1996; Angulo et al., 1996; Skoch et al., 1981; Buchanan and Moritz,
2009); however, there is reluctance to adopt feed manufacturing practices that improve PQ due to
lack of association between PQ, bird performance, and overall economics. Additionally, the
complexity of feed manufacturing coupled with throughput demands often supersede the use of
manufacturing strategies known to enhance PQ. Therefore, new perspectives and additional data
supporting an investment in PQ are required.
Diet uniformity is an important aspect of feed production (Wilcox and Balding, 1986;
Beumer, 1991) and must be managed at the feed mill. Stark et al. (1991) studied mixer CV using
salt as a tracer and reported that 58% of the farm mixers surveyed in 1991 did not meet the
industry standard CV of less than 10%. On-farm nutrient segregation may be exacerbated with
elevated mixer CV. McCoy et al. (1994) conducted two broiler experiments and reported that FI,
BW, and feed efficiency were affected by diet uniformity. These data support improved mixer
CV but do not provide insight to how nutrients segregate from the feed mill to the feed pan.
Therefore, understanding on-farm nutrient segregation is important.

31
It has been suggested that improving PQ may reduce nutrient segregation (Scheideler,
1991; Behnke, 1996; Moritz, 2013; Wamsley, 2014; Sellers et al., 2020), but more research is
warranted. Feed, made up of pellets and fines, may segregate in the feed truck during
transportation, within feed bins, and within feed lines during feed augering (Moritz, 2013). The
result is variability in pellet-to-fine ratios (P:F) in feed pans. Lilly et al. (2011) reported that
increasing the percentage of pellets in the diet from 30% to 60% and 90% increased FI and BWG.
Similarly, McKinney and Teeter (2004) reported that broilers exhibited greater weight gain and
improved feed conversion when fed 100% pellets compared to those fed 20% pellets. However,
FI was not affected.
The segregation of feed particles may contribute to uneven distribution of nutrients in
commercial feed delivery systems. Tang et al. (2006) observed that smaller particles (<1,180 m)
in mash feed were more nutrient dense than larger particles and percolated to the bottom of the
feed trough in commercial layer houses. Feed augering led to forced selection of certain mash
particles and nutrients, consequently affecting layer performance. More recently, Sellers et al.
(2020) investigated the effects of feed augering on nutrient segregation using feeds differing in
P:F and liquid application method of oil and phytase. These authors observed increased phytase
activity in feed pans with greater amounts of fines when augering treatments with post-pellet
applied phytase. Results from this study suggest that phytase availability may be dependent upon
feed pan location and that phytase may serve as a suitable nutrient segregation marker. However,
the effects of feed augering were only considered in 58-m feed lines. Perhaps, the magnitude of
feed particle and nutrient segregation differs when feed is augered different lengths, such as feed
lines extending the length of the house compared to split (middle house fed) lines that extend
from the center of the house to either end. Sellers et al. (2020) also suggested that other nutrients

32
may segregate. Considering the importance of amino acid nutrition in modern broiler production,
it may be reasonable to study amino acids segregation in commercial feed lines.
Therefore, four experiments were conducted to study nutrient segregation using feeds
differing in pellet quality (Poor Pellet Quality (PPQ) vs. Improved Pellet Quality (IPQ)) when
augered through commercial broiler houses differing in feed line length (152-m vs. 76-m). The
objectives of this study were to determine how pellets and fines travel throughout commercial
broiler houses, and if feed line length and PQ affected the degree of phytase and amino acid
segregation within various regions of the feed line.
MATERIALS AND METHODS
Experimental Design
The current study consisted of four experiments (Exp). Experiment 1 (Exp1) considered
how PPQ feed contributed to nutrient segregation throughout a 152-m feed line using eight
predetermined regions, defined by the number of feed pans (Figure 2-1). A given region in Exp1
consisted of 24 feed pans. Experiment 2 (Exp2) mimicked Exp1 but considered how IPQ feed
contributed to nutrient segregation in a 152-m feed line. Experiment 3 (Exp3) measured how PPQ
feed contributed to nutrient segregation in a 76-m feed line using eight regions with 12 feed pans
per region (Figure 2-1). Experiment 4 (Exp4) mimicked Exp3 but considered how IPQ feed
influenced nutrient segregation in a 76-m feed line. Herein, experiments will be labeled as
follows:
Exp1 (PPQ-152m)
Exp2 (IPQ-152m)
Exp3 (PPQ-76m)
33
Exp4 (IPQ-76m)
The experimental unit was defined as the pans of feed in a region. Each Exp included
four replicate feed lines broken into the eight aforementioned regions, creating 32 systematic
experimental units. Phytase activity, pellet survivability, and percentage of pellets were analyzed
from four replicate feed lines per Exp. Amino acid concentration was analyzed from three
replicate feed lines due to cost and time associated with laboratory analysis.
Experimental Diet Preparations
Two nutritionally identical commercial broiler finisher diets were manufactured at a
commercial feed mill (Wenger Feeds, Spring Glen, PA). Each diet was manufactured using
techniques known to produce pellets of poor or improved quality. Ingredients were mixed in a
Hayes and Stolz twin shaft, single ribbon mixer with a 3.175-tonne capacity and CV of 5% at
mixing. Dry ingredients were mixed for 15 s followed by liquid ingredient addition and mixing
for 75 s. Steam conditioning was applied for 30 s in a 609.6 x 2,438.4 mm conditioning barrel
powered by a 20-HP motor prior to passing through a 200-HP Sprout 615 pellet mill equipped
with a 4.37 x 50.80 mm effective die. Pellets were dried and cooled in a counterflow cooler
(California Pellet Mills Inc., Crawfordsville, IN). To create feed varying in PQ, steam
conditioning temperature and motor amperage were manipulated. A steam conditioning
temperature of 65.5°C and motor amperage of 200 Amps were utilized to create the PPQ feed.
Average production rate of PPQ feed was 11.430 tonne/h. To create the IPQ feed, steam
conditioning temperature and motor amperage were 81.1°C and 160 Amps, respectively. Average
production rate of IPQ feed was 11.884 tonne/h. Soybean oil and 400 FTU/kg phytase (Quantum

34
Blue, AB Vista, Marlborough, Wiltshire, UK) were applied post-pelleting for both PPQ and IPQ
feeds.
Diets were transported to Penn State’s Poultry Education and Research Center and
augered into separate bulk bins. Both the PPQ and IPQ feeds were systematically augered out of
the feed bins, into 22.68 kg bags, and split into uniform allotments varying in size based on feed
line length and capacity at each farm. For instance, allotments destined for a farm with 152-m
feed lines consisted of 453.6 kg of feed and allotments destined for a farm with 76-m feed lines
consisted of 226.8 kg of feed. Systematic feed augering accounted for feed segregation in feed
bins. In total, four allotments of PPQ feed and four allotments of IPQ feed were transferred to
each cooperator farm. An additional 453.6 kg allotment of PPQ and IPQ feeds were sifted using a
modified particle size separator (Modified Penn State Particle Separator, Agricultural and
Biological Engineering Department, University Park, PA) fitted with a No. 5 American Society
for Testing and Materials screen to determine P:F of each PQ. Pellets from the PPQ and IPQ
allotments were used to determine descriptive pellet durability metrics (ASAE, 1983). These data
confirmed that differences in manufacturing technique resulted in diets differing in PQ (Table 2-
1).
152-m Feed Lines: Feed Sampling Procedure
The first cooperator farm consisted of two commercial broiler houses, built at the same
time with identical floorplans. Each house was equipped with four 152-m-long feed lines and 192
Cumberland Hi-Lo Classic (Cumberland, AGCO Corporation, Duluth, GA) feed pans per line. It
should be noted that feed lines were empty, and no birds were in either house during feed sample
collection. A commercial feed truck was used to vacuum feed from bulk bags and blow feed into
the onsite feed bins. Logistics demanded the PPQ feed be blown into the feed bins of house 1 for

35
Exp1 (PPQ-152m), while the IPQ feed be blown into feed bins of house 2 for Exp2 (IPQ-152m).
One 453.6 kg allotment of feed was blown into the feed bin and then augered through a single
feed line to fill respective feed pans. This was repeated until all four replicate feed lines and feed
pans were filled. The same methods were used in each house for each Exp, regardless of PQ.
Feed samples were collected from each feed pan, for each of the four replicate feed lines per Exp.
In total, 768 feed samples were taken from each Exp (Exp1(PPQ-152m) and Exp2 (IPQ-152m)).
76-m Feed Lines: Feed Sampling Procedure
The second cooperator farm consisted of a single broiler house equipped with two rows
of split (middle house fed) feed lines, where feed was augered into centrally located feed hoppers
and pulled to either end of the barn. This created four 76-m-long feed lines with 95 Cumberland
Hi-Lo Classic (Cumberland, AGCO Corporation, Duluth, GA) feed pans per line. Once again,
feed lines were empty and there were no birds in the house. The same commercial feed truck was
used to vacuum feed from bulk bags and blow feed into the onsite feed bin. Considering this farm
had only one house, Exp3 (PPQ-76m) was conducted and then followed by Exp4 (IPQ-76m). One
226.8 kg allotment of feed was used to fill a single feed line and feed pans. This was repeated
until all four replicate feed lines and feed pans were filled. Feed samples were taken from every
feed pan for each of the four replicate feed lines. In total, 380 feed samples were taken from each
experiment (Exp3 (PPQ-76m) and Exp4 (IPQ-76m)).
Feed Sample Analysis
A total of 1,536 feed samples from Exp1 (PPQ-152m) and Exp2 (IPQ-152m), and 760
feed samples from Exp3 (PPQ-76m) and Exp4 (IPQ-76m) were transported to Penn State’s

36
Poultry Education and Research Center for nutrient segregation analysis. Although feed samples
were collected at each feed pan for each Exp, the eight regions per feed line were utilized to
quantify nutrient segregation throughout feed lines. All feed samples were randomly passed
through a modified particle size separator to determine P:F. Sifted pellet samples were collected
from every 10th feed pan to be analyzed for pellet survivability using the New Holmen Pellet
Tester (New Holmen’s Pellet Tester, TekPro Ltd., Norfolk, UK). Descriptive data for percentage
of pellets in each Exp are presented in Figures 2-2 and 2-3. Resulting pellets and fines were
collected separately from feed pans located in eight predetermined regions of each feed line.
Pellets and fines from these regions were analyzed separately for amino acid concentration
(AOAC, 2006) and phytase activity (AOAC, 2000) at commercial laboratories (Eurofins
Scientific, Des Moines, IA and Agricultural Experiment Station Chemical Laboratories,
Columbia, MO). Amino acid concentration and phytase activity results from respective pellets
and fines analyses were applied to the percentage of pellets and fines results within a region.
Applying amino acid and phytase activity results to actual pellet and fine percentages allowed the
authors to quantify nutrients present in feed pans in a given region.
Statistical Analysis
Each Exp (Exp1 – Exp4) was analyzed using the GLM procedure of SAS version 9.4
(SAS Inst. Inc., Cary, NC). Phytase activity, percentage of pellets, and pellet survivability were
analyzed from four replicate feed lines per Exp while amino acid concentrations were analyzed
from three replicate feed lines per Exp. One-way ANOVA tests were performed for each Exp,
and fisher’s least significant difference test was used to separate means when P<0.05. Separate
analyses were conducted using student’s t-tests (α=0.05) to determine how PQ and feed line
length contributed to nutrient segregation. Here, means were expected to be similar because

37
identical diets were used across all Exp. Therefore, SD were included and used to discuss nutrient
variability in the scenarios below:
152-m: PPQ vs. IPQ
76-m: PPQ vs. IPQ
PPQ: 152-m vs. 76-m
IPQ: 152-m vs. 76-m
RESULTS AND DISCUSSION
Experiment 1 (PPQ-152m)
Nutrient segregation was apparent when PPQ feed was augered through 152-m feed lines
(Table 2-2). Amino acid segregation was demonstrated by the varying concentrations of six
individual amino acids measured throughout the eight regions of the feed line. Aspartate
concentrations varied by 10.8% (P=0.0191), glutamate by 12.8% (P=0.0022), glycine by 7.8%
(P=0.0381), leucine by 7.4% (P=0.0324), alanine by 6% (P=0.0474), and lysine by 9.4%
(P=0.0355) across the eight regions of the feed line (Table 2-2). Phytase segregation was also
apparent when PPQ feed was augered through 152-m feed lines (Table 2-2). Phytase activity
varied by 50.3% across the eight regions of the house (P=0.0197). In addition, pellet survivability
varied across regions of the feed line, described by a 5.6% difference between regions 1 and 8
(P=0.0158; Table 2-2). Percentage of pellets differed throughout the house, decreasing as the feed
traveled from region 1 to region 8 (P=0.0016; Table 2-2). Descriptive data on the percentage of
pellets throughout 152-m feed lines are plotted in Figure 2-2. This decrease in pellet survivability
is likely attributed to mechanical forces acting on the pellets as feed travels through the feed line.
This data is supported by previous findings in field studies that demonstrated a decrease in pellet

38
survivability was followed by a decrease in percentage of pellets (Scheideler, 1991; Moritz, 2013;
Wamsley, 2014).
An uneven distribution of pellets may affect bird growth and flock uniformity. Sellers
and cohorts (2020) investigated nutrient segregation in a commercial broiler house and its impact
on broiler performance. These researchers found that percentage of pellets decreased as feed
traveled down the feed line, and birds fed diets that were augered from 0-30 m of the feed line
exhibited a 3g increase in BW at 42 d compared to birds fed diets augered from 32-58 m. This
increase in BW was likely due to higher proportions of pellets in the diet augered from 0-30 m
compared to the diet augered from 32-58 m. Data from the present study indicate that augering
PPQ feed through a 152-m-long feed line contributes to an uneven distribution of pellets, amino
acids (aspartate, glutamate, glycine, alanine, leucine, and lysine), and phytase activity throughout
the house.
Experiment 2 (IPQ-152m)
When IPQ feed was augered through 152-m feed lines, only aspartate and glutamate
concentrations varied (P=0.0464 and P=0.0128, respectively; Table 2-3). Variation in surviving
pellets was evident throughout the house, explained by a 4.6% difference across the eight regions
of the feed line (P=0.0023; Table 2-3). Phytase activity and percentage of pellets were not
different across the eight regions of the 152-m feed line (P>0.05; Table 2-3). Improved pellet
quality feed minimized amino acid segregation and eliminated phytase activity segregation when
feed was augered long distances.
Nutrient density has a substantial impact on the growth and development of broilers,
which may affect broiler production economics (Mabray and Waldroup, 1981; Reece and
McNaughten, 1982; Campbell et al., 1988). Manipulating nutrient density has also been shown to

39
affect growth performance and meat yield (Jones and Wiseman, 1985). It is well documented that
feeding diets variable in amino acid density contributes to differences in bird performance (Kidd
et al., 1998; Kidd et al., 2004; Corzo et al., 2005; Dozier et al., 2008). Kidd and colleagues (1998)
reported increased carcass and breast yield in broilers fed starter and grower diets that were
formulated to 115% and 125% of the NRC lysine recommendations, respectively, compared to
birds fed the same starter diet but were fed a grower diet that was formulated to 85% of the NRC
lysine recommendations. Corzo et al. (2005) fed broilers varying levels of amino acids and
reported increased BW and decreased FCR in birds fed the high amino acid dense diets compared
to those fed the low amino acid dense diets. Based on previous research and data from the current
study, minimizing nutrient segregation across the feed line may lead to more precise amino acid
concentrations, thereby optimizing bird performance.
Experiment 3 (PPQ-76m)
Threonine was the only amino acid whose concentration varied across the eight regions
of the 76-m feed line when using PPQ feed (P=0.0134; Table 2-4). Phytase segregation was
evident in this Exp, varying by 64.7% between regions 2 and 8 of the 76-m feed line (P=0.0212;
Table 2-4). These data suggest that the amount of phytase birds receive may be dependent upon
feed line region. Feeding diets with higher phytase levels to broilers has been shown to improve
broiler performance (Pirgozlev et al., 2011), which may be due to the reduction of the anti-
nutritive effect of phytate. Super dosing of phytase is thought to not only increase bound
phosphorus utilization, but utilization of all dietary nutrients, which can improve overall
performance (Shirley and Edwards, 2003). Pieniazek et al. (2017) found that birds fed diets with a
phytase inclusion of 2,000 U/kg had significantly higher d 42 BW compared to birds fed diets
with a phytase inclusion of 500 U/kg. In addition, it was observed that feed consumption

40
increased linearly as phytase inclusion increased. It has also been reported that standard doses of
phytase improve BWG, feed efficiency, nutrient utilization, and bone mineralization in broilers
fed diets containing reduced available P (Leske and Coon, 1999; Selle et al., 2012). Walk and
associates (2013) evaluated the extra phosphoric effects of a novel phytase and observed that
broilers fed negative control (NC) diets, deficient in calcium and available phosphorus, had
decreased BWG and tibia ash compared to birds fed the same NC diet supplemented with
phytase. The phytase activity variability in PPQ feed across the 76-m feed line may contribute to
insufficient mineral digestion and absorption, ultimately affecting performance.
Percentage of pellets also varied by 17.1% throughout the feed line and tended to
increase as feed traveled from region 1 to region 8 (P=0.0016; Table 2-4). This is depicted in
Figure 2-3 which includes descriptive data on percentage of pellets throughout 76-m feed lines.
Augering PPQ feed through a shorter feed line may contribute to a greater degree of fines
segregation, resulting in a greater proportion of intact pellets at the end of the feed line. However,
these data only represent a snapshot in time. Additional research studying nutrient composition in
feed pans throughout the grow-out period is necessary.
Experiment 4 (IPQ-76m)
Amino acid and phytase segregation were not apparent when augering the IPQ feed
through 76-m-long feed lines (P>0.05; Table 2-5). Percentage of pellets was the only measured
variable that differed across the eight regions of the feed line (P=0.0289; Table 2-5). As discussed
previously, variation in P:F contributes to differences in bird performance and subsequent flock
uniformity. However, improving PQ on farms with split (middle house fed) feed lines may
eliminate the differences in bird performance associated with varying amino acid densities (Kidd
et al., 2004; Corzo et al., 2005; Dozier et al., 2008) and phytase activities (Cowieson et al., 2011;

41
Karimi et al., 2013; Pieniazek et al., 2017; Walters et al., 2019; Smith et al., 2019). Moreover,
these data suggest that broiler performance field trials evaluating PQ improvements should be
conducted in barns with split (middle house fed) feed lines to eliminate confounding effects such
as amino acid and phytase activity segregation.
Pellet Quality and Feed Line Length Means
Additional analyses, student’s t-tests, were performed and provided nutrient means for
feed line length and PQ. As previously mentioned, identical diets were used in all four Exp.
Therefore, differences in amino acids were not expected or prevalent. There were a few instances
where amino acid means differed; however, these differences were inconsistent. The SD were
provided to show nutrient variability in feed lines of different lengths and feeds differing in PQ.
Pellet Quality Means in 152-m Feed Lines
PPQ feed contributed to higher SD in aspartate, glutamate, proline, glycine, alanine,
methionine, isoleucine, leucine, and lysine concentrations compared to that of IPQ feed when
augered through 152-m feed lines (Table 2-6). The SD was also higher for phytase activity, pellet
survivability, and percentage of pellets throughout the feed line when using PPQ feed compared
to using IPQ feed (Table 2-6). These data further support the use of manufacturing techniques
that improve PQ to reduce the variability of nutrients throughout the house.
The PQ means for PPQ and IPQ feeds augered through 152-m feed lines are found in
Table 6. It was evident that IPQ feed had higher mean percentage of pellets (P<0.0001; Table 2-
6) and mean pellet survivability (P<0.0001; Table 2-6), confirming that feed manufacturing
strategies to create feed treatments differing in PQ were successful. Interestingly, the IPQ feed

42
resulted in lower mean phytase activity compared to the PPQ feed (P=0.0088; Table 2-6). It is
documented that phytase efficacy can be better described by bird performance and tibia ash
because of the variability within the phytase activity assay (Loop et al., 2012). However, no birds
were present in the current study and in vitro phytase activity (AOAC, 2000) was the only means
of measuring phytase segregation. These data represent P:F calculations and phytase activity of
pellets and fines, resulting in average phytase activity in a given region. Because phytase was
applied post-pelleting, a greater phytase activity was observed when analyzing the fines for both
the PPQ and IPQ feeds. These findings align with Sellers et al. (2020) who reported that phytase
activity increased in feed pans with decreased pellets and increased fines. These authors speculate
that when phytase is applied post-pelleting, deterioration to the outside of the pellet causes
phytase to slough off, allowing phytase to segregate into the fines. Additional applied research is
needed to understand potential phytase segregation when phytase is added at the mixer.
Pellet Quality Means in 76-m Feed Lines
The mean pellet survivability and percentage of pellets were higher for the IPQ feed
compared to PPQ feed when augered through 76-m feed lines (P<0.0001; Table 2-7). Augering
PPQ feed through 76-m feed lines increased the degree of nutrient segregation, noted by higher
SD for aspartate, threonine, glutamate, proline, glycine, alanine, valine, isoleucine, leucine, and
lysine concentrations compared to that of the IPQ feed (Table 2-7). Phytase activity, pellet
survivability, and percentage of pellets also exhibited higher SD across the eight regions when
augering PPQ feed through 76-m feed lines compared to IPQ feed (Table 2-7). Data from Tables
2-6 and 2-7 reveal that increasing the percentage of pellets in the diet leads to less variation in
amino acid concentration, phytase activity, percentage of pellets, and surviving pellets when
augering feed throughout the house regardless of feed line length.
43
Feed Line Length Means Using Poor Pellet Quality Feed
SD were decreased for aspartate, threonine, glutamate, proline, glycine, alanine, cysteine,
valine, isoleucine, leucine, and lysine concentrations, as well as pellet survivability when augered
through 76-m feed lines compared to 152-m feed lines (Table 2-8). Corzo et al. (2005) reported
that feeding higher amino acid concentrations to broilers improved FCR and breast meat yield.
Relatedly, Kidd and colleagues (2004) observed detrimental effects to d 49 BW, FCR, carcass
yield and breast yield of broilers fed diets low in amino acid density. Within the parameters of the
current study, the variability in amino acid concentration from region to region can be minimized
by using shorter feed lines.
The mean percentage of pellets for PPQ feed was higher at the first cooperator farm
compared to the second cooperator farm (P<0.0001; Table 2-8). This is due to the time interval
between experiments. Exp3 and Exp4 were performed two weeks after Exp1 and Exp2. As a
result, the PPQ and IPQ feeds used for Exp3 and 4 experienced some degree of pellet degradation
due to feed aging. As discussed previously, increased percentages of fines results in higher
phytase activity. This speculation supports higher mean phytase activity observed in 76-m feed
lines (P=0.0308; Table 2-8). Overall, this data implies that amino acid segregation is substantially
reduced when augering PPQ feed through shorter feed lines (76-m vs. 152-m); however, phytase
segregation was still prominent.
Feed Line Length Means Using Improved Pellet Quality Feed
Higher SD for methionine concentration, phytase activity, and percentage of pellets were
apparent when IPQ feed was augered through 76-m feed lines (Table 2-9). Compared to the 152-
m-long feed lines, the degree of amino acid variability was reduced when augering feed through

44
76-m feed lines, regardless of PQ. Therefore, integrators who are reluctant to invest resources in
PQ improvements can still decrease on-farm nutrient segregation by using shorter, split (middle
house fed) feed lines. This study provides new perspectives and benefits of adopting feed
manufacturing techniques that improve PQ. Additional research investigating the effect of on-
farm nutrient segregation on broiler performance and flock uniformity is merited.
CONCLUSION
Within the parameters of this study, modest improvements in PQ decreased amino acid
and phytase activity segregation, regardless of feed line length. Augering IPQ feed throughout
shorter split feed lines eliminated nutrient segregation across the eight regions of the commercial
broiler house. This study provides new perspectives and benefits of adopting feed manufacturing
techniques that improve PQ. However, if improvements to PQ cannot be made, shorter feed line
lengths can be used to reduce nutrient segregation. Additional research investigating the effect of
on-farm nutrient segregation on broiler performance and flock uniformity is merited.
ACKNOWLEDGEMENTS
The authors acknowledge The Pennsylvania Poultry Industry Broiler Research Check-Off
Program for their financial support in funding this project.
REFERENCES
Agricultural Experiment Station Chemical Laboratories, Columbia, MO.
American Society for Agricultural Engineers, 1983. American Society for Agricultural Engineers,
1983. Methods for determining and expressing fineness of feed materials by sieving. Page

45
325 in American Society of Agricultural Engineers Standard S 319. Am. Soc. Agric. Eng.
Yearbook Standards, Am. Soc. Am. Eng., St. Joseph, MI. Pellet durability index was
determined by sifting 500 g of pellets from a treatment through a No. 5 American Society
for Testing and Materials (ASTM) screen before being deposited into a Pfost tumbler. The
sifted pellets were then tumbled in the container, dimensions 5 × 12 × 12 in., with a 2 × 9
in. plate fixed diagonally along the 12 × 12 in. side, for approximately 10 min at 50 rpm.
The sample was then sifted again through the No. 5 (ASTM) mm screen, weighed, and the
percentage of pellets was calculated by dividing the weight of pellets after tumbling by the
weight of pellets before tumbling and then multiplying that value by 100. Modified pellet
durability index was similarly measured, with the exception of the addition of five, 13-mm
hexagonal bolts to the 500 g of sample in the tumbler. Both analyses are meant to simulate
the deleterious effects of transferring and handling the pellets.
Angulo, E., J. Brufau, and E. Esteve-Garcia. 1996. Effect of a sepiolite product on pellet durability
in pig diets differing in particle size and in broiler starter and finisher diets. Anim. Feed
Sci. Technol. 63:25-34.
AOAC. 2000. Method 2000.12: Phytase activity in feed: Colorimetric enzymatic method. In
Official Methods of Analysis of AOAC International. 17th ed. Assoc. Off. Anal. Chem.,
Arlington, VA.
AOAC. 2006. Method 994.12: Amino Acids in Feeds: Performic acid oxidation with acid
hydrolysis-sodium metabisulfite method. In Official Methods of Analysis of AOAC
International. 18th ed. Gaithersburg, MD.
Behnke, K. C. 1994. Factors affecting pellet quality. Pages 44-54 in Proc. Maryland Nutr. Conf.,
College Park, MD. Maryland Feed Ind. Counc. And Univ. Maryland, College Park.
Behnke, K. C. 1996. Feed manufacturing technology: Current issues and challenges. Anim. Feed
Sci. Technol. 62:49-57.
Beumer, I. H. 1991. Quality assurance as a tool to reduce losses in animal feed production. Adv.
Feed Technol. 6:6-23.
Buchanan, N. P., and J. S. Moritz. 2009. Main effects and interactions of varying formulation
protein, fiber, and moisture on feed manufacture and pellet quality. J. Appl. Poult. Res.
18:274-283.
California Pellet Mills Inc., Crawfordsville, IN.
Campbell, G. L., R. E. Salmon, and H. L. Classen. 1988. Effect of nutrient density on broiler carcass
composition as influenced by age. Nutr. Rep. Int. 37:973-981.
Corzo, A., M. T. Kidd, D. J. Burnham, E. R. Miller, S. L. Branton, and R. Gonzalez-Esquerra.
2005. Dietary amino acid density effects on growth and carcass of broilers differing in
strain cross and sex. J. Appl. Poult. Res. 14:1-9.
46
Corzo, A., L. Mejia, and R. E. Loar II. 2011. Effect of pellet quality on various broiler production
parameters. J. Appl. Poult. Res. 20:68-74.
Cowieson, A. J., P. Wilcock, and M. R. Bedford. 2011. Super-dosing effects of phytase in poultry
and other monogastrics. World’s Poult. Sci. J. 67:225-236.
Cumberland, AGCO Corporation, Duluth, GA.
Dozier III, W. A., K. C. Behnke, C. K. Gehring, and S. L. Branton. 2010. Effects of feed form on
growth performance and processing yields of broiler chickens during a 42-day production
period J. Appl. Poult. Res. 19:219-226.
Dozier III, W. A., M. T. Kidd, and A. Corzo. 2008. Dietary amino acid responses of broiler
chickens. J. Appl. Poult. Res. 17:157-167.
Eurofins Scientific, Des Moines, IA.
Glover, B. G., K. L. Foltz, I. Holásková, and J. S. Moritz. 2016. Effects of modest improvements
in pellet quality and experiment pen size on broiler chicken performance. J. Appl. Poult.
Res. 25:21-28.
Jones, R. L., and J. Wiseman. 1985. Effect of nutrition on broiler carcass composition: influence
of dietary energy content in the starter and finisher phases. Br. Poult. Sci. 26:381-388.
Karimi, A., C. Coto, F. Mussini, S. Goodgame, C. Lu, J. Yuan, M. R. Bedford, and P. W. Waldroup.
2013. Interactions between phytase and xylanase enzymes in male broiler chicks fed
phosphorus-deficient diets from 1 to 18 days of age. Poult. Sci. 92:1818-1823.
Kidd, M. T., B. J. Kerr, K. M. Halpin, G. W. McWard, and C. L. Quarles. 1998. Lysine interactions
in broilers in starter and grower-finisher diets. J. Appl. Poult. Res. 7:351-358.
Kidd, M. T., C. D. McDaniel, S. L. Branton, E. R. Miller, B. B. Boren, and B. I. Fancher. 2004.
Increasing amino acid density improves live performance and carcass yields of commercial
broilers. J. Appl. Poult. Res. 13:593-604.
Lemons, M. E., and J. S. Moritz. 2016. The effect of feeder space access and crumble-or pellet-to-
fine ratio on 38-day-old broiler performance. J. Appl. Poult. Res. 25:12-20.
Leske, K. L., and C. N. Coon. 1999. A bioassay to determine the effect of phytase on phytate
phosphorus hydrolysis and total phosphorus retention of feed ingredients as determined
with broilers and laying hens. Poult. Sci. 78:1151-1157.
Lilly, K. G. S., C. K. Gehring, K. R. Beaman, P. J. Turk, M. Sperow, and J. S. Moritz. 2011.
Examining the relationships between pellet quality, broiler performance, and bird sex. J.
Appl. Poult. Res. 20:231-239.
Loop, S. A., K. G. S. Lilly, L. K. Shires, C. K. Gehring, K. R. Beaman, M. E. Persia, and J. S.
Moritz. 2012. The phytase analytical activity of pelleted diets may not adequately describe
efficacy in the bird. J. Appl. Poult Res. 21:492-501.

47
Mabray, C. J., and P. W. Waldroup. 1981. The influence of dietary energy and amino acid levels
on abdominal fat pad development of the broiler chicken. Poult. Sci. 60:151-159.
McCoy, R. A., K. C. Behnke, J. D. Hancock, and R. R. McEllhiney. 1994. Effect of mixing
uniformity on broiler chick performance. Poult. Sci. 73:443-451.
McKinney, L. J., and R. G. Teeter. 2004. Predicting effective caloric value of nonnutritive factors:
I. Pellet quality and II. Prediction of consequential formulation dead zones. Poult. Sci.
83:1165-1174.
Modified Penn State Particle Separator, Agricultural and Biological Engineering Department.,
University Park, PA. A modified forage particle size separator was used for this study.
The original forage particle size separator was built by the Agricultural and Biological
Engineering Department at Penn State to meet the requirements of ANSI/ASABE
standard S424. This standard is used to determine the particle size distribution of chopped
forage materials by screening. The original screens and pan were removed from the
machine, then the machine was modified for continuous throughput by adding a custom
fabricated No. 5 American Society for Testing and Materials (ASTM) screen fitted with a
tube to allocate sifted pellets into a stationary bin adjacent to the machine. A custom
fabricated pan with an outlet tube at the end was fitted below the No. 5 sieve to collect
fines, which were directed into a separate bin. The purpose of the modification was to
separate pellets and fines from complete pelleted turkey or broiler feed. The screen
shaker oscillates in a horizontal plane. One end of the screen stack oscillates back and
forth in a straight horizontal line on a slider block. The opposite end is supported on
horizontal crank arms that travel in a circle with a diameter of 117 mm. The screen
shaker operates at a frequency of 144 +/- 5 cycles per minute.
Moritz, J. S. 2013. Pellet quality performance tests: milling to bird performance. Proc. Arkansas
Nutr. Conf., Rogers, AR.
New Holmen’s Pellet Tester, TekPro Ltd., Norfolk, UK. Surviving pellets = (gram weight of
surviving intact pellets/100 g sifted pellet sample) *100%. Surviving pellets percentage
was determined by placing 100 g of sifted pellets into the NHPT100. The pellets were
cascaded in an air stream for 30 sec, causing them to collide with each other and the
perforated hard surfaces of the test chamber. The fines were removed as they were blown
through the perforated screen. The surviving pellets were then removed and weighed again.
Pellet durability was calculated as the percent of surviving pellets retained after sampling.
Pieniazek, J., K. A. Smith, M. P. Williams, M. K. Manangi, M. Vazquez-Anon, A. Solbak, M.
Miller, and J. T. Lee. 2017. Evaluation of increasing levels of a microbial phytase in
phosphorus deficient broiler diets via live broiler performance, tibia bone ash, apparent
metabolizable energy, and amino acid digestibility. Poult. Sci. 96:370-382.
Pirgozliev, V., M. R. Bedford, T. Acamovic, P. Mares, and M. Allymehr. 2011. The effects of
supplementary bacterial phytase on dietary energy and total tract amino acid digestibility
when fed to young chickens. Br. Poult. Sci. 52:245-254.

48
Proudfoot, F. G., and A. E. Sefton. 1978. Feed texture and light treatment effects on the
performance of chicken broilers. Poult. Sci. 57:408-416.
Quantum Blue, AB Vista, Marlborough, Wiltshire, UK.
Reece, F. N., and J. L. McNaughton. 1982. Effects of dietary nutrient density on broiler
performance at low and moderate environmental temperatures. Poult. Sci. 61:2208-2211.
SAS Inst. Inc., Cary, NC.
Scheideler, S. E. 1991. Pelleting is important for broilers. Pages 1-7 in Proc. 18th Annu. Carolina
Poult. Nutr. Conf., Charlotte, NC. North Carolina State Univ., Raleigh.
Selle, P. H., A. J. Cowieson, N. P. Cowieson, and V. Ravindran. 2012. Protein–phytate interactions
in pig and poultry nutrition: a reappraisal. Nutr. Res. Rev. 25:1-17.
Sellers, R. B., A. T. Brown, J. Boney, C. McDaniel, J. S. Moritz, and K. G. S. Wamsley. 2020.
Impact of feed form, liquid application method, and feed augering on feed quality, nutrient
segregation, and subsequent broiler performance. J. Appl. Poult. Res. 29:895-916.
Shirley, R. B., and H. M. Edwards Jr. 2003. Graded levels of phytase past industry standards
improves broiler performance. Poult. Sci. 82:671-680.
Skoch, E. R., K. C. Behnke, C. W. Deyoe, and S. F. Binder. 1981. The effect of steam-conditioning
rate on the pelleting process. Anim. Feed Sci. Technol. 6:83-90.
Smith, K. A., C. L. Wyatt, and J. T. Lee. 2019. Evaluation of increasing levels of phytase in diets
containing variable levels of amino acids on male broiler performance and processing
yields. J. Appl. Poult. Res. 28:253-262.
Stark, C. R., K. C. Behnke, R. D. Goodband, and J. A. Hansen. 1991. On-farm feed uniformity
survey. Kansas State University Swine Day 1991. Report of Progress 641:165-166.
Tang, P., P. H. Patterson, and V. M. Puri. 2006. Effect of feed segregation on the commercial hen
and egg quality. J. Appl. Poult. Res. 15:564-573.
Walk, C. L., M. R. Bedford, T. S. Santos, D. Paiva, J. R. Bradley, H. Wladecki, C. Honaker, and
A. P. McElroy. 2013. Extra-phosphoric effects of superdoses of a novel microbial phytase.
Poult. Sci. 92:719-725.
Walters, H. G., M. Coelho, C. D. Coufal, and J. T. Lee. 2019. Effects of increasing phytase
inclusion levels on broiler performance, nutrient digestibility, and bone mineralization in
low-phosphorus diets. J. Appl. Poult. Res. 28:1210-1225.
Wamsley, K. G. S. 2014. Feed manufacture effects on quality, nutrition, and segregation.
Proceedings of the 2014 Poultry Nutrition and Milling Seminar hosted by: Alabama Feed
and Grain Association. Huntsville, Alabama.
Wenger Feeds, Spring Glen, PA.

49
Wilcox, R. A. and J. L. Balding. 1986. Feed manufacturing problems: incomplete mixing and
segregation. C-Cooperative Extension Service. Bulletin C-555 Revised. Kansas State
University Cooperative Extension Service. Manhattan, KS.

50
Figure 2-1. Diagram of replicate feed line regions at each farm. Commercial houses at farm 1 consisted of
four 152-m-long feed lines equipped with 192 feed pans per line. Eight regions were created in order to
define nutrient segregation. Each region consisted of 24 feed pans, with region 1 starting at the feed hopper
and region 8 ending at the feed line motor. In the diagram, a single feed pan represents six feed pans. The
152-m-long commercial house at farm 2 consisted of two rows of split (middle house fed) feed lines,
creating four 76-m-long feed lines with 95 feed pans per line. Feed was augered into centrally located feed
hoppers and pulled to either end of the house. Each region consisted of 12 feed pans, once again with
region 1 starting at the feed hopper and region 8 ending at the feed line motor. Arrows indicate feed flow
direction at each farm.

51
Table 2-1. Descriptive feed quality analysis1 of broiler finisher feed.
1Descriptive feed quality analyses were conducted at Penn State Poultry Education and Research Center following
feed manufacturing and prior to feed transport to cooperator farms. 2Percentage of pellets was determined using a modified particle size separator (Modified Penn State Particle
Separator, Agricultural and Biological Engineering Department, University Park, PA) fitted with a No. 5 American
Society for Testing and Materials screen. 3PDI= pellet durability index; percentage was determined by inserting 500-g samples of sifted pellets into a P:Fost
tumbler (Seedburo Equipment Co., Des Plaines, IL). Samples tumbled for 10 min at 50 rpm. After tumbling, the
sample was sifted and weighed. 4MPDI = modified pellet durability index; percentage was determined similar to PDI but was modified by adding 5
hexagonal nuts to the 500-g samples prior to tumbling. 5NHPT=Pellet survivability was determined by placing 100-g samples of sifted pellets into the New Holmen Pellet
Tester (NHPT100; TekPro Ltd., North Walsham, Norfolk, UK). The pellets were subjected to air flow for 30 sec
within the test chamber. The surviving pellets were then removed and weighed.
Feed Treatment Pellets2
(%)
PDI3
(%)
MPDI4
(%)
NHPT5
(%)
Poor Pellet Quality (PPQ) 67.2 85.2 79.3 76.2
Improved Pellet Quality (IPQ) 78.0 85.3 80.1 78.6

52
Figure 2-2. Descriptive depiction of percentage of pellets in feed pans across 152-m feed lines. Percentage of pellets was
determined using a modified particle size separator (Modified Penn State Particle Separator, Agricultural and Biological
Engineering Department, University Park, PA) fitted with a No. 5 American Society for Testing and Materials screen. For each
experiment, the percentage of pellets in feed pans across the 152-m feed line have been fitted with trendlines to describe general
feed flow trends.
40
45
50
55
60
65
70
75
1 5 9
13
17
21
25
29
33
37
41
45
49
53
57
61
65
69
73
77
81
85
89
93
97
101
105
109
113
117
121
125
129
133
137
141
145
149
153
157
161
165
169
173
177
181
185
189
193
% P
elle
ts
Feed Pan #
Exp1 (PPQ - 152 m)
Exp2 (IPQ - 152 m)
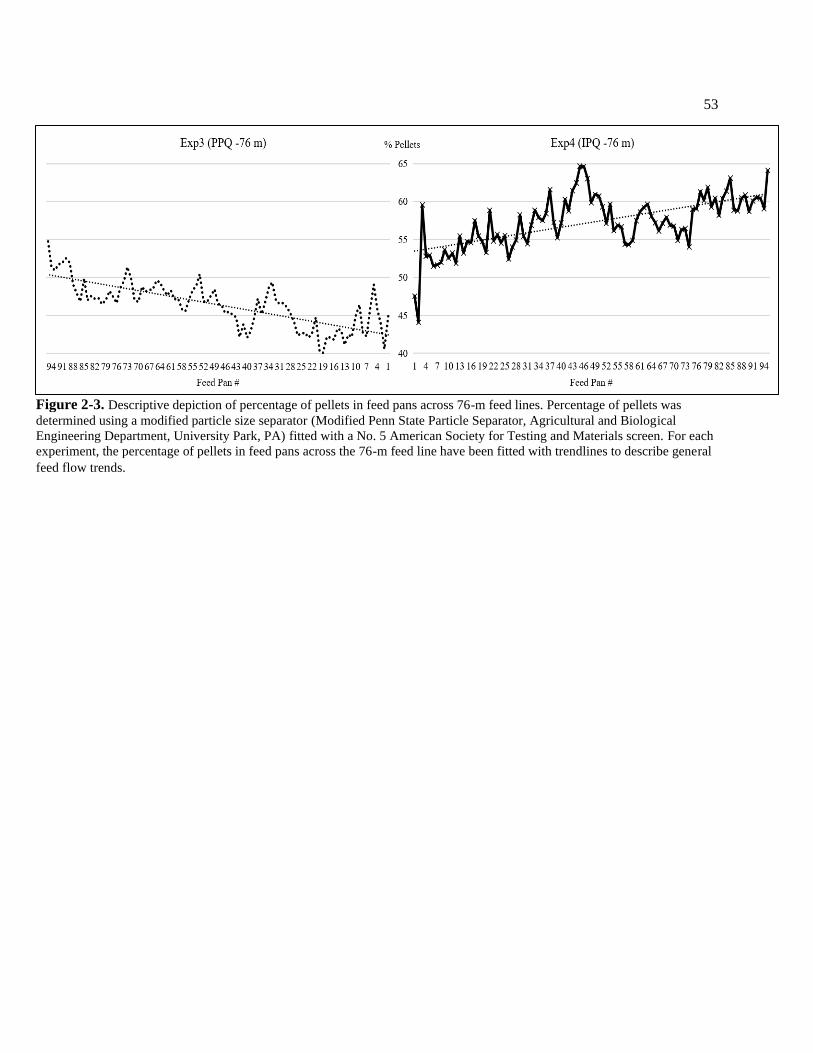
53
Figure 2-3. Descriptive depiction of percentage of pellets in feed pans across 76-m feed lines. Percentage of pellets was
determined using a modified particle size separator (Modified Penn State Particle Separator, Agricultural and Biological
Engineering Department, University Park, PA) fitted with a No. 5 American Society for Testing and Materials screen. For each
experiment, the percentage of pellets in feed pans across the 76-m feed line have been fitted with trendlines to describe general
feed flow trends.

54
Table 2-2. Effects of PPQ feed on nutrient1 segregation across eight regions of a 152-m feed line (Exp1 PPQ-152m).
a-eMeans within a column with no common superscripts differ significantly (P<0.05). 1Nutrients were analyzed at the University of Missouri Agricultural Experiment Station Chemical Laboratory. Amino acid concentrations were analyzed
using AOAC 994.12. Phytase activity was analyzed using AOAC 2000.12. 2Each region of the feed line was composed of 24 feed pans with region 1 starting at the feed hopper and region 8 ending at the feed line motor. 3NHPT=Pellet survivability was determined by placing 100-g samples of sifted pellets into the New Holmen Pellet Tester (NHPT100; TekPro Ltd., North
Walsham, Norfolk, UK). The pellets were subjected to air flow for 30 sec within the test chamber. The surviving pellets were then removed and weighed. 4Pellets=Percentage of pellets determined using a modified particle size separator (Modified Penn State Particle Separator, Agricultural and Biological
Engineering Department, University Park, PA) fitted with a No. 5 American Society for Testing and Materials screen.
Treatment Region2 Asp
(%)
Thr
(%)
Glu
(%)
Pro
(%)
Gly
(%)
Ala
(%)
Cys
(%)
Val
(%)
Met
(%)
Ile
(%)
Leu
(%)
Lys
(%)
Phytase
(FTU/kg)
NHPT3
(%)
Pellets4
(%)
Poor
Pellet
Quality
1 1.715cd 0.689 3.110c 1.101 0.746b 0.967b 0.338 0.886 0.531 0.767 1.598c 1.027b 487a 72.61a 52.8bcd
2 1.832abc 0.758 3.361b 1.140 0.788ab 1.006ab 0.340 0.896 0.519 0.811 1.683ab 1.104ab 392ab 70.74ab 55.7a
3 1.772bcd 0.727 3.243bc 1.134 0.766ab 0.995ab 0.341 0.912 0.527 0.793 1.657abc 1.082ab 263bc 69.66bc 54.8ab
4 1.854ab 0.756 3.383ab 1.163 0.797a 1.021a 0.348 0.917 0.530 0.824 1.710a 1.121a 366abc 70.90ab 53.7abc
5 1.707d 0.719 3.146c 1.111 0.751b 0.979b 0.335 0.883 0.511 0.766 1.613bc 1.032b 376abc 70.34bc 54.2ab
6 1.888ab 0.771 3.412ab 1.169 0.808a 1.029a 0.349 0.923 0.543 0.838 1.724a 1.151a 242c 69.49bc 50.5de
7 1.783bcd 0.713 3.279bc 1.142 0.768ab 0.995ab 0.343 0.913 0.513 0.800 1.664abc 1.087ab 311bc 69.17bc 51.4cde
8 1.914a 0.755 3.541a 1.164 0.809a 1.026a 0.347 0.920 0.532 0.834 1.726a 1.134a 272bc 68.51c 49.8e
ANOVA P-Value 0.0191 0.1650 0.0022 0.1714 0.0381 0.0474 0.6914 0.7004 0.1581 0.0909 0.0324 0.0355 0.0197 0.0158 0.0016
LSD 0.1219 0.0639 0.1770 0.0568 0.0438 0.0409 0.0189 0.0592 0.0238 0.0563 0.0828 0.0780 136.29 2.05 2.74
SEM 0.0402 0.0211 0.0583 0.0187 0.0144 0.0135 0.0062 0.0195 0.0079 0.0186 0.0273 0.0257 46.34 0.6998 0.9304

55
Table 2-3. Effects of IPQ feed on nutrient1 segregation across eight regions of a 152-m feed line (Exp2 IPQ-152m).
a-dMeans within a column with no common superscripts differ significantly (P<0.05). 1Nutrients were analyzed at the University of Missouri Agricultural Experiment Station Chemical Laboratory. Amino acid concentrations were analyzed
using AOAC 994.12. Phytase activity was analyzed using AOAC 2000.12. 2Each region of the feed line was composed of 24 feed pans with region 1 starting at the feed hopper and region 8 ending at the feed line motor. 3NHPT=Pellet survivability was determined by placing 100-g samples of sifted pellets into the New Holmen Pellet Tester (NHPT100; TekPro Ltd., North
Walsham, Norfolk, UK). The pellets were subjected to air flow for 30 sec within the test chamber. The surviving pellets were then removed and weighed. 4Pellets=Percentage of pellets determined using a modified particle size separator (Modified Penn State Particle Separator, Agricultural and Biological
Engineering Department, University Park, PA) fitted with a No. 5 American Society for Testing and Materials screen.
Treatment Region2 Asp
(%)
Thr
(%)
Glu
(%)
Pro
(%)
Gly
(%)
Ala
(%)
Cys
(%)
Val
(%)
Met
(%)
Ile
(%)
Leu
(%)
Lys
(%)
Phytase
(FTU/kg)
NHPT3
(%)
Pellets4
(%)
Improved
Pellet
Quality
1 1.768c 0.800 3.257c 1.134 0.765 0.995 0.338 0.904 0.541 0.794 1.648 1.077 310 83.07ab 62.70
2 1.828bc 0.754 3.337bc 1.154 0.785 1.010 0.342 0.897 0.536 0.815 1.698 1.086 369 83.20a 65.63
3 1.782c 0.866 3.258c 1.144 0.771 1.002 0.344 0.933 0.516 0.803 1.667 1.083 273 82.67abc 65.60
4 1.850abc 0.752 3.389bc 1.156 0.793 1.019 0.344 0.918 0.540 0.825 1.713 1.141 341 82.44abc 63.84
5 1.913ab 0.747 3.463ab 1.189 0.811 1.035 0.353 0.977 0.526 0.851 1.731 1.130 251 81.35c 62.99
6 1.896ab 0.777 3.454ab 1.172 0.806 1.031 0.347 0.927 0.525 0.835 1.729 1.112 253 81.59abc 63.39
7 1.871abc 0.746 3.410bc 1.176 0.806 1.036 0.358 0.968 0.531 0.840 1.726 1.121 238 81.44bc 63.76
8 1.950a 0.777 3.612a 1.177 0.820 1.041 0.356 0.944 0.541 0.848 1.750 1.137 232 79.39d 61.65
ANOVA P-Value 0.0464 0.6715 0.0128 0.1412 0.1480 0.1857 0.4922 0.1173 0.6292 0.2217 0.0709 0.3266 0.2807 0.0023 0.1805
LSD 0.1138 0.1466 0.1776 0.0411 0.0432 0.0431 0.0218 0.0601 0.0321 0.0501 0.0673 0.0688 129.59 1.669 3.156
SEM 0.0375 0.0483 0.0586 0.0135 0.0142 0.0132 0.0072 0.0198 0.0106 0.0165 0.0222 0.0222 44.064 0.568 1.073
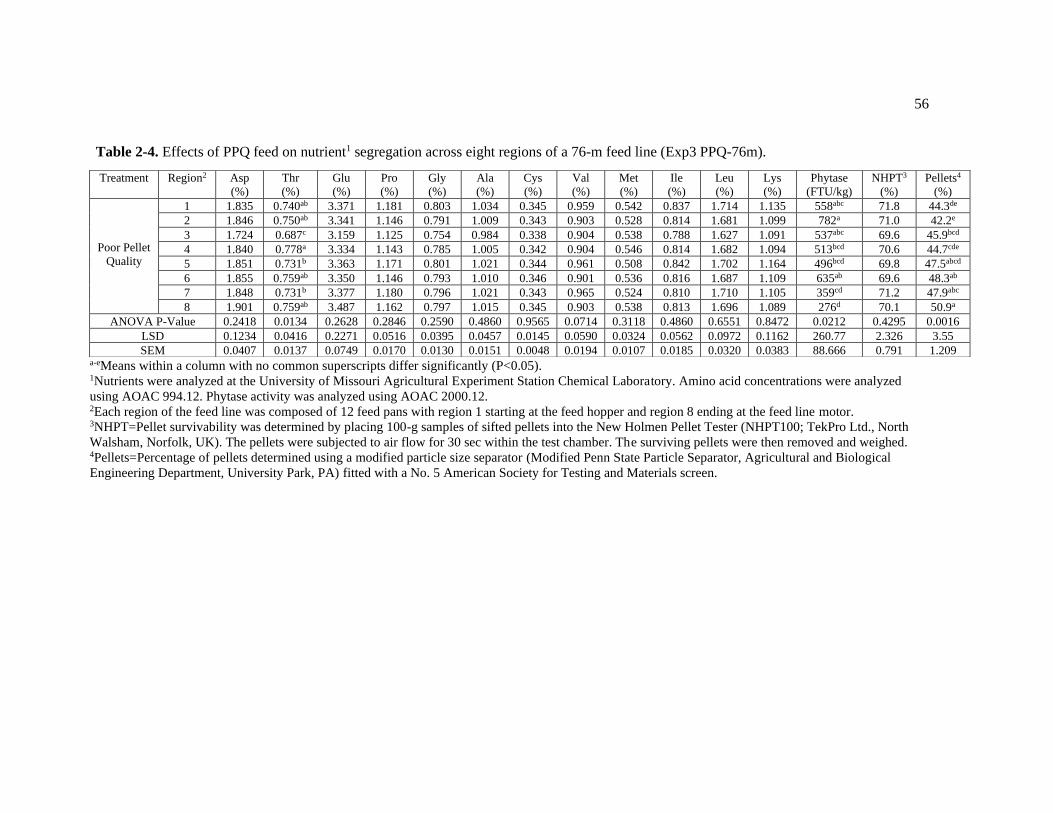
56
Table 2-4. Effects of PPQ feed on nutrient1 segregation across eight regions of a 76-m feed line (Exp3 PPQ-76m).
a-eMeans within a column with no common superscripts differ significantly (P<0.05). 1Nutrients were analyzed at the University of Missouri Agricultural Experiment Station Chemical Laboratory. Amino acid concentrations were analyzed
using AOAC 994.12. Phytase activity was analyzed using AOAC 2000.12. 2Each region of the feed line was composed of 12 feed pans with region 1 starting at the feed hopper and region 8 ending at the feed line motor. 3NHPT=Pellet survivability was determined by placing 100-g samples of sifted pellets into the New Holmen Pellet Tester (NHPT100; TekPro Ltd., North
Walsham, Norfolk, UK). The pellets were subjected to air flow for 30 sec within the test chamber. The surviving pellets were then removed and weighed. 4Pellets=Percentage of pellets determined using a modified particle size separator (Modified Penn State Particle Separator, Agricultural and Biological
Engineering Department, University Park, PA) fitted with a No. 5 American Society for Testing and Materials screen.
Treatment Region2 Asp
(%)
Thr
(%)
Glu
(%)
Pro
(%)
Gly
(%)
Ala
(%)
Cys
(%)
Val
(%)
Met
(%)
Ile
(%)
Leu
(%)
Lys
(%)
Phytase
(FTU/kg)
NHPT3
(%)
Pellets4
(%)
Poor Pellet
Quality
1 1.835 0.740ab 3.371 1.181 0.803 1.034 0.345 0.959 0.542 0.837 1.714 1.135 558abc 71.8 44.3de
2 1.846 0.750ab 3.341 1.146 0.791 1.009 0.343 0.903 0.528 0.814 1.681 1.099 782a 71.0 42.2e
3 1.724 0.687c 3.159 1.125 0.754 0.984 0.338 0.904 0.538 0.788 1.627 1.091 537abc 69.6 45.9bcd
4 1.840 0.778a 3.334 1.143 0.785 1.005 0.342 0.904 0.546 0.814 1.682 1.094 513bcd 70.6 44.7cde
5 1.851 0.731b 3.363 1.171 0.801 1.021 0.344 0.961 0.508 0.842 1.702 1.164 496bcd 69.8 47.5abcd
6 1.855 0.759ab 3.350 1.146 0.793 1.010 0.346 0.901 0.536 0.816 1.687 1.109 635ab 69.6 48.3ab
7 1.848 0.731b 3.377 1.180 0.796 1.021 0.343 0.965 0.524 0.810 1.710 1.105 359cd 71.2 47.9abc
8 1.901 0.759ab 3.487 1.162 0.797 1.015 0.345 0.903 0.538 0.813 1.696 1.089 276d 70.1 50.9a
ANOVA P-Value 0.2418 0.0134 0.2628 0.2846 0.2590 0.4860 0.9565 0.0714 0.3118 0.4860 0.6551 0.8472 0.0212 0.4295 0.0016
LSD 0.1234 0.0416 0.2271 0.0516 0.0395 0.0457 0.0145 0.0590 0.0324 0.0562 0.0972 0.1162 260.77 2.326 3.55
SEM 0.0407 0.0137 0.0749 0.0170 0.0130 0.0151 0.0048 0.0194 0.0107 0.0185 0.0320 0.0383 88.666 0.791 1.209

57
Table 2-5. Effects of IPQ feed on nutrient1 segregation across eight regions of a 76-m feed line (Exp4 IPQ-76m).
a-cMeans within a column with no common superscripts differ significantly (P<0.05). 1Nutrients were analyzed at the University of Missouri Agricultural Experiment Station Chemical Laboratory. Amino acid concentrations were analyzed
using AOAC 994.12. Phytase activity was analyzed using AOAC 2000.12. 2Each region of the feed line was composed of 12 feed pans with region 1 starting at the feed hopper and region 8 ending at the feed line motor. 3NHPT=Pellet survivability was determined by placing 100-g samples of sifted pellets into the New Holmen Pellet Tester (NHPT100; TekPro Ltd., North
Walsham, Norfolk, UK). The pellets were subjected to air flow for 30 sec within the test chamber. The surviving pellets were then removed and weighed. 4Pellets=Percentage of pellets determined using a modified particle size separator (Modified Penn State Particle Separator, Agricultural and Biological
Engineering Department, University Park, PA) fitted with a No. 5 American Society for Testing and Materials screen.
Treatment Region2 Asp
(%)
Thr
(%)
Glu
(%)
Pro
(%)
Gly
(%)
Ala
(%)
Cys
(%)
Val
(%)
Met
(%)
Ile
(%)
Leu
(%)
Lys
(%)
Phytase
(FTU/kg)
NHPT3
(%)
Pellets4
(%)
Improved
Pellet
Quality
1 1.886 0.748 3.433 1.194 0.814 1.032 0.348 0.974 0.520 0.854 1.718 1.158 478 83.4 51.9c
2 1.886 0.775 3.406 1.168 0.802 1.023 0.344 0.915 0.554 0.827 1.712 1.104 292 82.8 55.2bc
3 1.832 0.720 3.335 1.170 0.786 1.015 0.340 0.941 0.540 0.826 1.679 1.124 443 83.0 56.2abc
4 1.938 0.784 3.492 1.187 0.823 1.042 0.353 0.942 0.539 0.858 1.754 1.152 333 83.4 60.5a
5 1.849 0.740 3.380 1.181 0.804 1.029 0.343 0.957 0.523 0.838 1.704 1.120 453 83.5 57.4ab
6 1.866 0.766 3.380 1.163 0.802 1.022 0.345 0.921 0.539 0.829 1.704 1.102 346 83.2 58.0ab
7 1.815 0.732 3.321 1.164 0.787 1.013 0.343 0.945 0.500 0.826 1.686 1.101 487 83.4 59.3ab
8 1.911 0.770 3.515 1.176 0.802 1.026 0.349 0.912 0.539 0.822 1.718 1.145 264 82.5 60.5a
ANOVA P-Value 0.2418 0.5718 0.0561 0.6869 0.9076 0.6669 0.8999 0.8372 0.2247 0.1793 0.6415 0.7103 0.6584 0.2967 0.5743
LSD 0.1234 0.135 0.0421 0.2549 0.0561 0.0445 0.0452 0.0183 0.0521 0.0382 0.0482 0.0857 0.0831 227.07 1.095
SEM 0.0407 0.0445 0.0139 0.0840 0.0185 0.0147 0.0149 0.0060 0.0172 0.0126 0.0159 0.0283 0.0274 77.209 0.372

58
Table 2-6. Pellet quality means after augering feed through a 152-m feed line.
1Student’s t-tests P-Value 2NHPT=Pellet survivability was determined by placing 100-g samples of sifted pellets into the New Holmen Pellet Tester (NHPT100; TekPro Ltd., North
Walsham, Norfolk, UK). The pellets were subjected to air flow for 30 sec within the test chamber. The surviving pellets were then removed and weighed. 3Pellets=Percentage of pellets determined using a modified particle size separator (Modified Penn State Particle Separator, Agricultural and Biological
Engineering Department, University Park, PA) fitted with a No. 5 American Society for Testing and Materials screen.
Pellet Quality Means Asp
(%)
Thr
(%)
Glu
(%)
Pro
(%)
Gly
(%)
Ala
(%)
Cys
(%)
Val
(%)
Met
(%)
Ile
(%)
Leu
(%)
Lys
(%)
Phytase
(FTU/kg)
NHPT2
(%)
Pellets3
(%)
Poor Pellet Quality 1.808 0.736 3.309 1.141 0.779 1.002 0.343 0.906 0.526 0.804 1.672 1.092 388.63 70.18 52.88
Improved Pellet Quality 1.857 0.777 3.397 1.163 0.795 1.021 0.348 0.933 0.532 0.826 1.708 1.111 283.40 81.89 63.69
P-Value1 0.0900 0.0667 0.0589 0.0488 0.0966 0.0365 0.1145 0.0481 0.2354 0.0671 0.0369 0.2567 0.0088 <0.0001 <0.0001
PPQ SD 0.076 0.028 0.141 0.025 0.025 0.022 0.005 0.016 0.011 0.028 0.048 0.045 98.306 1.274 2.107
IPQ SD 0.063 0.040 0.117 0.019 0.020 0.017 0.007 0.028 0.009 0.021 0.035 0.026 51.027 1.247 1.368

59
Table 2-7. Pellet quality means after augering feed through a 76-m feed line.
1Student’s t-tests P-Value 2NHPT=Pellet survivability was determined by placing 100-g samples of sifted pellets into the New Holmen Pellet Tester (NHPT100; TekPro Ltd., North
Walsham, Norfolk, UK). The pellets were subjected to air flow for 30 sec within the test chamber. The surviving pellets were then removed and weighed. 3Pellets=Percentage of pellets determined using a modified particle size separator (Modified Penn State Particle Separator, Agricultural and Biological
Engineering Department, University Park, PA) fitted with a No. 5 American Society for Testing and Materials screen.
Pellet Quality Means Asp
(%)
Thr
(%)
Glu
(%)
Pro
(%)
Gly
(%)
Ala
(%)
Cys
(%)
Val
(%)
Met
(%)
Ile
(%)
Leu
(%)
Lys
(%)
Phytase
(FTU/kg)
NHPT2
(%)
Pellets3
(%)
Poor Pellet Quality 1.838 0.742 3.348 1.157 0.790 1.012 0.343 0.925 0.532 0.821 1.688 1.111 519.31 70.47 46.45
Improved Pellet Quality 1.873 0.754 3.408 1.175 0.803 1.025 0.346 0.938 0.532 0.835 1.710 1.126 386.96 83.13 57.39
P-Value1 0.0802 0.0136 0.0604 0.0310 0.0551 0.0467 0.1308 0.0928 0.9041 0.0717 0.0776 0.2588 0.0874 <0.0001 <0.0001
PPQ SD 0.050 0.027 0.090 0.020 0.016 0.015 0.002 0.030 0.012 0.018 0.027 0.026 155.701 0.813 2.725
IPQ SD 0.041 0.023 0.069 0.011 0.012 0.009 0.004 0.021 0.017 0.014 0.023 0.023 88.226 0.252 2.897

60
Table 2-8. Feed line length means using PPQ feed.
1Student’s t-tests P-Value 2NHPT=Pellet survivability was determined by placing 100-g samples of sifted pellets into the New Holmen Pellet Tester (NHPT100; TekPro Ltd., North
Walsham, Norfolk, UK). The pellets were subjected to air flow for 30 sec within the test chamber. The surviving pellets were then removed and weighed. 3Pellets=Percentage of pellets determined using a modified particle size separator (Modified Penn State Particle Separator, Agricultural and Biological
Engineering Department, University Park, PA) fitted with a No. 5 American Society for Testing and Materials screen.
Feed Line
Length Means
Asp
(%)
Thr
(%)
Glu
(%)
Pro
(%)
Gly
(%)
Ala
(%)
Cys
(%)
Val
(%)
Met
(%)
Ile
(%)
Leu
(%)
Lys
(%)
Phytase
(FTU/kg)
NHPT2
(%)
Pellets3
(%)
152 m 1.808 0.736 3.309 1.141 0.779 1.002 0.343 0.906 0.526 0.804 1.672 1.092 388.63 70.18 52.88
76 m 1.838 0.742 3.348 1.157 0.790 1.012 0.343 0.925 0.532 0.821 1.688 1.111 519.31 70.47 46.45
P-Value1 0.2848 0.5562 0.4565 0.2716 0.3377 0.3877 0.7468 0.2473 0.0485 0.2847 0.4914 0.4596 0.0308 0.4286 0.00561
152 m SD 0.076 0.028 0.141 0.025 0.025 0.022 0.005 0.016 0.011 0.028 0.048 0.045 98.306 1.274 2.107
76 m SD 0.050 0.027 0.090 0.020 0.016 0.015 0.002 0.030 0.012 0.018 0.027 0.026 155.701 0.813 2.725

61
Table 2-9. Feed line length means using IPQ feed.
1Student’s t-tests P-Value 2NHPT=Pellet survivability was determined by placing 100-g samples of sifted pellets into the New Holmen Pellet Tester (NHPT100; TekPro Ltd., North
Walsham, Norfolk, UK). The pellets were subjected to air flow for 30 sec within the test chamber. The surviving pellets were then removed and weighed. 3Pellets=Percentage of pellets determined using a modified particle size separator (Modified Penn State Particle Separator, Agricultural and Biological
Engineering Department, University Park, PA) fitted with a No. 5 American Society for Testing and Materials screen.
Feed Line
Length Means
Asp
(%)
Thr
(%)
Glu
(%)
Pro
(%)
Gly
(%)
Ala
(%)
Cys
(%)
Val
(%)
Met
(%)
Ile
(%)
Leu
(%)
Lys
(%)
Phytase
(FTU/kg)
NHPT2
(%)
Pellets3
(%)
152 m 1.857 0.777 3.397 1.163 0.795 1.021 0.348 0.933 0.532 0.826 1.708 1.111 283.40 81.89 63.69
76 m 1.873 0.754 3.408 1.175 0.803 1.025 0.346 0.938 0.532 0.835 1.710 1.126 386.96 83.13 57.39
P-Value1 0.5531 0.2806 0.7955 0.1995 0.3863 0.5889 0.5169 0.6894 0.9713 0.4264 0.9105 0.2418 0.0362 0.0294 0.0014
152 m SD 0.063 0.040 0.117 0.019 0.020 0.017 0.007 0.028 0.009 0.021 0.035 0.026 51.027 1.247 1.368
76 m SD 0.041 0.023 0.069 0.011 0.012 0.009 0.004 0.021 0.017 0.014 0.023 0.023 88.226 0.252 2.897

62
Chapter 3
EFFECTS OF AMINO ACID DENSITY AND PELLET QUALITY ON
BROILER PERFORMANCE AND CARCASS CHARACTERISTICS
ABSTRACT
Nutrient segregation may affect bird performance and BW uniformity, yet this idea has
not been extensively investigated. The benefits of feeding diets with high amino acid (AA)
concentrations on broiler performance is well documented. Increasing pellet-to-fine ratios (P:F)
has also been reported to elicit improvements in bird performance and processing parameters.
However, research has not studied the effects of varying AA density and P:F on broiler
performance in parallel. The objective of this study was to investigate the effects of diets varying
in AA density and PQ on broiler performance and subsequent processing parameters from d1-42.
Diets were provided to broilers in 3 phases from 0 to 14, 14 to 28, and 28 to 42 d of age, in which
treatments of standard and reduced AA densities were used. Starter diets were fed as crumbles
and differed only in AA density. Grower and finisher diets varying in AA density were
manufactured to consist of approximately 80% pellets and 20% fines, of which a calculated
portion was ground to create three treatments varying in P:F (80:20; 65:35; and 50:50) for each
AA density. Feeding diets with reduced AA density decreased BW (P<0.05) and increased FCR
(P<0.05) compared to feeding diets with standard AA density during all growth periods. Male
broilers fed diets with standard AA density exhibited greater breast yield (P=0.0007) compared to
males provided diets with reduced AA concentrations. For the main effect of PQ, birds fed the
80:20 diet from d 14-28 displayed superior LWG (P=0.051) and increased FI (P=0.012)
compared to birds fed the 50:50 diet. It should be noted that the birds in the study experienced a
63
health challenge in the latter phases of production. These data suggest that broilers are more
sensitive to dietary AA density than P:F.
INTRODUCTION
The range of performance benefits associated with providing pelleted feed to broilers is
well documented (Patton et al., 1937; Jensen et al., 1962; Nir et al., 1994; Behnke, 1996).
Increasing the magnitude of these benefits can be achieved by employing feed manufacturing
techniques that improve pellet durability and decrease the percentage of fines in the complete
feed. Improving pellet quality (PQ) may also reduce nutrient segregation (Scheideler, 1991;
Behnke, 1996; Moritz, 2013; Wamsley, 2014; Sellers et al., 2020), yet the impact of nutrient
segregation on bird performance is not well documented. Segregation of feed particles and
nutrients due to feed augering in commercial barns may result in an uneven distribution of pellets
and nutrients throughout the feed line, subsequently affecting BW uniformity (Sellers et al., 2020;
Poholsky et al., 2021). In a series of field trials, phytase segregation was prominent after augering
feed through commercial feed lines, especially in diets where it was applied post pelleting
(Moritz, 2013; Wamsley, 2014). Recently, Sellers et al. (2020) analyzed phytase activity
segregation and its impact on broiler performance in a commercial barn. These authors concluded
that feed augering led to phytase and feed particle segregation, consequently affecting d56 BW
uniformity. However, this study did not consider the segregation of nutrients, it only considered
phytase segregation. Additional efforts to describe the effects of nutrient segregation on broiler
performance is paramount to provide poultry integrators justification for adopting feed
manufacturing techniques that improve PQ.
Previous research has determined the effects of pellet-to-fine ratio (P:F) on bird
performance. Corzo and colleagues (2011) fed broilers diets consisting of 100% mash, 32%
64
pellets, and 64% pellets. When comparing performance and processing variables, these authors
reported that birds fed the diet containing 64% pellets exhibited superior performance compared
to birds fed the diet containing 32% pellets. Similarly, Lilly and coauthors (2011) observed
increased FI and LWG, as well as decreased FCR in broilers when the percentage of pellets was
increased in the diet. A linear model was constructed by these researchers which described a 10-g
improvement in broiler carcass weight for every 10 percentage-point increase in pellets. Overall,
this work emphasizes the need to provide more pellets in the diet, however, P:F used in previous
research (P:F≥90:10) may not be attainable in commercial feed mills. Thus, there is a need to
determine if incremental enhancements to broiler performance can be achieved when reasonable
improvements in PQ are made.
Amino acids (AA) represent a major but critical cost in the formulation of poultry diets.
AA density must be appropriate for maximizing poultry performance and profitability.
Previously, research focused on optimizing dietary AA density to enhance bird performance
(Kerr et al., 1999; Kidd et al., 2004; Dozier et al., 2006; Dozier et al., 2007). Kerr and associates
(1999) reported significant improvements in BW and breast yield for male broilers fed diets
formulated to 113% of the NRC lysine recommendations (NRC, 1994) compared to birds fed
diets containing lower levels of lysine. Corzo et al. (2004) found that increasing amino acid
density until 35 d of age resulted in birds with improved growth and feed efficiency. Furthermore,
flock uniformity decreased when dietary amino acid concentrations were reduced. These results
are supported by Dozier et al. (2006) who concluded that providing broilers diets high in AA
density during early growth periods improved growth performance and meat yield. Recently, it
was reported that increasing the concentration of digestible essential AA by 20% led to a 5.75%
increase in breast yield compared to broilers fed a standard AA density (Johnson et al., 2020).
Previously cited research has investigated the effects of varying PQ and AA density on
broiler performance independently. There is currently no data that describes a relationship

65
between P:F and AA density. Thus, the aim of this experiment was to investigate the effects of
diets varying in AA density and PQ in terms of P:F on broiler performance and subsequent
processing parameters during a 42-d production period.
MATERIALS AND METHODS
Diet Compositions and Feed Manufacturing
All diets were manufactured at a commercial feed mill (Wenger Feeds, Spring Glen, PA)
and delivered to Penn State’s Poultry Education and Research Center (PERC). Experimental
treatments were arranged in a 2 x 3 factorial varying in AA density (standard or reduced) and PQ
(high, moderate, or low). The standard and reduced AA diets were manufactured for each growth
phase using techniques to produce feed with high PQ. The standard AA diets were formulated in
accordance with Cobb-Vantress (Siloam Springs, AR) broiler recommendations. The reduced AA
diets were formulated to 90% of the digestible lysine recommendation provided by Cobb-
Vantress. All other amino acids were formulated using suggested ratios relative to digestible
lysine. Diet formulations and calculated nutrients are presented in Table 3-1 while analyzed
nutrients are presented in Table 3-2. Starter diets were fed as crumbles to birds from d 0-14.
Therefore, PQ effects were only considered from 15-42 d of age.
The standard AA grower and finisher diets were sacked and split into three equal
allotments. Feed from each allotment was passed through a modified particle size separator
(Modified Penn State Particle Separator, Agricultural and Biological Engineering Department,
University Park, PA) fitted with a No. 5 ASTM screen to determine P:F. The same procedures
were utilized to determine the P:F of reduced AA feed. These data along with other feed quality
descriptors for experimental diets are presented in Table 3-3. To create treatments differing in

66
PQ, each of the aforementioned allotments were manipulated. The high pellet quality (HPQ)
treatment consisted of 80% pellets and 20% fines and was manipulated by mixing for 90 s. To
create the moderate pellet quality (MPQ; 65% pellets and 35% fines) and low pellet quality
(LPQ; 50 % pellets and 50% fines) treatments, calculated portions of the HPQ feed were ground
using a hammer mill, and calculated amounts of pelleted feed and ground feed were mixed for 90
s. Degradation of pellets by approximately 3% during mixing was taken into account for all
treatments. Actual P:F after mixing were determined by sifting 90.72-kg of feed for each
treatment (Table 3-3).
Bird Husbandry
A total of 2,592 Cobb x Cobb 500 straight run broiler chicks were obtained from a
commercial hatchery (Longenecker’s Hatchery Inc., Elizabethtown, PA), vaccinated for Merek’s
disease, and randomly distributed across 72 floor pens (36 chicks/pen). A total of 6 treatments
and 12 replicate pens/treatment were utilized in the experiment. Experimental pens contained
fresh shavings, nipple drinkers, and a single hanging feeder. Feed and water were available to the
birds ad libitum. The photoperiod began at 24:0 h L:D from d0-3 and decreased to 20:4 h L:D
from d4-7. From d8-28 the photoperiod was 18:6 h L:D and increased to 20:4 h L:D from d29-42.
Light intensity started at 20 lux and was decreased to 8 lux from d7-42. Birds were cared for
according to Penn State University’s Animal Care and Use Committee Guidelines
(PROTO201900881).
67
Measurements
Pen weights and feed consumption were obtained at 14, 28, and 42 d of age. On d42,
birds were phenotypically separated by sex in each pen and were individually weighed to
calculate average male and female weights. In addition, 1 male and 1 female per pen (144 birds
total) within 0.05-kg of the average pen weight were wing tagged for processing measurements.
Mortality was collected and recorded daily, and feed conversion was corrected in all phases by
adjusting for mortality weight.
Processing measurements were collected on d43 at the PERC pilot processing plant. On
d43, tagged birds were weighed, hung by their feet in steel shackles, rendered unconscious using
an electrical stun knife (Midwest Processing Systems, Eden Prairie, Minnesota) and
exsanguinated. Following exsanguination, birds were scalded in a SuperScald Rotary Scalder
(Brower Equipment, Houghton, Iowa) at a temperature of 60°C for 30 s. Feathers were removed
with an Ashley Sure Pick machine (Ashley Machine, Greensburg, Indiana) and carcasses were
manually eviscerated. Following evisceration and deboning, hot carcass and boneless-skinless
breast weights were recorded.
Statistical Analysis
Treatments were arranged in a 2 (AA density) x 3 (PQ) factorial within a randomized
complete block design that included 12 replicate pens per treatment. Blocks corresponded to pen
location in the experimental barns. A pen of 36 broilers was considered an experimental unit. The
main effects of AA density and PQ were determined, as well as interactions. Statistical analysis
was performed via the GLM procedure of SAS version 9.4. (SAS Inst. Inc., Cary, NC). A post

68
hoc Fisher’s least significant difference test was used to further separate means. Alpha was
designated as 0.05, and letter superscripts denote differences among means.
RESULTS AND DISCUSSION
Starter Phase (d0-14)
Broilers that received a diet with reduced AA density from d0-14 consumed 6-g more
feed compared to those consuming the standard AA dense diet (P=0.035; Table 3-4). Birds
consuming the reduced AA dense diet also exhibited a 6.3-point increase in FCR (P<0.0001), and
a 3.6% reduction in average BW (P=0.012) compared to those fed the standard AA density diets
(Table 3-4). Mortality was unaffected by dietary AA density (P>0.05). Birds were provided
crumbles during the starter period; therefore, PQ was not a factor during this phase. Kidd and
colleagues (2004) reported similar findings when Ross 508 broilers were fed diets varying in AA
density during the starter phase.
Grower Phase (d14-28)
Main effects did not interact during the grower phase (P>0.05). From d14-28, birds
consuming the standard AA density diet exhibited a 2.7% increase in LWG (P=0.004), a 2.9%
increase in BW (P=0.0003), and a 0.024 improvement in FCR (P=0.015; Table 3-5) compared to
birds fed the reduced AA density diet. Mortality was not impacted by AA density (P>0.05).
Corzo and cohorts (2010) described similar results when evaluating the effects of AA density on
Cobb x Cobb 500 performance characteristics. These authors reported that birds fed moderate AA
dense diets had higher d28 BW and improved FCR compared to birds fed diets with reduced AA

69
density. In the current study, broilers consuming the reduced AA diet tended to consume more
feed (P=0.054; Table 3-5). An increase in FI may be due to the imbalance in AA. Historically, it
has been thought that poultry alter their feed intake to maintain energy intake (Ferket and Gernat.,
2006; Ravindran, 2012). More recent work suggests that birds may also consume feed to satisfy
AA requirements, supported by increased FI for birds fed reduced AA dense diets during early
growth phases (Dozier and Moran, 2001; Kidd et al., 2004; Kidd et al., 2005; Maynard et al.,
2020).
The PQ means indicate that birds fed the HPQ diet had the greatest FI (P=0.012) and
LWG (P=0.051), while birds fed the LPQ diet had the lowest FI and LWG. Birds fed the MPQ
diet were intermediate for FI and LWG (Table 3-5). These results are supported by Dozier et al.
(2010) who found that broilers fed HPQ diets with PDI of 88.92%, exhibited increased growth
rate and feed consumption during the grower phase compared to those fed LPQ diets with PDI of
66.04%. In contrast, Glover et al. (2016) observed no differences in LWG or FI for broilers fed
grower diets differing in P:F (70% pellets vs. 50% pellets). At d28, strong trends were observed
for average BW, resulting in the HPQ treatment improving BW compared to birds consuming
either the MPQ or LPQ diets (P=0.055). During the 14-28 d period, PQ did not affect FCR or
mortality. As noted by Poholsky et al. (2021), augering feed through commercial broiler barns
contributes to P:F variability throughout the house. Based on BW results from the current study,
birds consuming higher quality pellets may exhibit enhanced performance compared to birds
consuming less pellets.
Finisher Phase (d28-42)
It should be noted that broilers contracted infectious bronchitis and a secondary E. coli
infection during the d 28-42 Finisher period. This was diagnosed and verified by Penn State’s

70
Animal Diagnostics Lab. Antibiotic treatment was not available at the time of the experiment.
Finisher period results are provided but were influenced by the aforementioned health challenges.
Main effects did not interact (P>0.05; Table 3-6). Males and females were separated;
therefore, the following data will be presented by sex and on average, as a pen. Both male and
female broilers fed the standard AA density diet exhibited higher d 42 BW (P=0.001 and
P=0.039, respectively) compared to those fed the reduced AA density diet. The pen average BW
was reduced by 84-g (P=0.0002) and FCR worsened by 0.081 (P=0.003) when birds were fed the
reduced AA density diet. During the 28-42 d period, mortality, FI, and LWG were unaffected by
AA density (P>0.05). These results differ from that of Ferguson et al. (1998) who fed birds diets
made up of 11.5 kg/g or 11.3 kg/g of lysine and reported no differences in LWG or BW over a 22
to 43 d growth period. However, these authors observed an increase in FI and FCR when birds
were fed diets with lower concentrations of lysine. Differences between past literature and the
current experiment may be due to broiler strain, AA recommendations at the time of each
experiment, and health status of the animals.
During the 28-42 d period, PQ did not affect live bird performance parameters (P>0.05;
Table 3-6). The benefits of feeding improved PQ include reduced prehension energy expenditure
(Behnke, 1996). Considering the secondary E. coli infection present in these animals, the authors
speculate that the energy required to mount an immune response negated performance benefits
derived from energy partitioning toward muscle accretion. Contradictory to the current study, a 3-
point reduction in d 28-42 FCR for birds fed diets with a P:F of 75:25 compared to birds fed diets
with a P:F ratio of 55:45 was reported by Sellers and colleagues (2020). Data from the current
study coupled with findings from previous work suggests that bird health should be considered
prior to making decisions on improving PQ. Increasing the P:F in the current study did not result
in enhanced live bird performance when birds experienced a health challenge. However, previous

71
work shows that healthy birds exhibit performance improvements when fed more pellets
(Proudfoot and Sefton, 1978; Corzo et al., 2011; Lilly et al., 2011; Lemons and Moritz, 2016).
Table 3-6 shows that PQ affected d 28-42 mortality. Broilers consuming HPQ feed had increased
mortality compared to broilers consuming LPQ feed. Broilers consuming MPQ were intermediate
(P=0.0380). It has been suggested that feed form and amount of pellets consumed may affect
acute death syndrome (Hulan et al., 1980; Proudfoot and Hulan, 1982), characterized by the
incidence of fast-growing poultry unexpectedly dying. Proudfoot and Hulan (1982) observed
increased mortality for birds fed pelleted feed and suggested that a larger number of these birds
experienced acute death syndrome associated with increased BWG and improved FCR.
Necropsies of such birds may reveal a blot clot present in the heart. However, necropsies
performed during the current study did not reveal any evidence of acute death syndrome.
Overall Performance Data (d0-42)
Main effects did not interact from d0-42. Birds fed the standard AA density diet
experienced an 84-g increase in d0-42 LWG (P=0.0002), and a 0.051 improvement in FCR
(P<0.0001) compared to birds fed the reduced AA density diet (Table 3-7). Should nutrient
segregation occur in commercial facilities, birds may receive AA concentrations that are above or
below recommended levels, depending on location in the house. It is well documented that
feeding diets variable in amino acid density contributes to differences in bird performance (Kidd
et al., 1998; Kidd et al., 2004; Corzo et al., 2005; Dozier et al., 2008).
Overall performance results indicate that PQ contributed to differences in FI and
mortality. Birds fed the HPQ diet had the greatest FI, birds fed the LPQ diet had the lowest FI,
and birds fed the MPQ diet were intermediate in FI (P=0.042; Table 3-7). Birds fed the HPQ and
MPQ diets had a greater incidence of mortalities compared to those fed the LPQ diet (P=0.038).

72
The spread of infectious bronchitis and the secondary E. coli challenge likely contributed to
mortality results regardless of PQ. Secondary E. coli infections are responsible for economic
losses in poultry production (Kumar et al., 2004; Alonso et al., 2011) and are documented to
decrease BW and increase FCR (Huff and Ruff, 1982). Data in the present study are not in
agreement with previous P:F research which has reported improvements in bird performance
parameters when increasing the percentage of pellets in the diet (Proudfoot and Sefton, 1978;
Moritz et al., 2001; Dozier et al., 2010; Corzo et al., 2011; Lilly et al., 2011; Glover et al., 2016).
However, these data may contribute to nutritional decision making in the presence of health
challenges.
Processing (d43)
Processing data at d43 revealed that AA density affected male breast yield, where breast
yield was greater by 6.6% (P=0.0007; Table 3-8) for birds fed the standard AA density diet
compared to birds fed the reduced AA density diet. Increasing the inclusion of some essential AA
and dietary protein has been documented to improve breast meat yield (Bartov and Plavnik,
1998). Holsheimer and Ruesink (1993) concluded that lysine intake during the starter period
impacts breast meat accretion. Kidd et al. (1998) found that broilers had increased breast weight
and yield when fed starter and grower diets containing 115% and 125% of 1994 NRC lysine
requirements (NRC, 1994), respectively, compared to birds consuming lower amino acid
concentrations. Amino acid deficiencies affect the amount of tissues synthesized by chicks which
can be detrimental depending on severity of the deficiency (Kubena et al., 1972; Velu et al., 1972;
Sugahara et al., 1984).
Processing parameters were not affected by PQ (P>0.05; Table 3-8). This is contradictory
to work done by Sellers et al. (2017) who observed a 9-g and 13-g increase in carcass weight as

73
percentage of pellets increased from 50% to 60% and 60% to 70%, respectively. In contrast to the
previously mentioned study, Dozier and cohorts (2010) witnessed similar carcass and breast
yields for birds fed either LPQ or HPQ diets. Regarding the current study, E. coli infection likely
contributed to the lack of differences in processing parameters for birds fed diets varying in PQ.
CONCLUSION
This study highlights the importance of proper AA nutrition, indicated by low BW and
poor FCR when birds were fed diets reduced in AA. Current study results suggest that broilers are
more sensitive to dietary AA concentrations than feed form. Moreover, this research provides an
interesting scenario where a health challenge influenced the results of a nutrition study.
Performance deficits due to reduced AA concentrations were still evident when birds were faced
with a significant health challenge. Interestingly, the secondary E. coli infection negated
performance benefits common to improved PQ. These data can still be used to support efficient
poultry production, even when facing health challenges.
ACKNOWLEDGEMENTS
The authors acknowledge The Pennsylvania Poultry Industry Broiler Research Check-Off
Program for their financial support in funding this project.
REFERENCES
Alonso, M. Z., N. L. Padola, A. E. Parma, and P. M. A. Lucchesi. 2011. Enteropathogenic
Escherichia coli contamination at different stages of the chicken slaughtering process.
Poult. Sci. 90:2638-2641.
74
Ashley Sure Pick, Ashley Machine., Greensburg, Indiana.
Bartov, I., and I. Plavnik. 1998. Moderate excess of dietary protein increases breast meat yield of
broiler chicks. Poult. Sci. 77:680-688.
Behnke, K. C., 1996. Feed manufacturing technology: current issues and challenges. Anim. Feed
Sci. and Tech. 62:49-57.
Cobb Broiler Performance & Nutrition Supplement. 2008. Europe, Middle East, Africa version,
Cobb-Vantress Inc., Siloam Springs, AR.
Corzo, A., C. D. McDaniel, M. T. Kidd, E. R. Miller, B. B. Boren, and B. I Fancher. 2004.
Impact of dietary amino acid concentration on growth, carcass yield, and uniformity of
broilers. Australian J. Ag. Res. 55:1133-1138.
Corzo, A., L. Mejia, and R. E. Loar II. 2011. Effect of pellet quality on various broiler production
parameters. J. Appl. Poult. Res. 20:68-74.
Corzo, A., M. W. Schilling, R. E. Loar II, L. Mejia, L. C. G. S. Barbosa, and M. T. Kidd. 2010.
Responses of Cobb× Cobb 500 broilers to dietary amino acid density regimens. J. Appl.
Poult. Res. 19:227-236.
Dozier, W. A., III, M. T. Kidd, A. Corzo, J. Anderson, and S. L. Branton. 2006. Growth
performance, meat yield, and economic responses of broilers provided diets varying in
amino acid density from thirty-six to fifty-nine days of age. J. Appl. Poult. Res. 15:383-
393.
Dozier, W. A., III, M. T. Kidd, A. Corzo, J. Anderson, and S. L. Branton. 2007. Dietary amino
acid responses of mixed-sex broiler chickens from two to four kilograms. J. Appl. Poult.
Res. 16:331–343.
Ferguson, N. S., R. S. Gates, J. L Taraba, A. H. Cantor, A. J. Pescatore, M. J. Ford, and D. J.
Burnham. 1998. The effect of dietary crude protein on growth, ammonia concentration,
and litter composition in broilers. Poult. Sci. 77:1481-1487.
Ferket, P. R., and A. G. Gernat. 2006. Factors that affect feed intake of meat birds: A review. Int.
J. Poult. Sci. 5:905-911.
Glover, B. G., K. L. Foltz, I. Holásková, and J. S. Moritz. 2016. Effects of modest improvements
in pellet quality and experiment pen size on broiler chicken performance. J. Appl. Poult.
Res. 25:21-28.
Holsheimer, J. P., and E. W. Ruesink. 1993. Effect on performance, carcass composition, yield,
and financial return of dietary energy and lysine levels in starter and finisher diets fed to
broilers. Poult. Sci. 72:806-815.
Huff, W. E., and M. D. Ruff. 1982. Eimeria acervulina and Eimeria tenella infections in
ochratoxin A compromised broiler chickens. Poult. Sci. 61:685-692.

75
Hulan, H. W., F. G. Proudfoot, and K. B. McRae. 1980. Effect of vitamins on the incidence of
mortality and acute death syndrome (“flip-over”) in broiler chickens. Poult. Sci. 59:927-
931.
Jensen, L. S., L. H. Merrill, C. V. Reddy, and J. McGinnis. 1962. Observations on eating patterns
and rate of food passage of birds fed pelleted and unpelleted diets. Poult. Sci. 41:1414-
1419.
Johnson, C. A., T. Duong, R. E. Latham, R. B. Shirley, and J. T. Lee. 2020. Increasing amino
acid density improves growth performance and processing yield in Cobb 700× MV
broilers. J. Appl. Poult. Res. 29:465-478.
Kerr, B. J., M. T. Kidd, K. M. Halpin, G. W. McWard, and C. L. Quarles. 1999. Lysine level
increases live performance and breast yield in male broilers. J. Appl. Poult. Res. 8:381-
390.
Kidd, M. T., B. J. Kerr, K. M. Halpin, G. W. McWard, and C. L. Quarles. 1998. Lysine levels in
starter and grower-finisher diets affect broiler performance and carcass traits. J. Appl.
Poult. Res. 7:351-358.
Kidd, M. T., C. D. McDaniel, S. L. Branton, E. R. Miller, B. B. Boren, and B. I. Fancher. 2004.
Increasing amino acid density improves live performance and carcass yields of
commercial broilers. J. Appl. Poult. Res. 13:593-604.
Kubena, L. F., B. D. Lott, J. W. Deaton, F. N. Reece, and J. D. May. 1972. Body composition of
chicks as influenced by environmental temperature and selected dietary factors. Poult.
Sci. 51:517-522.
Kumar, A., N. Jindal, C. L. Shukla, R. K. Asrani, D. R. Ledoux, and G. E. Rottinghaus. 2004.
Pathological changes in broiler chickens fed ochratoxin A and inoculated with
Escherichia coli. Avian Pathology. 33:413-417.
Lemons, M. E., and J. S. Moritz. 2016. The effect of feeder space access and crumble-or pellet-to-
fine ratio on 38-day-old broiler performance. J. Appl. Poult. Res. 25:12-20.
Lilly, K. G. S., C. K. Gehring, K. R. Beaman, P. J. Turk, M. Sperow, and J. S. Moritz. 2011.
Examining the relationships between pellet quality, broiler performance, and bird sex. J.
Appl. Poult. Res. 20:231-239.
Maynard, C. W., R. E. Latham, R. Brister, C. M. Owens, and S. J. Rochell. 2020. Effects of dietary
amino acid regimens on live performance and processing characteristics of Cobb MV× 700
male and female broilers. J. Appl. Poult. Res. 29:64-76.
Modified Penn State Particle Separator, Agricultural and Biological Engineering Department.,
University Park, PA. A modified forage particle size separator was used for this study.
The original forage particle size separator was built by the Agricultural and Biological
Engineering Department at Penn State to meet the requirements of ANSI/ASABE
standard S424. This standard is used to determine the particle size distribution of chopped
forage materials by screening. The original screens and pan were removed from the

76
machine, then the machine was modified for continuous throughput by adding a custom
fabricated No. 5 American Society for Testing and Materials (ASTM) screen fitted with a
tube to allocate sifted pellets into a stationary bin adjacent to the machine. A custom
fabricated pan with an outlet tube at the end was fitted below the No. 5 sieve to collect
fines, which were directed into a separate bin. The purpose of the modification was to
separate pellets and fines from complete pelleted turkey or broiler feed. The screen
shaker oscillates in a horizontal plane. One end of the screen stack oscillates back and
forth in a straight horizontal line on a slider block. The opposite end is supported on
horizontal crank arms that travel in a circle with a diameter of 117 mm. The screen
shaker operates at a frequency of 144 +/- 5 cycles per minute.
Moritz, J. S. 2013. Pellet quality performance tests: milling to bird performance. Proc. Arkansas
Nutr. Conf., Rogers, AR.
Nir, I., Y. Twina, E. Grossman, and Z. Nitsan. 1994. Quantitative effects of pelleting on
performance, gastrointestinal tract and behaviour of meat‐type chickens. Br. Poult. Sci.
35:589-602.
Nutrient Requirements of Poultry. 1994. (9th rev. ed.), Natl. Acad. Press, Washington, DC.
Parsons, A. S., N. P. Buchanan, K. P. Blemings, M. E. Wilson, and J. S. Moritz. 2006. Effect of
corn particle size and pellet texture on broiler performance in the growing phase. J. Appl.
Poult. Res. 15:245-255.
Patton, J. W., H. H. Buskirk, and L A. Rauls, L.A. 1937. A study of the relative merits of pellets
and mash poultry feeds. Vet. Med. 32:423-427.
Poholsky, C. M., D. W. Hofstetter, D. Khezrimotlagh, and J. W. Boney. 2021. Effects of pellet
quality to on-farm nutrient segregation in commercial broiler houses varying in feed line
length. Proc. Int. Poult. Scientific Forum. 80:19. (Abstr).
Proudfoot, F. G., and H. W. Hulan. 1982. Effects of reduced feeding time using all mash or
crumble-pellet dietary regimens on chicken broiler performance, including the incidence
of acute death syndrome. Poult. Sci. 61:750-754.
Proudfoot, F. G., and A. E. Sefton. 1978. Feed texture and light treatment effects on the
performance of chicken broilers. Poult. Sci. 57:408-416.
Ravindran, V. 2012. Advances and future directions in poultry nutrition: an overview. J. Korean
Society of Metallurgy. 39:53-62.
SAS Inst. Inc., Cary, NC.
Scheideler, S. E. 1991. Pelleting is important for broilers. Pages 1-7 in Proc. 18th Annu. Carolina
Poult. Nutr. Conf., Charlotte, NC. North Carolina State Univ., Raleigh.
Sellers, R. B., A. T. Brown, J. Boney, C. McDaniel, J. S. Moritz, and K. G. S. Wamsley. 2020.
Impact of feed form, liquid application method, and feed augering on feed quality, nutrient
segregation, and subsequent broiler performance. J. Appl. Poult. Res. 29:895-916.
77
Sellers, R. B., P. B. Tillman, J. S. Moritz, and K. G. S. Wamsley. 2017. The effects of strain and
incremental improvements in feed form on d 28 to 42 male broiler performance. J. Appl.
Poult. Res. 26:192-199.
Sugahara, K., T. Kubo, and I. Tasaki. 1984. Energy utilization by chicks fed amino acid diets
containing graded levels of arginine. Japanese Poult. Sci. 21:75-81.
SuperScald Rotary Scalder, Brower Equipment., Houghton, Iowa.
Velu, J. G., H. M. Scott, and D. H. Baker. 1972. Body composition and nutrient utilization of
chicks fed amino acid diets containing graded amounts of either isoleucine or lysine. The
Journal of Nutrition. 102:741-747.
VS200 Knife, Midwest Processing Systems., Eden Prairie, Minnesota.
Wamsley, K. G. S. 2014. Feed manufacture effects on quality, nutrition, and segregation.
Proceedings of the 2014 Poultry Nutrition and Milling Seminar hosted by: Alabama Feed
and Grain Association. Huntsville, Alabama.
Wenger Feeds, Spring Glen, PA.

78
Table 3-1. Experimental diet compositions and calculated nutrients for starter, grower, and finisher periods.
1Distillers dried grains with solubles. 2A proprietary commercial broiler premix was used across all treatments. This was included at a level that meets or exceeds the vitamin and
mineral requirements of Cobb 500 breed. 3Quantum Blue Phytase was provided at 400 FTU/kg.
Ingredients
(%)
Starter (0-14) Grower (14-28) Finisher (28-42)
Standard Reduced Standard Reduced Standard Reduced
Corn 57.337 62.066 66.046 66.790 69.017 70.344
Soybean Meal 34.060 28.286 25.974 25.385 22.053 21.778
DDGS1 5.000 5.000 5.000 5.000 4.183 5.000
Extruded Soybean --- --- --- --- 1.794 ---
Limestone 1.303 1.316 1.156 1.158 1.106 1.118
Monocalcium Phosphate 0.787 0.837 0.531 0.537 0.586 0.572
Sodium Carbonate 0.324 0.088 0.092 0.224 0.084 0.085
DL-Methionine 0.297 0.255 0.286 0.207 0.275 0.203
Salt 0.287 0.292 0.291 0.291 0.299 0.297
Lysine Sulfate 0.223 0.231 0.311 0.150 0.348 0.232
L-Threonine 0.065 0.053 0.056 --- 0.068 0.021
Soybean Oil --- --- --- --- --- 0.163
Vitamin and Mineral Premix2 0.263 0.262 0.232 0.233 0.161 0.161
Choline 0.030 0.030 0.030 --- --- ---
Phytase3 0.008 0.008 0.008 0.008 0.008 0.008
AlphaGalTM 280P4 0.016 --- 0.016 0.017 0.016 0.016
Calculated Nutrients
ME (kcal/kg) 2,998 2,998 3,100 3,100 3,150 3,150
Crude Protein (%) 22.00 20.00 18.84 18.40 17.61 17.00
Dig. Lysine (%) 1.170 1.050 1.020 0.918 0.970 0.873
Dig. Methionine (%) 0.592 0.528 0.546 0.465 0.520 0.444
Dig. Threonine (%) 0.780 0.700 0.660 0.597 0.630 0.567
Dig. Tryptophan (%) 0.229 0.205 0.189 0.186 0.174 0.168
Dig. TSAA (%) 0.880 0.795 0.800 0.716 0.760 0.680
Dig. Valine (%) 0.925 0.838 0.785 0.774 0.730 0.710
Dig. Arginine (%) 1.330 1.190 1.100 1.080 1.020 0.977
Dig. Isoleucine (%) 0.847 0.759 0.704 0.693 0.651 0.629
Calcium (%) 0.900 0.900 0.780 0.780 0.760 0.760
Available Phosphorous (%) 0.450 0.450 0.380 0.380 0.380 0.380
Sodium (%) 0.230 0.160 0.160 0.200 0.160 0.160
Chloride (%) 0.230 0.230 0.230 0.230 0.230 0.230
Potassium (%) 0.918 0.839 0.779 0.769 0.733 0.706

79
4AlphaGalTM 280P is a source of alpha-galactosidase derived from Saccharomyces cerevisiae and carbohydrases derived from Bacillus subtilis,
Aspergillus niger and Trichoderma longibrachiatrum.
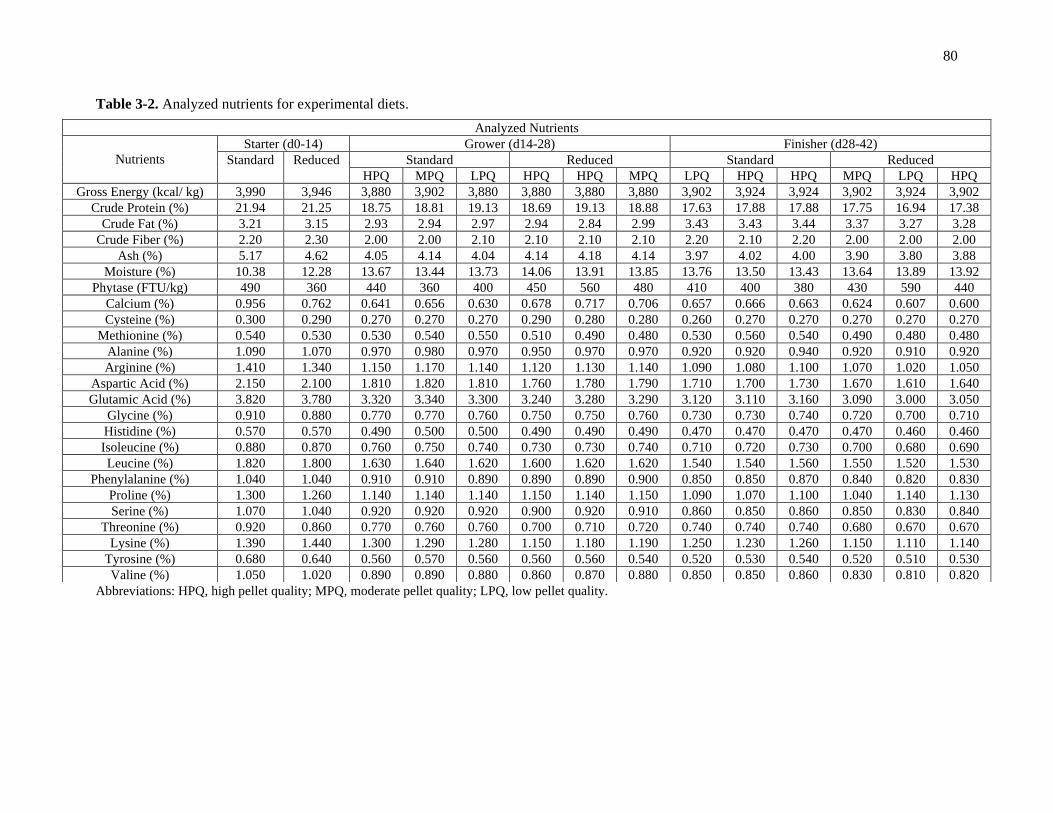
80
Table 3-2. Analyzed nutrients for experimental diets.
Abbreviations: HPQ, high pellet quality; MPQ, moderate pellet quality; LPQ, low pellet quality.
Analyzed Nutrients
Nutrients
Starter (d0-14) Grower (d14-28) Finisher (d28-42)
Standard Reduced Standard Reduced Standard Reduced
HPQ MPQ LPQ HPQ HPQ MPQ LPQ HPQ HPQ MPQ LPQ HPQ
Gross Energy (kcal/ kg) 3,990 3,946 3,880 3,902 3,880 3,880 3,880 3,880 3,902 3,924 3,924 3,902 3,924 3,902
Crude Protein (%) 21.94 21.25 18.75 18.81 19.13 18.69 19.13 18.88 17.63 17.88 17.88 17.75 16.94 17.38
Crude Fat (%) 3.21 3.15 2.93 2.94 2.97 2.94 2.84 2.99 3.43 3.43 3.44 3.37 3.27 3.28
Crude Fiber (%) 2.20 2.30 2.00 2.00 2.10 2.10 2.10 2.10 2.20 2.10 2.20 2.00 2.00 2.00
Ash (%) 5.17 4.62 4.05 4.14 4.04 4.14 4.18 4.14 3.97 4.02 4.00 3.90 3.80 3.88
Moisture (%) 10.38 12.28 13.67 13.44 13.73 14.06 13.91 13.85 13.76 13.50 13.43 13.64 13.89 13.92
Phytase (FTU/kg) 490 360 440 360 400 450 560 480 410 400 380 430 590 440
Calcium (%) 0.956 0.762 0.641 0.656 0.630 0.678 0.717 0.706 0.657 0.666 0.663 0.624 0.607 0.600
Cysteine (%) 0.300 0.290 0.270 0.270 0.270 0.290 0.280 0.280 0.260 0.270 0.270 0.270 0.270 0.270
Methionine (%) 0.540 0.530 0.530 0.540 0.550 0.510 0.490 0.480 0.530 0.560 0.540 0.490 0.480 0.480
Alanine (%) 1.090 1.070 0.970 0.980 0.970 0.950 0.970 0.970 0.920 0.920 0.940 0.920 0.910 0.920
Arginine (%) 1.410 1.340 1.150 1.170 1.140 1.120 1.130 1.140 1.090 1.080 1.100 1.070 1.020 1.050
Aspartic Acid (%) 2.150 2.100 1.810 1.820 1.810 1.760 1.780 1.790 1.710 1.700 1.730 1.670 1.610 1.640
Glutamic Acid (%) 3.820 3.780 3.320 3.340 3.300 3.240 3.280 3.290 3.120 3.110 3.160 3.090 3.000 3.050
Glycine (%) 0.910 0.880 0.770 0.770 0.760 0.750 0.750 0.760 0.730 0.730 0.740 0.720 0.700 0.710
Histidine (%) 0.570 0.570 0.490 0.500 0.500 0.490 0.490 0.490 0.470 0.470 0.470 0.470 0.460 0.460
Isoleucine (%) 0.880 0.870 0.760 0.750 0.740 0.730 0.730 0.740 0.710 0.720 0.730 0.700 0.680 0.690
Leucine (%) 1.820 1.800 1.630 1.640 1.620 1.600 1.620 1.620 1.540 1.540 1.560 1.550 1.520 1.530
Phenylalanine (%) 1.040 1.040 0.910 0.910 0.890 0.890 0.890 0.900 0.850 0.850 0.870 0.840 0.820 0.830
Proline (%) 1.300 1.260 1.140 1.140 1.140 1.150 1.140 1.150 1.090 1.070 1.100 1.040 1.140 1.130
Serine (%) 1.070 1.040 0.920 0.920 0.920 0.900 0.920 0.910 0.860 0.850 0.860 0.850 0.830 0.840
Threonine (%) 0.920 0.860 0.770 0.760 0.760 0.700 0.710 0.720 0.740 0.740 0.740 0.680 0.670 0.670
Lysine (%) 1.390 1.440 1.300 1.290 1.280 1.150 1.180 1.190 1.250 1.230 1.260 1.150 1.110 1.140
Tyrosine (%) 0.680 0.640 0.560 0.570 0.560 0.560 0.560 0.540 0.520 0.530 0.540 0.520 0.510 0.530
Valine (%) 1.050 1.020 0.890 0.890 0.880 0.860 0.870 0.880 0.850 0.850 0.860 0.830 0.810 0.820
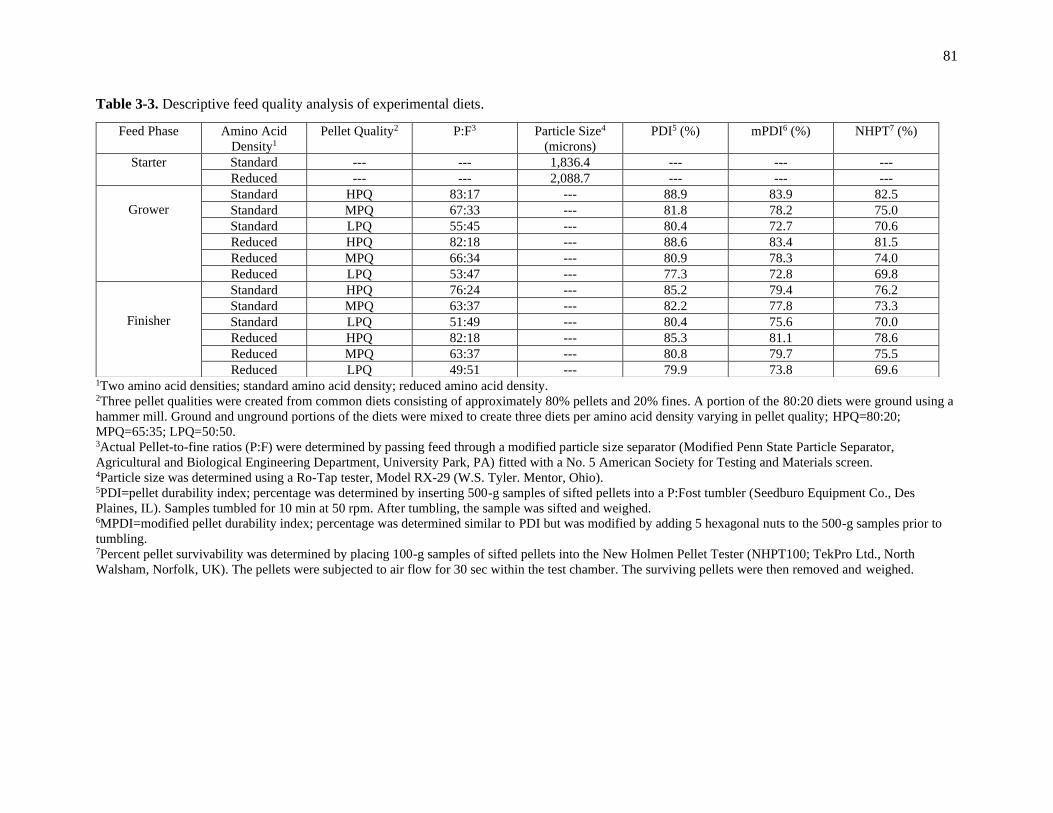
81
Table 3-3. Descriptive feed quality analysis of experimental diets.
1Two amino acid densities; standard amino acid density; reduced amino acid density. 2Three pellet qualities were created from common diets consisting of approximately 80% pellets and 20% fines. A portion of the 80:20 diets were ground using a
hammer mill. Ground and unground portions of the diets were mixed to create three diets per amino acid density varying in pellet quality; HPQ=80:20;
MPQ=65:35; LPQ=50:50. 3Actual Pellet-to-fine ratios (P:F) were determined by passing feed through a modified particle size separator (Modified Penn State Particle Separator,
Agricultural and Biological Engineering Department, University Park, PA) fitted with a No. 5 American Society for Testing and Materials screen. 4Particle size was determined using a Ro-Tap tester, Model RX-29 (W.S. Tyler. Mentor, Ohio). 5PDI=pellet durability index; percentage was determined by inserting 500-g samples of sifted pellets into a P:Fost tumbler (Seedburo Equipment Co., Des
Plaines, IL). Samples tumbled for 10 min at 50 rpm. After tumbling, the sample was sifted and weighed. 6MPDI=modified pellet durability index; percentage was determined similar to PDI but was modified by adding 5 hexagonal nuts to the 500-g samples prior to
tumbling. 7Percent pellet survivability was determined by placing 100-g samples of sifted pellets into the New Holmen Pellet Tester (NHPT100; TekPro Ltd., North
Walsham, Norfolk, UK). The pellets were subjected to air flow for 30 sec within the test chamber. The surviving pellets were then removed and weighed.
Feed Phase Amino Acid
Density1
Pellet Quality2 P:F3 Particle Size4
(microns)
PDI5 (%) mPDI6 (%) NHPT7 (%)
Starter Standard --- --- 1,836.4 --- --- ---
Reduced --- --- 2,088.7 --- --- ---
Grower
Standard HPQ 83:17 --- 88.9 83.9 82.5
Standard MPQ 67:33 --- 81.8 78.2 75.0
Standard LPQ 55:45 --- 80.4 72.7 70.6
Reduced HPQ 82:18 --- 88.6 83.4 81.5
Reduced MPQ 66:34 --- 80.9 78.3 74.0
Reduced LPQ 53:47 --- 77.3 72.8 69.8
Finisher
Standard HPQ 76:24 --- 85.2 79.4 76.2
Standard MPQ 63:37 --- 82.2 77.8 73.3
Standard LPQ 51:49 --- 80.4 75.6 70.0
Reduced HPQ 82:18 --- 85.3 81.1 78.6
Reduced MPQ 63:37 --- 80.8 79.7 75.5
Reduced LPQ 49:51 --- 79.9 73.8 69.6

82
Table 3-4. Influence of amino acid density and pellet quality on d0-14 broiler performance.
a-bMeans within a column with no common superscript differ significantly (P<0.05). 1 Two amino acid densities; standard amino acid density; reduced amino acid density. 2Three pellet qualities were created from common diets consisting of approximately 80% pellets and 20% fines. A portion of the 80:20 diets were ground using a
hammer mill. Ground and unground portions of the diets were mixed to create three diets per amino acid density varying in pellet quality; HPQ=80:20;
MPQ=65:35; LPQ=50:50.
Amino Acid Density1 Pellet Quality2 Feed Intake
(kg/bird)
Live Weight Gain
(kg/bird)
Average BW
(kg)
FCR Mortality
(%)
Standard
80:20 0.403 0.334 0.334 1.202 2.083
65:35 0.398 0.329 0.329 1.205 3.009
50:50 0.404 0.336 0.336 1.194 3.241
Reduced
80:20 0.413 0.324 0.324 1.263 4.167
65:35 0.405 0.318 0.318 1.263 3.009
50:50 0.406 0.321 0.321 1.262 1.852
ANOVA P-Value 0.038 0.001 0.001 <0.0001 0.464
Fisher’s LSD 0.008 0.010 0.010 0.022 2.452
SEM 0.003 0.003 0.003 0.008 0.865
Amino Acid Density Means
Standard 0.402b 0.333a 0.333a 1.200b 2.778
Reduced 0.408a 0.321b 0.321b 1.263a 3.009
Amino Acid Density SEM 0.002 0.003 0.003 0.010 0.527
Pellet Quality Means
80:20 0.408 0.329 0.329 1.233 3.125
65:35 0.402 0.324 0.324 1.234 3.009
50:50 0.405 0.329 0.329 1.228 2.546
Pellet Quality SEM 0.002 0.004 0.004 0.012 0.645
Probabilities
Amino Acid Density 0.035 0.012 0.012 <0.0001 0.757
Pellet Quality 0.159 0.579 0.578 0.937 0.799
Amino Acid Density X Pellet Quality 0.516 0.923 0.923 0.957 0.168

83
Table 3-5. Influence of amino acid density and pellet quality on d14-28 broiler performance.
a-bMeans within a column with no common superscript differ significantly (P<0.05). 1Two amino acid densities; standard amino acid density; reduced amino acid density. 2Three pellet qualities were created from common diets consisting of approximately 80% pellets and 20% fines. A portion of the 80:20 diets were ground using a
hammer mill. Ground and unground portions of the diets were mixed to create three diets per amino acid density varying in pellet quality; HPQ=80:20;
MPQ=65:35; LPQ=50:50.
Amino Acid Density1 Pellet Quality2 Feed Intake
(kg/bird)
Live Weight Gain
(kg/bird)
Average BW
(kg)
FCR Mortality
(%)
Standard
80:20 1.724 1.102 1.437 1.562 2.137
65:35 1.723 1.088 1.417 1.575 4.057
50:50 1.680 1.076 1.412 1.557 2.165
Reduced
80:20 1.719 1.080 1.404 1.585 2.409
65:35 1.665 1.050 1.367 1.591 2.160
50:50 1.670 1.0496 1.371 1.591 1.920
ANOVA P-Value 0.003 0.0007 <0.0001 0.108 0.561
Fisher’s LSD 0.039 0.026 0.030 0030 2.519
SEM 0.014 0.009 0.011 0.011 0.889
Amino Acid Density Means
Standard 1.709 1.089a 1.422a 1.565a 2.786
Reduced 1.685 1.060b 1.381b 1.589b 2.163
Amino Acid Density SEM 0.009 0.007 0.008 0.007 0.509
Pellet Quality Means
80:20 1.721a 1.091a 1.420a 1.573 2.273
65:35 1.694ab 1.069ab 1.392b 1.583 3.108
50:50 1.675b 1.063b 1.392b 1.574 2.042
Pellet Quality SEM 0.011 0.008 0.009 0.008 0.624
Probabilities
Amino Acid Density 0.054 0.004 0.0003 0.015 0.390
Pellet Quality 0.012 0.051 0.055 0.665 0.450
Amino Acid Density X Pellet Quality 0.172 0.792 0.820 0.745 0.443

84
Table 3-6. Influence of amino acid density and pellet quality on d28-42 broiler performance.
a-bMeans within a column with no common superscript differ significantly (P<0.05). 1Two amino acid densities; standard amino acid density; reduced amino acid density. 2Three pellet qualities were created from common diets consisting of approximately 80% pellets and 20% fines. A portion of the 80:20 diets were ground using a
hammer mill. Ground and unground portions of the diets were mixed to create three diets per amino acid density varying in pellet quality; HPQ=80:20;
MPQ=65:35; LPQ=50:50.
Amino Acid
Density1
Pellet
Quality2
Feed Intake
(kg/bird)
Live Weight
Gain (kg/bird)
Average Male
BW (kg)
Average
Female BW
(kg)
Average
BW (kg) FCR Mortality
(%)
Standard
80:20 2.650 1.357 2.999 2.566 2.794 1.965 6.536
65:35 2.683 1.392 3.060 2.575 2.809 1.945 5.447
50:50 2.650 1.331 2.944 2.551 2.744 1.982 4.399
Reduced
80:20 2.678 1.335 2.956 2.542 2.739 2.063 7.654
65:35 2.638 1.293 2.890 2.423 2.660 2.092 7.525
50:50 2.594 1.323 2.883 2.528 2.695 1.980 3.598
ANOVA P-Value 0.481 0.118 0.0003 0.088 0.0005 0.002 0.133
Fisher’s LSD 0.0946 0.0698 0.0806 0.1102 0.0703 0.08 3.5417
SEM 0.033 0.025 0.028 0.039 0.025 0.028 1.250
Amino Acid Density Means
Standard 2.661 1.360 3.001a 2.564a 2.782a 1.964b 5.461
Reduced 2.637 1.317 2.919b 2.497b 2.698b 2.045a 6.259
Amino Acid Density SEM 0.019 0.016 0.019 0.022 0.015 0.018 0.722
Pellet Quality Means
80:20 2.664 1.346 2.977 2.554 2.766 2.014 7.095a
65:35 2.660 1.342 2.975 2.499 2.734 2.019 6.486ab
50:50 2.622 1.327 2.914 2.540 2.719 1.981 3.999b
Pellet Quality SEM 0.023 0.020 0.023 0.027 0.018 0.023 0.885
Probabilities
Amino Acid Density 0.362 0.065 0.001 0.039 0.0002 0.003 0.438
Pellet Quality 0.361 0.781 0.090 0.340 0.190 0.441 0.038
Amino Acid Density X Pellet
Quality
0.373 0.226 0.111 0.166 0.105 0.063 0.507

85
Table 3-7. Influence of amino acid density and pellet quality on d0-42 broiler performance, overall performance data.
a-bMeans within a column with no common superscript differ significantly (P<0.05). 1Two amino acid densities; standard amino acid density; reduced amino acid density. 2Three pellet qualities were created from common diets consisting of approximately 80% pellets and 20% fines. A portion of the 80:20 diets were ground using a
hammer mill. Ground and unground portions of the diets were mixed to create three diets per amino acid density varying in pellet quality; HPQ=80:20;
MPQ=65:35; LPQ=50:50.
Amino Acid
Density1
Pellet
Quality2
Feed Intake
(kg/bird)
Live Weight
Gain (kg/bird)
Average Male
BW (kg)
Average
Female BW
(kg)
Average
BW (kg) FCR Mortality
(%)
Standard
80:20 4.777 2.794 2.999 2.566 2.794 1.700 10.417
65:35 4.806 2.809 3.060 2.575 2.809 1.704 12.037
50:50 4.734 2.744 2.944 2.551 2.744 1.710 9.491
Reduced
80:20 4.810 2.739 2.956 2.542 2.739 1.760 13.657
65:35 4.708 2.660 2.890 2.423 2.660 1.774 12.269
50:50 4.670 2.695 2.883 2.528 2.695 1.735 7.176
ANOVA P-Value 0.063 0.0005 0.0003 0.089 0.0005 <0.0001 0.121
Fisher’s LSD 0.1067 0.0703 0.0806 0.1102 0.0703 0.0311 4.8462
SEM 0.038 0.025 0.028 0.039 0.025 0.011 1.710
Amino Acid Density Means
Standard 4.773 2.782a 3.001a 2.564a 2.782a 1.705b 10.648
Reduced 4.729 2.698b 2.910b 2.497b 2.698b 1.756a 11.034
Amino Acid Density SEM 0.021 0.015 0.019 0.022 0.015 0.007 0.955
Pellet Quality Means
80:20 4.794a 2.766 2.977 2.554 2.766 1.730 12.037a
65:35 4.757ab 2.734 2.975 2.499 2.734 1.739 12.153a
50:50 4.702b 2.719 2.914 2.540 2.719 1.723 8.333b
Pellet Quality SEM 0.025 0.018 0.023 0.027 0.018 0.009 1.169
Probabilities
Amino Acid Density 0.142 0.0002 0.001 0.039 0.0002 <0.0001 0.776
Pellet Quality 0.042 0.190 0.090 0.340 0.190 0.405 0.038
Amino Acid Density X Pellet
Quality
0.172 0.105 0.111 0.166 0.105 0.170 0.250
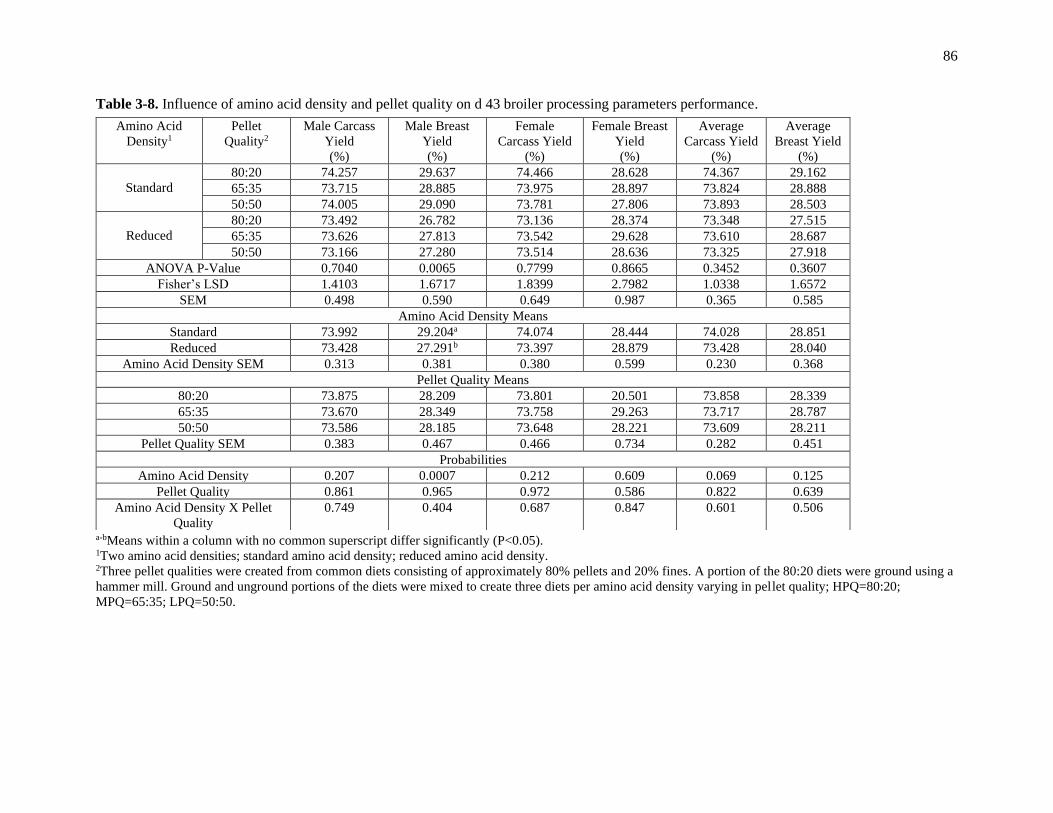
86
Table 3-8. Influence of amino acid density and pellet quality on d 43 broiler processing parameters performance.
a-bMeans within a column with no common superscript differ significantly (P<0.05). 1Two amino acid densities; standard amino acid density; reduced amino acid density. 2Three pellet qualities were created from common diets consisting of approximately 80% pellets and 20% fines. A portion of the 80:20 diets were ground using a
hammer mill. Ground and unground portions of the diets were mixed to create three diets per amino acid density varying in pellet quality; HPQ=80:20;
MPQ=65:35; LPQ=50:50.
Amino Acid
Density1
Pellet
Quality2
Male Carcass
Yield
(%)
Male Breast
Yield
(%)
Female
Carcass Yield
(%)
Female Breast
Yield
(%)
Average
Carcass Yield
(%)
Average
Breast Yield
(%)
Standard
80:20 74.257 29.637 74.466 28.628 74.367 29.162
65:35 73.715 28.885 73.975 28.897 73.824 28.888
50:50 74.005 29.090 73.781 27.806 73.893 28.503
Reduced
80:20 73.492 26.782 73.136 28.374 73.348 27.515
65:35 73.626 27.813 73.542 29.628 73.610 28.687
50:50 73.166 27.280 73.514 28.636 73.325 27.918
ANOVA P-Value 0.7040 0.0065 0.7799 0.8665 0.3452 0.3607
Fisher’s LSD 1.4103 1.6717 1.8399 2.7982 1.0338 1.6572
SEM 0.498 0.590 0.649 0.987 0.365 0.585
Amino Acid Density Means
Standard 73.992 29.204a 74.074 28.444 74.028 28.851
Reduced 73.428 27.291b 73.397 28.879 73.428 28.040
Amino Acid Density SEM 0.313 0.381 0.380 0.599 0.230 0.368
Pellet Quality Means
80:20 73.875 28.209 73.801 20.501 73.858 28.339
65:35 73.670 28.349 73.758 29.263 73.717 28.787
50:50 73.586 28.185 73.648 28.221 73.609 28.211
Pellet Quality SEM 0.383 0.467 0.466 0.734 0.282 0.451
Probabilities
Amino Acid Density 0.207 0.0007 0.212 0.609 0.069 0.125
Pellet Quality 0.861 0.965 0.972 0.586 0.822 0.639
Amino Acid Density X Pellet
Quality
0.749 0.404 0.687 0.847 0.601 0.506

87
Chapter 4
A METHOD FOR CHARACTERIZING TURKEY BREAST MUSCLE USING
INSTRUMENTAL QUALITY MEASUREMENTS
ABSTRACT
The prevalence of pale, soft, and exudative (PSE) poultry meat is associated with various
meat quality parameters, supporting the need to establish a method for examining breast muscle
characteristics using instrumental quality measurements. Two experiments were conducted to
establish a method for monitoring breast muscle color, pH, drip loss, cook yield, and texture
characteristics of various tom turkey trains. Three commercially available strains (A, B, and C)
were harvested at 17 weeks of age to examine left and right pectoralis major muscles for
experiment 1 (n=16). After slaughter, evisceration, and chilling, carcasses were weighed to
determine chilled carcass yield, and each pectoralis major was individually placed in a vacuum
sealed bag. Breast samples were stored in a -23.3C freezer until further analysis. Color, cook
yield, and texture were analyzed. In experiment 2, two commercially available strains and two
experimental strains of tom turkeys (A and B, and D and E, respectively) were harvested at 17
weeks of age. The harvesting and sample preparation processes for experiment 2 mirrored that of
experiment 1 (n=12). Additional analyses performed for this experiment included pH and drip
loss determination. In experiment 1, the L* value was similar for strains B and C, while strain A
had the highest L* value (P=0.0045). The Warner-Bratzler shear (WBS) value was lowest for
strain A, highest for strain B, and intermediate for strain C (P=0.0021). Correlations existed
among L* and a* values and L* and WBS values (P<0.05). In experiment 2, raw breast meat pH
was lowest for strain B but was statistically similar for the other three strains (P=0.0036). The L*
significantly correlated with a* value, pH, and cook yield (P<0.05). In conclusion, this

88
methodology for breast muscle characterization may be appropriate for establishing baseline
values for meat quality attributes that may be used to monitor the onset of PSE in future
generations of commercial turkeys.
INTRODUCTION
The poultry industry has experienced changes in carcass growth and development of
commercial meat-yielding strains over the years. Increased demand of poultry products has put
pressure on nutritionists, breeders, and growers to increase the growth potential of birds. As a
result, tom turkeys raised in 2003 were twice as heavy and exhibited a 50% improvement in feed
efficiency compared to those raised in 1966 at the same age (Havenstein et al., 2007). Increased
growth rate resulting from genetic selection of quantitative traits has contributed to higher yields
and improved feed efficiency at the expense of meat quality attributes associated with muscle
myopathies. The turkey industry has experienced an increase in the prevalence of pale, soft, and
exudative (PSE) meat, which has similar features to the PSE conditions observed in pork products
(Cassens et al., 1975; Warris and Brown, 1987; Bendall and Swatland, 1988; Van Hoof 1979;
Barbut 1993; Pietrzak et al., 1997; Sporer et al., 2012; Clark et al., 2019). Characteristics
indicative of PSE-like meat include a pale color, low water-holding capacity (WHC), low
ultimate pH, and soft texture (Barbut, 1996; Barbut, 1998; Fletcher, 1999; Owens et al., 2000;
Sams and McKee, 2010). The commercial incidence of PSE broiler and turkey meat ranges from
5-40% of the birds harvested in a given processing plant (Barbut, 1996; Owens et al., 2000). The
swine industry combatted the incidence of PSE pork by identifying a mutation in the ryanodine
receptor, which is thought to play a role in the development of such conditions (Strasburg and
Chiang, 2009). Due to genetic differences between avian and mammalian species, researchers
believe that this mutation is not associated with PSE-like conditions in turkeys and broilers
(Smith and Northcutt, 2009). The lack of understanding the genetic influence on this condition

89
has made it difficult to select against these tendencies. However, environmental factors are
known to influence meat quality and can be managed.
Meat color and texture are two of the most important quality attributes for poultry meat,
according to consumer preferences (Mancini and Hunt, 2005). Meat surface color may be
affected by a variety of factors, yet it is known that the measurement of lightness correlates with
other meat quality attributes. Additionally, meat texture may be influenced by age, sex, deboning
time, and cooking methods (Goodwin, 1984). Exudative meat tends to be soft in texture due to
conformational changes exhibited by denatured proteins, resulting in a less firm structure.
Specific raw meat color and pH values are correlated to PSE-like meat (Barbut, 1993; Boulianne
and King, 1995; Fletcher, 1999). Researchers have found that high ultimate pH is correlated to
darker meat while meat with a low ultimate pH tends to be lighter in color. This interrelationship
may be due to denaturation of sarcoplasmic proteins (Bendall and Wismer-Pederson, 1962),
enhanced reflectance from muscle surface myofibrils (Hamm, 1960), or increased refraction
through myofibrils (Swatland, 2004). Undesirable quality characteristics associated with PSE
meat are due to accelerated postmortem glycolysis in the muscle, resulting in rapid postmortem
pH decline while temperatures are still high. Low pH is also correlated to increased water loss of
muscle, due to denaturation of water-binding proteins (Hamm, 1958).
It is documented that the PSE conditions described in swine are associated with both
antemortem and postmortem stressors, which include environmental temperatures (Cassens et al.,
1975), preslaughter handling procedures (Backstorm and Kaufman, 1995; D’Souza et al., 1998),
stunning methods (Backstorm and Kaufman, 1995), and chilling systems (Honikel, 1987; Offer,
1991). Poultry are exposed to similar antemortem conditions, thus stressful situations prior to
slaughter, along with increased growth rate, may affect the occurrence of PSE in poultry meat.
Babji and cohorts (1982) investigated the effect of preslaughter environmental temperature on
breast meat quality and found that meat from turkeys held at 38˚C prior to slaughter exhibited
lower pH, WHC, and cook yield, and higher L* and shear values compared to turkeys held at

90
21˚C or 5˚C. Froning et al. (1978) reported lighter meat with higher shear values from turkeys
that were heat stressed prior to slaughter or struggled during exsanguination compared to turkeys
that were cold stressed or anesthetized before slaughter. Stress during transportation to the
processing facility has also been known to induce pale meat with tough texture (Ehinger, 1977;
Cashman et al., 1989). Understanding the contributors to meat quality problems is imperative for
producing uniform quality products.
A long-term solution for minimizing the occurrence of PSE meat in the turkey industry
should include genetic selection for specific meat quality traits. However, due to the lack of
genetic markers, a relationship between meat quality, genetics, and susceptibility to stressors has
not yet been identified. Despite this, poultry genetic providers may be able to monitor the onset of
PSE in commercial turkey flocks by implementing methods that characterize breast meat based
on meat quality parameters. Should instrumental analyses detect meat quality characteristics
indicative of PSE meat, geneticists could make necessary changes to prevent these strains from
going to market. Therefore, the objective of this study was to perform instrumental quality
analyses on the pectoralis major of various turkey strains to establish baseline color, pH, cook
yield, texture, and WHC values that can be used to monitor meat quality changes influenced by
genetic selection.
MATERIALS AND METHODS
Experiment 1
Sample Preparation
A total of 24 tom turkeys from commercially available strains (Strains A, B, and C) were
reared and processed at Penn State University’s Poultry Education and Research Center. Turkeys

91
were reared between February and June of 2019. At 17 weeks of age, each bird was weighed,
hung by their feet in steel shackles, incapacitated with an electric stunning knife (Midwest
Processing Systems, Eden Prairie, Minnesota), and exsanguinated by cutting both carotid arteries
and jugular veins. Following exsanguination, birds were scalded at 60˚C for 30 s in a SuperScald
Rotary Scalder (Brower Equipment, Houghton, Iowa). After scalding, feathers were mechanically
removed (Ashley Machine, Greensburg, Indiana), and carcasses were manually eviscerated prior
to being placed in a chill tank at 5˚C overnight. After 24 h, the chilled carcasses were weighed to
determine carcass yield. Left and right pectoralis major muscles were then removed from each
carcass. Individual breast samples were placed in a vacuum sealed bag, labeled according to
strain (n=16). Samples were placed in a -23.3˚C freezer where they were distributed evenly, in a
single layer on racks, to achieve uniform freezing.
Color Measurements
Breast samples were completely thawed, tempered to 20˚C, and blotted dry prior to color
analysis. The International Commission on Illumination (CIE) system color profile of L*, a*, and
b* (CIE., 1978) values were measured using a portable CR-300 series Chroma Meter (Konica
Minolta, Ramsey, New Jersey). Prior to use, the colorimeter was calibrated using a standard white
ceramic tile (Calibration values Y = 95.0, x = 0.3157, y = 0.3321). Color was recorded as an
average of three readings on the top surface of each raw boneless skinless breast sample. Obvious
color defects such as bruising, and hemorrhages were avoided.
Cook Yield
Samples used for color analysis were then used for cook yield determination. Raw
samples were first cut so that only the thickest portion of the meat remained, resulting in samples

92
uniform in thickness. Samples were weighed, wrapped in foil, and placed on baking sheets. A
conventional oven was used at 190.5˚C and sample temperatures were measured throughout the
cooking process using a C48/P11 thermocouple thermometer (Comark Instruments, Norwich,
UK). Samples were removed from the oven once internal temperatures reached 80˚C. After
cooling for 30 min, water was drained from the foil and samples were placed in a 4˚C cooler for
24 h. After 24 h, samples were removed from the cooler, tempered to 20˚C and weighed. Cook
yield was reported as a percentage and calculated as:
Cooked Sample Weight (g)
Raw Sample Weight (g) × 100
Warner-Bratzler Shear Force
Cook yield samples were retained and used for shear force determinations. Texture was
analyzed using a TMS-Pro food texture analyzer (Food Technology Corporation, Sterling,
Virginia) fitted with a Warner-Bratzler Shear (WBS) cell. A cutting guide device was used to
create three 10-mm by 10-mm square subsamples obtained from the thickest portion of each
cooked breast sample. The muscle fibers of each subsample were oriented perpendicular to the V-
shaped blade using a cross head speed of 240 mm/min. Shear force was reported as an average of
three maximum shear values (Newtons) for each sample.
Experiment 2
Sample Preparation
This experiment was conducted in a similar manner to experiment 1. Four strains (2
commercially available strains (A and B) and 2 experimental strains (D and E)) of tom turkeys
were reared at Penn State University between August 2019 and January 2020. The two

93
commercially available strains used in experiment 2 were also used in experiment 1 (Strains A
and B). At 17 weeks of age, a total of 24 turkeys were processed for breast muscle
characterization. The harvesting process was identical to that of experiment 1. Upon removal of
left and right pectoralis major muscles, each breast sample was cut into three pieces of uniform
thickness for different quality analyses. Samples were placed in a vacuum sealed bag and labeled
according to strain and analysis (n=12). These samples were then placed in a -23.3˚C freezer until
instrumental analyses could be conducted. Methods for analysis of color, cook yield, and shear
force mirrored that of experiment 1.
pH
Breast samples were completely thawed and tempered to 20˚C prior to pH analysis. A
glass probe electrode was inserted directly into raw breast muscle samples for pH determination.
The pH meter was calibrated against standard buffers of pH 4.0 and pH 7.0. Readings for each
sample were recorded after 10 min.
Drip Loss
Breast samples were completely thawed and tempered to 20˚C prior to drip loss
determination. Drip loss was determined using a modified method by Rasmussen and Anderson
(1996). Core samples of approximately 10 g were obtained from each raw breast muscle sample
using a 25-mm cork borer at a right angle to the muscle fiber direction. Samples were then
suspended in drip tubes equipped with a lid to avoid evaporation. Samples were placed in a 4˚C
cooler for 48 h, and drip loss was calculated using the following equation:
(0 hour weight (g)−48 hour weight (g))
(0 hour weight (g)) × 100
94
STATISTICAL ANALYSIS
Data from each experiment were analyzed using the GLM procedure of SAS version 9.4
(SAS Inst. Inc., Cary, NC). One-way ANOVA tests were performed for each experiment, and
means were separated using Fisher’s least significant difference test when P≤0.05. Pearson’s
correlation coefficients between the variables of meat color, cook yield, and texture (experiment
1) and meat color, cook yield, texture, pH, and drip loss (experiment 2) were generated using
Minitab 18 (Minitab Inc., State College, PA).
RESULTS AND DISCUSSION
Experiment 1
Meat quality attribute means for strains A, B, and C are presented in Table 4-1. Color
analysis revealed differences for L*, a*, and b* parameters (P<0.05). The measurement of
lightness (L*) was similar for both strains A and C while breast muscle from strain B had a higher
L* value (P=0.0045). The measurement of redness (a*) was similar for strains B and C while
strain A had the highest a* value (P=0.0027). Strain A displayed the highest measurement of
yellowness (b*) compared to strains B and C which had similar b* values (P=0.0161). Color is an
important meat quality attribute, as it can be correlated to PSE-like meat (Barbut, 1993;
Kauffman et al., 1993). In fact, Barbut (1993) proposed the use of a fast color measuring system
to evaluate the prevalence of PSE in turkey breast meat. Cook yield did not differ between the
strains (P>0.05). In terms of texture, the average WBS value was lowest for strain B and highest
for strain C. The WBS value for Strain A was intermediate (P=0.0021).
Correlations among color, cook yield and WBS values for experiment 1 are demonstrated
in Table 4-2. It is important to note that this table includes data from all three strains. Thus, the
95
values presented indicate raw correlations among meat quality parameters of modern commercial
turkeys, regardless of strain. In this experiment, L* value negatively correlated with WBS value
(P<0.01). The negative correlation indicates that lighter breast muscle tends to be soft in texture
after cooking (Figure 4-1). Lightness value correlations with some textural parameters of cooked
turkey breast meat have been previously reported (Barbut, 1993; Swatland and Barbut 1995).
Conversely, Fletcher (1999) did not observe a significant correlation between L* value and meat
texture when using an Allo-Kramer shear head. Although a different shear cell was used in the
current study, lack of correlation between L* and shear force values in the 1999 study could be
due to differences in strain. Genetics may affect muscle structure in terms of the number and size
of muscle fibers, subsequently affecting meat quality. Sante et al. (1991) compared the rate of pH
decline in the pectoralis major between slow-growing and fast-growing turkey strains. These
authors concluded that the rate of pH decline for fast-growing turkeys was twice the rate than that
of the slow-growing line. Because most meat quality parameters are affected by rigor
development, it is likely that textural differences exist between strains. The L* value significantly
correlated with a* value (P<0.01). Both lightness and redness are considered indicators of PSE
and dark, firm, and dry (DFD) meat (Brewer et al., 2001; Hulsegge et al., 2001). Kim et al. (2010)
analyzed the color of pork meat and reported that meat with high L* values tended to have low a*
values and vice versa. Meat color and associated defects are mostly influenced by the relationship
between myoglobin content and its pH dependent reactions (Fletcher, 1999). Overall, Table 4-2
shows that this method is appropriate for recognizing correlations among meat quality parameters
across various commercially available turkey strains.
Experiment 2
Means of meat quality attributes for strains A, B, D, and E are organized in Table 4-3.
Raw breast muscle from strain A had the lowest L* value while strain B had the highest L* value.

96
Breast muscle from strains D and E were intermediate in terms of lightness (P<0.0001). The a*
value did not differ significantly between the strains (P>0.05). This is an interesting observation
since a* value significantly differed between the three strains used in experiment 1. Although this
could be a result of small sample size, previous research suggests that meat quality may be
influenced by season, as experiments 1 and 2 were conducted during different times of the year.
Heat stress is a common antemortem stressor that is thought to induce physiological and
biochemical alterations in the muscle, potentially resulting in the development of PSE
characteristics (Cassens et al., 1975). McKee and Sams (1997) reported that heat stressed turkeys
exhibited a higher frequency of L* values above 53 compared to the control birds. In the current
study, b* value was highest for strain E and lowest for strains A and B. Strain D was intermediate
for b* value (P=0.0215). Raw breast meat pH was lowest for strain B but was statistically similar
for the other three strains (P=0.0036). Meat with low pH is often characterized by being pale,
soft, and exudative (Fletcher, 2002). Owens and colleagues (2000) examined muscle pH of pale
and normal turkey breasts and reported significant differences at 1.5 h postmortem (5.72 vs.
6.09). These data support muscle pH as an indicator of meat quality.
Correlation coefficients and probabilities between meat pH, color, WBS, cook yield, and
drip loss are presented in Table 4-4. Once again, these data indicate raw correlations among meat
quality parameters using values from all strains. Lightness significantly correlated with redness
and pH (P<0.01). Figure 4-2 illustrates the negative linear relationships between pH and L*
value. This is supported by the work of Boulianne and King (1995, 1998) who examined
chemical properties of pale and dark broiler breast fillets and determined that pale meat had
significantly higher lightness and yellowness, and lower pH values compared to darker meat.
Based on these results, breast meat from strain B may have exhibited PSE conditions due to high
L* value and low pH compared to the other strains (Table 4-3). Lightness also correlated with
cook yield (P<0.01). Cook yield decreased as L* value increased (Figure 4-3). Cook yield is a
measurement of water retention in which low cook yield percentages describe exudative meat.

97
Lean muscle is made up of approximately 75% water, and a low pH can contribute to eventual
water loss due to denaturation of water-binding proteins (Offer and Knight, 1988). Van Laak et
al. (2000) reported a significant correlation among broiler breast meat pH and cook yield.
Although negatively correlated, these authors determined that pale breast samples had
significantly lower cook yield and pH compared to darker samples.
CONCLUSIONS
Table 4-5 includes descriptive data of average baseline values for each meat quality
parameter for specific strains. Turkey genetic companies can use this method for establishing
baseline values of meat quality parameters in order to monitor the onset of PSE in consecutive
flocks of commercial turkeys. This would allow geneticists to consider altering rearing/breeding
practices should this method detect PSE conditions within a flock. Overall, the differences in
meat quality attributes between the strains of this study validate the efficacy of the method used
to characterize turkey breast meat. Correlations among meat quality parameters found in this
study were in line with that of past research. Results also indicate that meat quality may be
affected by strain.
REFERENCES
Ashley Machine, Greensburg, Indiana.
Babji, A. S., G. W. Froning, and D. A. Ngoka. 1982. The effect of preslaughter environmental
temperature in the presence of electrolyte treatment on turkey meat quality. Poult. Sci.
61:2385-2389.
Backstrom, L., and R. Kauffman. 1995. The porcine stress syndrome: A review of genetics,
environmental factors, and animal well-being implications. Agri-Practice. 16:24-30.
Barbut, S. 1993. Color measurements for evaluating the pale soft exudative (PSE) occurrence in
turkey meat. Food Res. Int. 26:39-43.

98
Barbut, S. 1996. Estimates and detection of the PSE problem in young turkey breast meat.
Canadian J. Anim. Sci. 76:455-457.
Barbut, S. 1998. Estimating the magnitude of the PSE problem in poultry. J. Muscle Foods. 9:35-
49.
Bendall, J. R. and J. Wismer‐Pedersen, J. 1962. Some properties of the fibrillar proteins of normal
and watery pork muscle. J. Food Sci. 27:144-159.
Bendall, J. R., and H. J. Swatland. 1988. A review of the relationships of pH with physical
aspects of pork quality. Meat Sci. 24:85-126.
Boulianne, M., and A. J. King. 1995. Biochemical and color characteristics of skinless boneless
pale chicken breast. Poult. Sci. 74:1693-1698.
Boulianne, M., and A. J. King. 1998. Meat color and biochemical characteristics of unacceptable
dark‐colored broiler chicken carcasses. J. Food Sci. 63:759-762.
Brewer, M. S., L. G. Zhu, and F. K. McKeith. 2001. Marbling effects on quality characteristics of
pork loin chops: consumer purchase intent, visual and sensory characteristics. Meat Sci.
59:153-163.
Brower Equipment, Houghton, Iowa.
C.I.E., 1978. International Commission on Illumination, Recommendations on Uniform Color
Spaces, Color Difference Equations, Psychometric Color Terms. Supplement No. 2 to
C.I.E. publication No. 15 (E-1.3.1) 1971/(TC-1.3) 1978. Bureau Central de la C.I.E.,
Paris, France.
Cashman, P. J., C. J. Nicol, and R. B. Jones. 1989. Effects of transportation on the tonic
immobility fear reactions of broilers. Brit. Poult. Sci. 30:211-221.
Cassens, R. G., D. N. Marple, and G. Eikelenboom. 1975. Animal physiology and meat quality.
Advances in Food Research. 21:71-155.
Clark, D., K. Nestor, and S. Velleman. 2019. Continual selection for increased 16 wk body
weight on turkey growth and meat quality: 50 generation update. J. Appl. Poult. Res.
28:658-668.
Comark Instruments, Norwich, UK.
D'Souza, D. N., F. R. Dunshea, R. D. Warner, B. J. Leury. 1998. The effect of pre-slaughter
handling and carcass processing rate post-slaughter on pork quality. Meat Sci. 50:429-
437.
Ehinger, F. 1977. The influence of starvation and transportation on the carcass quality of broilers.
Pages 117-124 in The Quality of Pork Meat. S. Scholtyssek, ed. European Poultry
Federation, Munich, Germany.

99
Fletcher, D. L. 1999. Color variation in commercially packaged broiler breast fillets. J. Appl.
Poultry Res. 8:67-69.
Fletcher, D. L. 2002. Poultry meat quality. World’s Poult. Sci. J. 58:131-145.
Food Technology Corporation, Sterling, Virginia
Froning, G. W., A. S. Babji, and F. B. Mather. 1978. The effect of preslaughter temperature,
stress, struggle and anesthetization on color and textural characteristics of turkey muscle.
Poult. Sci. 57:630-633.
Goodwin, T. L. 1984. It takes tough discipline to make tender chicken. Broiler Industry. 9:43-44.
Hamm, R. 1958. Über die Mineralstoffe des Säugetiermuskels. Zeitschrift für Lebensmittel-
Untersuchung und Forschung. 107:423-437.
Hamm, R. 1960. Biochemistry of meat hydration. Advances in Food Research. 10:355-463.
Havenstein, G. B., P. R. Ferket, J. L. Grimes, M. A. Qureshi, and K. E. Nestor. 2007. Comparison
of the performance of 1966-versus 2003-type turkeys when fed representative 1966 and
2003 turkey diets: Growth rate, livability, and feed conversion. Poult. Sci. 86:232-240.
Honikel, K. O. 1987. Influence of chilling on meat quality attributes of fast glycolysing pork
muscles. Pages 273-283 in Evaluation and Control of Meat Quality in Pigs. P. V. Tarrant,
G. Eikelenboom, G. Monin, Eds. Martinus Nijhoff, Dordrecht, the Netherlands.
Hulsegge, B., B. Engel, W. Buist, G. S. M. Merkus, and R. E. Klont. 2001. Instrumental colour
classification of veal carcasses. Meat Sci. 57:191-195.
Kauffman, R. G., W. Sybesma, F. J. M. Smulders, G. Eikelenboom, B. Engel, R. L. J. M. Van
Laack, A. H. Hoving-Bolink, P. Sterrenburg, E. V. Nordheim, P. Walstra, and P. G. Van
der Wal. 1993. The effectiveness of examining early post-mortem musculature to predict
ultimate pork quality. Meat Sci. 34:283-300.
Kim, G. D., J. Y. Jeong, S. J. Hur, H. S. Yang, J. T. Jeon, and S. T. Joo. 2010. The relationship
between meat color (CIE L* and a*), myoglobin content, and their influence on muscle
fiber characteristics and pork quality. Korean Journal for Food Sci. of Anim. Resources.
30:626-633.
Konica Minolta, Ramsey, New Jersey
Mancini, R. A., and M. C. Hunt. 2005. Current research in meat color. Meat Sci. 71:100–121.
McKee, S. R. and A. R. Sams. 1997. The effect of seasonal heat stress on rigor development and
the incidence of pale, exudative turkey meat. Poult. Sci. 76:1616-1620.
Midwest Processing Systems, Eden Prairie, Minnesota.
Minitab Inc., User manual of MINITAB statistical software. Release 13.31. State College, PA
16801 USA; 2000.

100
Offer, G. 1988. The structural basis of water-holding capacity in meat. Part 2. Drip losses.
Developments in meat science. 4:173-243.
Offer, G. 1991. Modelling of the formation of pale, soft and exudative meat: Effects of chilling
regime and rate and extent of glycolysis. Meat Sci. 30:157-184.
Offer, G., and P. Knight. 1988. The structural basis of water-holding capacity in meat. Part 2.
Drip losses. Pages 173-243 in Developments in meat science. R. Lawrie, ed. Vol. 4.
Elsevier Science Publications, London.
Owens, C. M., E. M. Hirschler, S. R. McKee, R. Martinez-Dawson, and A. R. Sams. 2000. The
characterization and incidence of pale, soft, exudative turkey meat in a commercial plant.
Poult. Sci. 79:553-558.
Pietrzak, M., M. L. Greaser, A. A. Sosnicki. 1997. Effect of rapid rigor mortis processes on
protein functionality in pectoralis major muscle of domestic turkeys. J. Anim. Sci.
75:2106-2116.
Rasmussen, A. J., and M. Andersson. 1996. New method for determination of drip loss in pork
muscles. Pages 286-287 in Proc. 42nd International Congress of Meat Science and
Technology. Lillehammer, Norway.
SAS Inst. Inc., Cary, NC.
Sante, V., G. Bielicki, M. Renerre, and A. Lacourt. 1991. Postmortem evaluation in Pectoralis
Superficialis muscle from two turkey breeds: a relationship between pH and color. Pages
465-468 in the 37th Int. Cong. Meat Sci. and Technol., Kulmbach, Germany.
Sams, A. R., and S. R. McKee. 2010. First processing; Slaughter through chilling. Pages 25-49 in
Poultry Meat Processing. Owens, C.M., C.Z. Alvarado, and A.R. Sams, ed. CRC Press,
Boca Raton, Florida.
Smith, D. P., and J. K. Northcutt. 2009. Pale poultry muscle syndrome. Poult. Sci. 88:1493-1496.
Sporer, K. R. B., H. R. Zhou, J. E. Linz, A. M. Booren, and G. M. Strasburg. 2012. Differential
expression of calcium-regulating genes in heat-stressed turkey breast muscle is associated
with meat quality. Poult. Sci. 91:1418-1424.
Strasburg, G. M., and W. Chiang. 2009. Pale, soft, exudative turkey—The role of ryanodine
receptor variation in meat quality. Poult. Sci. 88:1497-1505.
Swatland, H. J. 2004. Progress in understanding the paleness of meat with a low pH: keynote
address. South African J. Anim. Sci. 34:1-7.
Swatland, H. J., and S. Barbut. 1995. Optical prediction of processing characteristics of turkey
meat using UV fluorescence and NIR birefringence. Food Res. Int. 28:325-330.
Van Hoof, J. 1979. Influence of ante- and peri-mortem factors on biochemical and physical
characteristics of turkey breast muscle. Veterinary Quarterly. 1:29-36.

101
Van Laack, R. L., J. M., Liu, C. H., Smith, M. O. and H. D. Loveday. 2000. Characteristics of
pale, soft, exudative broiler breast meat. Poult. Sci. 79:1057-1061.
Warriss, P. D., and S. N. Brown. 1987. The relationships between initial pH, reflectance and
exudation in pig muscle. Meat Sci. 20:65-74.

102
Table 4-1. Instrumental meat quality parameters of breast muscle from three tom turkey strains harvested at 17 weeks of age (Exp 1).
a-bMeans within a column with no common superscripts differ significantly (P < 0.05). 1n=16 2CIE= International Commission on Illumination system color profile of L* (lightness), a* (redness) and b* (yellowness). 3WBS=Warner-Bratzler shear force.
Strain CIE2 Values Cook Yield
(%)
WBS3 Value
(Newtons) L* a* b*
A 51.6b 1.0975a 2.81a 72.30 20.63ab
B 53.3a 0.0988b 2.15ab 72.10 17.96b
C 51.1b 0.1794b 1.70b 72.80 23.33a
ANOVA P-Value 0.0045 0.0027 0.0161 0.5562 0.0021
SEM1 0.440 0.206 0.256 0.452 0.974
Fisher’s LSD 1.271 0.596 0.738 1.305 2.814
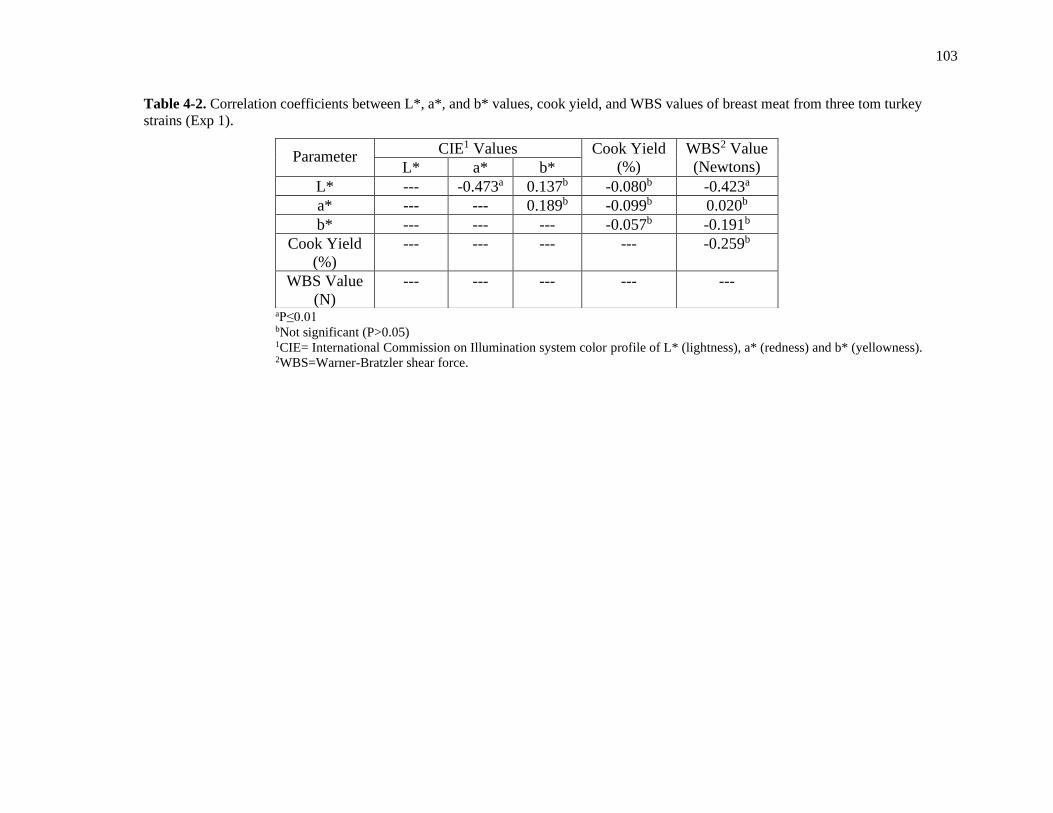
103
Table 4-2. Correlation coefficients between L*, a*, and b* values, cook yield, and WBS values of breast meat from three tom turkey
strains (Exp 1).
aP≤0.01 bNot significant (P>0.05) 1CIE= International Commission on Illumination system color profile of L* (lightness), a* (redness) and b* (yellowness). 2WBS=Warner-Bratzler shear force.
Parameter CIE1 Values Cook Yield
(%)
WBS2 Value
(Newtons) L* a* b*
L* --- -0.473a 0.137b -0.080b -0.423a
a* --- --- 0.189b -0.099b 0.020b
b* --- --- --- -0.057b -0.191b
Cook Yield
(%)
--- --- --- --- -0.259b
WBS Value
(N)
--- --- --- --- ---

104
Figure 4-1. The relationship between L* value and Warner-Bratzler shear value of turkey breast meat from experiment 1 (WBS value = 69.104
– 0.932* L* value; R2=0.179; P=0.003). The regression line represents raw data.
0.00
5.00
10.00
15.00
20.00
25.00
30.00
35.00
40.00
45.00 47.00 49.00 51.00 53.00 55.00 57.00 59.00 61.00
WB
S (
N)
L* Value

105
Table 4-3. Instrumental meat quality parameters of breast muscle from four tom turkey strains harvested at 17 weeks of age (Exp 2).
a-cMeans within a column with no common superscripts differ significantly (P < 0.05). 1n=12 2CIE= International Commission on Illumination system color profile of L* (lightness), a* (redness) and b* (yellowness). 3WBS=Warner-Bratzler shear force.
Strain Drip Loss
(%) pH
CIE2 Values Cook Yield
(%)
WBS3 Value
(Newtons) L* a* b*
A 2.92 5.90a 49.776c 0.723 1.362b 71.10 22.705
B 4.68 5.77b 53.359a 0.128 1.260b 71.42 20.468
D 3.11 5.86a 51.198b 0.505 2.522a 71.24 20.726
E 3.06 5.90a 50.380bc 0.151 1.686ab 72.56 20.793
ANOVA P-Value 0.0551 0.0036 <0.0001 0.2249 0.0215 0.1913 0.2352
SEM1 0.494 0.026 0.481 0.233 0.298 0.516 0.845
Fisher’s LSD 1.422 0.075 1.385 0.671 0.858 1.483 2.430

106
Table 4-4. Correlation coefficients between L*, a*, and b* values, pH, drip loss, cook yield, and WBS values of breast meat from four
tom turkey strains (Exp 2).
aP≤0.01 bNot significant (P>0.05) 1CIE= International Commission on Illumination system color profile of L* (lightness), a* (redness) and b* (yellowness). 2WBS=Warner-Bratzler shear force.
Parameter CIE1 Values
pH Drip loss
(%)
Cook Yield
(%)
WBS2 Value
(Newtons) L* a* b*
L* --- -0.513a -0.078b -0.465a 0.096b -0.404a -0.210b
a* --- --- 0.124b 0.158b 0.092b -0.127b 0.011b
b* --- --- --- -0.157b 0.230b -0.226b -0.117b
pH --- --- --- --- -0.180b 0.151b 0.222b
Drip Loss
(%)
--- --- --- --- --- -0.102b -0.277b
Cook Yield
(%)
--- --- --- --- --- --- 0.074b
WBS Value
(N)
--- --- --- --- --- --- ---
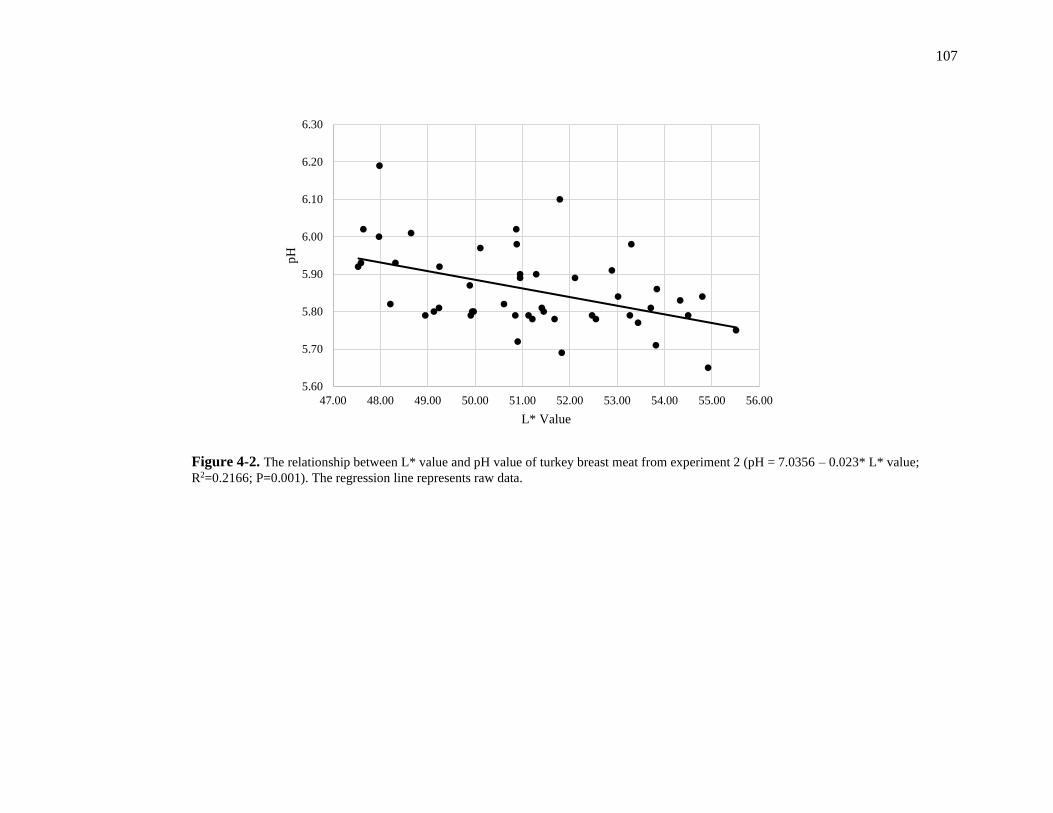
107
Figure 4-2. The relationship between L* value and pH value of turkey breast meat from experiment 2 (pH = 7.0356 – 0.023* L* value;
R2=0.2166; P=0.001). The regression line represents raw data.
5.60
5.70
5.80
5.90
6.00
6.10
6.20
6.30
47.00 48.00 49.00 50.00 51.00 52.00 53.00 54.00 55.00 56.00
pH
L* Value

108
Figure 4-3. The relationship between L* value and cook yield of turkey breast meat from experiment 2 (cook yield = 89.164 – 0.3436* L*
value; R2=0.1635; P=0.004). The regression line represents raw data.
66.00
68.00
70.00
72.00
74.00
76.00
78.00
47.00 48.00 49.00 50.00 51.00 52.00 53.00 54.00 55.00 56.00
Co
ok Y
ield
(%
)
L* Value

109
Table 4-5. Descriptive values for various meat quality parameters specific to tom turkey strain.
Sample sizes differed among strains and among analyses due to development of the method over time and different number of strains analyzed per
experiment. 1CIE= International Commission on Illumination system color profile of L* (lightness), a* (redness) and b* (yellowness). 2WBS=Warner-Bratzler shear force.
Strain CIE1 Values Cook Yield
(%)
WBS2 Value
(Newtons) pH
Drip Loss
(%) L* a* b*
A 50.82
(n=28)
0.94
(n=28)
2.19
(n=28)
71.81
(n=28)
21.52
(n=28)
5.90
(n=12)
2.92
(n=12)
B 53.31
(n=28)
0.11
(n=28)
1.77
(n=28)
71.78
(n=28)
19.03
(n=28)
5.77
(n=12)
4.68
(n=12)
C 51.1
(n=16)
0.18
(n=16)
1.70
(n=16)
72.80
(n=16)
23.33
(n=16)
---
---
D 51.20
(n=12)
0.51
(n=12)
2.52
(n=12)
71.24
(n=12)
20.73
(n=12)
5.86
(n=12)
3.11
(n=12)
E 50.38
(n=12)
0.15
(n=12)
1.69
(n=12)
72.56
(n=12)
20.79
(n=12)
5.90
(n=12)
3.06
(n=12)
110
Chapter 5
CONCLUSIONS AND FUTURE WORK
Integrators may be reluctant to employ feed manufacturing techniques that improve pellet
quality (PQ) due to throughput demand and the additional associated costs. Thus, it is imperative
to present additional benefits of providing more pellets in the diet to justify the manufacture of
improved PQ feed. It was concluded in chapter 2 that both PQ and feed line length affect nutrient
segregation. Modest improvements in pellet quality reduced both amino acid and phytase activity
segregation in both the 152-m and 76-m long feed lines. However, when challenges associated
with feed manufacturing prevent improvements to PQ, shorter feed line lengths can be used to
ultimately reduce nutrient segregation. It is important to note that the aforementioned study was a
single snapshot in time. Therefore, future work should be conducted to monitor nutrient
segregation throughout the grower or finisher phase in commercial houses.
It has been suggested that nutrient segregation affects bird performance and flock
uniformity. A flock that is uniform in body weight is economically important due to the
equipment at processing facilities being designed for a specific carcass size. In chapter 2 it was
observed that poor PQ feed contributes to an uneven distribution of nutrients throughout the feed
line in commercial houses. Thus, the amount of nutrients birds receive may be dependent upon
their location in the house. This idea was investigated in chapter 3 using feeds varying in PQ and
amino acid density to represent the amounts of pellets and amino acid concentrations that may be
present throughout various locations in the house. Although the birds in this study experienced a
health challenge, it was evident that dietary amino acid density influenced broiler performance.
Benefits to improving PQ were not evident, most likely due to the secondary E.coli infection.
Because of this, the experiment should be conducted again using vaccinated birds and providing

111
them with a nutritionally common starter diet to study the effects of PQ and amino acid density in
parallel.
Growing demand for poultry products has led to advances in genetic selection for birds
with increased breast yield and shorter grow-out periods. As a result, a greater occurrence of meat
quality issues has been observed. Researchers suggest that pale, soft, and exudative (PSE)
conditions are more prevalent in commercial turkeys than in broilers. Unidentified genetic
markers has made the removal of susceptible turkeys from market difficult. Therefore, a method
was developed to establish baseline values for meat quality parameters of various tom turkey
strains. Instrumental analyses were effective in indicating differences in meat quality attributes
between various strains of tom turkeys. Furthermore, L* value correlations observed in this study
were in line with that of previous research. Using this method, turkey genetic companies can
monitor the onset of PSE conditions in future generations of commercial turkeys. In the future
development of this method, a trained taste panel may be used for sensory analysis.
Recommended