E l e c t r i c a l Engineering i n Japan, Vol. 110, No. 5, 1990 Translated from Denki Gakkai Ronbunshi, Vol. 109A, No. 1 2 , December 1989, pp. 515-522
Electrical Characteristics of Polyimide LB Ultrathin-Film Condenser
MASAHITO KUSHIDA and TARO H I R O
Kanagawa Unive r s i ty Department of Electrical Engineering, Facul ty of Engineering,
1. In t roduc t ion
A polyimide LB (Langmuir-Blodgett) f i l m c o n s i s t s of a s i n g l e molecule l a y e r of only 4 . 2 A, and has a hea t r e s i s t a n c e above 200°C [ l ] . Therefore, a device of A l / A l 0 /Polyi-
mide LB f i l m (PI) /Al ( o r Au) s t r u c t u r e with mul t ip l e l a y e r s b u i l t u onto n a t i v e oxide
a n A l e l e c t r o d e forms a condenser w i t h a l a r g e capaci tance of approximately 1 vF/cm2 and a breakdown vo l t age of around 10 V [ 2 ] .
2 3
A 1 0 ( th i ckness 30-40 B ) on t h e s u r f a c e of 2 3
The p o s s i b i l i t y of a polyimide LB u l t r a - thin-f i lm condenser has been a t t r i b u t e d t o t h e suppression of t h e tunnel ing c u r r e n t . This i s due t o an extremely low A 1 0 resis-
tance compared t o t h a t of P 1 i n t h e hetero- u l t r a t h i n - f i l m A 1 0 / P I wi th a t h i ckness of
only s e v e r a l t e n s of A [ 3 ] . Therefore , t h i s paper examines va r ious c h a r a c t e r i s t i c s i n us- ing t h i s LB u l t r a t h i n - f i l m condenser. These include t h e e f f e c t of t h e r e l a t i v e l y l a r g e moisture abso rp t ion of t h e polyimide r e s i n , frequency c h a r a c t e r i s t i c s a r i s i n g from t h e A 1 0 / P I h e t e r o i n s u l a t o r , and an extremely
high breakdown f i e l d due t o t h e he t e ro f i lm . Also, t he dependence of c h a r a c t e r i s t i c s on the e l e c t r o d e metal have been observed. These r e s u l t s a r e reported h e r e .
2 3
2 3 0
2 3
2. Experimental Method
2.1 Sample
The polyimide LB f i l m c o n s i s t s of a s i n - g l e molecule l a y e r of Kapton-type polyimide chain molecules shown i n Fig. 1 placed on a plane. of a device s t r u c t u r e with t h i s LB f i l m formed on a microscope g l a s s s l i d e s u b s t r a t e .
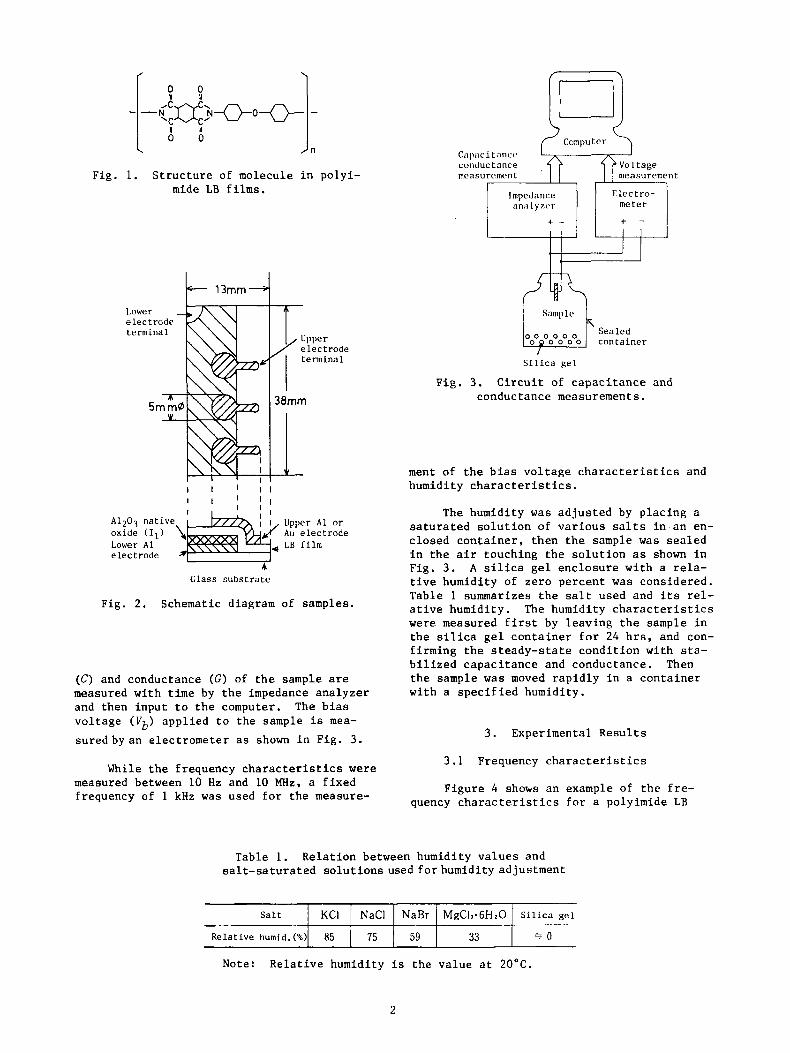
Figure 2 shows t h e schematic diagram
To prepare t h e device, f i r s t , A 1 i s
evaporated inovacuum as a lower e l e c t r o d e with a 30-40 A t h i c k A1203 f i l m on i t s sur-
f ace due t o t h e n a t i v e ox ida t ion i n a i r . The polyimide LB f i l m w a s formed on t h e A 1 0
f i lm . The capac i t ances of A 1 0 and P I are
separated by measuring t h e s t a t i c capaci tance of t h e A1203/PL(nL) h e t e r o - u l t r a t h i n f i l m f o r
va r ious samples wi th d i f f e r e n t numbers of monolayers n. The f i l m t h i c k n e s s i s calcu- l a t e d us ing t h e r e l a t i v e p e r m i t t i v i t y of 8 f o r A 1 2 0 3 ( t h i s v a l u e gene ra l ly i s used) [ 2 ,
31.
2 3
2 3
The number of monolayers of t h e polyi- mide LB f i l m v a r i e s from 4 t o 10 l a y e r s (4L 1OL) c o r r e s onding t o t h e LB f i l m th i ckness of 16.8-42 1. The A 1 o r Au upper e l e c t r o d e was evaporated onto t h e LB f i l m . The e l ec -
L t rode a r e a is approximately 0.2 cm (a c i r c l e with a diameter of 5 mm). Since t h i s con- denser h a s two k inds of i n s u l a t o r s , A1203(11)
and polyimide LB f i l m ( I 2 ) , i t h a s an M / I I / I ~ M s t r u c t u r e .
2.2 Measurement method
The measured q u a n t i t i e s i n t h i s experi- ment a r e s t a t i c capac i t ance and conductance using an LF impedance ana lyze r TYPE 4192A made by YHP. The measurement frequency range i s 5 Hz t o 13 MHz, and t h e measurement used d c b i a s vo l t age of 0-15 V a l though i t can ap- ply d c b i a s up t o ?35 V .
While t h e frequency and t h e b i a s v o l t a g e were v a r i e d , t h e a p p l i e d a c v o l t a g e w a s f i x e d a t 20 mV. I n t h e measurement, a computer was used as shown i n Fig. 3, and t h e measurement and recording were c a r r i e d ou t au tomat i ca l ly a f t e r t h e measurement condi t ion w a s set up. I n o t h e r words, t h e app l i ed v o l t a g e i s in- creased i n s t e p s of 0.1 V , and t h e capaci tance
1 1SSN0424-7760/90/0005-0001$7.50/0 0 1990 S c r i p t a Technica, Inc.
, '1
-0-0-0- -
L I n
Impedance m. i lyzr r
+ -
F i g . 1. Structure of molecule in polyi- mide LB films. E l e c t ro-
meter
I f -
I I ' I I ' I I ! I
Upper A1 o r Au e l e c t r o d e
Lower A 1 LH f i l m e l e c t r o d e fl
4 Class s u b s t r a t e
Fig. 2. Schematic diagram of samples.
( C ) and conductance ( G ) of the sample are measured with time by the impedance analyzer and then input to the computer. The bias voltage (Vb) applied to the sample is mea- suredbyan electrometer as shown in Fig. 3.
While the frequency characteristics were measured between 10 Hz and 10 MHz, a fixed frequency of 1 kHz was used for the measure-
Sample ' Sealed
S i l i c a gel
Fig. 3 . Circuit of capacitance and conductance measurements.
ment of the bias voltage characteristics and humidity characteristics.
The humidity was adjusted by placing a saturated solution of various salts in an en- closed container, then the sample was sealed in the air touching the solution as shown in Fig. 3. A silica gel enclosure with a rela- tive humidity of zero percent was considered. Table 1 summarizes the salt used and its rel- ative humidity. The humidity characteristics were measured first by leaving the sample in the silica gel container for 24 hrs, and con- firming the steady-state condition with sta- bilized capacitance and conductance. Then the sample was moved rapidly in a container with a specified humidity.
3. Experimental Results
3.1 Frequency characteristics
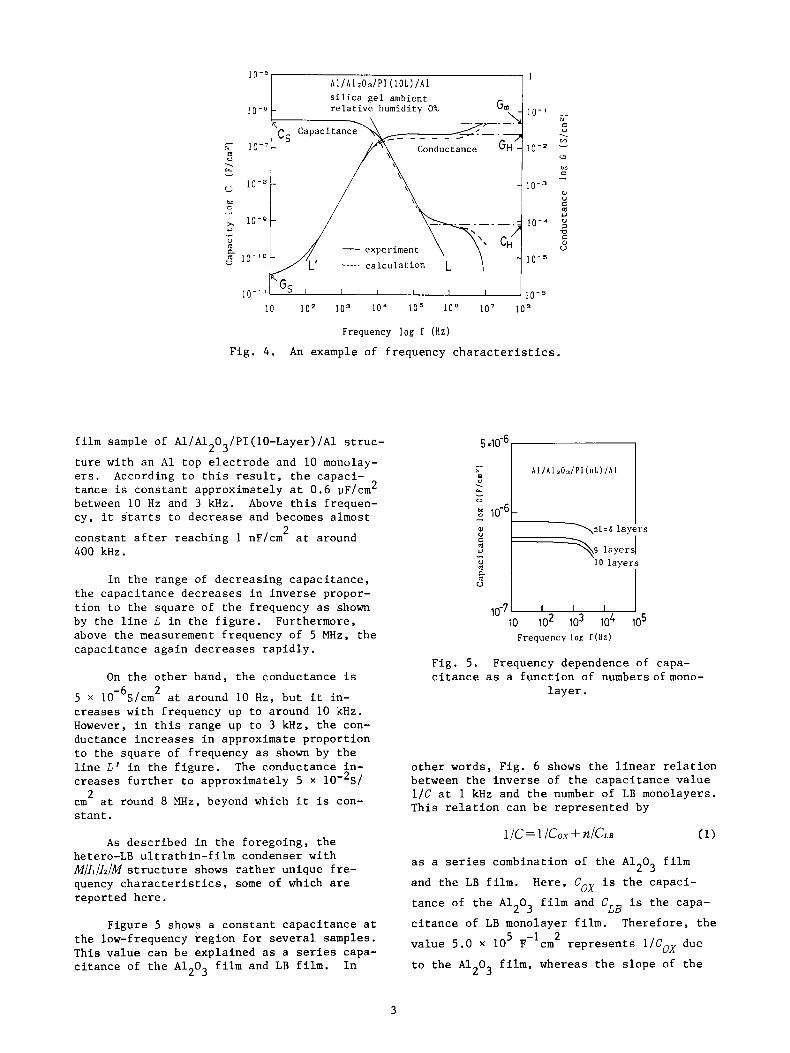
Figure 4 shows an example of the fre- quency characteristics for a polyimide LB
Table 1. Relation between humidity values and salt-saturated solutions used forhumidity adjustment
-- Rela t ive humid.(%)
Note: Relative humidity is the value at 20°C.
2
A 1 / A 1 20 J P I ( 101) / A 1 s i l i c a g e l ambient
" . LL - bc
Y .4
U
experiment c a l c u l a t i o n
I
10' ' E " . co
10-2 - u
1 0 - 5
I I I I I 1 0 - 0 I Gs I s
l o - " 1 0 1 0 2 103 10' lo5 lo6 107 108
Frequency l o g f (Hz)
Fig. 4 . An example of frequency c h a r a c t e r i s t i c s .
f i l m sample of A1/Al2O3/PI(1O-Layer)/Al s t r u c -
t u r e wi th an A 1 top e l e c t r o d e and 10 monolay- e r s . According t o t h i s r e s u l t , t h e capac i - t ance i s cons t an t approximately a t 0 .6 pF/cm2 between 10 Hz and 3 kHz. Above t h i s frequen- cy, i t s ta r t s t o dec rease and becomes almost
n L cons tan t a f t e r reaching 1 nF/cm a t around
400 kHz . I n t h e range of dec reas ing capac i t ance ,
t h e capac i tance dec reases i n i n v e r s e propor- t i o n t o t h e square of t h e frequency a s shown by t h e l i n e L i n t h e f i g u r e . Furthermore, above t h e measurement frequency of 5 MHz, t h e capac i tance aga in dec reases r a p i d l y .
On t h e o t h e r hand, t h e conductance i s 2 5 x 10⁻⁶S/cm
c reases wi th frequency up t o around 10 kHz. However, i n t h i s range up t o 3 kHz, t h e con- ductance i n c r e a s e s i n approximate p ropor t ion t o t h e square of frequency as shown by t h e l i n e L' i n t h e f i g u r e . The conductance in - c r eases f u r t h e r t o approximately 5 x 10⁻²S/
cm2 a t round 8 MHz, beyond which i t i s con- s t a n t .
a t around 10 Hz, b u t i t in-
A s descr ibed i n t h e foregoing , t h e hetero-LB u l t r a t h i n - f i l m condenser wi th A~/II/I& s t r u c t u r e shows r a t h e r unique f r e - quency c h a r a c t e r i s t i c s , some of which are repor ted h e r e .
F igure 5 shows a cons t an t capac i t ance a t t h e low-frequency reg ion f o r s e v e r a l samples. This va lue can be expla ined a s a series capa- c i t a n c e of t h e A1203 f i l m and LB f i l m . I n
5
A l / A 1 . O s / P I ( n 1 ) / A I . nL.4 l a y e r s
9 l a y e r 4 1 0 l a y e r s
U
10-7 - 10 102 103 104 105
Frequency l o g f (Hz)
Fig . 5. Frequency dependence of capa- c i t a n c e a s a f u n c t i o n of numbersofmono-
l a y e r .
o t h e r words, F ig . 6 shows t h e l i n e a r r e l a t i o n between t h e i n v e r s e of t h e capac i t ance v a l u e 1 / C a t 1 kHz and t h e number of LB monolayers. This r e l a t i o n can b e r ep resen ted by
1 /c = 1 I C O X + Y l / C L B (1)
as a series combination of t h e A1203 f i l m
and t h e LB f i l m .
t ance of t h e A 1 0
c i t a n c e of LB monolayer f i l m . Therefore , t h e
va lue 5.0 x 10 F cm r e p r e s e n t s l/Cox due
t o t h e A1203 f i l m , whereas t h e s l o p e of t h e
Here, Cox i s t h e capac i -
f i l m and CLB i s t h e capa- 2 3
5 -1 2
3
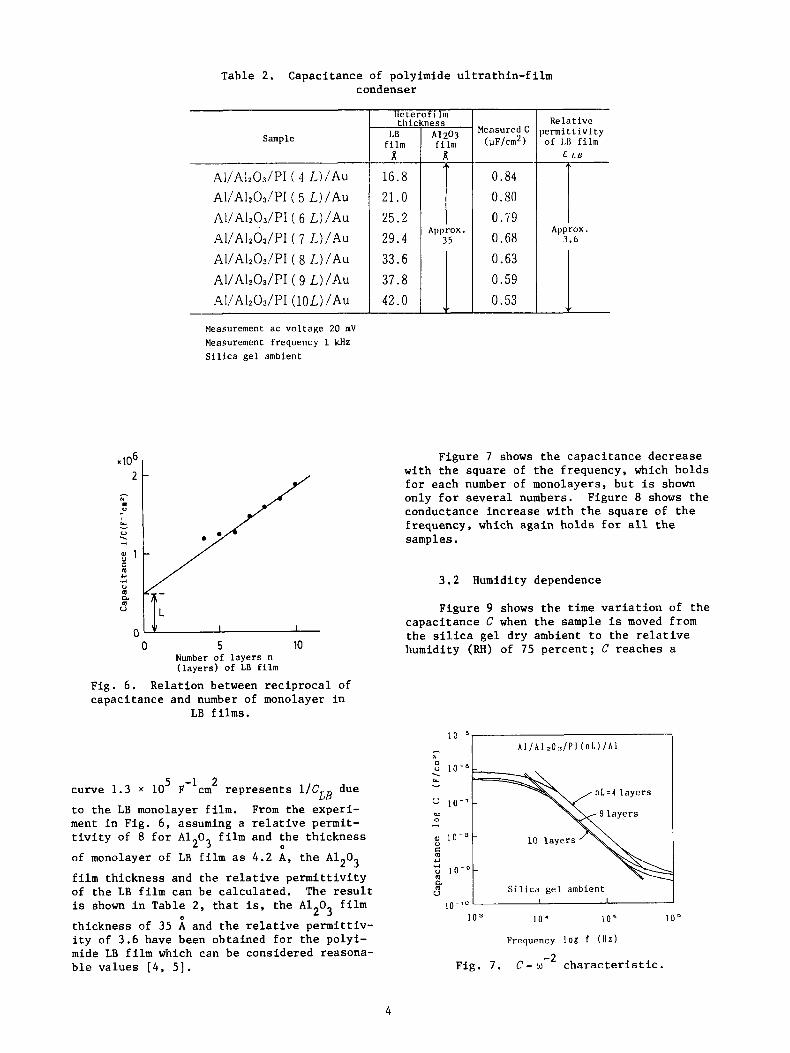
Table 2. Capacitance of polyimide u l t r a t h i n - f i l m condenser
Sample
Measurement ac voltage 20 mV Mea~urement frequency 1 kHz Silica gel ambient
Y
0 . - s ’ rd Y .r(
0
4 U
0’ 0 5 10
Number of layers n (layers) of LB film
Fig, 6 . Relat ion between r e c i p r o c a l of capaci tance and number of monolayer i n
LB f i l m s .
5 -1 2 curve 1.3 x 10 F cm rep resen t s l/CLB due
t o t h e LB monolayer f i l m . From the experi- ment i n Fig. 6 , assuming a r e l a t i v e permit- t i v i t y of 8 f o r A1203 f i l m and t h e th i ckness
of monolayer of LB f i l m as 4 .2 A , t h e A1203
f i l m thickness and t h e r e l a t i v e p e r m i t t i v i t y of t h e LB f i l m can be ca l cu la t ed . The r e s u l t is shown i n Table 2, t h a t i s , the A 1 0 f i l m
thickness of 35 A and t h e r e l a t i v e pe rmi t t i v -
0
2 3 0
m LB film
X
t h i c
16.8 21.0 25.2 29.4 33.6 37.8 42.0
film less A1203 film
i Approx
35
Measured C (uF/cm2)
0.84 0.80 0.79 0.68 0.63 0.59 0.53
Re la t ivc ermittivity of LB film
T Approx . 3 . 6
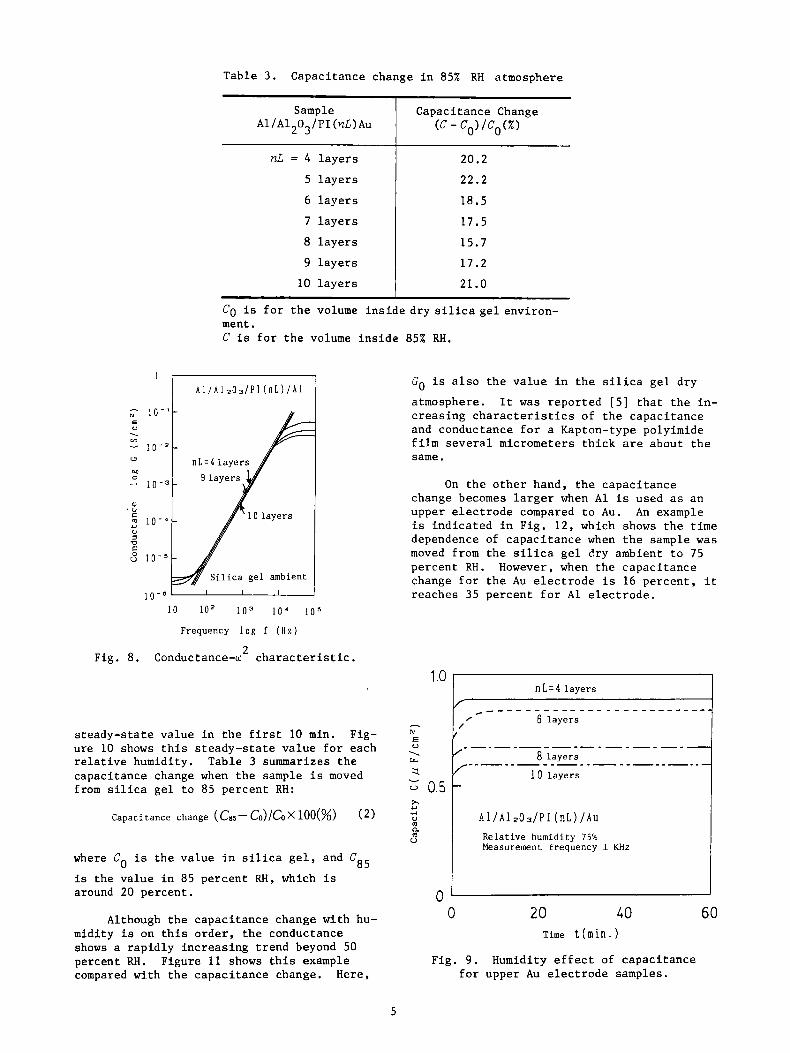
Figure 7 shows t h e capaci tance decrease with t h e square of t h e frequency, which ho lds f o r each number of monolayers, bu t i s shown only f o r s e v e r a l numbers. Figure 8 shows t h e conductance i n c r e a s e with t h e square of t h e frequency, which aga in ho lds f o r a l l t h e samples.
3.2 Humidity dependence
Figure 9 shows t h e t i m e v a r i a t i o n of t h e capaci tance C when t h e sample i s moved from t h e s i l i c a g e l dry ambient t o t h e r e l a t i v e humidity (RH) of 75 pe rcen t ; C reaches a
5 1 0 - 0 . Lr
0 l o - ’ M 0
c U .%-I
a U
4 I 0 - O
Silica gel ambient 1 I
103 10. 10 ’ l o e
i t y of 3.6 have been obtained f o r t h e polyi- Frequency log f (112)
-2 mide LB f i l m which can be considered reasona- b l e values [ 4 , 51. Fig. 7 . C - w c h a r a c t e r i s t i c .
4
1
N l o - '
- 1 0 - 2
E U . cn
u e.0 0 - 1 0 - 3
0) ' U
S 1 0 - 4
U
P
S 1 0 - 5
1 0 - e
Sample A1/A1203/PI(nL)Au
nL = 4 l a y e r s
5 l a y e r s
6 l a y e r s
7 l a y e r s
8 l a y e r s
9 l a y e r s
10 l a y e r s
Capacitance Change (C - CO)/CO(X)
- 20.2
2 2 . 2
18.5
17.5
15.7
17.2
21.0
ment. C is f o r t h e volume i n s i d e
x Y
U .rl
a U
I I I
A 1/Al ;.O J P I (nL) / A u
Relative humidity 75% Measurement frequency 1 KHz
10 10' 1 0 3 1 0 4 1 0 s
Frequency l o g f ( n Z )
n L Fig. 8. Conductance-o c h a r a c t e r i s t i c .
s teady-state va lue i n t h e f i r s t 10 min. Fig- ure 10 shows t h i s s t eady- s t a t e va lue f o r each r e l a t i v e humidity. Table 3 summarizes t h e capaci tance change when t h e sample is moved from s i l ica g e l t o 85 percent RH:
where C is t h e va lue i n 85 percent RH, which is around 20 percent .
is t h e va lue i n s i l i c a g e l , and CB5 0
Although t h e capaci tance change with hu- midity is on t h i s o rde r , t h e conductance shows a r ap id ly inc reas ing t rend beyond 50 percent RH. Figure 11 shows t h i s example compared with t h e capaci tance change. Here,
85% RH.
Go is a l s o t h e v a l u e i n t h e s i l i c a g e l dry
atmosphere. It w a s r epor t ed [5 ] t h a t t h e i n - c r eas ing c h a r a c t e r i s t i c s of t h e capaci tance and conductance f o r a Kapton-type polyimide f i l m s e v e r a l micrometers t h i c k are about t h e same.
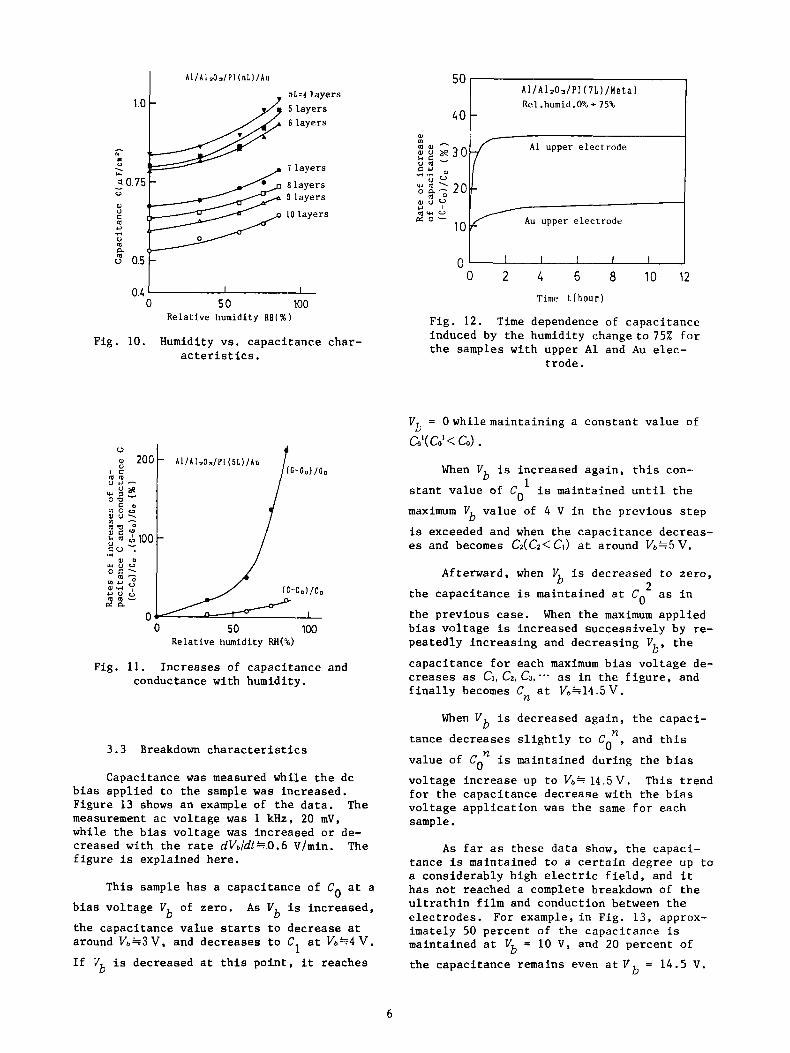
On t h e o t h e r hand, t h e capac i t ance change becomes l a r g e r when A 1 is used as an upper e l e c t r o d e compared t o Au. An example is i nd ica t ed i n Fig. 1 2 , which shows t h e t i m e dependence of capac i t ance when t h e sample w a s moved from t h e s i l i ca g e l dry ambient t o 75 percent RH. change f o r t h e Au e l e c t r o d e i s 16 pe rcen t , i t reaches 35 percent f o r A 1 e l e c t r o d e .
However, when t h e capac i t ance
U
0 20 40 60 Time t(min.1
Fig. 9 . Humidity e f f e c t of capaci tance f o r upper Au e l e c t r o d e samples.
5
nb.4 layers 5 layers 6 layers
1 layers
8 layers 9 layers
10 layers
0 50 100 Relative humidity R 6 ( % 1
Fig. 10. Humidity vs . capaci tance char- a c t e r i s t i c s .
u
0 50 100 Relative humidity RH(%)
Fig. 1 1 . Inc reases of capaci tance and conductance with humidity.
3 . 3 Breakdown c h a r a c t e r i s t i c s
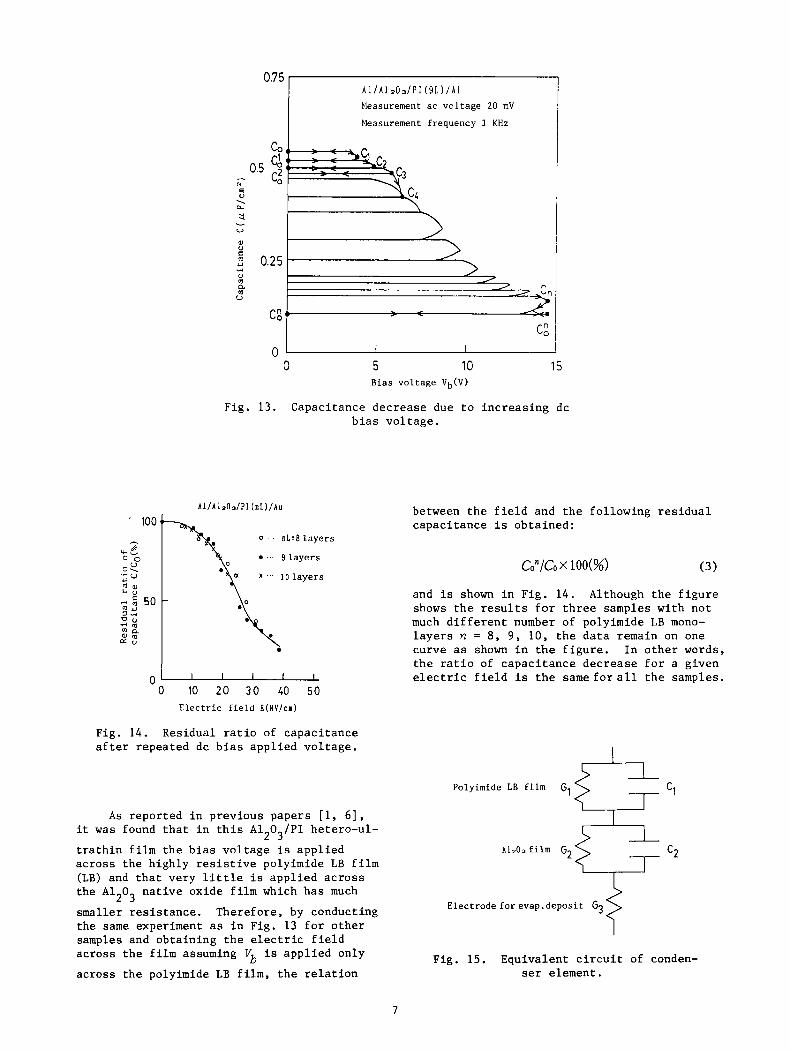
Capacitance was measured while t h e dc b i a s app l i ed t o t h e sample was increased. Figure 13 shows an example of t h e d a t a . The measurement a c vo l t age was 1 kHz, 20 mV, while t h e b i a s vo l t age w a s increased o r de- creased with t h e r a t e dVbldts.0.6 Vlmin. f i g u r e is explained here .
The
This sample has a capaci tance of Co a t a
b i a s vo l t age Vb of zero. A s Vb i s inc reased ,
t h e capaci tance value starts t o decrease a t around vb=3v, and decreases t o Cl a t vb=4v.
I f Vb is decreased a t t h i s po in t , i t reaches
Rel.humid.0%+75% LO
0 < 0 2 4 6 8 1 0 1 2
Time t ( h o u r )
Fig. 12. T i m e dependence of capac i t ance induced by t h e humidity change t o 75% f o r t h e samples with upper A 1 and Au elec-
t rode .
V,., = Owhilemaintaining a cons t an t value of
L l ( C l < Cd . When V is increased aga in , t h i s con-
s t a n t va lue of Col is maintained u n t i l t h e
maximum V va lue of 4 V i n t h e previous s t e p
is exceeded and when t h e capac i t ance decreas- es and becomes C~(CZ<CI) a t around vb=5v.
b
b
Afterward, when V i s decreased t o ze ro , b t he capac i t ance i s maintained a t Co2 as i n
t h e previous case. When t h e maximum app l i ed b i a s v o l t a g e is increased success ive ly by re- peatedly inc reas ing and decreasing Vb, t h e
capaci tance f o r each maximum b i a s vo l t age de- c reases as CI, CZ, c3, ... a s i n t h e f i g u r e , and f i n a l l y becomes Cn a t Vb=14.5V.
When V b is decreased aga in , t h e capaci- n tance dec reases s l i g h t l y t o C , and t h i s
value of Co is maintained during t h e b i a s
vo l t age i n c r e a s e up t o v b = 14.5v. This t r end f o r t h e capaci tance decrease with t h e b i a s v o l t a g e a p p l i c a t i o n was t h e same f o r each sample.
0 n
A s f a r as these da t a show, t h e capaci- tance i s maintained t o a c e r t a i n degree up t o a considerably high e l e c t r i c f i e l d , and i t h a s no t reached a complete breakdown of t h e u l t r a t h i n f i l m and conduction between t h e e l ec t rodes . For example, i n Fig. 13, approx- imately 50 percent of t he capaci tance is maintained a t vb = 10 V , and 20 percent of
t h e capaci tance remains even a t V b = 14.5 V .
6
Eleasurement ac voltage 20 mV
Measurement frequency 1 KHz
0.5 - N E 0
0)
U
: 0.25
0 5 10 15 Bias voltage V,(V)
Fig. 13. Capacitance decrease due t o i n c r e a s i n g dc b i a s vo l t age .
nl.8 layers
9 layers
10 layers
0- 0 10 20 30 40 50
Electric f i e l d E [ H V / c m )
Fig. 14. Residual r a t i o of capaci tance a f t e r repeated dc b i a s app l i ed vo l t age .
A s reported i n previous papers [ l , 61, i t was found t h a t i n t h i s A1203/PI hetero-ul-
t r a t h i n f i l m t h e b i a s v o l t a g e is app l i ed ac ross the highly r e s i s t i v e polyimide LB f i lm (LB) and t h a t very l i t t l e is app l i ed a c r o s s the A1203 n a t i v e oxide f i l m which h a s much
smaller r e s i s t a n c e . Therefore , by conducting the same experiment as i n Fig. 13 f o r o t h e r samples and obtaining t h e e l e c t r i c f i e l d across t h e f i l m assuming Vb is app l i ed only
across the polyimide LB f i lm , t h e r e l a t i o n
between t h e f i e l d and t h e fol lowing r e s i d u a l capaci tance i s obtained:
( 3 )
and is shown i n Fig. 14. Although t h e f i g u r e shows t h e r e s u l t s f o r t h r e e samples with n o t much d i f f e r e n t number of polyimide LB mono- l a y e r s n = 8, 9, 10, t h e d a t a remain on one curve as shown i n t h e f i g u r e . I n o t h e r words, t h e r a t i o of capac i t ance dec rease f o r a given e l e c t r i c f i e l d is t h e same f o r a l l t h e samples.
e c1
Polyimide LB fi lm G,
Fig. 15. Equivalent c i r c u i t of conden- ser element.
7
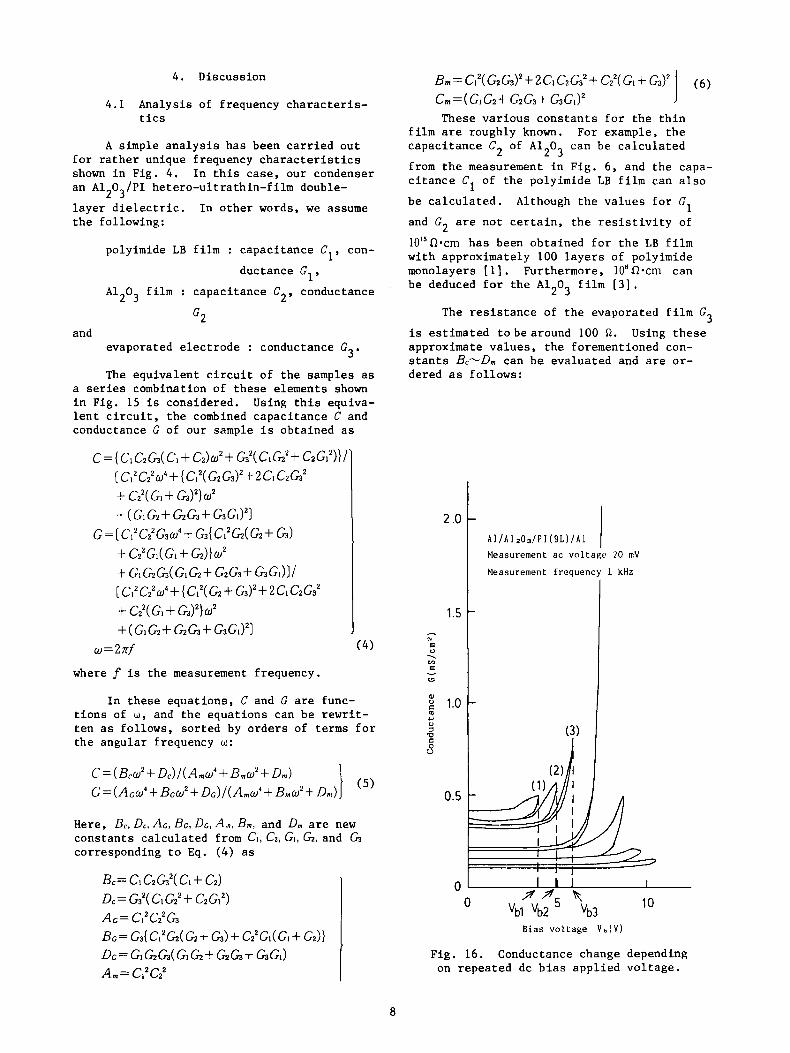
4 . Discussion
4.1 Analysis of frequency characteris- tics
A simple analysis has been carried out for rather unique frequency characteristics shown in Fig. 4 . In this case, our condenser an A1 0 /PI hetero-ultrathin-film double- 2 3 layer dielectric. In other words, we assume the following:
1' con- polyimide LB film : capacitance C
ductance G1,
A1 0 film : capacitance C2, conductance 2 3 G2
and 3 ' evaporated electrode : conductance G
The equivalent circuit of the samples as a series combination of these elements shown in Fig. 15 is considered. Using this equiva- lent circuit, the combined capacitance C and conductance G of our sample is obtained as
( 4 )
In these equations, C and G are func- tions of w, and the equations can be rewrit- ten as follows, sorted by orders of terms for the angular frequency w:
C=( B~w'+ D c ) / ( A m ~ ' f B m d + Dm) C;=(Acu'+ Bcw'+ Dc)/(Amw'+ Bmd+ D m )
B m = CiZ( GG)'+ 2C1 CzG? + C:( GI + &)' (6) Cm=(G1G+ GC3+G3Cl)' I These various constants for the thin
film are roughly known. For example, the capacitance C2 of A1 0 can be calculated 2 3 from the measurement in Fig. 6, and the capa- citance C1 of the polyimide LB film can also
1 be calculated. Although the values for G
and G are not certain, the resistivity of
lOI5R.crn has been obtained for the LB film with approximately 100 layers of polyimide monolayers [ 11. Furthermore, 10nOn.cm can be deduced for the A1203 film [3].
2
3 The resistance of the evaporated film G
is estimated tobearound 100 a. Using these approximate values, the forementioned con- stants Bc-Dm can be evaluated and are or- dered as follows:
2 .o
1.5 - N e 0 -. M E
W Y
2 1.0 4 U u 'c1
0 u
0.5
0
A 1 / A 1 ;.Oa/P I (91) / A 1 Measurement ac v o l t a g e 20 m V
Measurement f r equency 1 kHz
375 h 10 'bl 'b2 'b3
Bias voltage V , ( V )
Fig. 16. Conductance change depending on repeated dc bias applied voltage.
8
h I " . L
1.0 1 A 1 / A 1 z O s / ~ I ( 10 1) / A u
0- 0 5 10
Bias voltage V b ( V )
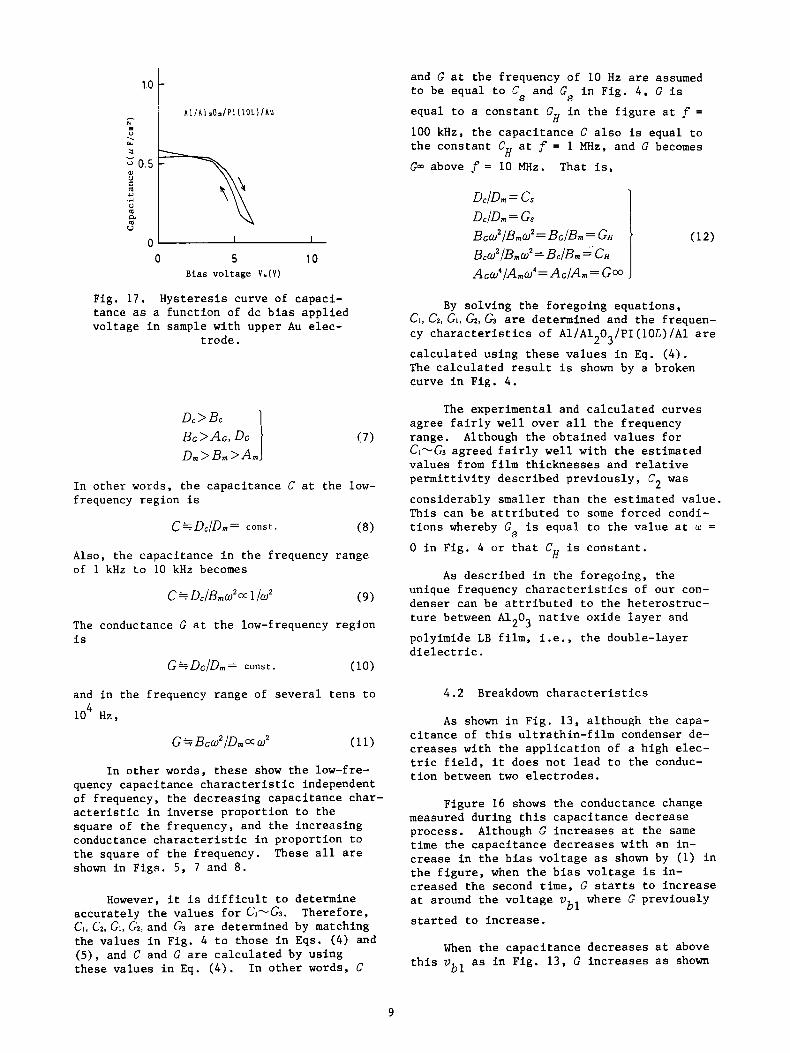
Fig. 17 . Hys te re s i s curve of capaci- tance as a func t ion of dc b i a s app l i ed vo l t age i n sample with upper Au e l ec -
t r o d e .
( 7 )
In o the r words, t h e capaci tance C a t t h e low- frequency region i s
C=Dc/Dm= cons t . (8)
Also, t h e capaci tance i n t h e frequency range of 1 kHz t o 10 kHz becomes
C + Dc/BmW2m l / ~ ' (9)
The conductance G a t t h e low-frequency region i s
and i n t h e frequency range of s e v e r a l t e n s t o
10 Hz, 4
G + BcW2/Dm 0: W' (11)
I n o t h e r words, t h e s e show t h e low-fre- quency capaci tance c h a r a c t e r i s t i c independent of frequency, t h e decreasing capaci tance char- a c t e r i s t i c i n inve r se proport ion t o t h e square of t h e frequency, and t h e inc reas ing conductance c h a r a c t e r i s t i c i n p ropor t ion t o t h e square of t h e frequency. These a l l are shown i n Figs . 5 , 7 and 8 .
However, i t i s d i f f i c u l t t o determine accu ra t e ly t h e va lues f o r C1-G. Therefore , CI, CZ, GI, &, and G are determined by matching the values i n Fig. 4 t o those i n Eqs. ( 4 ) and (5), and C and G are c a l c u l a t e d by us ing these va lues i n Eq. ( 4 ) . I n o t h e r words, C
and G a t t h e frequency of 10 Hz are assumed t o be equal t o C equal t o a cons t an t G i n t h e f i g u r e a t f = H 100 kHz, t h e capac i t ance C a l s o i s equal t o t h e cons t an t CH a t f = 1 MHz, and G becomes
and Gs i n Fig. 4 , G i s s
G- above f = 10 MHz. That i s ,
DJDm = Cs DcIDm= Gs B C W 2 / B m W 2 = Bc/Bm= GH BcW2/BmW2= BJBm = C H A c w ' / A m ~ ' = A c / A m = GW
By so lv ing t h e foregoing equa t ions , ci, c2, GI, G, G are determined and t h e frequen- cy c h a r a c t e r i s t i c s of A11A12031PI(10L)IA1 a re
c a l c u l a t e d using t h e s e v a l u e s i n Eq. ( 4 ) . The c a l c u l a t e d r e s u l t i s shown by a broken curve i n Fig. 4 .
The experimental and c a l c u l a t e d curves agree f a i r l y w e l l over a l l t h e frequency range, Although t h e obtained v a l u e s f o r c1-G~ agreed f a i r l y w e l l w i th t h e est imated va lues from f i l m th i cknesses and r e l a t i v e p e r m i t t i v i t y desc r ibed p rev ious ly , C2 w a s
considerably smaller than t h e est imated va lue . This can be a t t r i b u t e d t o some forced condi- t i o n s whereby G i s equal t o t h e va lue a t w =
0 i n Fig. 4 o r t h a t CH i s cons t an t . s
A s descr ibed i n t h e foregoing, t h e unique Erequency c h a r a c t e r i s t i c s of our con- denser can be a t t r i b u t e d t o t h e h e t e r o s t r u c - t u r e between A1203 n a t i v e oxide l a y e r and
polyimide LB f i l m , i . e . , t h e double-layer d i e l e c t r i c .
4 .2 Breakdown c h a r a c t e r i s t i c s
A s shown i n F i g . 13, a l though t h e capa- c i t a n c e of t h i s u l t r a t h i n - f i l m condenser de- c r e a s e s with t h e a p p l i c a t i o n of a high elec- t r i c f i e l d , i t does no t l e a d t o t h e conduc- t i o n between two e l e c t r o d e s .
Figure 16 shows t h e conductance change measured during t h i s capac i t ance decrease process . Although G i n c r e a s e s a t t h e same t i m e t h e capac i t ance dec reases wi th an in- c r e a s e i n t h e b i a s v o l t a g e as shown by (1) i n t h e f i g u r e , when t h e b i a s v o l t a g e i s in- creased t h e second t i m e , G s tar ts t o i n c r e a s e a t around t h e v o l t a g e vbl where G previously
s t a r t e d t o i n c r e a s e .
When t h e capac i t ance decreases a t above t h i s vbl as i n Fig. 13, G i n c r e a s e s as shown
9
by (2) i n Fig. 16. Therefore , although t h e conductance G i n c r e a s e s with t h e inc rease i n t h e b i a s V and t h e decrease i n capac i t ance ,
t h e conductance G decreases with t h e b i a s vo l t age V and i s reduced aga in , and t h e in -
s u l a t i o n i s recovered.
b
b
From t h e experimental r e s u l t s i n Figs. 13 and 15, i t is considered t h a t although t h e f i l m is destroyed by a l a r g e c u r r e n t flow through a p a r t of t h e h e t e r o - u l t r a t h i n f i l m by t h e b i a s vo l t age inc rease t h e evaporated e l e c t r o d e scatters a t t h e same time. I f t h i s is t h e case , although t h e sample capac i t ance decreases corresponding t o t h e r eg ion of breakdown, the i n s u l a t i o n s t i l l i s maintained.
Visual observat ion h a s a l s o confirmed t h e p a r t i a l damaging of t h e sample. Whereas the p a r t i a l breakdown i s a t t r i b u t e d t o v a r i - ous inhomogeneous regions wi th in t h e LB f i l m , some regions can t o l e r a t e t h e vo l t age around 15 V , and f u r t h e r improvement of breakdown c h a r a c t e r i s t i c s i s expected with t h e improve- ment of t h e f i l m q u a l i t y .
The reason f o r t h e b e t t e r humidity char- a c t e r i s t i c s with the A 1 upper e l e c t r o d e com- pared t o Au i n Fig. 12 is not c l e a r . The breakdown c h a r a c t e r i s t i c s are a l s o expected t o be b e t t e r with t h e Au upper e l ec t rode .
Figure 17 shows t h e r e s u l t of applying b i a s vo l t age V with p o s i t i v e p o l a r i t y on t h e
Au upper e l e c t r o d e f o r t h e A1/A1203/PI(10L) / Au sample. Although t h e capaci tance C de- c reases with t h e inc rease i n Vb, t h e capaci-
tance inc reases and reaches t h e same value again when the Vb again i s decreased.
f o r e , i t i s expected t h a t t h e f i l m was not damaged i n c o n t r a s t t o t h e sample wi th both upper and lower A 1 e l e c t r o d e s shown i n Fig. 13.
b
There-
5. Conclusions
Considering va r ious c h a r a c t e r i s t i c s of a polyimide LB u l t r a t h i n - f i l m condenser, i t s capaci tance and conductance have been exam- ined. The frequency c h a r a c t e r i s t i c of t h e capaci tance i s cons t an t up t o s e v e r a l t e n s k i l o h e r t z , and i t s value i s equal approxi- mately t o t h e combined capaci tance f o r a series connection of t h e A 1 0 f i lm and t h e
polyimide LB f i l m , capaci tance decreases i n inve r se proport ion t o t h e square of t h e frequency and shows a complex behavior .
2 3 Above t h i s frequency t h e
The conductance i n c r e a s e s f i r s t i n pro- po r t ion t o t h e square of t h e frequency, but
reaches a cons t an t value. c h a r a c t e r i s t i c s can be explained by an equi- v a l e n t c i r c u i t c o n s i s t i n g of t h e capac i t ance and conductance of t h e A 1 0 f i l m and t h e
polyimide LB f i l m . The humidity c h a r a c t e r i s - t i c s are almost t h e same as those f o r a Kapton-type polyimide f i l m which i s t h e same kind as t h i s LB f i lm . Furthermore, i n t h e breakdown c h a r a c t e r i s t i c s , al though i t shows i n s u l a t o r breakdown a t high e l e c t r i c f i e l d , i t s damaged region a l s o h a s t h e e l e c t r o d e removed as w e l l , and t h e i n s u l a t i o n i s recov- e red . Some reg ions remain without any damage even with 15-V b i a s vo l t age , and t h e s e re- gions can be extended by improving t h e f i l m q u a l i t y .
These frequency
2 3
Since an extremely high e l e c t r i c f i e l d i s app l i ed i n our polyimide LB u l t r a t h i n - f i l m condenser, a tunne l ing c u r r e n t i s a l s o rela- t i v e l y l a r g e . I t i s considered necessary f o r t h i s condenser t o i n c r e a s e t h e LB f i l m th i ck - nes s and t o reduce t h e conductance by sup- p re s s ing t h e c u r r e n t , even with some reduc- t i o n of t h e capaci tance.
Acknowledgement
The a u t h o r s thank M r . Kenji Shimizu, a graduate s t u d e n t , f o r h i s a s s i s t a n c e with t h e experiment.
REFERENCES
1.
2 .
3.
4 .
5.
6.
10
Suzuki, Iwamoto, !ino, Kakimoto and Imai. Fab r i ca t ion of 4 A t h i c k polyimide LB u l t r a t h i n - f i l m and i t s f i l m c h a r a c t e r i s - t ics . Trans. I . E . C . E . , Japan, A , Vol. 106, 435, Sept. 1986. Hino, Kushida and Mizobata. Breakdown c h a r a c t e r i s t i c s of polyimide LB u l t r a - t h in - f i lm and i t s M / I l / I 2 / M s t r u c t u r e u l - t r a t h i n - f i l m condenser. I b i d . , A , Vol. 107, 555, Dec. 1987. Hino and Kushida. Phenomena i n po ly i - mide Langmuir-Blodgett i n s u l a t o r f i l m under extremely high e lectr ic f i e l d . I b i d . , A , Vol. 107, 142, Mar. 1987. For example, E. Schabowaska, E. Schabow- ska. E l e c t r i c a l conduction i n M I M sand- wich s t r u c t u r e with A 1 2 0 3 i n s u l a t i n g
l a y e r s . Thin So l id Films, Vol. 75, 177, 1980. Tsiiboi. Polyimide f i l m 'Kapton.' In- d u s t r i a l Materials, Vol. 31, 63, 1983. Hino and Kushida. Tunnel b a r r i e r i n h e t e r o i n s u l a t o r u l t r a t h i n - f i l m . Trans. I.E.C.E., Japan, A, Vol. 109, 413, Sep t . 1989.
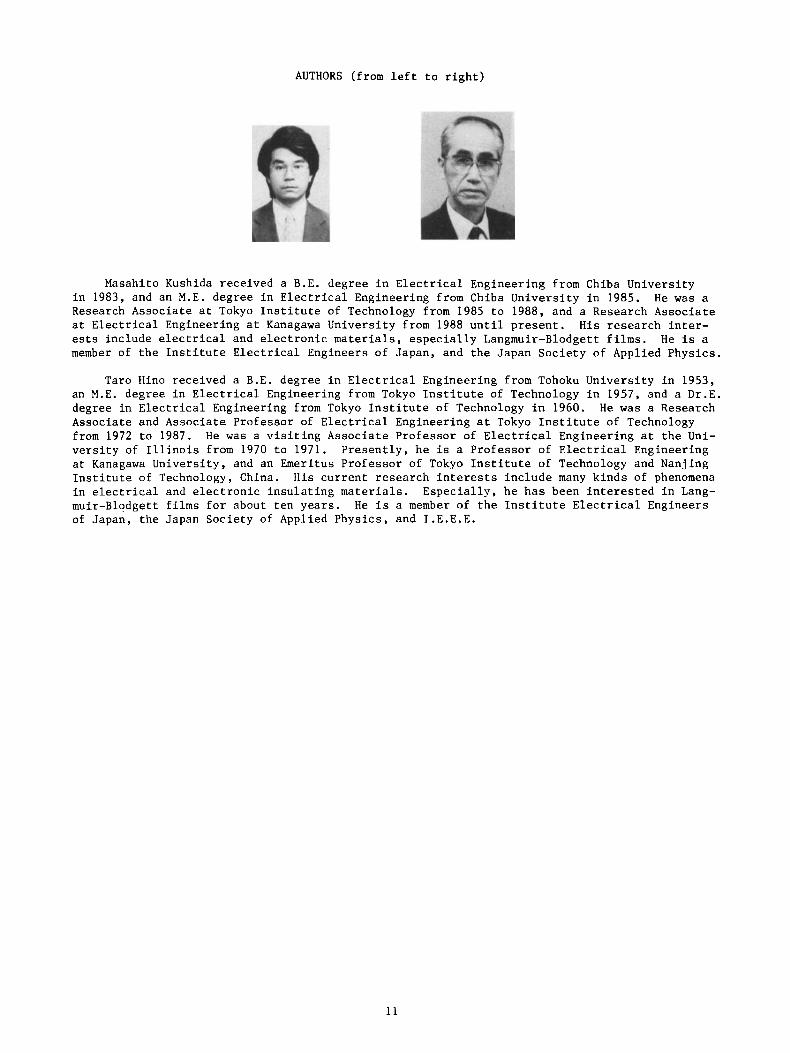
AUTHORS (from l e f t t o r i g h t )
Masahito Kushida received a B .E . degree i n E l e c t r i c a l Engineering from Chiba Universi ty i n 1983, and an M.E. degree i n E l e c t r i c a l Engineering from Chiba Un ive r s i ty i n 1985. H e w a s a Research Associate a t Tokyo I n s t i t u t e of Technology from 1985 t o 1988, and a Research Associate a t E l e c t r i c a l Engineering a t Kanagawa Unive r s i ty from 1988 u n t i l p r e s e n t . H i s r e sea rch i n t e r - ests include e l e c t r i c a l and e l e c t r o n i c materials, e s p e c i a l l y Langmuir-Blodgett f i l m s . H e is a member of t h e I n s t i t u t e E l e c t r i c a l Engineers of Japan, and t h e Japan Soc ie ty of Applied Physics
Taro Hino received a B.E. degree i n E l e c t r i c a l Engineering from Tohoku Unive r s i ty i n 1953, an M.E. degree i n E l e c t r i c a l Engineering from Tokyo I n s t i t u t e of Technology i n 1957, and a D r . E . degree i n E l e c t r i c a l Engineering from Tokyo I n s t i t u t e of Technology i n 1960. H e w a s a Research Associate and Associate Professor of E l e c t r i c a l Engineering a t Tokyo I n s t i t u t e of Technology from 1972 t o 1987. H e w a s a v i s i t i n g Associate P ro fes so r of Electrical Engineering a t t h e Uni- v e r s i t y of I l l i n o i s from 1970 t o 1971. P r e s e n t l y , he is a Professor of E l e c t r i c a l Engineering a t Kanagawa Unive r s i ty , and an Emeritus P ro fes so r of Tokyo I n s t i t u t e of Technology and Nanjing I n s t i t u t e of Technology, China. H i s c u r r e n t r e sea rch i n t e r e s t s i n c l u d e many k i n d s of phenomena i n e l e c t r i c a l and e l e c t r o n i c i n s u l a t i n g m a t e r i a l s . Espec ia l ly , h e h a s been i n t e r e s t e d i n Lang- muir-Blodgett f i l m s f o r about t en yea r s . of Japan, t h e Japan Society of Applied Physics , and I . E . E . E .
H e is a member of t h e I n s t i t u t e E l e c t r i c a l Engineers
1 1
Recommended