IOSR Journal Of Applied Physics (IOSR-JAP) e-ISSN: 2278-4861.Volume 12, Issue 6 Ser. I (Nov. – Dec. 2020), PP 11-25 www.Iosrjournals.Org
DOI: 10.9790/4861-1206011125 www.iosrjournals.org 11 | Page
Electrical Properties of Lithium and Sodium Borate Glasses
Doped with Chromium Oxide
M. A. Zaki Ewiss
Department of Physics, Faculty of Science, Cairo University, 12613 Gamaa Street, Giza, Egypt
Abstract
Background: In this work, we experimentally studied the ac-electric conductivity and dielectric constant of
some lithium and sodium borate glasses doped with chromium oxide. These glass materials are of interest for
science and technology.
Materials and Methods: We introduced Chromium oxide with Low concentration of 0.1 and 0.7 mol. % to
Lithium and Sodium borate glasses with chemical composition 37 mol % [M2O] - 63 mol % [B2O3] where
(M=Li and Na)]).We successfully prepared the glass samples by melting quenching method. The X-ray
diffraction pattern was carried out using Bruker AXS X-Ray analytical diffraction system. The ac - electrical
conductivity, and dielectric constant measured at atmospheric pressure as a function of temperature (in the
range from room temperature up to 500 0K) and frequency in the range from 0.1 kHz up to 200 kHz).
Results: The X-ray patterns showed the amorphous nature of these glasses. The curve features of the ac-
conductivity showed deviations from the Arrhenius linear relation observed at T < 400 K. We estimated the
crystalline activation energies for all samples under consideration. The measurements verified the scaling law
of the ac-conductivity as a function of the applied frequency.
Conclusion: From the results, we have the following: a) From the recorded XRD Spectra we observed evidence
of the formation of pre-crystalline phase; b) The electrical properties of these glasses are affected by the
different physical and chemical processes; c) Values of the ac-conduction mechanism are predominantly ionic
in the undoped samples containing Li or Na ions. The mobility of these ions is affected by the presence of Cr
ions in all doped samples; d) The increase of the ionic mobility is responsible for the behaviour of the dielectric
loss of these glass samples.
Keywords: alkali glasses, ac-conductivity, activation energy, dielectric constant
---------------------------------------------------------------------------------------------------------------------------------------
Date of Submission: 26-10-2020 Date of Acceptance: 05-11-2020
----------------------------------------------------------------------------------------------------------------------------- ----------
I. Introduction There is a substantial body of literature on a wealth of information aimed to study the electrical and
optical properties of semiconductor glasses. These glasses are considered the most exciting materials for science
and technology. They made with excellent homogeneity and in a variety of forms and size. Also, they dope with
transition metal and rear earth ions. They existed with a wide range of properties which met the needs of various
applications for our daily life 1-30
.
During the last decades, intensive experimental and theoretical studies of Alkali borate glasses
containing different transition metal oxides (TMO) were reported1. This wealth of information supported the
development of the glass industry including the high-technology devices such as glass lasers, luminescent solar
energy concentrator, optical fibres for communication devices and as a radiation shielding material etc. 1,2
.
Recently, several studies reported on the physical properties of lithium borate glasses 3.
The thermochemical of lithium borate glasses are studied by high‐temperature oxide melt solution
calorimetry 3. In this report, the formation enthalpies of these glasses and crystalline lithium borates were
determined with typical solution behaviour. A strong exothermic acid-base reaction between Li2O and B2O3 was
found due to the formation of tetrahedrally coordinated boron. Sørensen et al. 4 discussed the boron anomaly in
the thermal conductivity of lithium borate glasses.
Montouillout et al. 5 and Usharani & Eraiah 6 studied the ionic conductivity of lithium borate glasses
and local structure probed by high-resolution solid-state NMR as well as the thermal property of holmium
doped lithium lead borate glasses. For industrial application, Pawar et al. 7
and Thakur et al. 8 measured the
Physical, thermal, structural and optical properties of Dy3+
doped lithium alumino-borate glasses for bright W-
LED as well as the temperature-dependent electrical transport characteristics of BaTiO3 modified lithium borate
glasses. Shaaban et al. 9
studied the physical and structural properties of lithium borate glasses containing
MoO3. Moreover, Abousehly et al. 10
determined the electrical and mechanical properties of Li2O–BaO–B2O3
glass system as a function of temperature and frequency. The results showed that the changes in Li2O

Electrical Properties of Lithium and Sodium Borate Glasses Doped with Chromium Oxide
DOI: 10.9790/4861-1206011125 www.iosrjournals.org 12 | Page
concentration considerably affect the values of dielectric constant and dc and ac-electrical conductivities.
Intensive data on the structural XRD, Raman spectroscopy, thermal (TG-DTA), dielectric, absorption and
emission (Vis & NIR) properties of lithium borate glasses with and without (1 mol % Ho3+
) are available 11
.
On the other hand, Anjaiah et al. 12
studied the dosimetric and kinetic parameters of lithium cadmium
borate glasses doped with rare-earth ions. Data on the structural, thermal, dielectric and ac conductivity
properties of lithium fluoro-borate optical glasses were presented and discussed 13
. These glasses were chemical
composed of Li2O–LiF–B2O3–MO (M = Zn and Cd) and prepared by a conventional melt quenching method.
Gedam and Ramteke 14
presented information on the Electrical and optical properties of lithium borate glasses
doped with Nd2O3. Also, Funke and Banhatti 15
investigated the frequency-dependent conductivities and
permittivities. In previous reports, the electrical, IR- spectroscopy, and DTA of some sodium tetraborate glasses
containing vanadium and ferric oxides as well as the dielectric spectroscopy of [98 mol%(Na2B4O7) –
2mol%(Cr2O3)] and [98mol%(Na2B4O7) – 2mol%(MnO)] semiconductor glasses were measured and discussed 16-18
.
The objective of the present work is to study the effect of adding a low concentration of chromium
oxide on the electrical behaviour of some Lithium and Sodium borate glasses. The magnitude of ac-electrical
conductivity, dielectric loss, and verification of the empirical laws of the ac-conductivity as a function of
temperature and frequency as well as the activation energies of all glass samples under consideration will be
presented and discussed.
II. Experimental arrangement II-1) Glass preparation
In this experiment, we used analytical grade chemicals for the preparation of the glasses samples. In
Table 1, the chemical composition of the glasses under consideration, including the density ρ (g/cm3), specific
volume (Vs) and molar volume (Vm) is given. The batch of all components is calculated and weighted.
Table 1, Composition of glass samples Sample
No.
Glass Composition (mol %) Density ρ
(g/cm3)
Specific
volume (Vs)
Molar
volume
(Vm)
B2O3 Li2O Na2O Cr2O3
1 63 37 -- -- 2.08 0.48 47.15
2 62.9 37 -- 0.1 2.27 0.44 109.75
3 62.5 37 -- 0.7 2.36 0.42 104.76
4 63 -- 37 -- 2.21 0.45 59.21
5 62.9 -- 37 0.1 2.36 0.42 118.76
6 62.3 -- 37 0.7 2.75 0.36 101.8
We added the Boron oxide in the form of orthoboric acid H3BO3, the metal oxide as a hydrous
carbonate M2CO3 where (M=Li, and Na) and Cr2O3 oxide as it is. The weight batches were melted in an
electrically heated furnace at 1100 ± 10 0C for 2 hours and with stirring of the melt at intervals to achieve
acceptable homogeneity. Attention was paid to reducing the mechanical and volatilization losses. The
homogenous melt was finally poured in a clean stainless steel plate and cast into disks of about 2 cm diameters
and 2 mm thickness. The disks were immediately transferred to another furnace adjusted at 400 0
C for one hour
for annealing and then switch off the temperature to cool down gradually to room temperature with a cooling
rate of 0.5 0C/min. The glass samples were polished using the polishing paper
1.
II-2) Electrical measurements
Both the dielectric constant and ac - electrical conductivity are measured as follows:
1. The silver paste was carefully used to make two circular electrodes on both sides of the glass sample
under consideration (see Table 1).
2. The sample was placed between two copper plates mounted inside the heat stage with four probes (to
eliminate any stray capacitance).
3. The ac - electrical conductivity (σac) and dielectric constant (ε) were measured at atmospheric pressure
as a function of temperature (in the range from room temperature up to 500 0K) and frequency in the
range from 0.1 kHz up to 200 kHz).

Electrical Properties of Lithium and Sodium Borate Glasses Doped with Chromium Oxide
DOI: 10.9790/4861-1206011125 www.iosrjournals.org 13 | Page
4. The heating rate of 0.5 OC/min was controlled using platinum resistance (PT1000). The sample
temperature was measured using the other two platinum resistance (PT1000) resistance placed at the
surface of the electrodes.
5. The LCR –Hioki bridge determines the accuracy of the measurement.
6. The value of the ac-electric conductivity of the sample under consideration was extracted as follows:
7. The capacitance C in Farad and the conductance G in Siemens are measured using the Hioki –Bridge
(model Hioki 3535 LCR HiTester) at different frequencies (f in Hz).
The complex dielectric constant ε* = ε'- iε" are calculated at angular frequency ω = 2πf, where ε' and ε" are the
real and imaginary part of the dielectric constant from equation 1 and 2 given by the following equations 1:
ϵ′ = dcϵoA (1)
and
ϵ" = dG∈o Aω (2)
Here d is the thickness of the sample, and A is the area of the electrode.
The real σac' and the imaginary σac" parts of the ac- electrical conductivity is calculated from the following
equations 1:
σac′ = ωϵoε
" (3)
and
σac" = ωϵoε
′ 4
It is worth mentioning that in this experiment, all the measurements were reproducible.
III. Results And Discussion III-1) X-Ray Diffraction Spectra
The X-ray diffraction (XRD) pattern was carried out using Bruker AXS X-Ray analytical diffraction
system; type D8 advanced Theta/2 Theta standard supplied with furnace attachment on the powder samples at
room temperature (T=298 K) and T=3930K. The target was Cu Kα radiation with Kα1=1.54060 A
0, Kα2=1.54439
A0
and Kα3=1.1.39222 A0. The angular (2θ) started at 4
0 and ended at 70
0 with applied voltage was of K.V. and
anode current of 40 mA. The detailed measurements were performed by a stepwise measuring method with a
step rate 0.02 0
and stepped time 0.4 s. the data were analyzed by looking up a match of all major peaks with the
JCPDS cards (JCPDS = joint committee on powder diffraction stander).
The X-ray diffraction pattern for glass sample 1 of [37mol% Li2O+63mol% B2O3] and glass sample 2
of [37mol% Na2O+63mol% B2O3] at room temperature T= 2980
K, showed the absence of the crystalline nature,
see Figure 1a and Figure 1c, respectively.
Figure 1: X-ray diffraction pattern for
a) [37 mol % Li2O +63 mol % B2O3] glass at T = 298 K
b)
c) [37 mol % Li2O +63 mol % B2O3] glass at T = 393 K
d) [37 mol% Na2O +63 mol % B2O3] glass at T = 298 K
e) [37 mol% Na2O +63 mol % B2O3] glass at T = 393 K

Electrical Properties of Lithium and Sodium Borate Glasses Doped with Chromium Oxide
DOI: 10.9790/4861-1206011125 www.iosrjournals.org 14 | Page
From Figure 1b, at T=393 K the d-spacing that are associated with the heat-treated of the [37 mol %
Li2O+63 mol % B2O3] (sample 1) are located at 5.819, 4.76, 4.56, 4.48, 3.961, 3.557, 3.42, 3.362, 3.292, 3.252,
2.97, 2.89, 2.76, 2.59, 2.42, 2.35, 2.23, 2.19, 2.157, 1.919, 1.840, 1.730, 1.550 and 1.430, these peaks are
matches with lithium borate peaks of the two phases (Li2B8O13 and Li2B10O16. H2O). From Figure 1d, at T=393
K for [37 mol % Na2O+63 mol % B2O3] sample4, the d- spacing are located at 7.72, 6.68, 4.88, 4.48, 3.71,
3.55, 3.47, 3.26 and 3.13 corresponds to α-Na2B6O10 monoclinic system The d-spacing located at 3.47, 3.27,
2.825, 2.77, 2.57, 2.12, 2.02, and 1.92 corresponds to Na2B4O7 orthorhombic system, while the d-spacing
located at 3.97, 3.03, 2.85, 2.64, 2.51, and 2.31 are attributed to sodium borate hydrate NaBO3.4H2O triclinic
system. Although the formation of these crystalline systems was found, there is an incomplete periodic structure
which indicates the existence of a pre crystalline phase. We need more experimental and theoretical
investigation, including Raman spectroscopy, NMR and laser-induced fluorescence techniques, to clarify the
existence of this pre-crystalline phase.
III-2) Measurements of ac-electrical conductivity
III-2-1) Undoped Alkali Borate Glasses
In Table 2, the values of the measured real (σac') and imaginary (σac") parts of the ac electrical
conductivity at different frequencies and room temperature of 2980 K for all samples under consideration are
given, respectively. For the [37 mol % Li2O+63 mol % B2O3] undoped glass sample1, the values of σac' and σac"
at room temperature (T = 2980 K) and at low frequency of 100 Hz are equal to 3.39x10
-8 mho.m
-1 and 8.49 x 10
-
8 mho.m
-1 respectively. These values are increased by increasing the applied frequency. At a frequency of 200
kHz, they increased by two and four orders of magnitude, respectively.
Table 2: The values of the real and imaginary parts of ac electrical conductivity and dielectric
constant at room temperature (T = 298 K) at different frequencies for all samples (see
Table 1).
Sample
No.
F
(KHz)
σ'ac
(298 K)
Ω-1m-1
σac"
(298 K)
Ω-1m-1
ε' ε"
(1)
0.1 3.39x10⁻⁸ 8.49x10⁻⁸ 15.23 6.07
1 6.72x10⁻⁷ 6.73x10⁻⁷ 12.08 1.30
10 1.48x10⁻⁷ 6.46x10⁻⁶ 11.58 0.27
21 2.15x10⁻⁷ 1.38x10⁻⁵ 11.50 0.18
100 5.39x10⁻⁷ 6.36x10⁻⁵ 11.41 0.18
216 1.01x10⁻⁶ 1.37x10⁻⁴ 11.37 0.08
(2)
0.1 4.40x10⁻¹⁰ 4.94x10⁻⁸ 8.89 0.08
1 2.13x10⁻⁹ 4.91x10⁻⁷ 8.82 0.04
10 1.25x10⁻⁸ 4.88x10⁻⁶ 8.78 0.02
21 2.44x10⁻⁸ 1.05x10⁻⁵ 8.77 0.02
100 1.14x10⁻⁷ 4.87x10⁻⁵ 8.75 0.02
216 3.27x10⁻⁷ 1.05x10⁻⁴ 8.74 0.27
(3)
0.1 9.49x10⁻¹⁰ 5.66x10⁻⁸ 10.19 0.17
1 4.90x10⁻⁹ 5.58x10⁻⁷ 10.03 0.09
10 3.04x10⁻⁸ 5.53x10⁻⁶ 9.93 0.05
21 5.99x10⁻⁸ 1.19x10⁻⁵ 9.90 0.05
100 2.78x10⁻⁷ 5.48x10⁻⁵ 9.86 0.05
216 5.97x10⁻⁷ 1.18x10⁻⁴ 9.84 0.049
(4)
0.1 2.32x10⁻⁹ 5.90x10⁻⁸ 10.62 0.42
1 9.99x10⁻⁹ 5.73x10⁻⁷ 10.30 0.18
10 1.18x10⁻⁷ 5.63x10⁻⁶ 10.12 0.21
21 3.41x10⁻⁷ 1.20x10⁻⁵ 9.98 0.28
100 1.20x10⁻⁶ 5.37x10⁻⁵ 9.65 0.21
216 1.68x10⁻⁶ 1.15x10⁻⁴ 9.58 0.14
(5)
0.1 6.13x10⁻¹⁰ 3.96x10⁻⁸ 7.12 0.11
1 2.56x10⁻⁹ 3.92x10⁻⁷ 7.02 0.04
10 1.15x10⁻⁸ 3.89x10⁻⁶ 6.98 0.02
21 2.25x10⁻⁸ 8.37x10⁻⁶ 6.97 0.18
100 1.37x10⁻⁷ 2.25x10⁻⁶ 6.96 0.16
216 2.5210-7 8.34x10⁻⁵ 6.95 0.02
(6)
0.1 2.18x10⁻⁹ 5.47x10⁻⁸ 9.81 0.39
1 6.80x10⁻⁹ 5.33x10⁻⁷ 9.57 0.12
10 2.76x10⁻⁸ 5.27x10⁻⁶ 9.47 0.04
21 5.09x10⁻⁸ 1.19x10⁻⁵ 9.45 0.04
100 1.79x10⁻⁷ 5.25x10⁻⁵ 9.42 0.03
216 3.63x10⁻⁷ 1.10x10⁻⁴ 9.42 0.03

Electrical Properties of Lithium and Sodium Borate Glasses Doped with Chromium Oxide
DOI: 10.9790/4861-1206011125 www.iosrjournals.org 15 | Page
From Table 2, the values of σac' and σ"ac of [37 mol% Na2O +63 mol % B2O3] glass sample4 at a low
frequency of 100 Hz, was found to be lower by one order of magnitude than the corresponding values of the
undoped lithium borate glass (sample1). We may attribute the higher value of the conductivity of lithium borate
glasses to the small size and the excellent mobility of Li - ions compared to the Na ions within the glass matrix.
Also, the difference between these two conductivity values decreases by increasing the applied frequency.
The variation of ln(σ'ac) as a function of reciprocal temperature are plotted at a different frequency in Figure 2(a,
b) for glass sample1 and glass sample4, respectively. Figure 3(a, b) showed, the corresponding variation of
ln(σ"ac) as a function of the reciprocal temperature of these two samples, respectively.
Figure 2: The relation between ln(σac') versus 1000/T(K) for
a) [37mol % Li2O + 63mol % B2O3] glass sample1
b) [37 mol% Na2O +63 mol % B2O3] glass sample4
■ 0.1 kHz ●1 kHz ▲10 kHz □ 21 kHz ○ 100 kHz ∆.200 kHz
Figure 3: The relation between ln(σac") versus 1000/T(K) for
a) [37mol % Li2O + 63mol % B2O3] glass sample1
b) [37 mol% Na2O +63 mol % B2O3] glass sample4
0.1 KHz 1 KHz ▲10 KHz ● 21 KHz ■.216 KHz
The ac-electrical conductivity has a non-Arrhenius behaviour over the whole temperature range
between 298 and 500 K. It is worth noting that similar behaviour of ac-electrical conductivity was found for all
samples under consideration. According to the Arrhenius equation given by equation 1
:
σac = σo e−Ecryst /KT (5)
Where σ0 is constant, Ecryst is the activation energy, K is the Boltzman constant and T is the absolute
temperature. This empirical relation represents a straight line between ln(σ'ac) vs 1/T (K). We noticed that in all
glass samples under consideration, this linear relation is verified in the crystalline phase at T > 400 K.
The value of Ecryst for all glass samples under consideration are extracted at different frequencies and is collected
in Table 3, respectively.
Electrical Properties of Lithium and Sodium Borate Glasses Doped with Chromium Oxide
DOI: 10.9790/4861-1206011125 www.iosrjournals.org 16 | Page
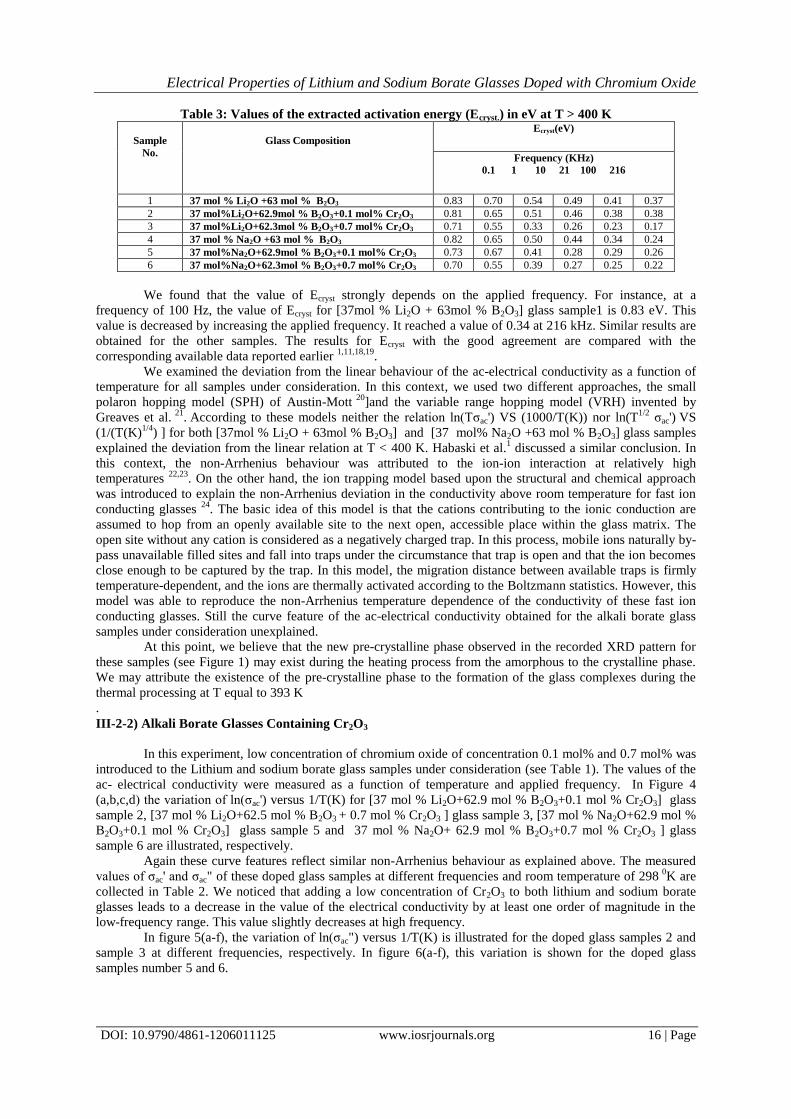
Table 3: Values of the extracted activation energy (Ecryst.) in eV at T > 400 K
Sample
No.
Glass Composition
Ecryst(eV)
Frequency (KHz)
0.1 1 10 21 100 216
1 37 mol % Li2O +63 mol % B2O3 0.83 0.70 0.54 0.49 0.41 0.37
2 37 mol%Li2O+62.9mol % B2O3+0.1 mol% Cr2O3 0.81 0.65 0.51 0.46 0.38 0.38
3 37 mol%Li2O+62.3mol % B2O3+0.7 mol% Cr2O3 0.71 0.55 0.33 0.26 0.23 0.17
4 37 mol % Na2O +63 mol % B2O3 0.82 0.65 0.50 0.44 0.34 0.24
5 37 mol%Na2O+62.9mol % B2O3+0.1 mol% Cr2O3 0.73 0.67 0.41 0.28 0.29 0.26
6 37 mol%Na2O+62.3mol % B2O3+0.7 mol% Cr2O3 0.70 0.55 0.39 0.27 0.25 0.22
We found that the value of Ecryst strongly depends on the applied frequency. For instance, at a
frequency of 100 Hz, the value of Ecryst for [37mol % Li2O + 63mol % B2O3] glass sample1 is 0.83 eV. This
value is decreased by increasing the applied frequency. It reached a value of 0.34 at 216 kHz. Similar results are
obtained for the other samples. The results for Ecryst with the good agreement are compared with the
corresponding available data reported earlier 1,11,18,19
.
We examined the deviation from the linear behaviour of the ac-electrical conductivity as a function of
temperature for all samples under consideration. In this context, we used two different approaches, the small
polaron hopping model (SPH) of Austin-Mott 20
]and the variable range hopping model (VRH) invented by
Greaves et al. 21
. According to these models neither the relation ln(Tσac') VS (1000/T(K)) nor ln(T
1/2 σac')
VS
(1/(T(K)1/4
) ] for both [37mol % Li2O + 63mol % B2O3] and [37 mol% Na2O +63 mol % B2O3] glass samples
explained the deviation from the linear relation at T < 400 K. Habaski et al.1 discussed a similar conclusion. In
this context, the non-Arrhenius behaviour was attributed to the ion-ion interaction at relatively high
temperatures 22,23
. On the other hand, the ion trapping model based upon the structural and chemical approach
was introduced to explain the non-Arrhenius deviation in the conductivity above room temperature for fast ion
conducting glasses 24
. The basic idea of this model is that the cations contributing to the ionic conduction are
assumed to hop from an openly available site to the next open, accessible place within the glass matrix. The
open site without any cation is considered as a negatively charged trap. In this process, mobile ions naturally by-
pass unavailable filled sites and fall into traps under the circumstance that trap is open and that the ion becomes
close enough to be captured by the trap. In this model, the migration distance between available traps is firmly
temperature-dependent, and the ions are thermally activated according to the Boltzmann statistics. However, this
model was able to reproduce the non-Arrhenius temperature dependence of the conductivity of these fast ion
conducting glasses. Still the curve feature of the ac-electrical conductivity obtained for the alkali borate glass
samples under consideration unexplained.
At this point, we believe that the new pre-crystalline phase observed in the recorded XRD pattern for
these samples (see Figure 1) may exist during the heating process from the amorphous to the crystalline phase.
We may attribute the existence of the pre-crystalline phase to the formation of the glass complexes during the
thermal processing at T equal to 393 K
.
III-2-2) Alkali Borate Glasses Containing Cr2O3
In this experiment, low concentration of chromium oxide of concentration 0.1 mol% and 0.7 mol% was
introduced to the Lithium and sodium borate glass samples under consideration (see Table 1). The values of the
ac- electrical conductivity were measured as a function of temperature and applied frequency. In Figure 4
(a,b,c,d) the variation of ln(σac') versus 1/T(K) for [37 mol % Li2O+62.9 mol % B2O3+0.1 mol % Cr2O3] glass
sample 2, [37 mol % Li2O+62.5 mol % B2O3 + 0.7 mol % Cr2O3 ] glass sample 3, [37 mol % Na2O+62.9 mol %
B2O3+0.1 mol % Cr2O3] glass sample 5 and 37 mol % Na2O+ 62.9 mol % B2O3+0.7 mol % Cr2O3 ] glass
sample 6 are illustrated, respectively.
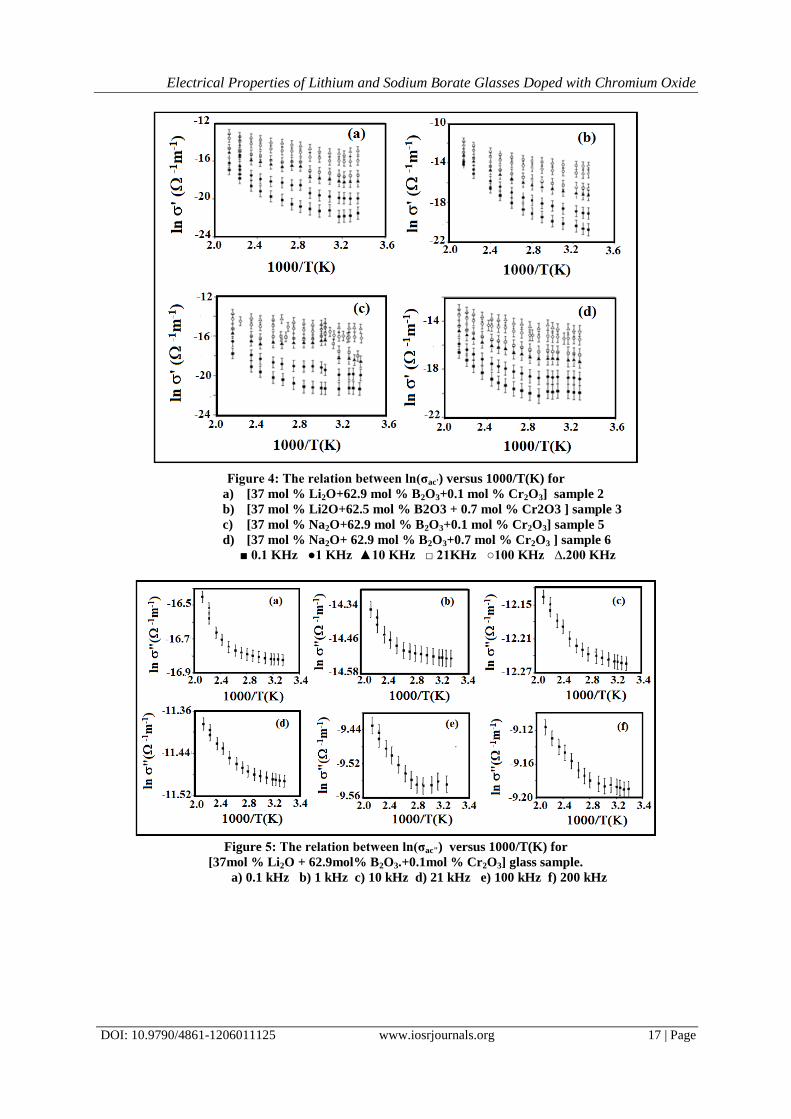
Again these curve features reflect similar non-Arrhenius behaviour as explained above. The measured
values of σac' and σac" of these doped glass samples at different frequencies and room temperature of 298 0
K are
collected in Table 2. We noticed that adding a low concentration of Cr2O3 to both lithium and sodium borate
glasses leads to a decrease in the value of the electrical conductivity by at least one order of magnitude in the
low-frequency range. This value slightly decreases at high frequency.
In figure 5(a-f), the variation of ln(σac") versus 1/T(K) is illustrated for the doped glass samples 2 and
sample 3 at different frequencies, respectively. In figure 6(a-f), this variation is shown for the doped glass
samples number 5 and 6.
Electrical Properties of Lithium and Sodium Borate Glasses Doped with Chromium Oxide
DOI: 10.9790/4861-1206011125 www.iosrjournals.org 17 | Page
Figure 4: The relation between ln(σac') versus 1000/T(K) for
a) [37 mol % Li2O+62.9 mol % B2O3+0.1 mol % Cr2O3] sample 2
b) [37 mol % Li2O+62.5 mol % B2O3 + 0.7 mol % Cr2O3 ] sample 3
c) [37 mol % Na2O+62.9 mol % B2O3+0.1 mol % Cr2O3] sample 5
d) [37 mol % Na2O+ 62.9 mol % B2O3+0.7 mol % Cr2O3 ] sample 6
■ 0.1 KHz ●1 KHz ▲10 KHz □ 21KHz ○100 KHz ∆.200 KHz
Figure 5: The relation between ln(σac") versus 1000/T(K) for
[37mol % Li2O + 62.9mol% B2O3.+0.1mol % Cr2O3] glass sample.
a) 0.1 kHz b) 1 kHz c) 10 kHz d) 21 kHz e) 100 kHz f) 200 kHz
Electrical Properties of Lithium and Sodium Borate Glasses Doped with Chromium Oxide
DOI: 10.9790/4861-1206011125 www.iosrjournals.org 18 | Page
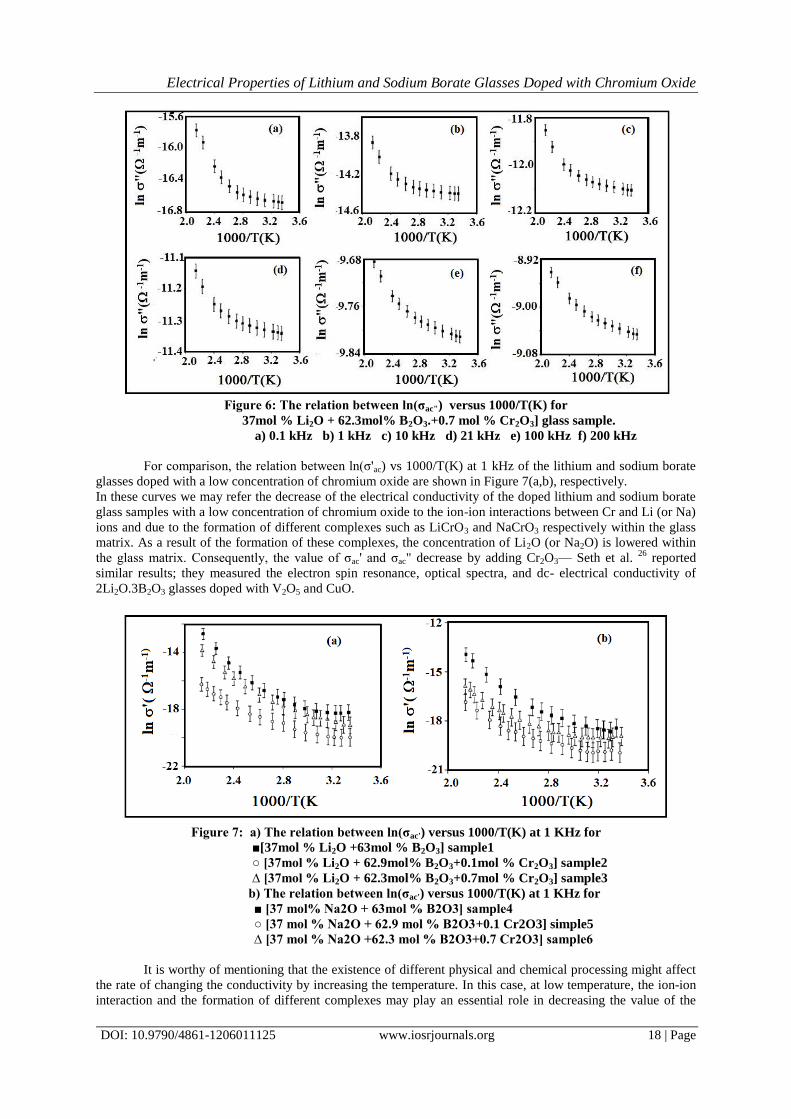
Figure 6: The relation between ln(σac") versus 1000/T(K) for
37mol % Li2O + 62.3mol% B2O3.+0.7 mol % Cr2O3] glass sample.
a) 0.1 kHz b) 1 kHz c) 10 kHz d) 21 kHz e) 100 kHz f) 200 kHz
For comparison, the relation between ln(σ'ac) vs 1000/T(K) at 1 kHz of the lithium and sodium borate
glasses doped with a low concentration of chromium oxide are shown in Figure 7(a,b), respectively.
In these curves we may refer the decrease of the electrical conductivity of the doped lithium and sodium borate
glass samples with a low concentration of chromium oxide to the ion-ion interactions between Cr and Li (or Na)
ions and due to the formation of different complexes such as LiCrO3 and NaCrO3 respectively within the glass
matrix. As a result of the formation of these complexes, the concentration of Li2O (or Na2O) is lowered within
the glass matrix. Consequently, the value of σac' and σac" decrease by adding Cr2O3— Seth et al. 26
reported
similar results; they measured the electron spin resonance, optical spectra, and dc- electrical conductivity of
2Li2O.3B2O3 glasses doped with V2O5 and CuO.
Figure 7: a) The relation between ln(σac') versus 1000/T(K) at 1 KHz for
■[37mol % Li2O +63mol % B2O3] sample1
○ [37mol % Li2O + 62.9mol% B2O3+0.1mol % Cr2O3] sample2
∆ [37mol % Li2O + 62.3mol% B2O3+0.7mol % Cr2O3] sample3
b) The relation between ln(σac') versus 1000/T(K) at 1 KHz for
■ [37 mol% Na2O + 63mol % B2O3] sample4
○ [37 mol % Na2O + 62.9 mol % B2O3+0.1 Cr2O3] simple5
∆ [37 mol % Na2O +62.3 mol % B2O3+0.7 Cr2O3] sample6
It is worthy of mentioning that the existence of different physical and chemical processing might affect
the rate of changing the conductivity by increasing the temperature. In this case, at low temperature, the ion-ion
interaction and the formation of different complexes may play an essential role in decreasing the value of the
Electrical Properties of Lithium and Sodium Borate Glasses Doped with Chromium Oxide
DOI: 10.9790/4861-1206011125 www.iosrjournals.org 19 | Page
electrical conductivity. At high temperature near the crystalline stage, the hopping of the electron plays the main
contribution to the conductivity.
In our case, the values of σac' and σac" decreased by adding Cr2O3 to the alkali borate compounds due to the
blocking effect of the mobility of lithium and sodium ions by the presence of chromium ions,
III-2-3) Frequency Dependence of AC-Electrical Conductivity
Following Jonscher's power law, the real part of the ac electrical conductivity σ'ac is given by equation (6)
26:
σac′ = σdc + Aωs (6)
and
σac′ = A. ωs 0 ≤ s ≤ 1 (7)
Where σdc is the value of the dc-conductivity, i.e., σdc = σ' (ω 0), ω is the angular frequency (ω=2πf), A is the
pre-exponential factor and s is the power-law exponent representing the degree of interaction between the
mobile ions. In the high-frequency region, A.ωs ≥ σdc, so the total conductivity is equal to the ac- conductivity
27.
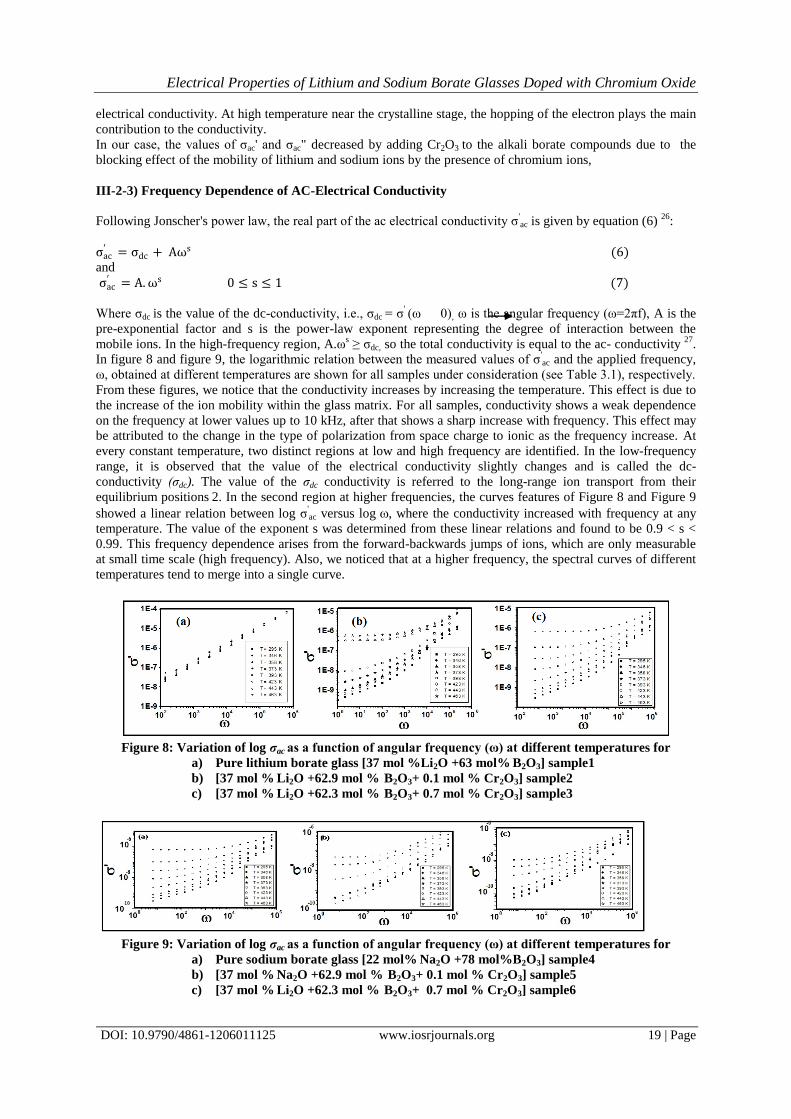
In figure 8 and figure 9, the logarithmic relation between the measured values of σ'ac and the applied frequency,
ω, obtained at different temperatures are shown for all samples under consideration (see Table 3.1), respectively.
From these figures, we notice that the conductivity increases by increasing the temperature. This effect is due to
the increase of the ion mobility within the glass matrix. For all samples, conductivity shows a weak dependence
on the frequency at lower values up to 10 kHz, after that shows a sharp increase with frequency. This effect may
be attributed to the change in the type of polarization from space charge to ionic as the frequency increase. At
every constant temperature, two distinct regions at low and high frequency are identified. In the low-frequency
range, it is observed that the value of the electrical conductivity slightly changes and is called the dc-
conductivity (σdc). The value of the σdc conductivity is referred to the long-range ion transport from their
equilibrium positions 2. In the second region at higher frequencies, the curves features of Figure 8 and Figure 9
showed a linear relation between log σ'ac versus log , where the conductivity increased with frequency at any
temperature. The value of the exponent s was determined from these linear relations and found to be 0.9 < s <
0.99. This frequency dependence arises from the forward-backwards jumps of ions, which are only measurable
at small time scale (high frequency). Also, we noticed that at a higher frequency, the spectral curves of different
temperatures tend to merge into a single curve.
Figure 8: Variation of log σac as a function of angular frequency (ω) at different temperatures for
a) Pure lithium borate glass [37 mol %Li2O +63 mol% B2O3] sample1
b) [37 mol % Li2O +62.9 mol % B2O3+ 0.1 mol % Cr2O3] sample2
c) [37 mol % Li2O +62.3 mol % B2O3+ 0.7 mol % Cr2O3] sample3
Figure 9: Variation of log σac as a function of angular frequency (ω) at different temperatures for
a) Pure sodium borate glass [22 mol% Na2O +78 mol%B2O3] sample4
b) [37 mol % Na2O +62.9 mol % B2O3+ 0.1 mol % Cr2O3] sample5
c) [37 mol % Li2O +62.3 mol % B2O3+ 0.7 mol % Cr2O3] sample6

Electrical Properties of Lithium and Sodium Borate Glasses Doped with Chromium Oxide
DOI: 10.9790/4861-1206011125 www.iosrjournals.org 20 | Page
III-3) Measurement of the Dielectric constant
We examined the dielectric response of all glass samples under consideration (see Table 1) by
measuring both the real (ε') and imaginary (ε") parts of the dielectric constant. In Table 2, the values of ε' and ε"
at room temperature and different frequencies are collected, respectively. At frequency 100 Hz the values of (ε')
and (ε") are equal to 15.23 and 6.07 for sample 1 and equal to 10.62 and 0.42 for sample 4, respectively. It is
worth mentioning that these values are decreased by increasing the applied frequency. The variation of ε' and ε"
as a function of temperature at different frequencies of [37mol % M2O +63mol % B2O3], [37mol % M2O +
62.9mol% B2O3+0.1mol % Cr2O3] and [37mol % M2O + 62.3mol% B2O3+0.7mol % Cr2O3] glass samples are
illustrated in Figure 10 (with M= Li) and in Figure 11 (with M= Na), respectively.
Figure 10: Variation of the real (ε') and imaginary (ε") part of the dielectric constant as
a function of temperature for:
a) [37mol % Li2O +63mol % B2O3] glass sample,
b) [37mol % Li2O + 62.9mol% B2O3.+0.1mol % Cr2O3] glass sample
c) [37mol % Li2O + 62.3mol% B2O3+ 0.7mol % Cr2O3]glass sample
○ 0.1KHz □1 KHz ▲10 KHz ■ 100 KHz ● 200 KHz
Electrical Properties of Lithium and Sodium Borate Glasses Doped with Chromium Oxide
DOI: 10.9790/4861-1206011125 www.iosrjournals.org 21 | Page
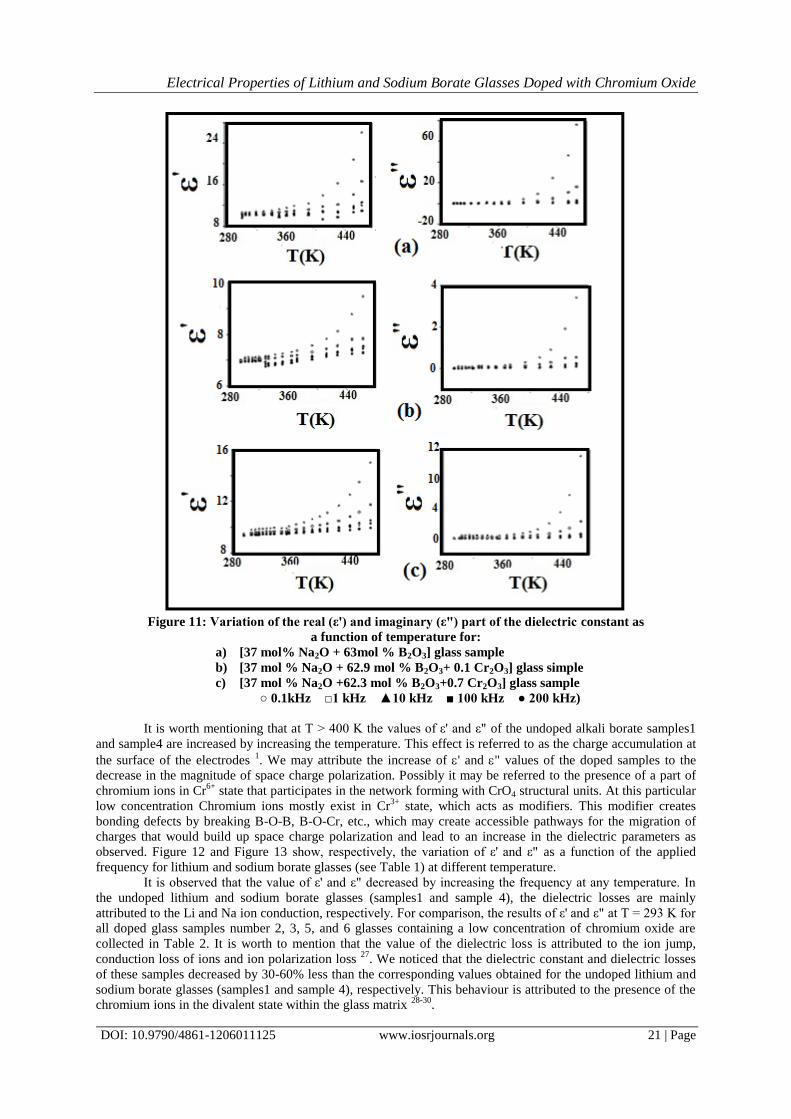
Figure 11: Variation of the real (ε') and imaginary (ε") part of the dielectric constant as
a function of temperature for:
a) [37 mol% Na2O + 63mol % B2O3] glass sample
b) [37 mol % Na2O + 62.9 mol % B2O3+ 0.1 Cr2O3] glass simple
c) [37 mol % Na2O +62.3 mol % B2O3+0.7 Cr2O3] glass sample
○ 0.1kHz □1 kHz ▲10 kHz ■ 100 kHz ● 200 kHz)
It is worth mentioning that at T > 400 K the values of ε' and ε" of the undoped alkali borate samples1
and sample4 are increased by increasing the temperature. This effect is referred to as the charge accumulation at
the surface of the electrodes 1. We may attribute the increase of ' and " values of the doped samples to the
decrease in the magnitude of space charge polarization. Possibly it may be referred to the presence of a part of
chromium ions in Cr6+
state that participates in the network forming with CrO4 structural units. At this particular
low concentration Chromium ions mostly exist in Cr3+
state, which acts as modifiers. This modifier creates
bonding defects by breaking B-O-B, B-O-Cr, etc., which may create accessible pathways for the migration of
charges that would build up space charge polarization and lead to an increase in the dielectric parameters as
observed. Figure 12 and Figure 13 show, respectively, the variation of ε' and ε" as a function of the applied
frequency for lithium and sodium borate glasses (see Table 1) at different temperature.
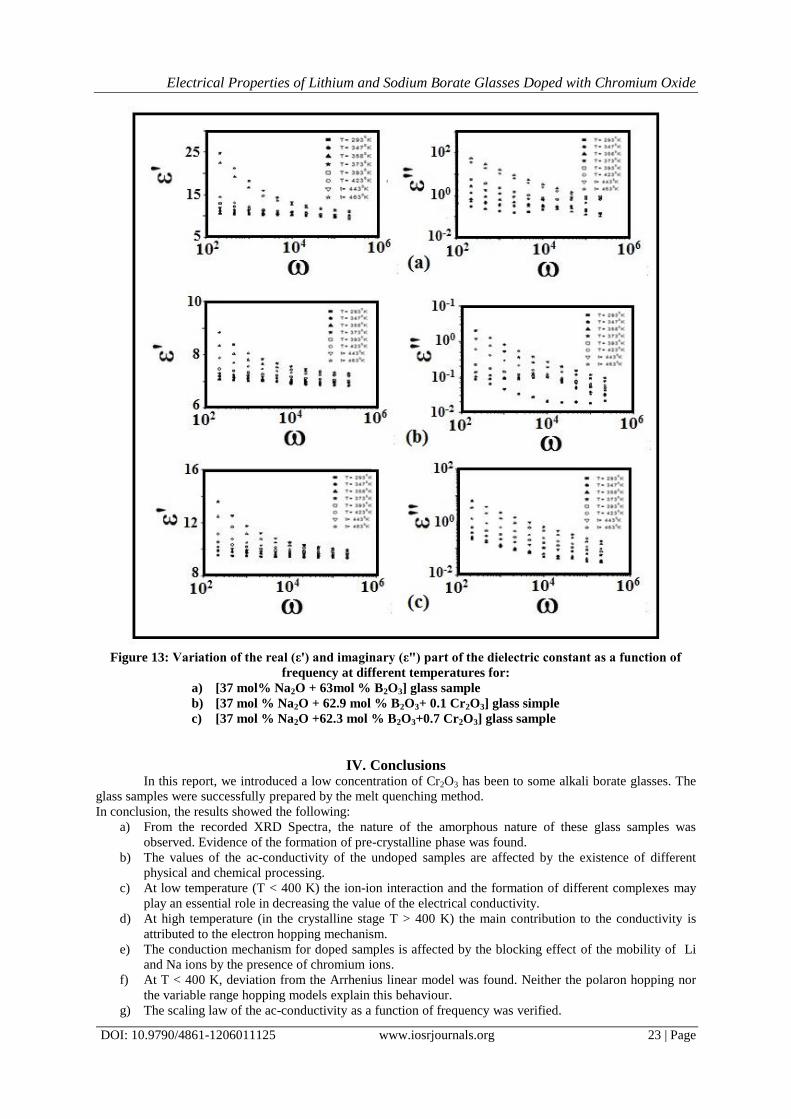
It is observed that the value of ε' and ε" decreased by increasing the frequency at any temperature. In
the undoped lithium and sodium borate glasses (samples1 and sample 4), the dielectric losses are mainly
attributed to the Li and Na ion conduction, respectively. For comparison, the results of ε' and ε" at T = 293 K for
all doped glass samples number 2, 3, 5, and 6 glasses containing a low concentration of chromium oxide are
collected in Table 2. It is worth to mention that the value of the dielectric loss is attributed to the ion jump,
conduction loss of ions and ion polarization loss 27
. We noticed that the dielectric constant and dielectric losses
of these samples decreased by 30-60% less than the corresponding values obtained for the undoped lithium and
sodium borate glasses (samples1 and sample 4), respectively. This behaviour is attributed to the presence of the
chromium ions in the divalent state within the glass matrix 28-30
.

Electrical Properties of Lithium and Sodium Borate Glasses Doped with Chromium Oxide
DOI: 10.9790/4861-1206011125 www.iosrjournals.org 22 | Page
Figure 12: Variation of the real (ε') and imaginary (ε") part of the dielectric constant as
a function of frequency at different temperatures for:
a) [37mol % Li2O +63mol % B2O3] glass sample,
b) [37mol % Li2O + 62.9mol% B2O3.+0.1mol % Cr2O3] glass sample
c) [37mol % Li2O + 62.3mol% B2O3+ 0.7mol % Cr2O3]glass sample
Electrical Properties of Lithium and Sodium Borate Glasses Doped with Chromium Oxide
DOI: 10.9790/4861-1206011125 www.iosrjournals.org 23 | Page
Figure 13: Variation of the real (ε') and imaginary (ε") part of the dielectric constant as a function of
frequency at different temperatures for:
a) [37 mol% Na2O + 63mol % B2O3] glass sample
b) [37 mol % Na2O + 62.9 mol % B2O3+ 0.1 Cr2O3] glass simple
c) [37 mol % Na2O +62.3 mol % B2O3+0.7 Cr2O3] glass sample
IV. Conclusions In this report, we introduced a low concentration of Cr2O3 has been to some alkali borate glasses. The
glass samples were successfully prepared by the melt quenching method.
In conclusion, the results showed the following:
a) From the recorded XRD Spectra, the nature of the amorphous nature of these glass samples was
observed. Evidence of the formation of pre-crystalline phase was found.
b) The values of the ac-conductivity of the undoped samples are affected by the existence of different
physical and chemical processing.
c) At low temperature (T < 400 K) the ion-ion interaction and the formation of different complexes may
play an essential role in decreasing the value of the electrical conductivity.
d) At high temperature (in the crystalline stage T > 400 K) the main contribution to the conductivity is
attributed to the electron hopping mechanism.
e) The conduction mechanism for doped samples is affected by the blocking effect of the mobility of Li
and Na ions by the presence of chromium ions.
f) At T < 400 K, deviation from the Arrhenius linear model was found. Neither the polaron hopping nor
the variable range hopping models explain this behaviour.
g) The scaling law of the ac-conductivity as a function of frequency was verified.
Electrical Properties of Lithium and Sodium Borate Glasses Doped with Chromium Oxide
DOI: 10.9790/4861-1206011125 www.iosrjournals.org 24 | Page
h) The large capacitance at the electrode surface and the increase of the ionic mobility are responsible for
the behaviour of the dielectric loss of these glass samples.
Acknowledgement This research did not receive any specific grant from funding agencies in the public, commercial, or not-for-
profit sectors.
References [1]. J. Habaski, C. León, K.L. Ngai, Dynamics of glassy, crystalline and liquid ionic conductors, Springer International Publishing,
Switzerland, (2017), Ch.4. http//DOI: 10.1007/978-3-319-42391-3 [2]. K. Funke, Progress in physical chemistry: Ionic motion in materials with disordered structures from elementary steps to
macroscopic transport, Oldenbourg Wissenschftsverlag, GmbH, Mȕnchen, Germany, 4, (2011), 223-244.
[3]. L. Wu, A. Koryttseva C.B.M Groß, A. Navrotsky, Thermochemical investigation of lithium borate glasses and crystals, J. Am. Ceram. Soc., (2019), 102[8], 4538-4545. https://doi.org/10.111/jace.16323
[4]. S.S. Sørensen, H. Johra, J.C. Mauro, M. Bauchy, M. Morten, M.M. Smedskjaer. Boron anomaly in the thermal conductivity of
lithium borate glasses, Physical Review Materials, (2019), 3[7], 075601. DOI: 10.1103/PhysRevMaterials.3.075601 [5]. V. Montouillout, H. Fan, L. Campo, S. Ory, A. Rakhmatullin, F. Fayon, M. Malki, Ionic conductivity of lithium borate glasses and
local structure probed by high-resolution solid-state NMR, Journal of Non-Crystalline Solids, 484, (2018), 57-64. DOI:
10.1016/j.jnoncrysol.2018.01.020 [6]. V.L. Usharani, B. Eraiah. Thermal property of holmium doped lithium lead borate glasses, AIP Conference Proceedings, (2018),
1951, 020004. DOI: 10.1063/1.5031712
[7]. P. P. Pawar, S. R. Munishwar, S. Gautam, R.S. Gedam, Physical, thermal, structural and optical properties of Dy3+ doped lithium alumino-borate glasses for bright W-LED, Journal of Luminescence, (2017), 183, 79-88.
https://doi.org/10.1016/j.jlumin.2016.11.027
[8]. V. Thakur, A. Singh, A. M. Awasthi, L. Singh. Temperature-dependent electrical transport characteristics of BaTiO3 modified lithium borate glasses, AIP Advances, (2015), 5, 087110. https://doi.org/10.1063/1.4928339
[9]. Kh. Shaaban, S.M. Abo-Naf, M. E. M. Hossouna, Physical and Structural Properties of Lithium Borate Glasses Containing MoO3,
Springer Science + Business Media, Dordrecht, Silicon, (2017). DOI 10.1007/s12633-016-9519-4 [10]. A. Abousehly, S.A.M. Issa, M.A. El-Oyoun, N. Afify, Electrical and mechanical properties of Li2O–BaO–B2O3 glass system, J.
Non-Cryst. Solids, (2015), 429, 148–152. http://dx.doi.org/10.1016/j.jnoncrysol.2015.09.003.
[11]. T. Maheswari, V. Naresh, R. Ramaraghavulu, S. Buddhudu, B. H. Rudramadevi, Studies on Thermal and Spectral Properties of
Ho3+: Lithium Borate Glasses, International Journal Of Engineering Research & Technology (IJERT), (2014), 3[7], 574-580. [12]. J. Anjaiah, C. Laxmikanth, P. Kistaiah, N. Veeraiah, Dosimetric and kinetic parameters of lithium cadmium borate glasses doped
with rare-earth ions, Journal of Radiation Research and Applied Sciences, (2014), 7[4], 519-525.
https://doi.org/10.1016/j.jrras.2014.08.009 [13]. V. Naresh, S. Buddhudu, Structural, thermal, dielectric and ac conductivity properties of lithium fluoro-borate optical glasses,
Ceramics International, (2012), 38[3], 2325-2332.https://doi.org/10.1016/j.ceramint.2011.10.084
[14]. R. S. Gedam, D. D., Ramteke, Electrical and optical properties of lithium borate glasses doped with Nd2O3, journal of rare earths, (2012), 30[8], 785–789. DOI: 10.1016/S1002-0721(12)60130-6
[15]. K. Funke, R.D. Banhatti, Modelling frequency-dependent conductivities and permittivities in the framework of the MIGRATION
concept, Solid State Ionic, (2004), 169[1-4], 1-8. https://doi.org/10.1016/j.ssi.2003.06.003 [16]. M. A. Zaki Ewiss, Electrical, infrared spectroscopy and DTA studies of some sodium tetraborate glasses containing Fe2O, Phys.
Chem. Glasses, (1998), 39[4], 236-240.
[17]. M. A. Zaki Ewiss, S. A. Abu Mansoor, Electrical, I.R. spectroscopy, and DTA studies of some sodium tetraborate glasses containing vanadium oxide, Physica status solidi (a), (1996), 156[2], 421-431. https://doi.org/10.1002/pssa.2211560220
[18]. M. A. Zaki Ewiss, M. Y. El Zayat, R. Nothhelfer-Richter, Dielectric spectroscopy of [(Na2B4O7)98%-(Cr2O3)2%] and
[(Na2B4O7)98%-(MnO)2%] semiconductor glasses, Physics and Chemistry of Glasses, (2002), 43[3], 165-170. [19]. H. M. Kamari et al., Optical Properties of Lithium Borate Glass (Li2O)x (B2O3)1-x, Sains Malaysiana, (2014), 43[6], 899-902.
[20]. I.G. Austin, N.F. Mott, Polarons in crystalline and non-crystalline materials. Adv Phys, (1969), 18, 41–102.
[21]. G.N. Greaves, S.J. Gurman, C.R.A, Catlow, A.V. Chadwick, S. Houde-Walter, C.M.B. Henderson, D.B. Dobson, A structural basis for ionic diffusion in oxide glasses, Philos. Mag. A, (1991), 69. https://doi.org/10.1080/01418619108204878
[22]. S.W. Martin, D.M. Martin, J.A. Schrooten, B.M. Meyer, Trapping model for the non-Arrhenius ionic conductivity in fast ion-
conducting glasses, Journal of Physics: Condensed Matter, (2003), 15[16]. https://doi.org/10.1088/0953-8984/15/16/312
[23]. Q. Mei, Structural investigation into the non-Arrhenius behaviour of fast ion conducting sulfide glasses, Retrospective Theses and Dissertations, (2003). 606, Iowa State University. https://lib.dr.iastate.edu/rtd/606
[24]. Y.H. Elbashar, A.M. Badr, H.A. Elshaikh, A.G. Mostafa, A.M. Ibrahim, Dielectric and optical properties of CuO containing sodium
zinc phosphate glasses, Processing and Application of Ceramics, (2016), 10[4], 277–286. DOI: 10.2298/PAC1604277E [25]. M.P.F. Graça, B.M.G. Melo, P.R. Prezas, M.A. Valente, F.N.A. Freier, L. Bih, "Electrical and dielectric analysis of phosphate-
based glasses doped with alkali oxides", Mater. Design, (2015), 86, 427–435.
https://doi.org/10.1016/j.matdes.2015.07.043
[26]. V. P. Seth, A. Yadav, S. K. Gupta, Electrical conductivity and ESR of lithium borate glasses containing mixed transition metal
oxides. J Mater Sci, (1988), 23, 3495–3500. https://doi.org/10.1007/BF00540485
[27]. A.K. Jonscher, The universal dielectric response. Nature, (1977), 267, 673-679. https://doi.org/10.1038/267673a0 [28]. I. Stavrakas, K. Moutzouris, K. Ninos, N. Mitritsakis, Z. Agioutanatis, D. Triantis, Using A.C. conductivity measurements to study
the influence of mechanical stress on the strength of geomaterials, Open J. Appl. Sci., (2012), 2, 61–65. DOI:
10.4236/ojapps.2012.22007 [29]. A. E. Bekheet. Ac-conductivity and dielectric properties of Ga2S3-Ga2S3 film. Physica B, (2008), 403, 4342-4346.
[30]. S. Thomas, R. George, M. Rathaiah, V. Venkatramu, Sk. N. Rasool, N. V. Unnikirshnan. Structural vibrational and dielectric
studies of Sm3+-doped K-Mg-Alzincfluorophosphate glasses. Physica B, (2013), 431, 69-74.
Recommended
![Studies of Borate Glasses Doped with Transition Metal Ion ...shodhganga.inflibnet.ac.in/bitstream/10603/13455/14/14_chapter 4.pdftransmission [8,9], make these glasses potential candidates](https://img.pdfslide.net/doc/110x75/5f049dbd7e708231d40eda6b/studies-of-borate-glasses-doped-with-transition-metal-ion-4pdf-transmission.jpg)