ELIGIBILITY: MRC/BHF Heart Protection Study
• Increased risk of CHD death due to prior disease:
Myocardial infarction or other coronary heart disease;
Occlusive disease of non-coronary arteries; or
Diabetes mellitus or treated hypertension
• Age 40-80 years
• Total cholesterol >3.5 mmol/l (>135mg/dl)
• Statin or vitamins not considered clearly indicated or contraindicated by patient’s own doctors
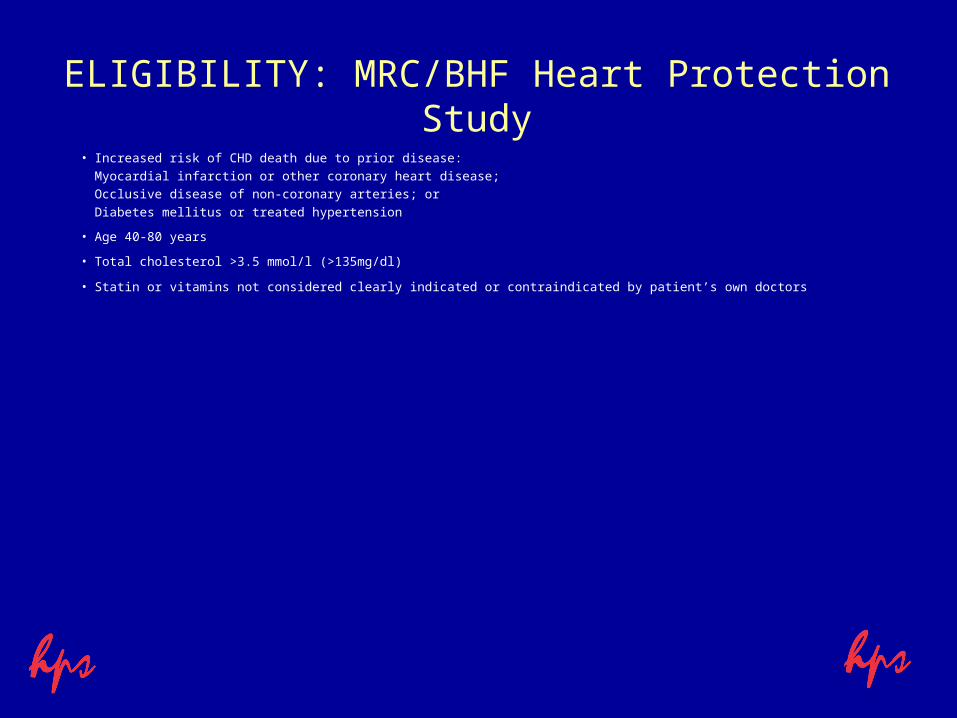
PRIOR DISEASE at BASELINE
Prior disease Number Percentage
Any MI 8510 41%Other CHD 4876 24%No CHD* 7150 35% Cerebrovascular 1820 Peripheral vascular 2701 Diabetes 3982
ALL PATIENTS 20,536 100%
* Overlap between categories within “No CHD” group
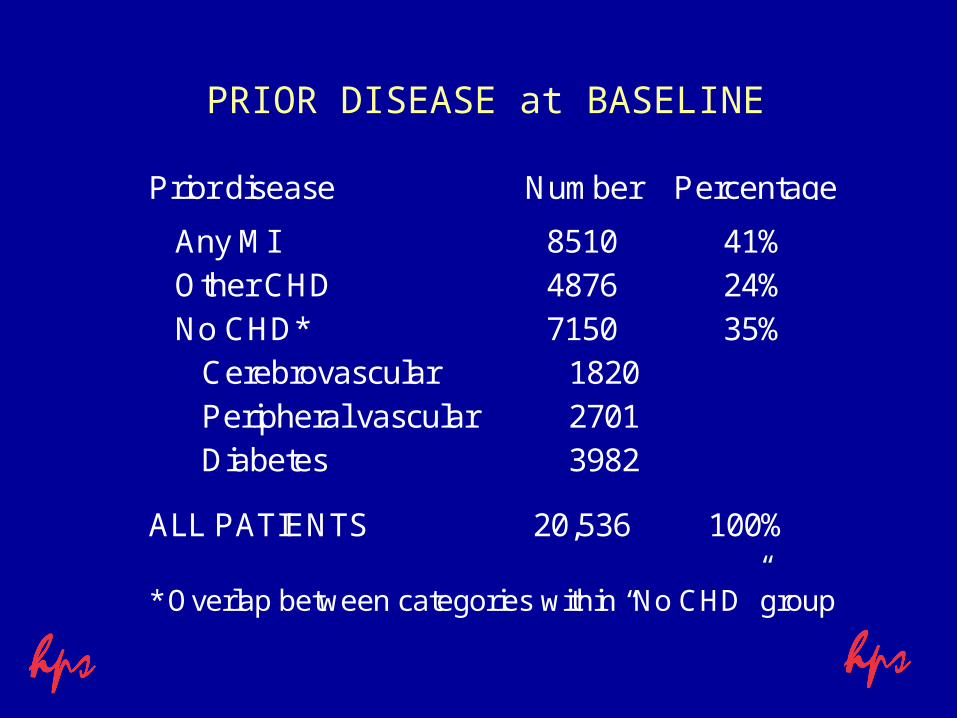
AGE & SEX at BASELINE
Baseline feature Number Percentage
Age (years)<65 9839 48%65-69 4891 24%70-74 4543 22%>74 1263 6%
SexMale 15,454 75%Female 5082 25%
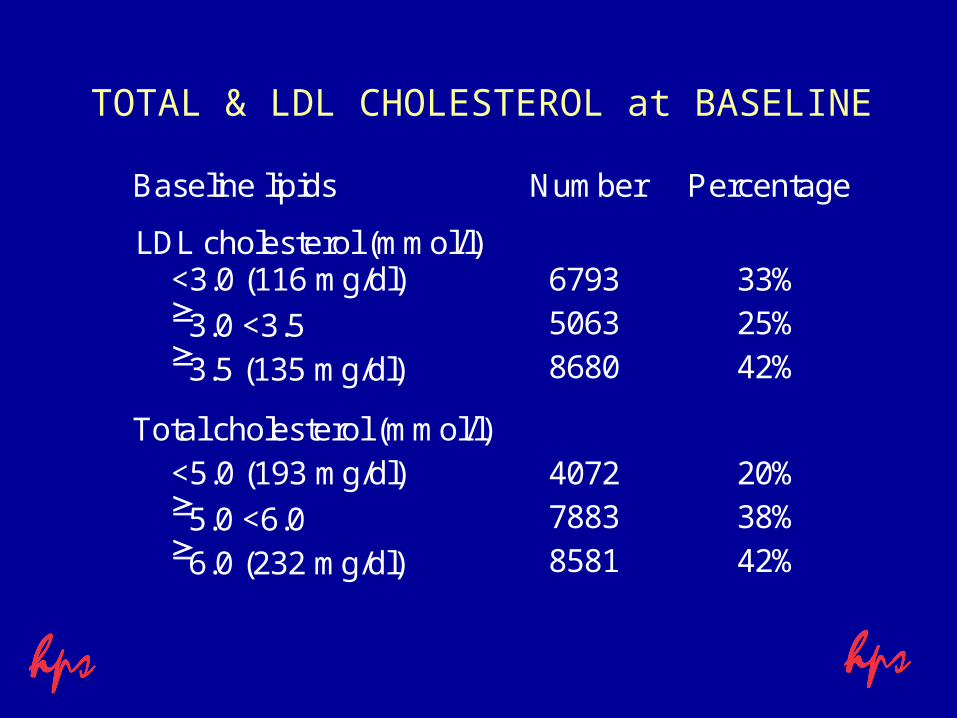
TOTAL & LDL CHOLESTEROL at BASELINE
Baseline lipids Number Percentage
LDL cholesterol (mmol/l)<3.0 (116 mg/dl) 6793 33%3.0 <3.5 5063 25%3.5 (135 mg/dl) 8680 42%
Total cholesterol (mmol/l)<5.0 (193 mg/dl) 4072 20%5.0 <6.0 7883 38%6.0 (232 mg/dl) 8581 42%
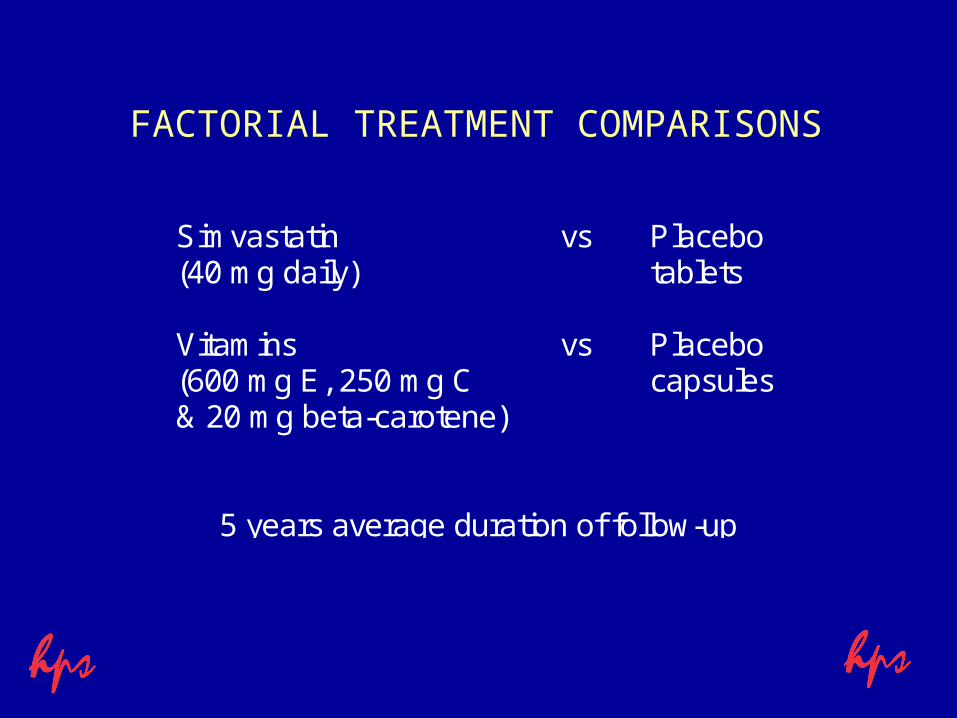
FACTORIAL TREATMENT COMPARISONS
Simvastatin(40 mg daily)
vs Placebotablets
Vitamins(600 mg E, 250 mg C& 20 mg beta-carotene)
vs Placebocapsules
5 years average duration of follow-up
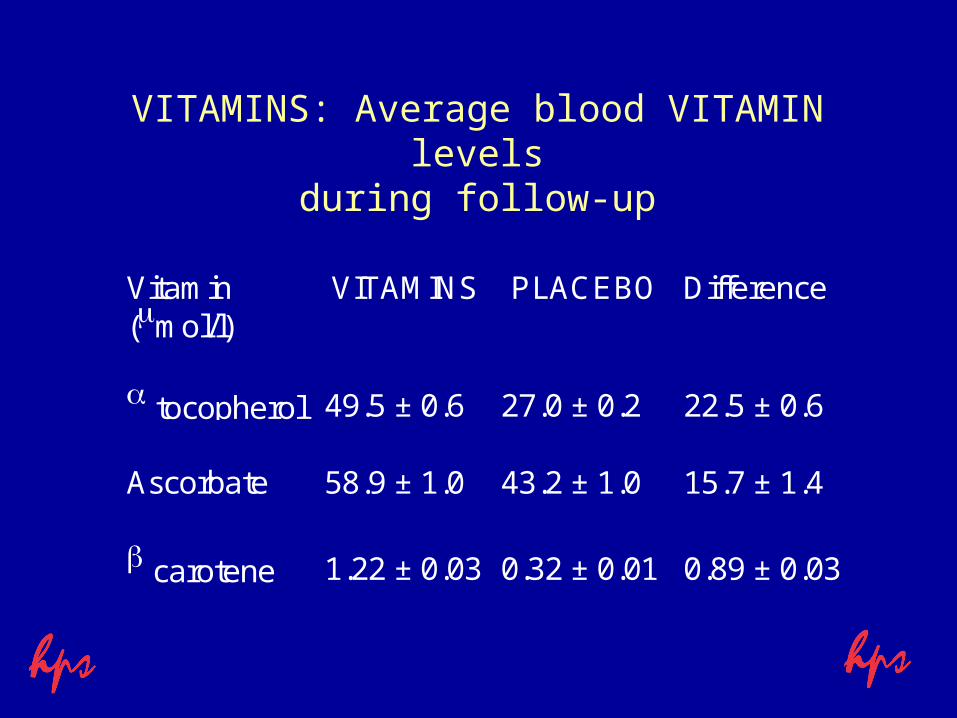
VITAMINS: Average blood VITAMIN levelsduring follow-up
Vitamin(mol/l)
VITAMINS PLACEBO Difference
tocopherol 49.5 ± 0.6 27.0 ± 0.2 22.5 ± 0.6
Ascorbate 58.9 ± 1.0 43.2 ± 1.0 15.7 ± 1.4
carotene 1.22 ± 0.03 0.32 ± 0.01 0.89 ± 0.03
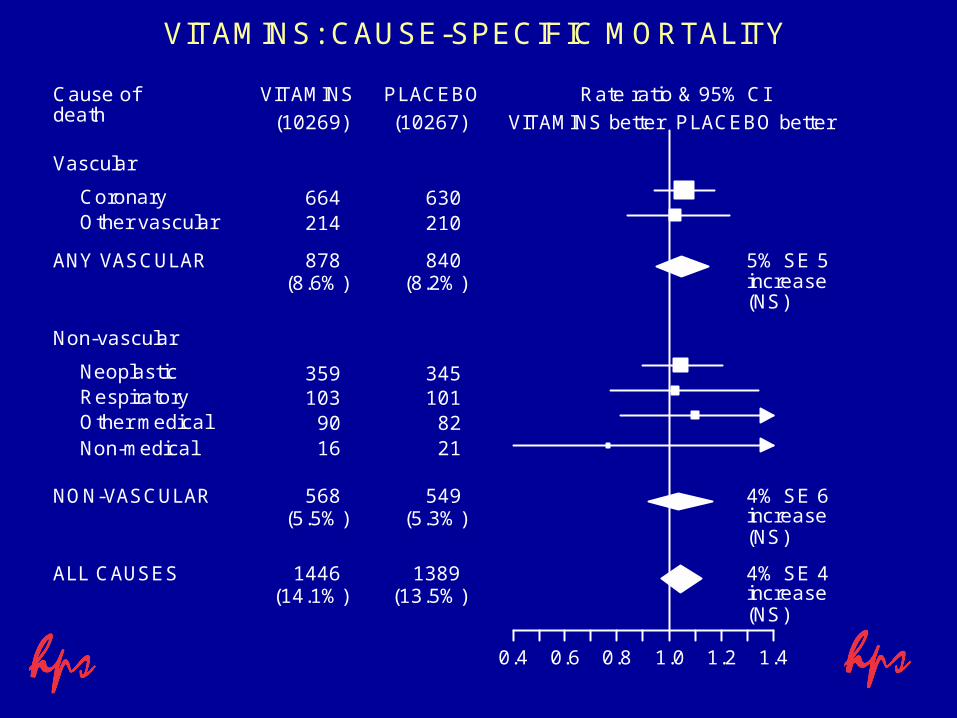
VITAMINS: CAUSE-SPECIFIC MORTALITY
(10269) (10267)
VITAMINS PLACEBO Rate ratio & 95% CI
VITAMINS better PLACEBO better
Cause ofdeath
Vascular
664 630Coronary214 210Other vascular
(8.6%) (8.2%)5% SE 5increase
878 840
(NS)
ANY VASCULAR
Non-vascular
359 345Neoplastic103 101Respiratory
90 82Other medical16 21Non-medical
(5.5%) (5.3%)4% SE 6increase
568 549
(NS)
NON-VASCULAR
(14.1%) (13.5%)4% SE 4increase
1446 1389
(NS)
ALL CAUSES
0.4 0.6 0.8 1.0 1.2 1.4
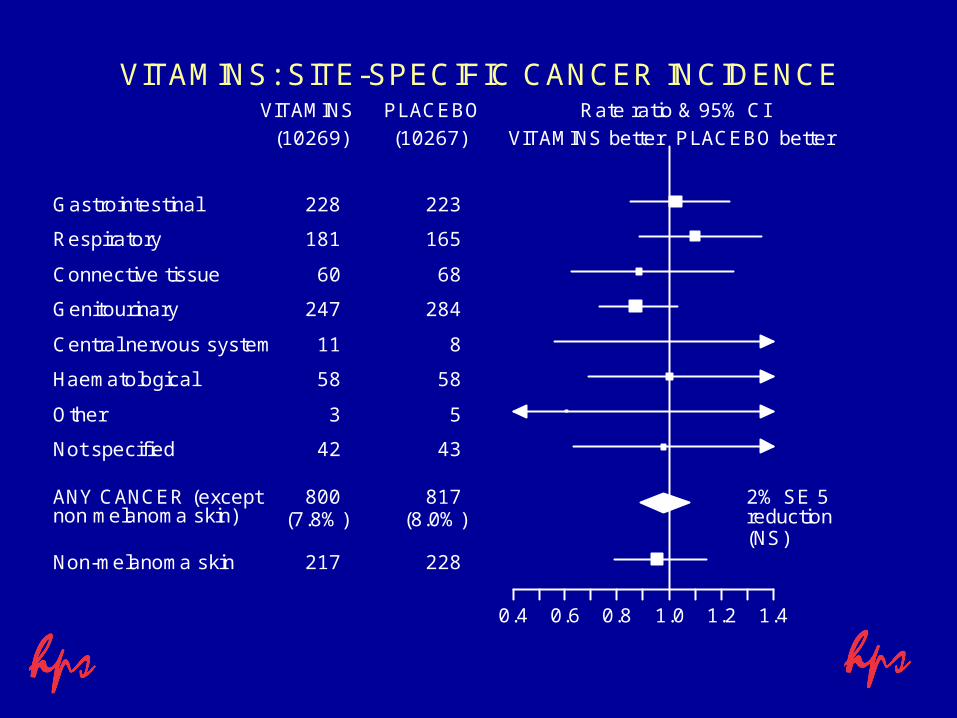
VITAMINS: SITE-SPECIFIC CANCER INCIDENCE
(10269) (10267)
VITAMINS PLACEBO Rate ratio & 95% CI
VITAMINS better PLACEBO better
228 223Gastrointestinal
181 165Respiratory
60 68Connective tissue
247 284Genitourinary
11 8Central nervous system
58 58Haematological
3 5Other
42 43Not specified
(7.8%) (8.0%)2% SE 5reduction
800 817
(NS)
ANY CANCER (exceptnon melanoma skin)
217 228Non-melanoma skin
0.4 0.6 0.8 1.0 1.2 1.4
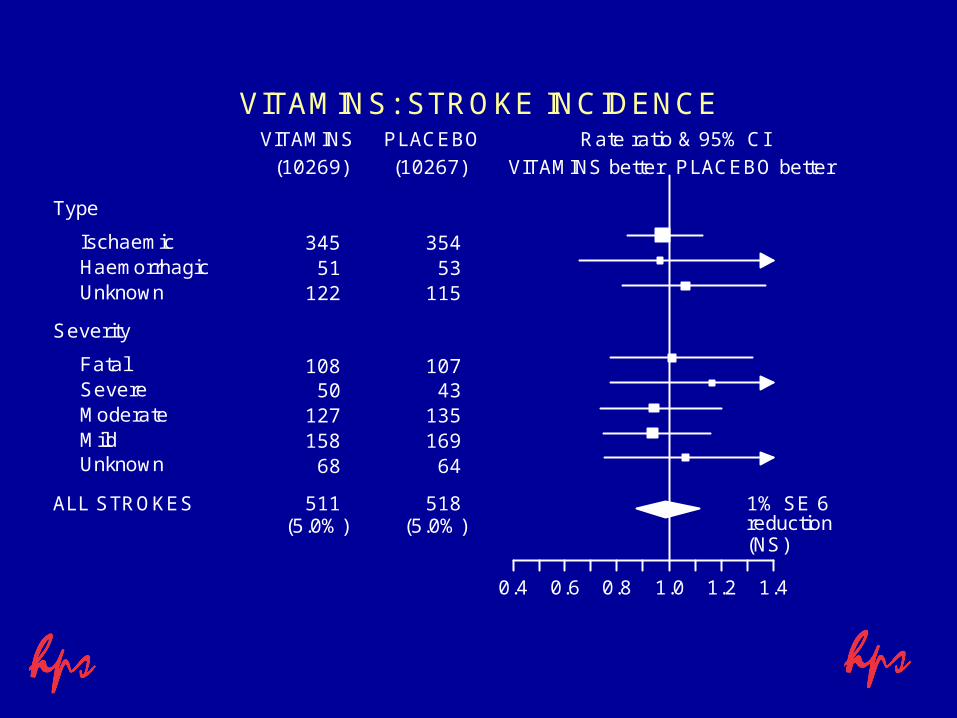
VITAMINS: STROKE INCIDENCE
(10269) (10267)
VITAMINS PLACEBO Rate ratio & 95% CI
VITAMINS better PLACEBO better
Type
345 354Ischaemic51 53Haemorrhagic
122 115Unknown
Severity
108 107Fatal50 43Severe
127 135Moderate158 169Mild
68 64Unknown
(5.0%) (5.0%)1% SE 6reduction
511 518
(NS)
ALL STROKES
0.4 0.6 0.8 1.0 1.2 1.4
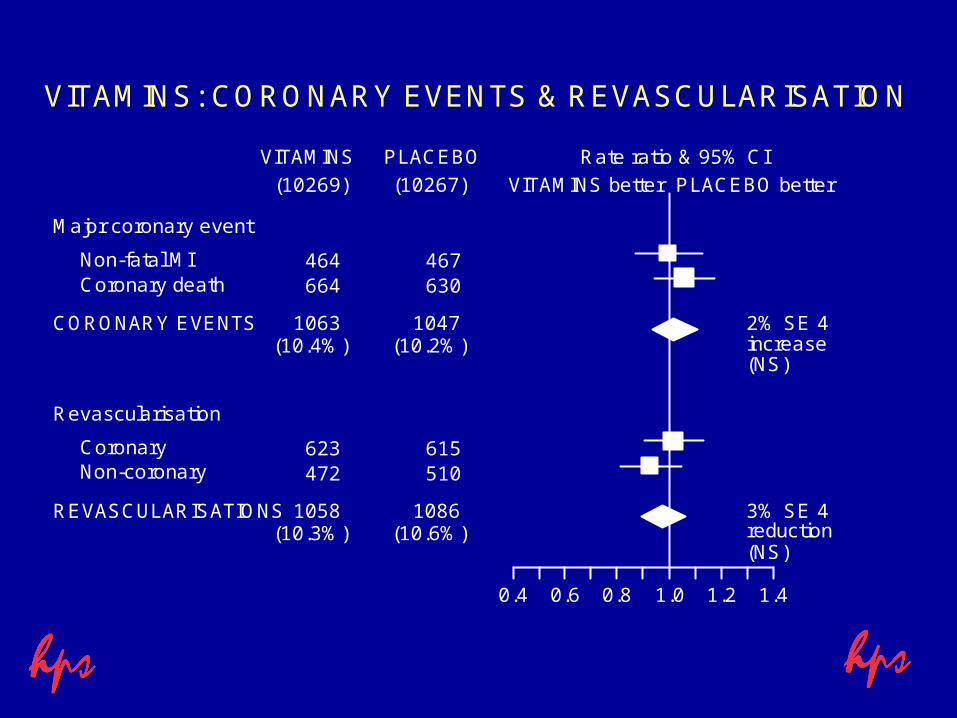
VITAMINS: CORONARY EVENTS & REVASCULARISATION
(10269) (10267)
VITAMINS PLACEBO Rate ratio & 95% CI
VITAMINS better PLACEBO better
Major coronary event
464 467Non-fatal MI664 630Coronary death
(10.4%) (10.2%)2% SE 4increase
1063 1047
(NS)
CORONARY EVENTS
Revascularisation
623 615Coronary472 510Non-coronary
(10.3%) (10.6%)3% SE 4reduction
1058 1086
(NS)
REVASCULARISATIONS
0.4 0.6 0.8 1.0 1.2 1.4
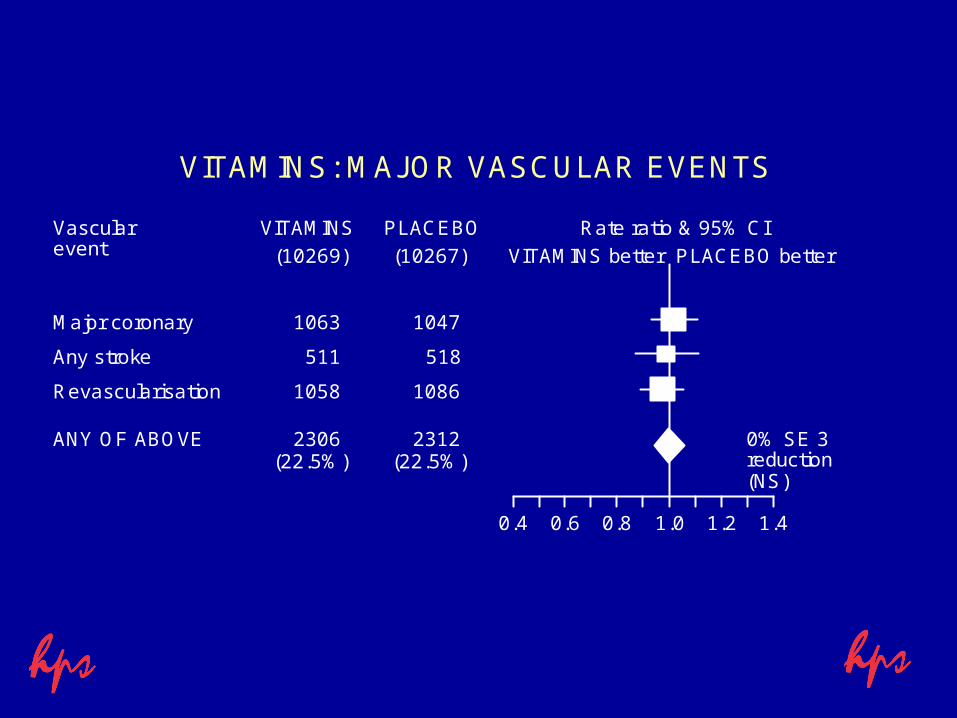
VITAMINS: MAJOR VASCULAR EVENTS
(10269) (10267)
VITAMINS PLACEBO Rate ratio & 95% CI
VITAMINS better PLACEBO better
Vascularevent
1063 1047Major coronary
511 518Any stroke
1058 1086Revascularisation
(22.5%) (22.5%)0% SE 3reduction
2306 2312
(NS)
ANY OF ABOVE
0.4 0.6 0.8 1.0 1.2 1.4
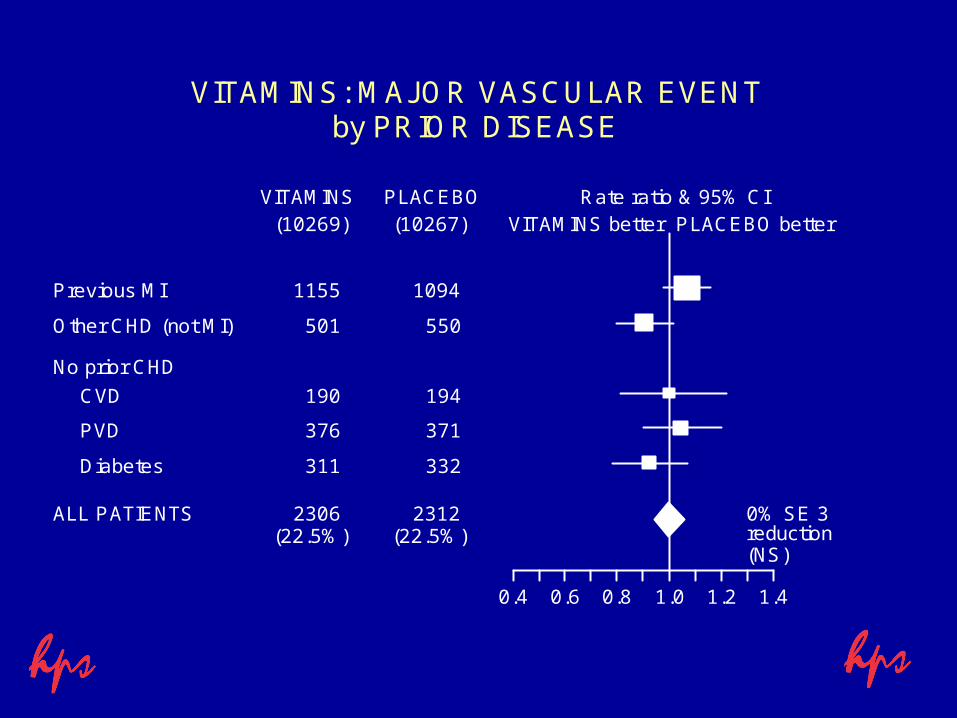
VITAMINS: MAJOR VASCULAR EVENTby PRIOR DISEASE
(10269) (10267)VITAMINS PLACEBO Rate ratio & 95% CI
VITAMINS better PLACEBO better
1155 1094Previous MI
501 550Other CHD (not MI)
No prior CHD
190 194CVD
376 371PVD
311 332Diabetes
(22.5%) (22.5%)0% SE 3reduction
2306 2312
(NS)
ALL PATIENTS
0.4 0.6 0.8 1.0 1.2 1.4
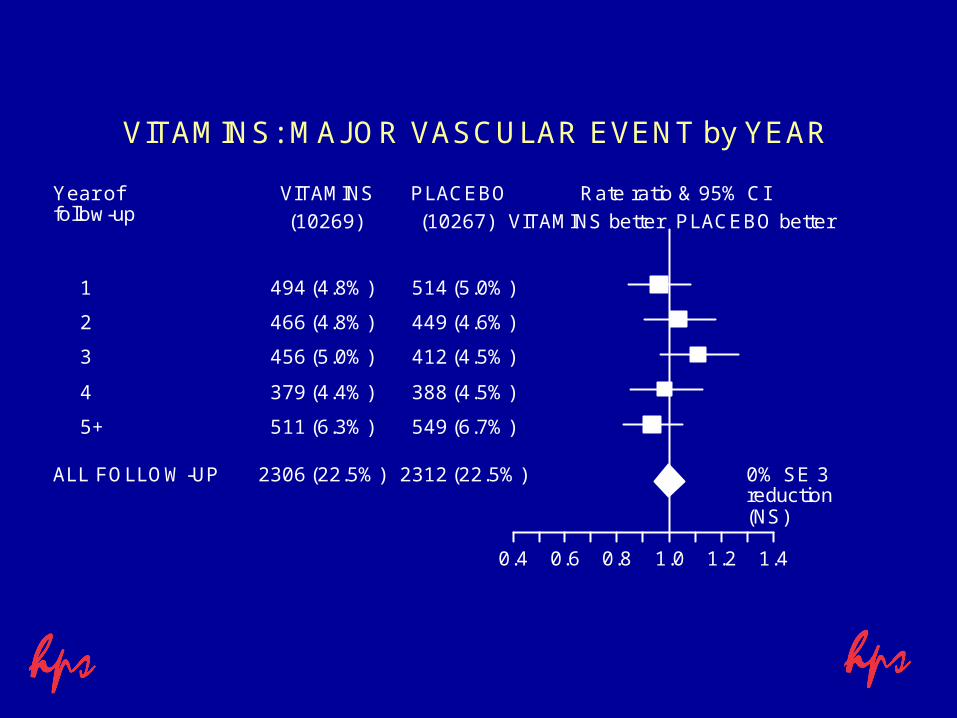
VITAMINS: MAJOR VASCULAR EVENT by YEAR
(10269) (10267)
VITAMINS PLACEBO Rate ratio & 95% CI
VITAMINS better PLACEBO better
Year offollow-up
494 514(4.8%) (5.0%)1
466 449(4.8%) (4.6%)2
456 412(5.0%) (4.5%)3
379 388(4.4%) (4.5%)4
511 549(6.3%) (6.7%)5+
0% SE 3reduction(NS)
2306 2312(22.5%) (22.5%)ALL FOLLOW-UP
0.4 0.6 0.8 1.0 1.2 1.4
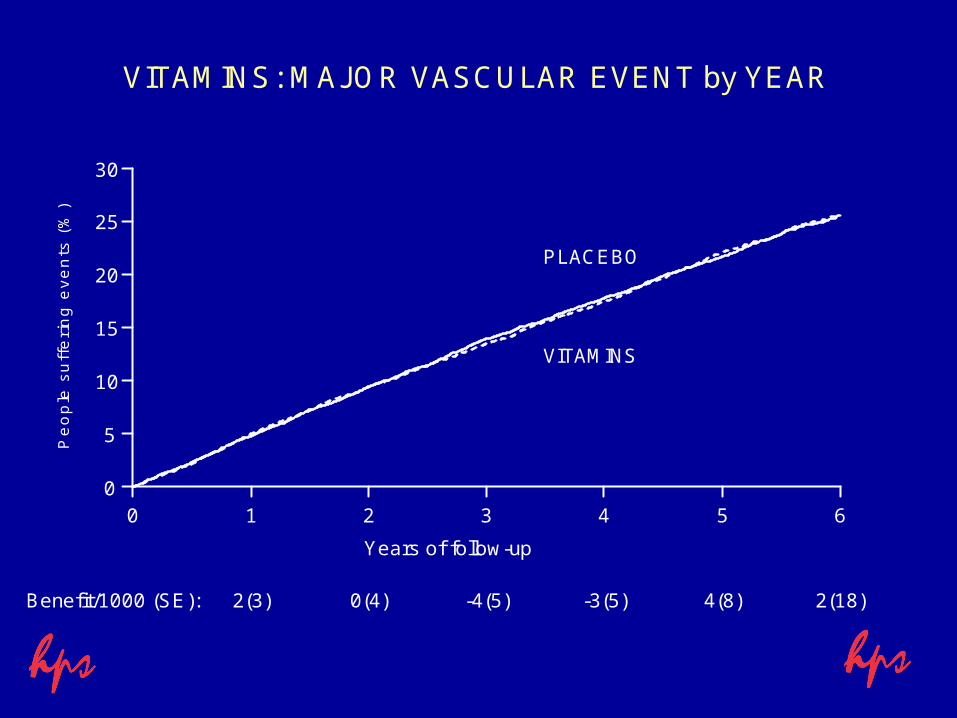
VITAMINS: MAJOR VASCULAR EVENT by YEAR
0 1 2 3 4 5 60
5
10
15
20
25
30
Years of follow-up
2(3) 0(4) -4(5)
VITAMINS
PLACEBO
-3(5) 4(8) 2(18)Benefit/1000 (SE):
Pe
op
le s
uff
eri
ng
ev
en
ts (
%)
VITAMINS
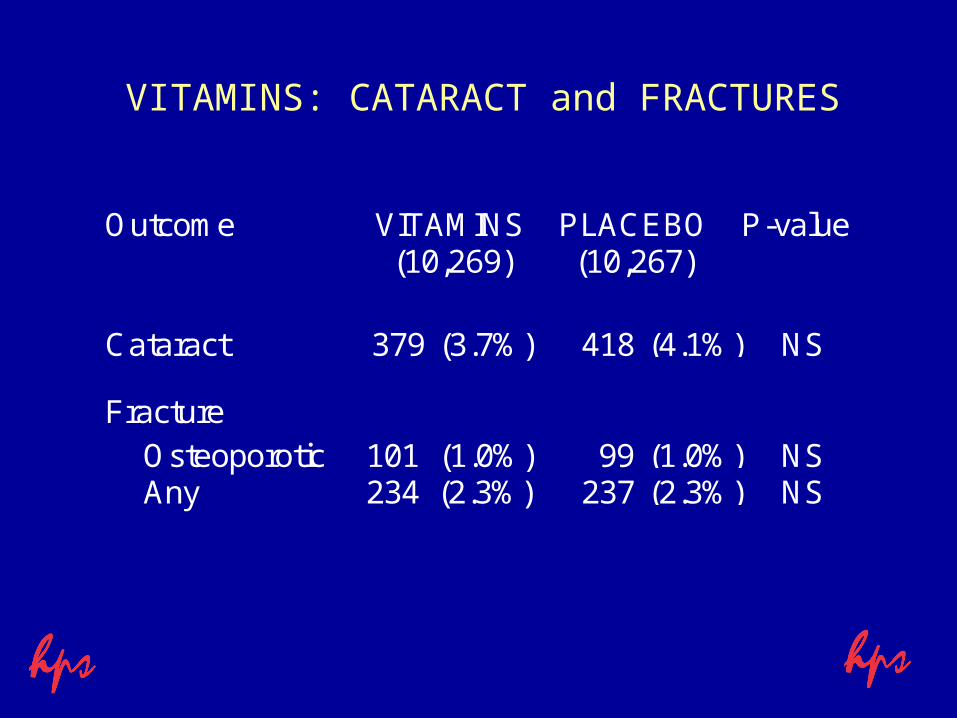
VITAMINS: CATARACT and FRACTURES
Outcome VITAMINS (10,269)
PLACEBO(10,267)
P-value
Cataract 379 (3.7%) 418 (4.1%) NS
FractureOsteoporotic 101 (1.0%) 99 (1.0%) NSAny 234 (2.3%) 237 (2.3%) NS
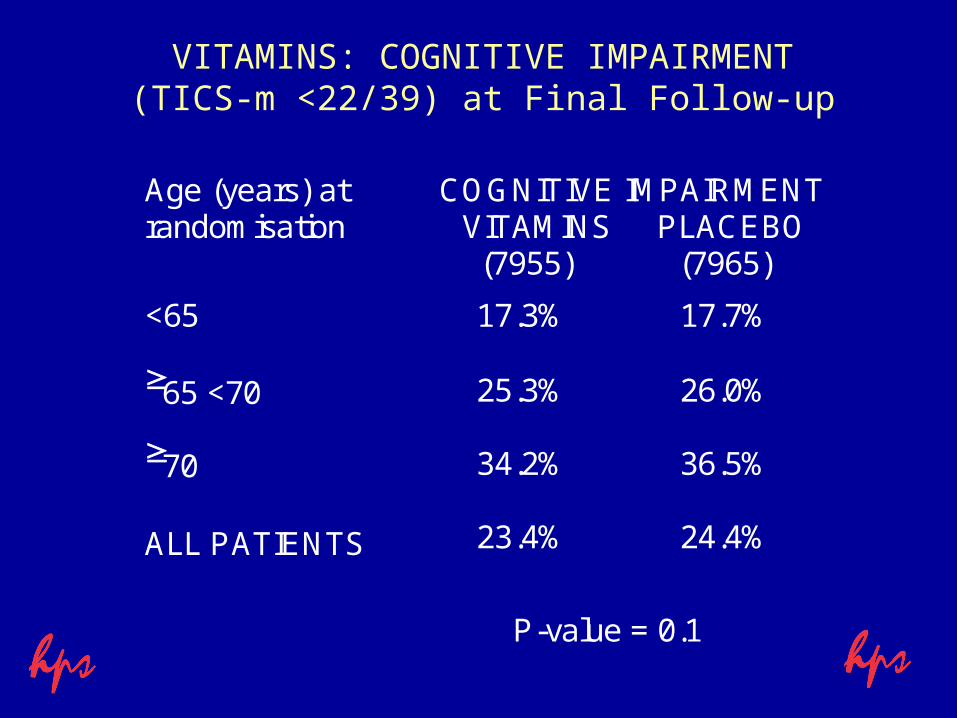
VITAMINS: COGNITIVE IMPAIRMENT(TICS-m <22/39) at Final Follow-up
Age (years) atrandomisation
COGNITIVE IMPAIRMENT VITAMINS PLACEBO (7955) (7965)
<65 17.3% 17.7%
65 <70 25.3% 26.0%
70 34.2% 36.5%
ALL PATIENTS 23.4% 24.4%
P-value = 0.1
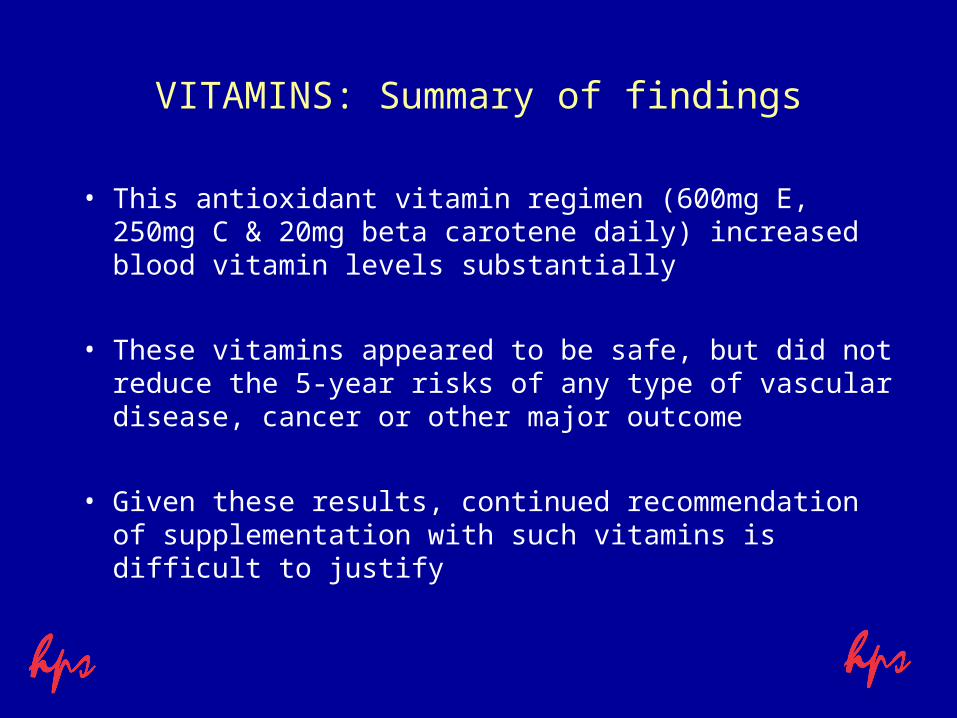
VITAMINS: Summary of findings
• This antioxidant vitamin regimen (600mg E, 250mg C & 20mg beta carotene daily) increased blood vitamin levels substantially
• These vitamins appeared to be safe, but did not reduce the 5-year risks of any type of vascular disease, cancer or other major outcome
• Given these results, continued recommendation of supplementation with such vitamins is difficult to justify

FACTORIAL TREATMENT COMPARISONS
Simvastatin(40 mg daily)
vs Placebotablets
Vitamins(600 mg E, 250 mg C& 20 mg beta-carotene)
vs Placebocapsules
5 years average duration of follow-up
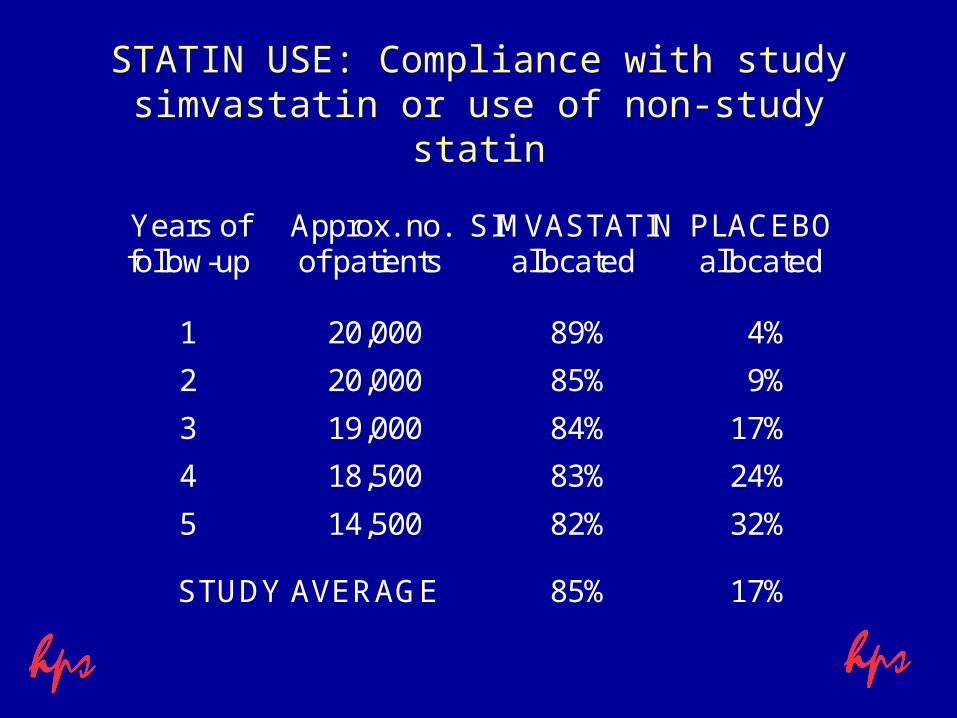
STATIN USE: Compliance with study simvastatin or use of non-study statin
Years offollow-up
Approx. no.of patients
SIMVASTATINallocated
PLACEBO allocated
1 20,000 89% 4%
2 20,000 85% 9%
3 19,000 84% 17%
4 18,500 83% 24%
5 14,500 82% 32%
STUDY AVERAGE 85% 17%
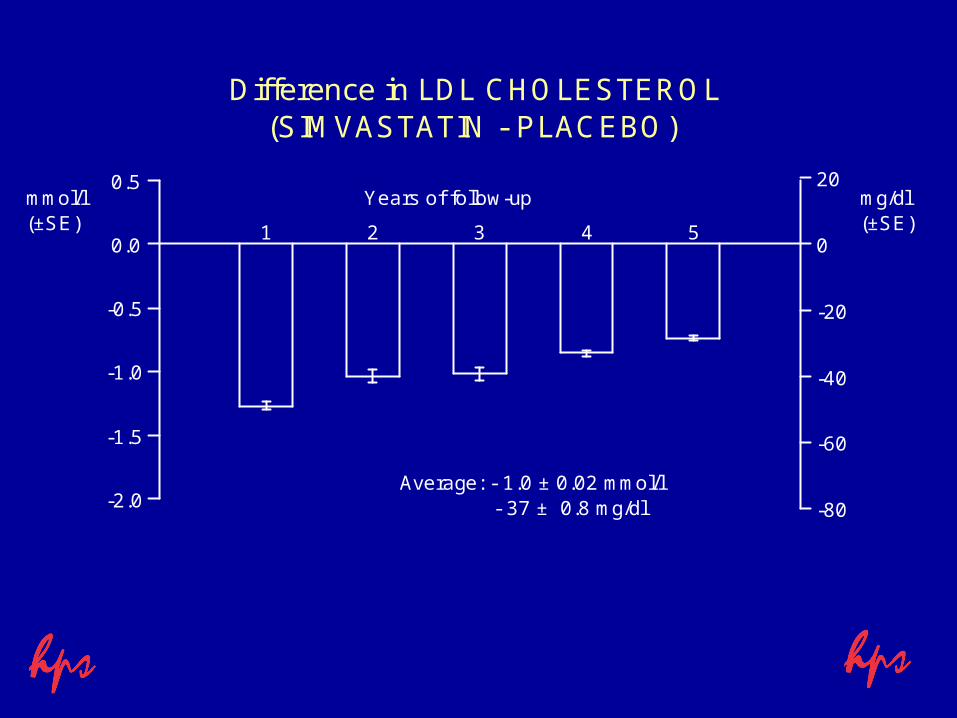
Difference in LDL CHOLESTEROL
1 2 3 4 5
-2.0
-1.5
-1.0
-0.5
0.0
0.5
-80
-60
-40
-20
0
20Years of follow-upmmol/l
(±SE)mg/dl(±SE)
Average: - 1.0 ± 0.02 mmol/l- 37 ± 0.8 mg/dl
(SIMVASTATIN - PLACEBO)
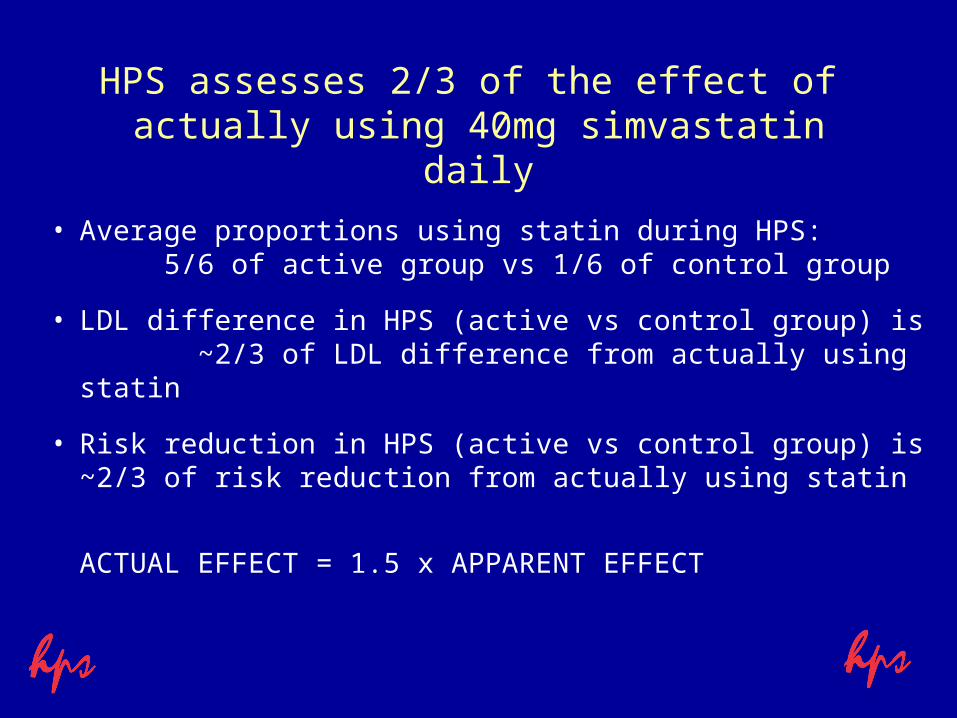
HPS assesses 2/3 of the effect of actually using 40mg simvastatin daily
• Average proportions using statin during HPS: 5/6 of active group vs 1/6 of control group
• LDL difference in HPS (active vs control group) is ~2/3 of LDL difference from actually using statin
• Risk reduction in HPS (active vs control group) is ~2/3 of risk reduction from actually using statin
ACTUAL EFFECT = 1.5 x APPARENT EFFECT
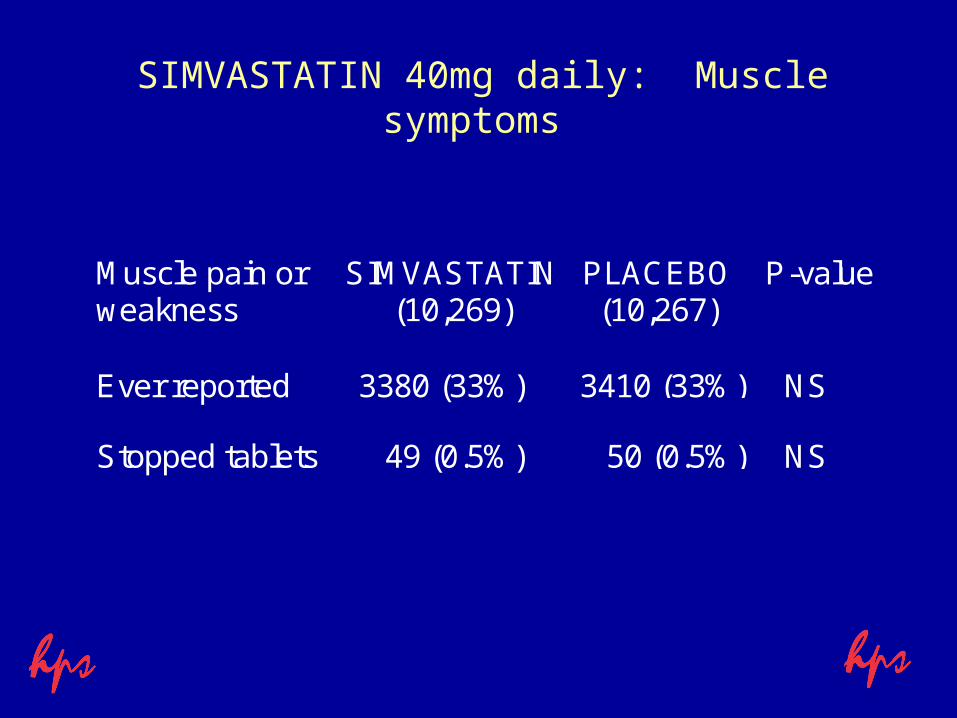
SIMVASTATIN 40mg daily: Muscle symptoms
Muscle pain orweakness
SIMVASTATIN(10,269)
PLACEBO(10,267)
P-value
Ever reported 3380 (33%) 3410 (33%) NS
Stopped tablets 49 (0.5%) 50 (0.5%) NS
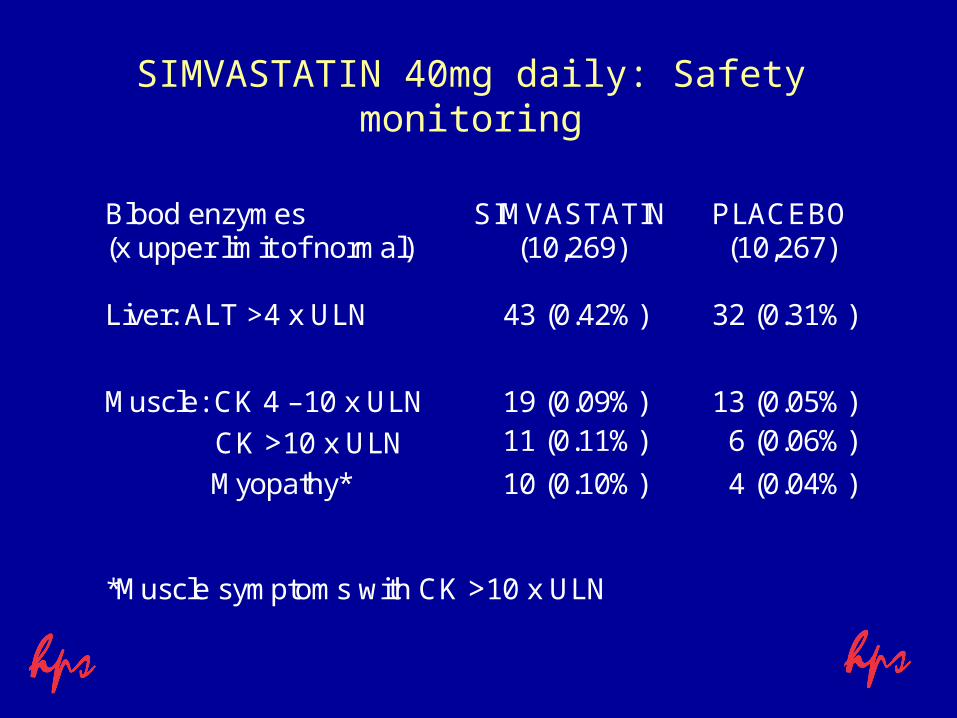
SIMVASTATIN 40mg daily: Safety monitoring
Blood enzymes(x upper limit of normal)
SIMVASTATIN(10,269)
PLACEBO(10,267)
Liver: ALT >4 x ULN 43 (0.42%) 32 (0.31%)
Muscle: CK 4 –10 x ULN 19 (0.09%) 13 (0.05%)
CK >10 x ULN 11 (0.11%) 6 (0.06%)
Myopathy* 10 (0.10%) 4 (0.04%)
*Muscle symptoms with CK >10 x ULN
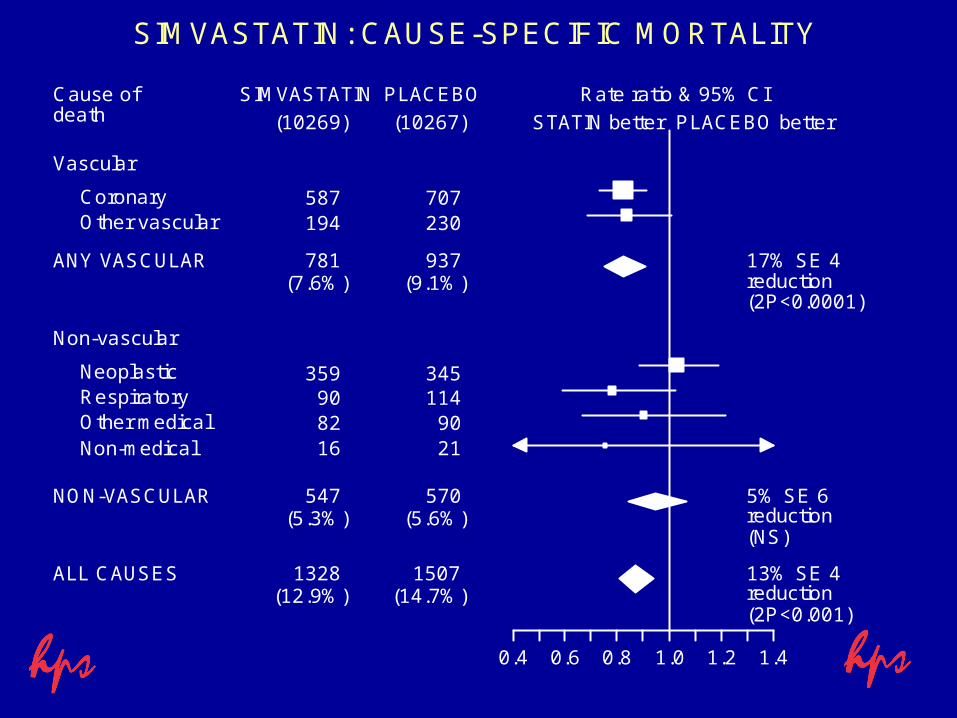
SIMVASTATIN: CAUSE-SPECIFIC MORTALITY
(10269) (10267)
SIMVASTATIN PLACEBO Rate ratio & 95% CI
STATIN better PLACEBO better
Cause ofdeath
Vascular
587 707Coronary194 230Other vascular
(7.6%) (9.1%)17% SE 4reduction
781 937
(2P<0.0001)
ANY VASCULAR
Non-vascular
359 345Neoplastic90 114Respiratory82 90Other medical16 21Non-medical
(5.3%) (5.6%)5% SE 6reduction
547 570
(NS)
NON-VASCULAR
(12.9%) (14.7%)13% SE 4reduction
1328 1507
(2P<0.001)
ALL CAUSES
0.4 0.6 0.8 1.0 1.2 1.4
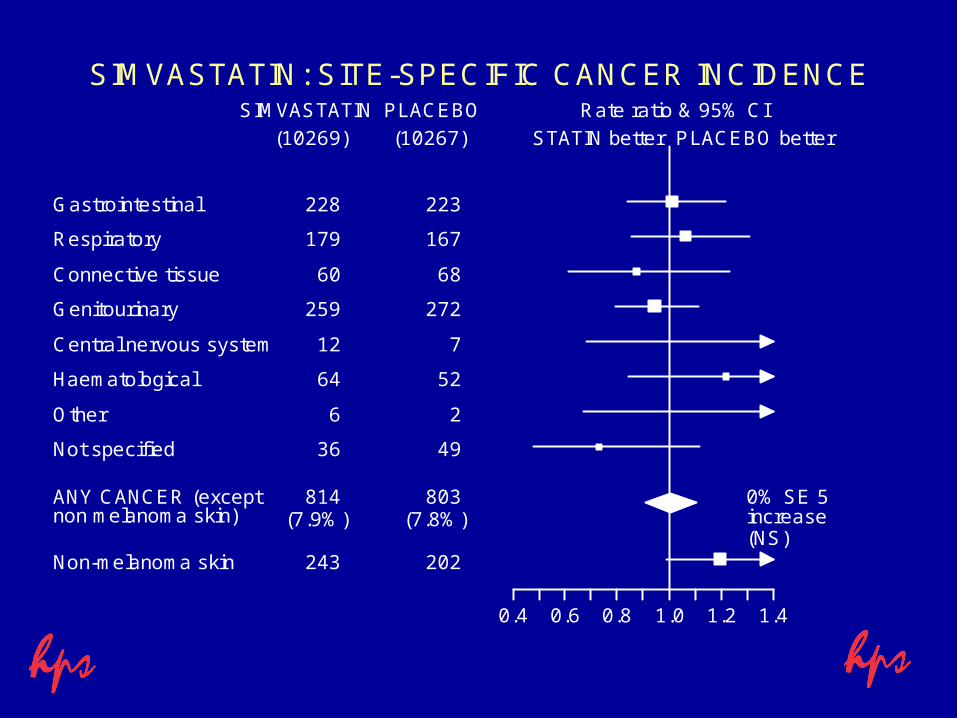
SIMVASTATIN: SITE-SPECIFIC CANCER INCIDENCE
(10269) (10267)
SIMVASTATIN PLACEBO Rate ratio & 95% CI
STATIN better PLACEBO better
228 223Gastrointestinal
179 167Respiratory
60 68Connective tissue
259 272Genitourinary
12 7Central nervous system
64 52Haematological
6 2Other
36 49Not specified
(7.9%) (7.8%)0% SE 5increase
814 803
(NS)
ANY CANCER (exceptnon melanoma skin)
243 202Non-melanoma skin
0.4 0.6 0.8 1.0 1.2 1.4
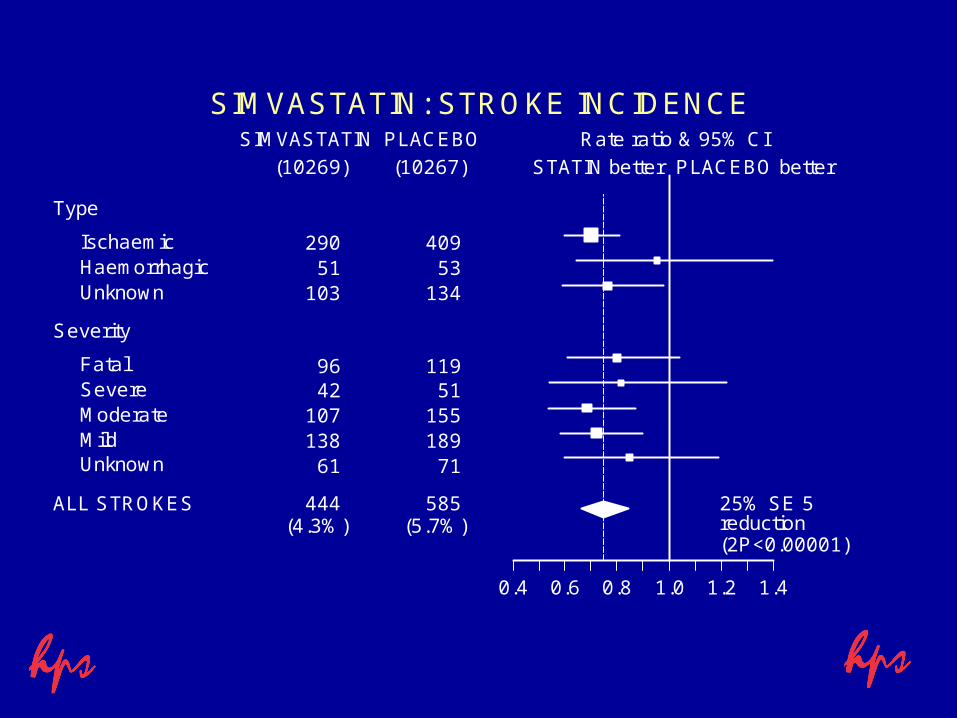
SIMVASTATIN: STROKE INCIDENCE
(10269) (10267)
SIMVASTATIN PLACEBO Rate ratio & 95% CI
STATIN better PLACEBO better
Type
290 409Ischaemic51 53Haemorrhagic
103 134Unknown
Severity
96 119Fatal42 51Severe
107 155Moderate138 189Mild
61 71Unknown
(4.3%) (5.7%)25% SE 5reduction
444 585
(2P<0.00001)
ALL STROKES
0.4 0.6 0.8 1.0 1.2 1.4
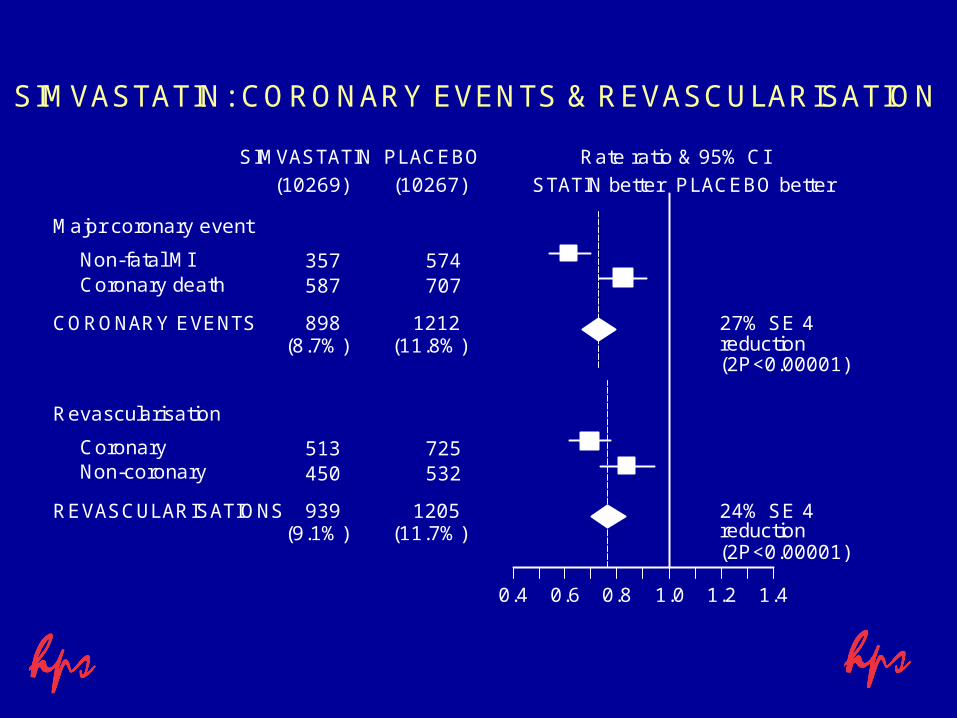
SIMVASTATIN: CORONARY EVENTS & REVASCULARISATION
(10269) (10267)
SIMVASTATIN PLACEBO Rate ratio & 95% CI
STATIN better PLACEBO better
Major coronary event
357 574Non-fatal MI587 707Coronary death
(8.7%) (11.8%)27% SE 4reduction
898 1212
(2P<0.00001)
CORONARY EVENTS
Revascularisation
513 725Coronary450 532Non-coronary
(9.1%) (11.7%)24% SE 4reduction
939 1205
(2P<0.00001)
REVASCULARISATIONS
0.4 0.6 0.8 1.0 1.2 1.4
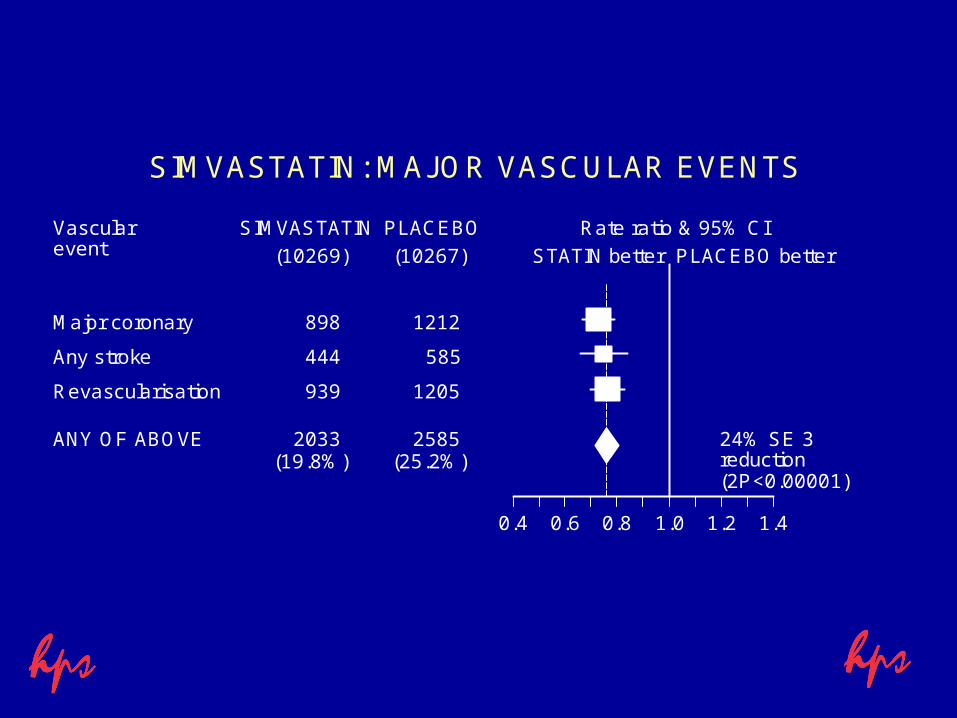
SIMVASTATIN: MAJOR VASCULAR EVENTS
(10269) (10267)
SIMVASTATIN PLACEBO Rate ratio & 95% CI
STATIN better PLACEBO better
Vascularevent
898 1212Major coronary
444 585Any stroke
939 1205Revascularisation
(19.8%) (25.2%)24% SE 3reduction
2033 2585
(2P<0.00001)
ANY OF ABOVE
0.4 0.6 0.8 1.0 1.2 1.4
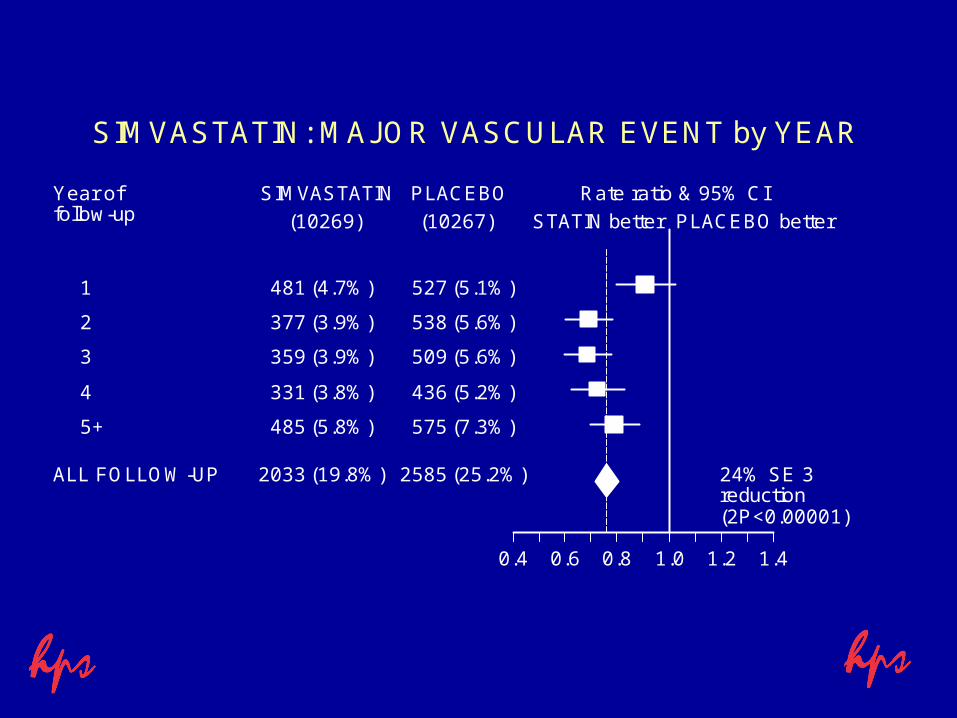
SIMVASTATIN: MAJOR VASCULAR EVENT by YEAR
(10269) (10267)
SIMVASTATIN PLACEBO Rate ratio & 95% CI
STATIN better PLACEBO better
Year offollow-up
481 527(4.7%) (5.1%)1
377 538(3.9%) (5.6%)2
359 509(3.9%) (5.6%)3
331 436(3.8%) (5.2%)4
485 575(5.8%) (7.3%)5+
24% SE 3reduction(2P<0.00001)
2033 2585(19.8%) (25.2%)ALL FOLLOW-UP
0.4 0.6 0.8 1.0 1.2 1.4
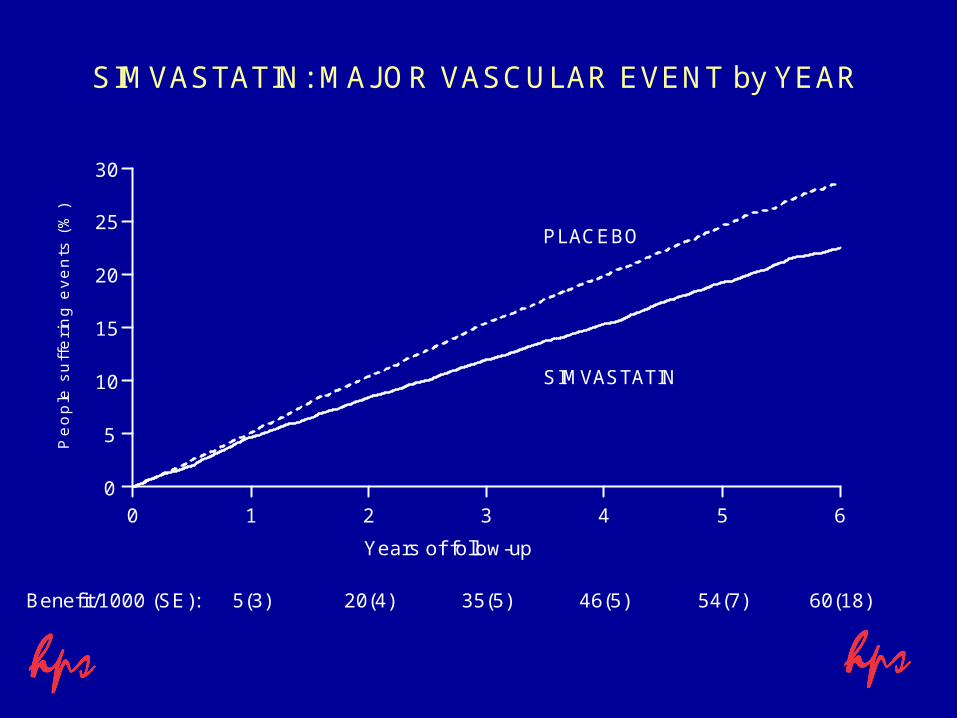
SIMVASTATIN: MAJOR VASCULAR EVENT by YEAR
0 1 2 3 4 5 60
5
10
15
20
25
30
Years of follow-up
5(3) 20(4) 35(5)
SIMVASTATIN
PLACEBO
46(5) 54(7) 60(18)Benefit/1000 (SE):
Pe
op
le s
uff
eri
ng
ev
en
ts (
%)
SIMVASTATIN
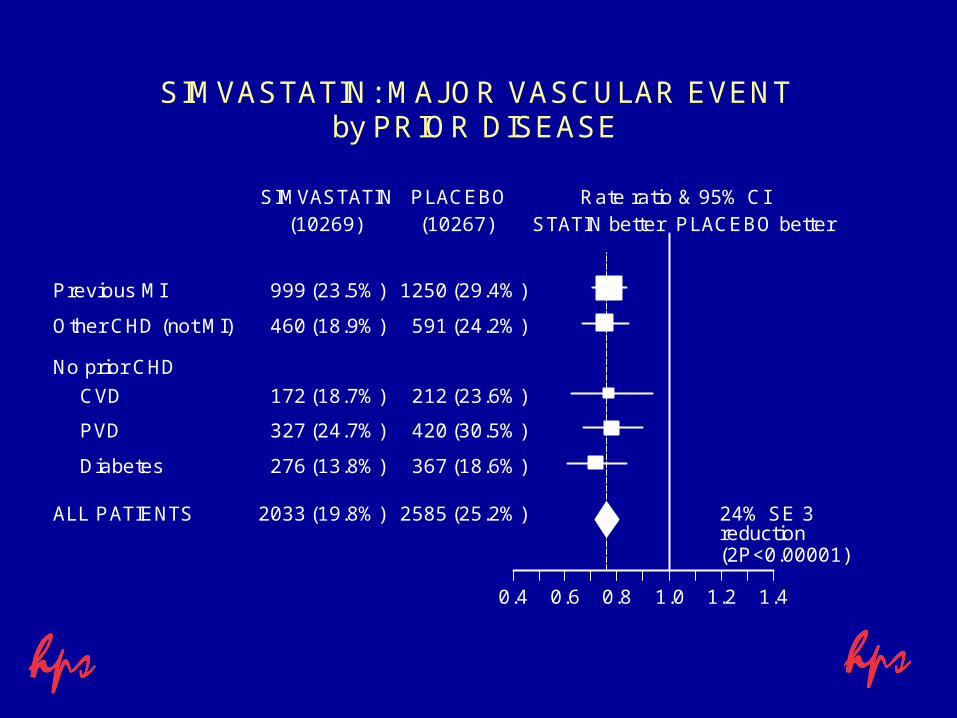
SIMVASTATIN: MAJOR VASCULAR EVENTby PRIOR DISEASE
(10269) (10267)SIMVASTATIN PLACEBO Rate ratio & 95% CI
STATIN better PLACEBO better
999 1250(23.5%) (29.4%)Previous MI
460 591(18.9%) (24.2%)Other CHD (not MI)
No prior CHD
172 212(18.7%) (23.6%)CVD
327 420(24.7%) (30.5%)PVD
276 367(13.8%) (18.6%)Diabetes
24% SE 3reduction(2P<0.00001)
2033 2585(19.8%) (25.2%)ALL PATIENTS
0.4 0.6 0.8 1.0 1.2 1.4
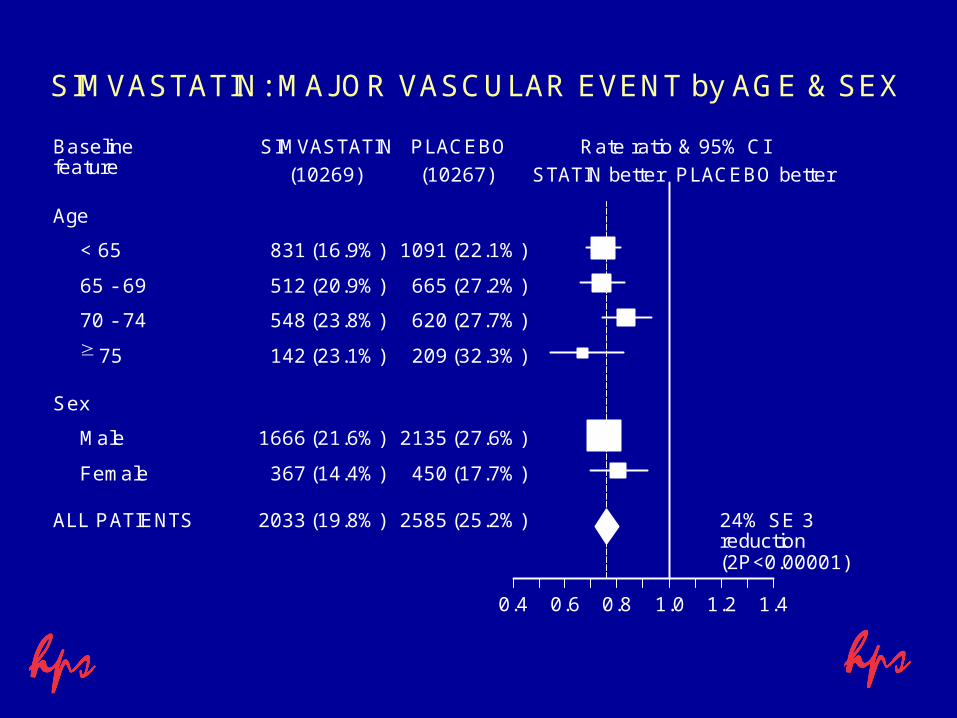
SIMVASTATIN: MAJOR VASCULAR EVENT by AGE & SEX
(10269) (10267)
SIMVASTATIN PLACEBO Rate ratio & 95% CI
STATIN better PLACEBO better
Baselinefeature
Age
831 1091(16.9%) (22.1%)< 65
512 665(20.9%) (27.2%)65 - 69
548 620(23.8%) (27.7%)70 - 74
142 209(23.1%) (32.3%) 75
Sex
1666 2135(21.6%) (27.6%)Male
367 450(14.4%) (17.7%)Female
24% SE 3reduction(2P<0.00001)
2033 2585(19.8%) (25.2%)ALL PATIENTS
0.4 0.6 0.8 1.0 1.2 1.4
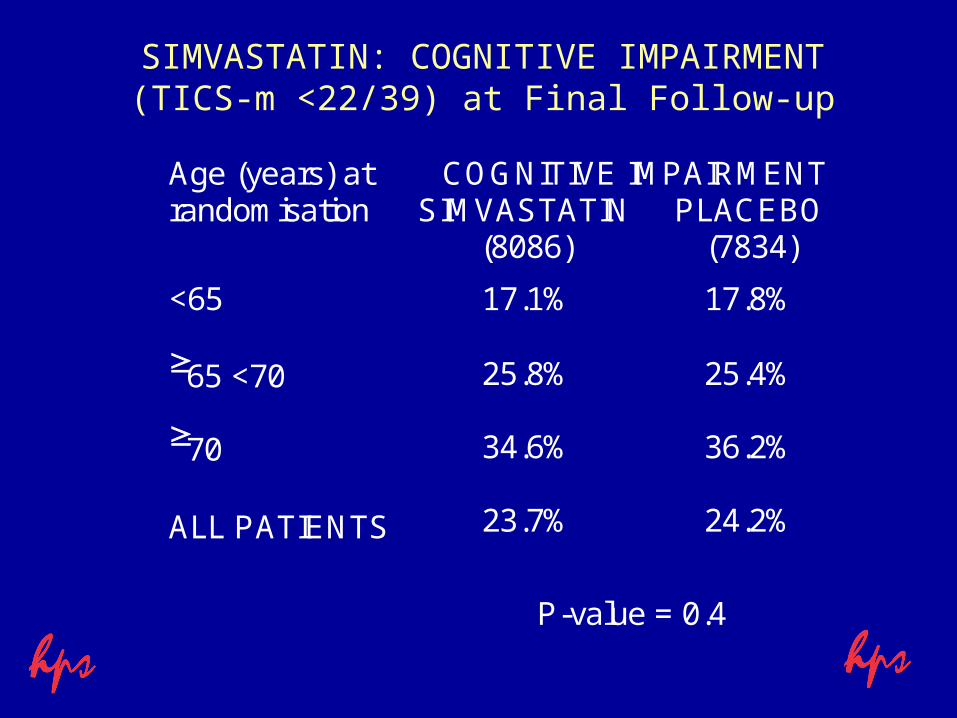
SIMVASTATIN: COGNITIVE IMPAIRMENT(TICS-m <22/39) at Final Follow-up
Age (years) atrandomisation
COGNITIVE IMPAIRMENTSIMVASTATIN PLACEBO (8086) (7834)
<65 17.1% 17.8%
65 <70 25.8% 25.4%
70 34.6% 36.2%
ALL PATIENTS 23.7% 24.2%
P-value = 0.4
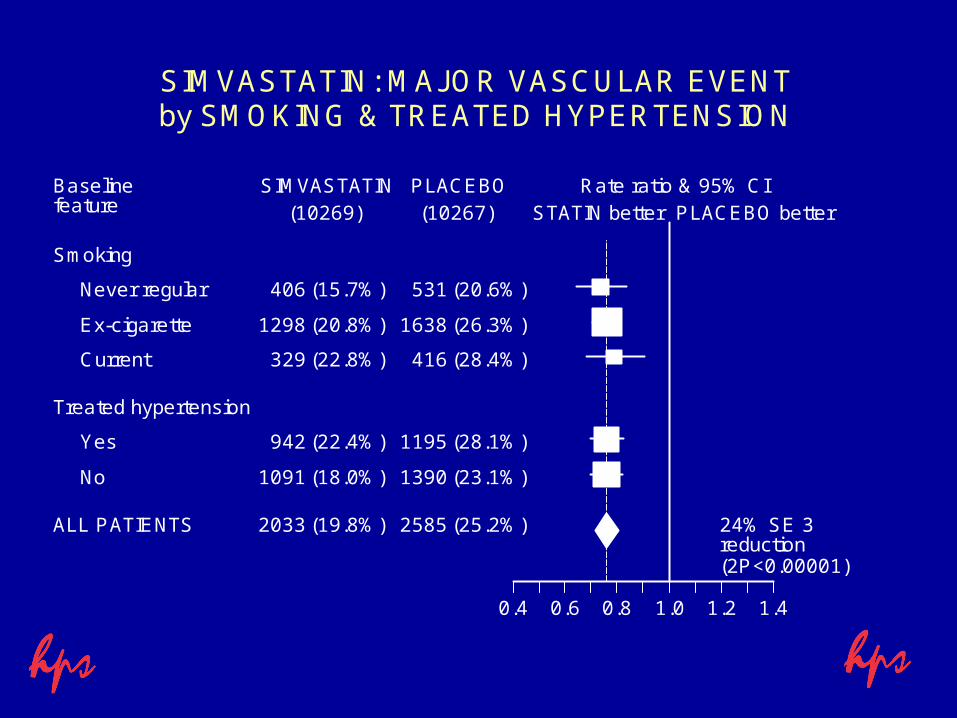
SIMVASTATIN: MAJOR VASCULAR EVENTby SMOKING & TREATED HYPERTENSION
(10269) (10267)SIMVASTATIN PLACEBO Rate ratio & 95% CI
STATIN better PLACEBO betterBaselinefeature
Smoking
406 531(15.7%) (20.6%)Never regular
1298 1638(20.8%) (26.3%)Ex-cigarette
329 416(22.8%) (28.4%)Current
Treated hypertension
942 1195(22.4%) (28.1%)Yes
1091 1390(18.0%) (23.1%)No
24% SE 3reduction(2P<0.00001)
2033 2585(19.8%) (25.2%)ALL PATIENTS
0.4 0.6 0.8 1.0 1.2 1.4
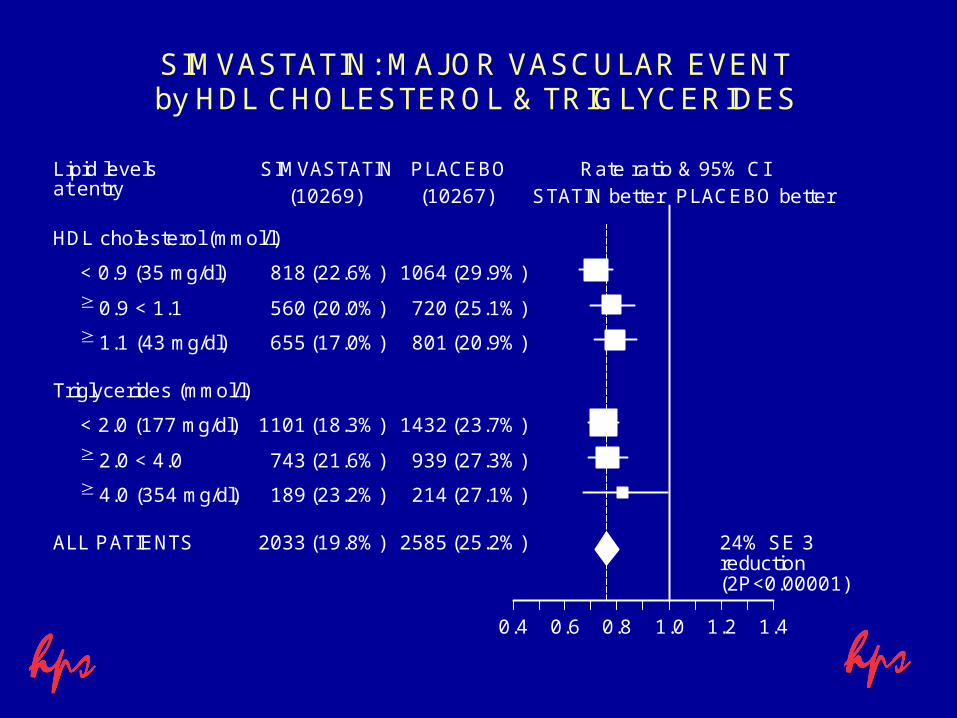
SIMVASTATIN: MAJOR VASCULAR EVENTby HDL CHOLESTEROL & TRIGLYCERIDES
(10269) (10267)SIMVASTATIN PLACEBO Rate ratio & 95% CI
STATIN better PLACEBO betterLipid levelsat entry
HDL cholesterol (mmol/l)
818 1064(22.6%) (29.9%)< 0.9 (35 mg/dl)
560 720(20.0%) (25.1%) 0.9 < 1.1
655 801(17.0%) (20.9%) 1.1 (43 mg/dl)
Triglycerides (mmol/l)
1101 1432(18.3%) (23.7%)< 2.0 (177 mg/dl)
743 939(21.6%) (27.3%) 2.0 < 4.0
189 214(23.2%) (27.1%) 4.0 (354 mg/dl)
24% SE 3reduction(2P<0.00001)
2033 2585(19.8%) (25.2%)ALL PATIENTS
0.4 0.6 0.8 1.0 1.2 1.4
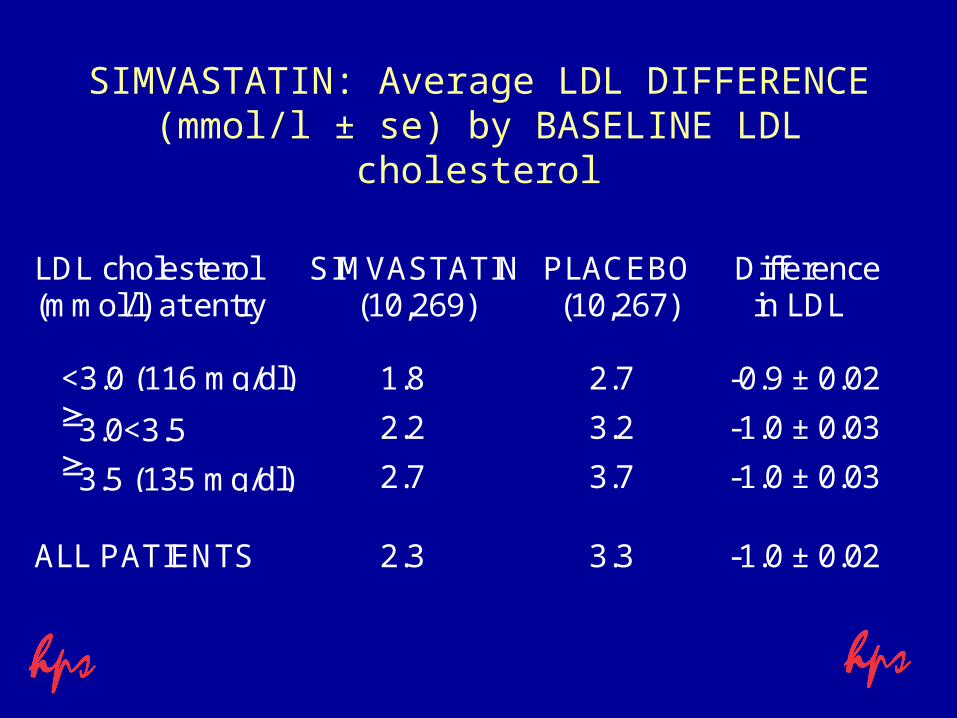
SIMVASTATIN: Average LDL DIFFERENCE(mmol/l ± se) by BASELINE LDL cholesterol
LDL cholesterol(mmol/l) at entry
SIMVASTATIN(10,269)
PLACEBO(10,267)
Difference in LDL
<3.0 (116 mg/dl) 1.8 2.7 -0.9 ± 0.023.0<3.5 2.2 3.2 -1.0 ± 0.033.5 (135 mg/dl) 2.7 3.7 -1.0 ± 0.03
ALL PATIENTS 2.3 3.3 -1.0 ± 0.02
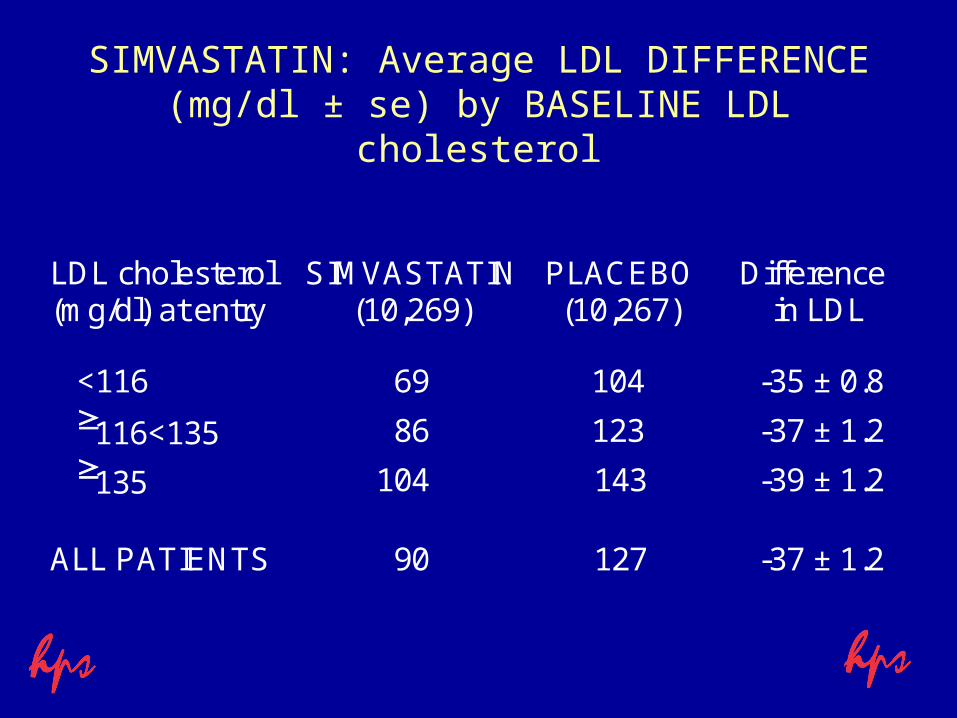
SIMVASTATIN: Average LDL DIFFERENCE (mg/dl ± se) by BASELINE LDL cholesterol
LDL cholesterol(mg/dl) at entry
SIMVASTATIN(10,269)
PLACEBO(10,267)
Difference in LDL
<116 69 104 -35 ± 0.8116<135 86 123 -37 ± 1.2135 104 143 -39 ± 1.2
ALL PATIENTS 90 127 -37 ± 1.2
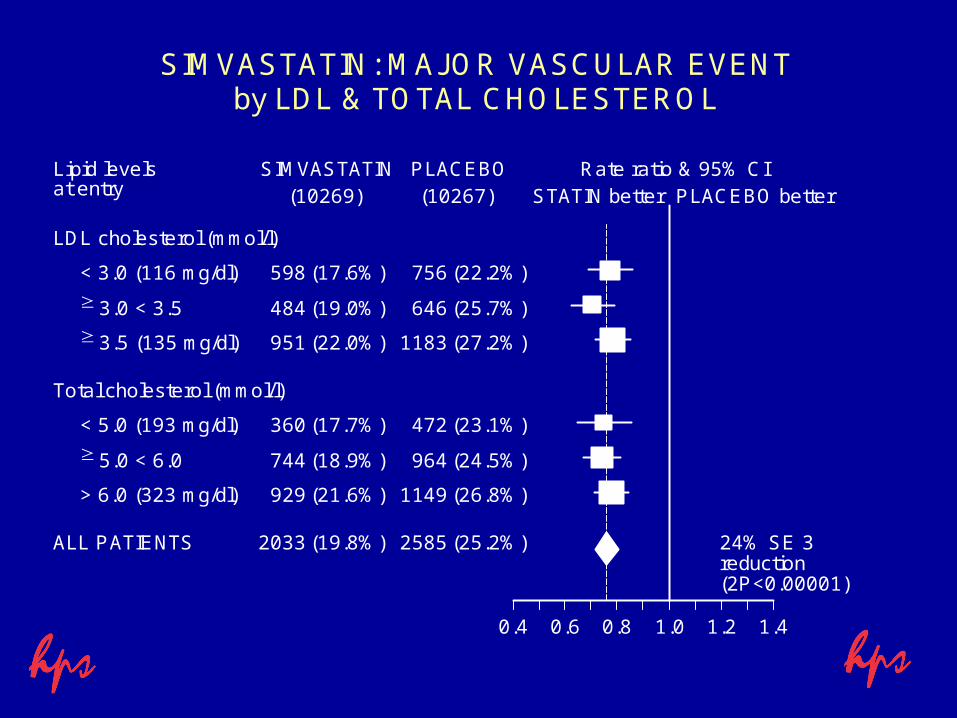
SIMVASTATIN: MAJOR VASCULAR EVENTby LDL & TOTAL CHOLESTEROL
(10269) (10267)SIMVASTATIN PLACEBO Rate ratio & 95% CI
STATIN better PLACEBO betterLipid levelsat entry
LDL cholesterol (mmol/l)
598 756(17.6%) (22.2%)< 3.0 (116 mg/dl)
484 646(19.0%) (25.7%) 3.0 < 3.5
951 1183(22.0%) (27.2%) 3.5 (135 mg/dl)
Total cholesterol (mmol/l)
360 472(17.7%) (23.1%)< 5.0 (193 mg/dl)
744 964(18.9%) (24.5%) 5.0 < 6.0
929 1149(21.6%) (26.8%)> 6.0 (323 mg/dl)
24% SE 3reduction(2P<0.00001)
2033 2585(19.8%) (25.2%)ALL PATIENTS
0.4 0.6 0.8 1.0 1.2 1.4
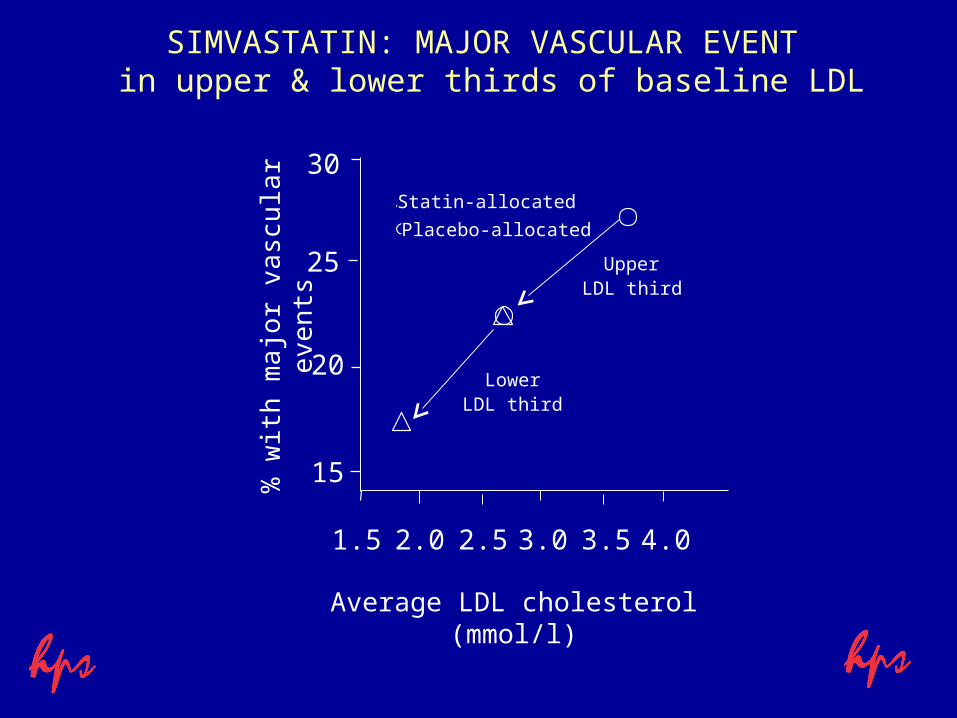
SIMVASTATIN: MAJOR VASCULAR EVENT in upper & lower thirds of baseline LDL
Average LDL cholesterol (mmol/l)
15
20
25
30
1.5 2.0 2.5 3.0 3.5 4.0
Statin-allocated
Placebo-allocated
UpperLDL third
LowerLDL third
% w
ith m
ajo
r va
scu
lar
eve
nts
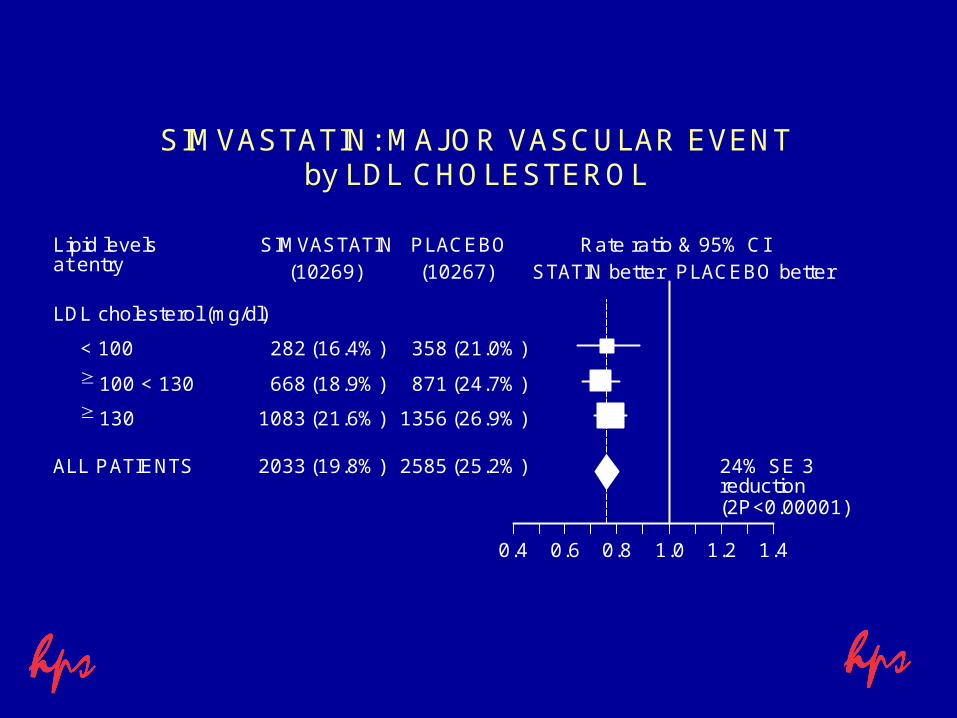
SIMVASTATIN: MAJOR VASCULAR EVENTby LDL CHOLESTEROL
(10269) (10267)SIMVASTATIN PLACEBO Rate ratio & 95% CI
STATIN better PLACEBO betterLipid levelsat entry
LDL cholesterol (mg/dl)
282 358(16.4%) (21.0%)< 100
668 871(18.9%) (24.7%) 100 < 130
1083 1356(21.6%) (26.9%) 130
24% SE 3reduction(2P<0.00001)
2033 2585(19.8%) (25.2%)ALL PATIENTS
0.4 0.6 0.8 1.0 1.2 1.4
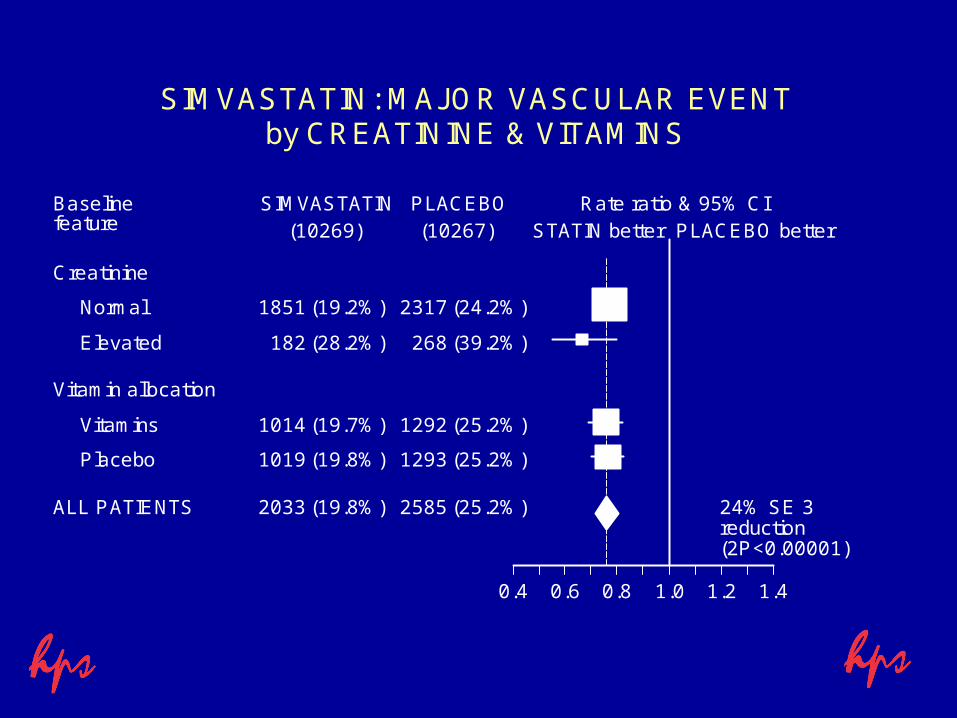
SIMVASTATIN: MAJOR VASCULAR EVENTby CREATININE & VITAMINS
(10269) (10267)SIMVASTATIN PLACEBO Rate ratio & 95% CI
STATIN better PLACEBO betterBaselinefeature
Creatinine
1851 2317(19.2%) (24.2%)Normal
182 268(28.2%) (39.2%)Elevated
Vitamin allocation
1014 1292(19.7%) (25.2%)Vitamins
1019 1293(19.8%) (25.2%)Placebo
24% SE 3reduction(2P<0.00001)
2033 2585(19.8%) (25.2%)ALL PATIENTS
0.4 0.6 0.8 1.0 1.2 1.4
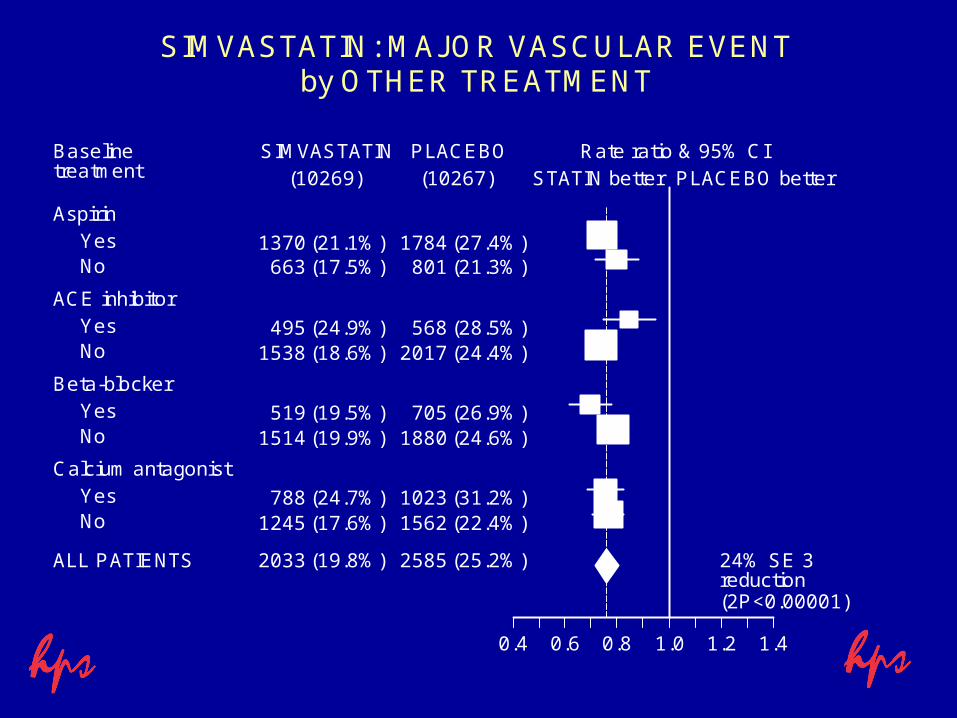
SIMVASTATIN: MAJOR VASCULAR EVENTby OTHER TREATMENT
(10269) (10267)SIMVASTATIN PLACEBO Rate ratio & 95% CI
STATIN better PLACEBO betterBaselinetreatment
Aspirin
1370 1784(21.1%) (27.4%)Yes663 801(17.5%) (21.3%)No
ACE inhibitor
495 568(24.9%) (28.5%)Yes1538 2017(18.6%) (24.4%)No
Beta-blocker
519 705(19.5%) (26.9%)Yes1514 1880(19.9%) (24.6%)No
Calcium antagonist
788 1023(24.7%) (31.2%)Yes1245 1562(17.6%) (22.4%)No
24% SE 3reduction(2P<0.00001)
2033 2585(19.8%) (25.2%)ALL PATIENTS
0.4 0.6 0.8 1.0 1.2 1.4
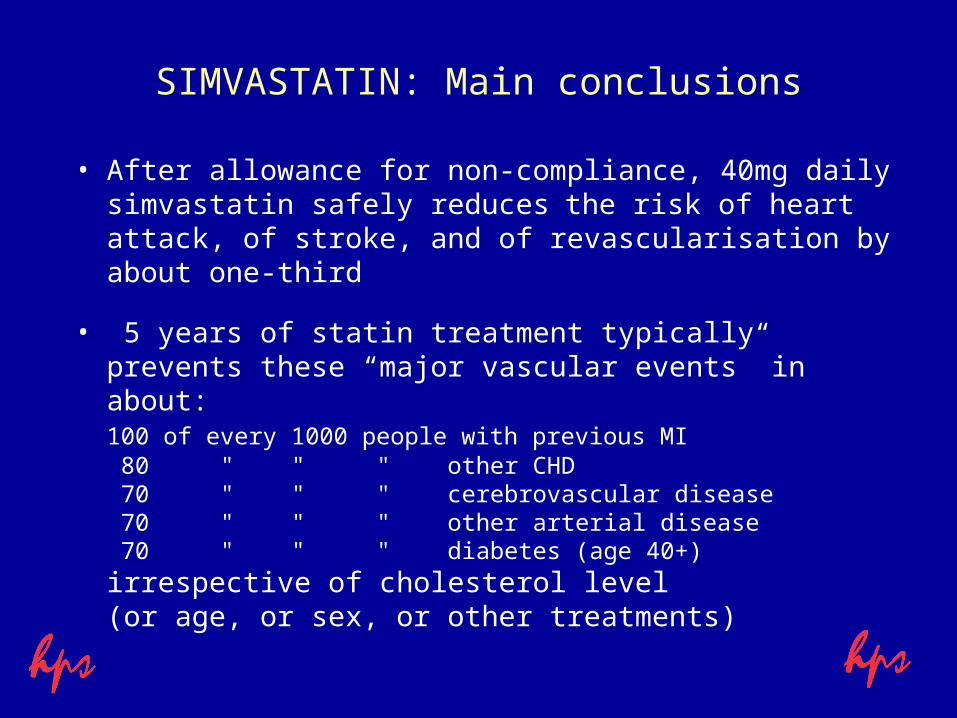
SIMVASTATIN: Main conclusions
• After allowance for non-compliance, 40mg daily simvastatin safely reduces the risk of heart attack, of stroke, and of revascularisation by about one-third
• 5 years of statin treatment typically prevents these “major vascular events” in about:
100 of every 1000 people with previous MI 80 " " " other CHD 70 " " " cerebrovascular disease 70 " " " other arterial disease 70 " " " diabetes (age 40+)
irrespective of cholesterol level (or age, or sex, or other treatments)
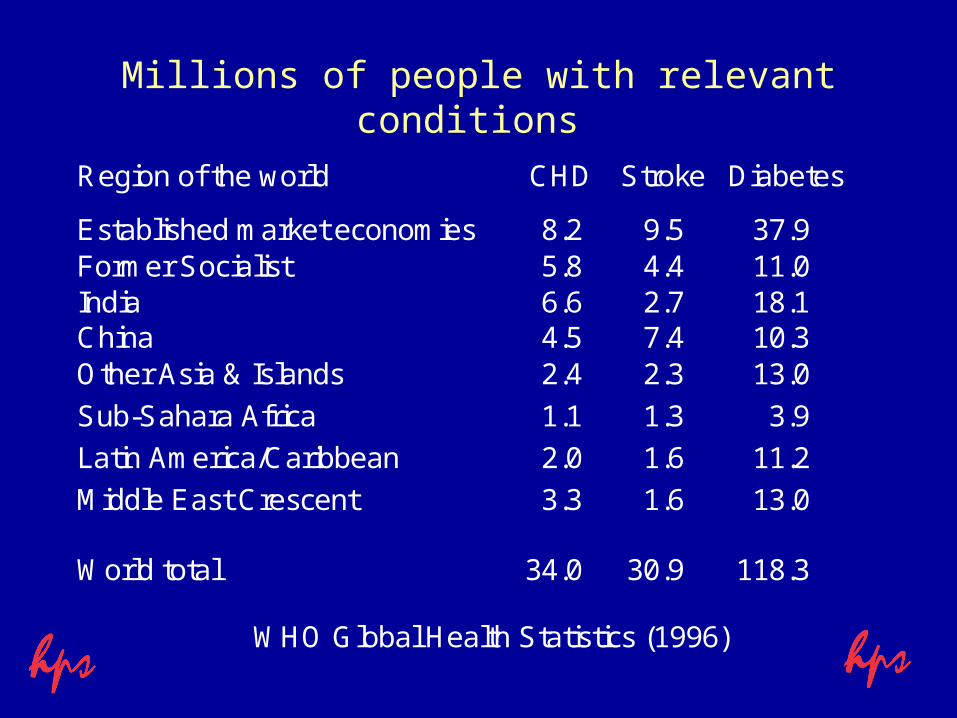
Millions of people with relevant conditions
Region of the world CHD Stroke Diabetes
Established market economies 8.2 9.5 37.9Former Socialist 5.8 4.4 11.0India 6.6 2.7 18.1China 4.5 7.4 10.3Other Asia & Islands 2.4 2.3 13.0
Sub-Sahara Africa 1.1 1.3 3.9
Latin America/Caribbean 2.0 1.6 11.2
Middle East Crescent 3.3 1.6 13.0
World total 34.0 30.9 118.3
WHO Global Health Statistics (1996)

Recommended