Emad Abbasi, Javad Abbasian and Hamid Arastoopour

Motivation and Background
Objective, Scope and Timeline
Completed Work and Results
Future Work
Questions?
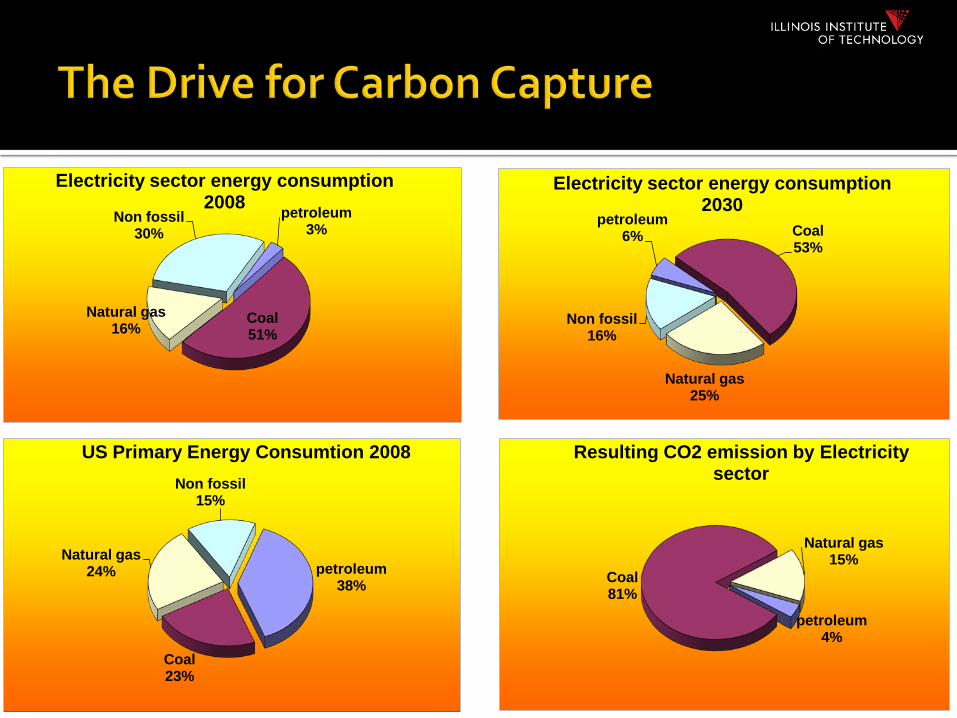
petroleum 3%
Coal 51%
Natural gas 16%
Non fossil 30%
Electricity sector energy consumption 2008
petroleum 6% Coal
53%
Natural gas 25%
Non fossil 16%
Electricity sector energy consumption 2030
petroleum 38%
Coal 23%
Natural gas 24%
Non fossil 15%
US Primary Energy Consumtion 2008
petroleum 4%
Coal 81%
Natural gas 15%
Resulting CO2 emission by Electricity sector

WGS Reaction
CO2 Removal
Fuel Gas
CO2
Conventional
WGS Reaction &
CO2 Removal
Fuel Gas
CO2
T: 350°-500°C P: 10-70 bar
Integrated
Concentrated Hydrogen Stream
Hydrogen Polishing
Fuel Cells, Transportation
Impurities
Chemical Syn./ Liquid Fuels
Concentrated Hydrogen Stream
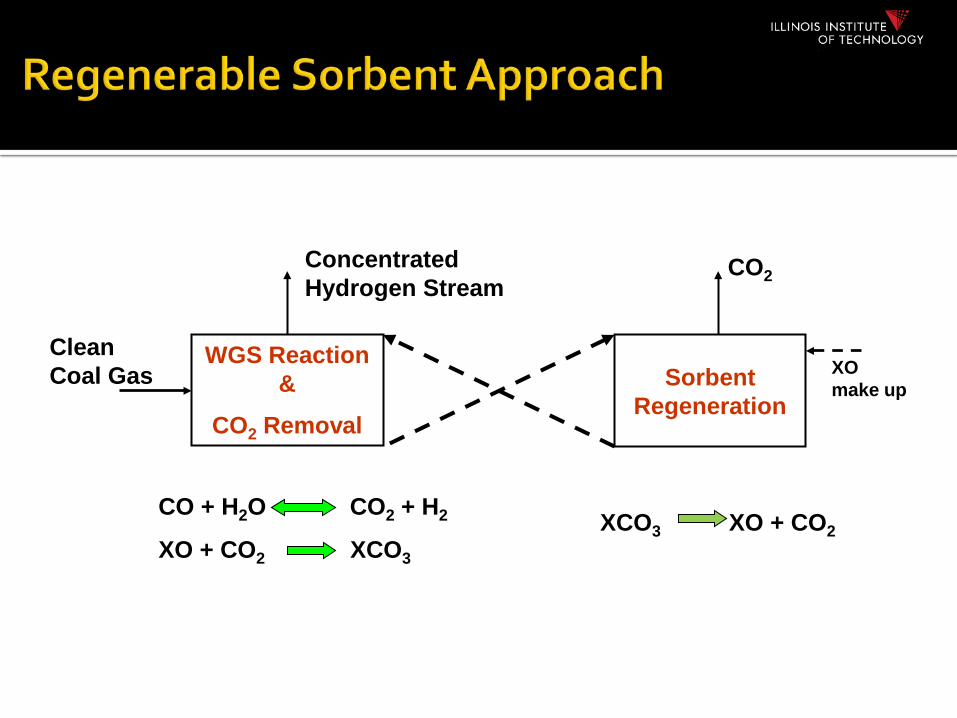
WGS Reaction &
CO2 Removal
CO + H2O CO2 + H2
XO + CO2 XCO3
Clean Coal Gas
Concentrated Hydrogen Stream
Sorbent Regeneration
XCO3 XO + CO2
CO2
XO make up

0.01
0.1
1
10
100
250 300 350 400 450 500Temp, C
P CO
2, at
m
AbsorptionMgO+CO2 MgCO3
DecompositionMgCO3 MgO+CO2
°
Advanced Power Plant
The overall objective of this project is to develop a CFD model and to perform Computational Fluid Dynamic (CFD) simulations using Population Balance Equations (PBE) to describe the heterogeneous gas-solid absorption/regeneration and water-gas-shift (WGS) reactions in the context of multiphase CFD for a regenerative magnesium oxide-based (MgO-based) process for simultaneous removal of CO2 and enhancement of H2 production in coal gasification processes.
The Project consists of the following four (4) tasks: Task1. Development of a CFD/PBE model accounting for the particle
(sorbent) porosity distribution and of a numerical technique to solve the CFD/PBE model.
Task2. Determination of the key parameters of the absorption and regeneration and WGS reactions.
Task3. CFD simulations of the regenerative carbon dioxide removal
process. Task4. Development of preliminary base case design for scale up
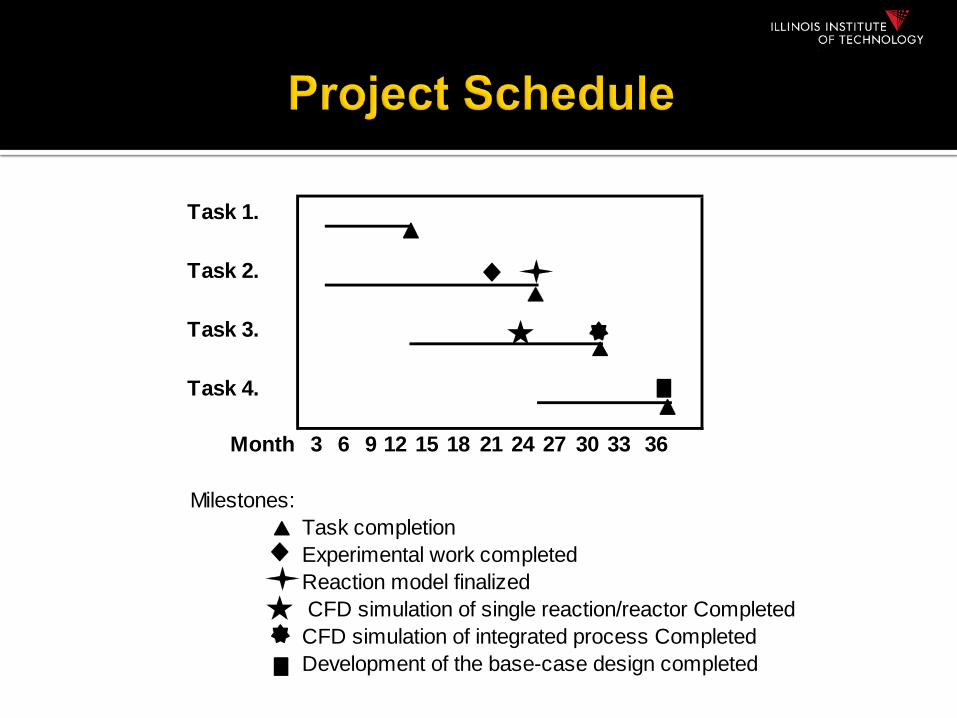
Task 1.
Task 2.
Task 3.
Task 4.
Month 3 6 9 12 15 18 21 24 27 30 33 36
Milestones:Task completionExperimental work completedReaction model finalized CFD simulation of single reaction/reactor CompletedCFD simulation of integrated process CompletedDevelopment of the base-case design completed

Carbonation:
CO2 + H2O+ K2CO3 → 2KHCO3 + Heat
Regeneration:
2KHCO3 → CO2 + H2O+ K2CO3 - Heat
-------------------------------------------------------------------------------------------------------------------------------------------------------------- Yi et al., International journal of greenhouse gas control, 2007.
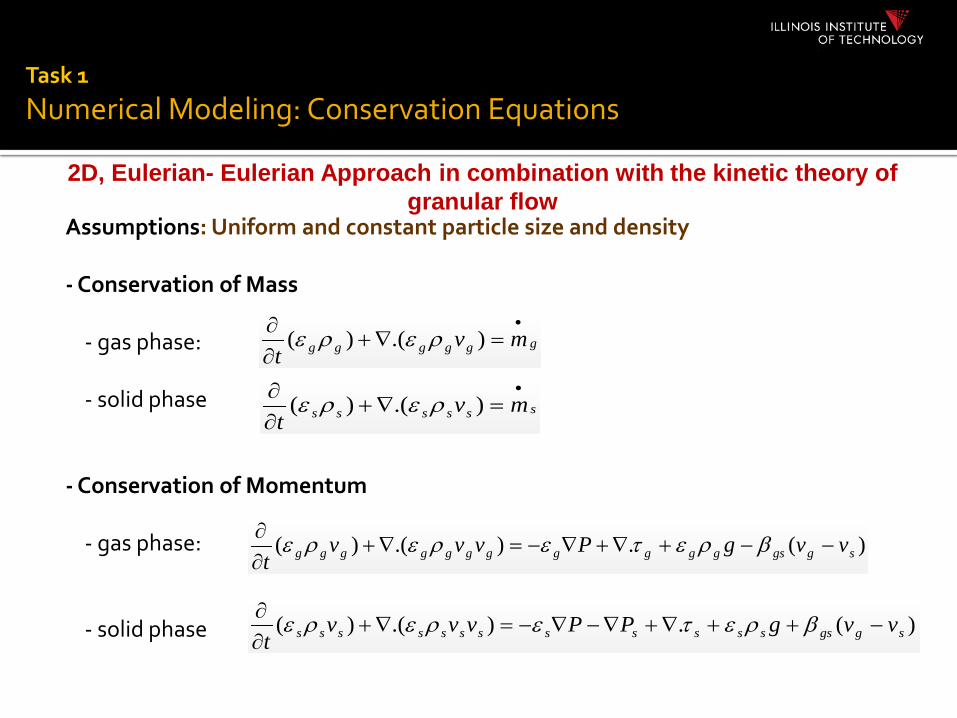
2D, Eulerian- Eulerian Approach in combination with the kinetic theory of granular flow
Assumptions: Uniform and constant particle size and density - Conservation of Mass - gas phase: - solid phase - Conservation of Momentum - gas phase: - solid phase
gggggg mvt
•
=∇+∂∂ ).()( ρερε
ssssss mvt
•
=∇+∂∂ ).()( ρερε
)(.).()( sggsggggggggggg vvgPvvvt
−−+∇+∇−=∇+∂∂ βρετερερε
)(.).()( sggsssssssssssss vvgPPvvvt
−++∇+∇−∇−=∇+∂∂ βρετερερε
Task 1
Numerical Modeling: Conservation Equations
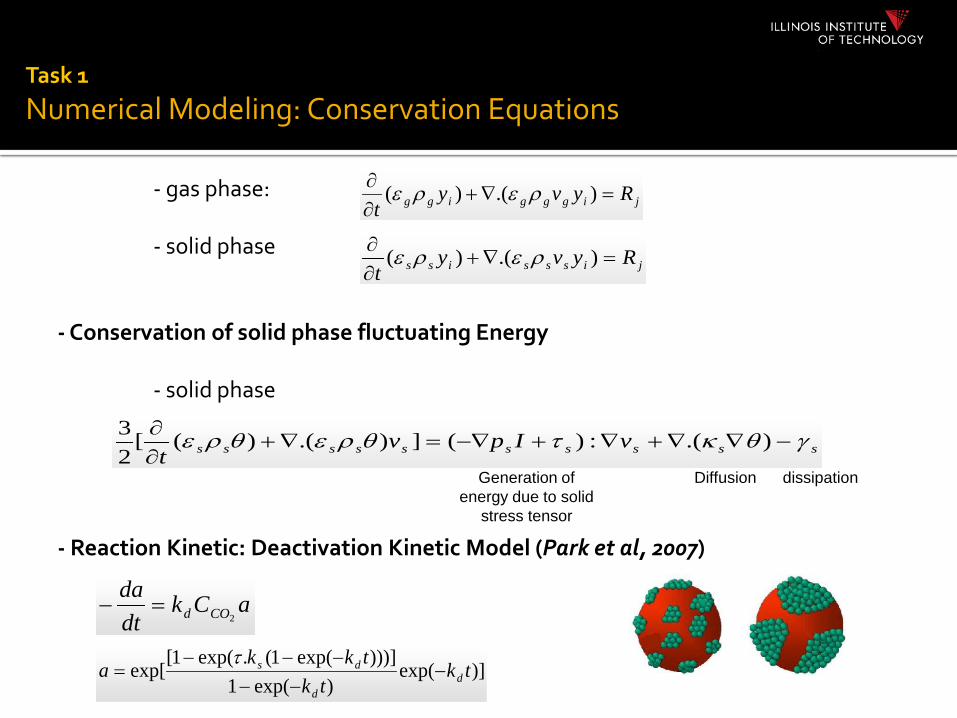
- Conservation of Species - gas phase: - solid phase - Conservation of solid phase fluctuating Energy - solid phase
- Reaction Kinetic: Deactivation Kinetic Model (Park et al, 2007)
jisssiss Ryvyt
=∇+∂∂ ).()( ρερε
Generation of energy due to solid
stress tensor
Diffusion dissipation
ssssssssss vIpvt
γθκτθρεθρε −∇∇+∇+−∇=∇+∂∂ ).(:)(]).()([
23
jigggigg Ryvyt
=∇+∂∂ ).()( ρερε
)]exp()exp(1
)))]exp(1(.exp(1[exp[ tk
tktkk
a dd
ds −−−
−−−=
τ
aCkdtda
COd 2=−
Task 1
Numerical Modeling: Conservation Equations
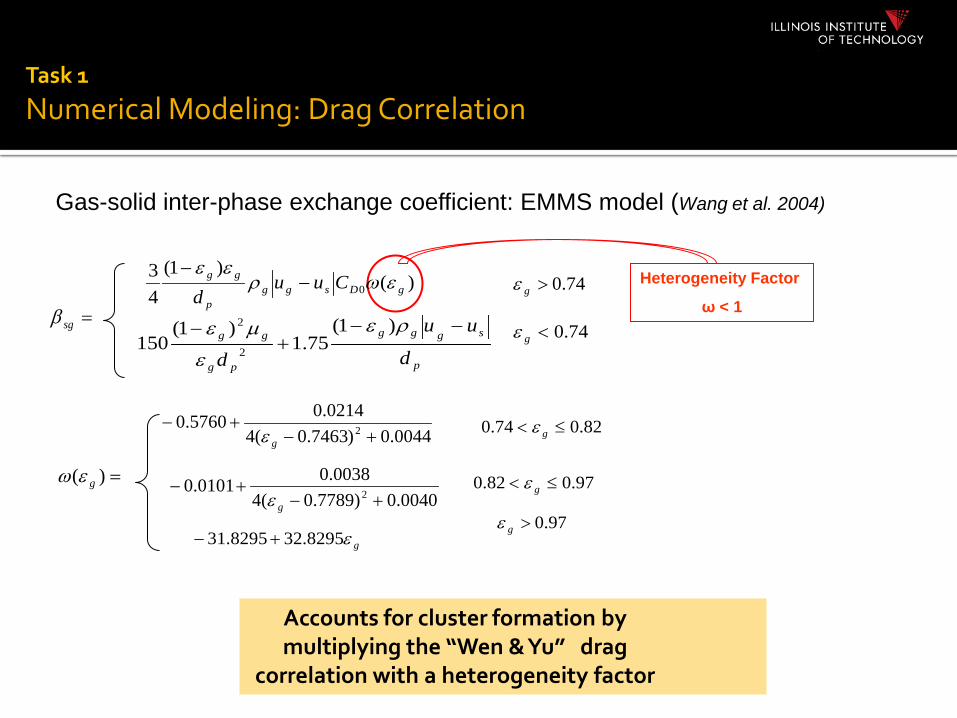
Gas-solid inter-phase exchange coefficient: EMMS model (Wang et al. 2004)
Accounts for cluster formation by multiplying the “Wen & Yu” drag
correlation with a heterogeneity factor
Heterogeneity Factor
ω < 1 =sgβ
)()1(
43
0 gDsggp
gg Cuud
εωρεε
−−
p
sggg
pg
gg
d
uu
d
−−+
− ρε
ε
µε )1(75.1
)1(150 2
2
74.0>gε
74.0<gε
=)( gεω
0044.0)7463.0(40214.05760.0 2 +−
+−gε
0040.0)7789.0(40038.00101.0 2 +−
+−gε
gε8295.328295.31 +−
82.074.0 ≤< gε
97.082.0 ≤< gε
97.0>gε
Task 1
Numerical Modeling: Drag Correlation
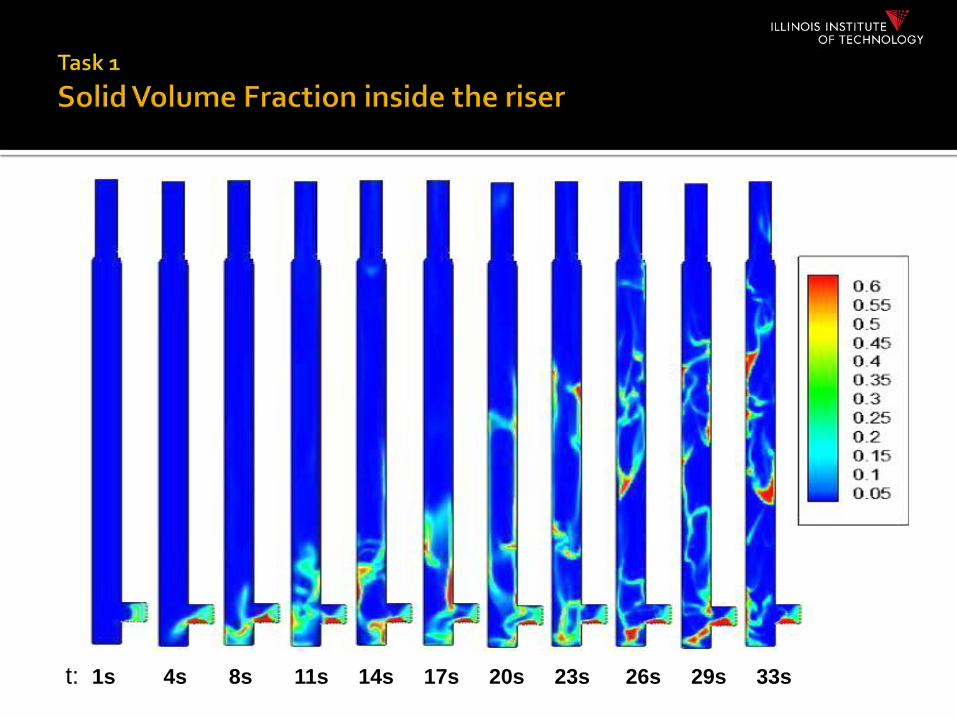
t: 1s 4s 8s 11s 14s 17s 20s 23s 26s 29s 33s
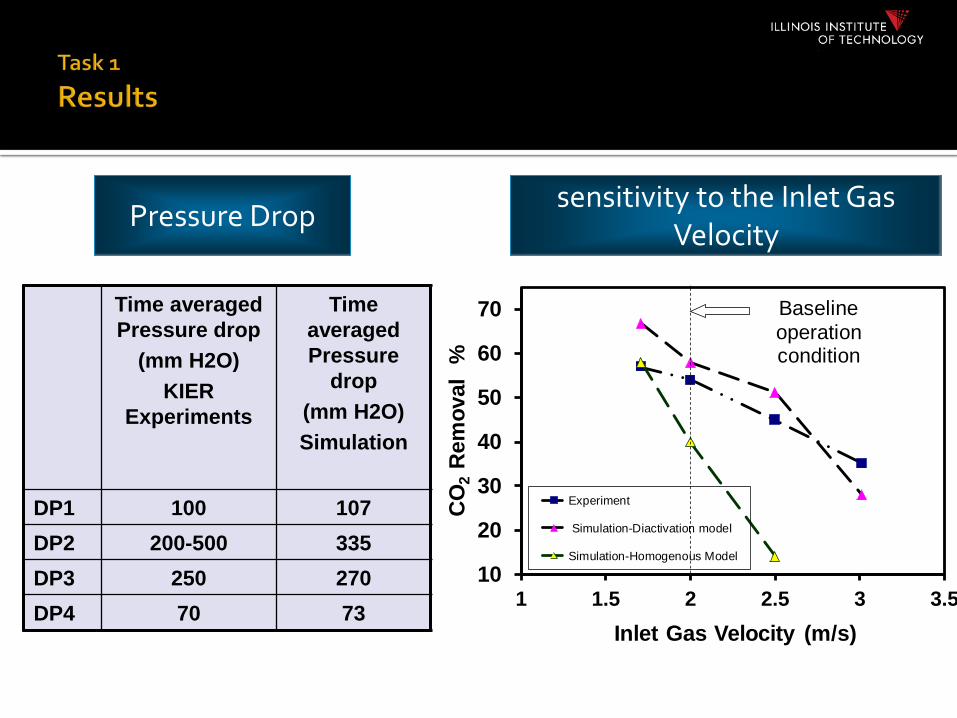
Time averaged Pressure drop
(mm H2O) KIER
Experiments
Time averaged Pressure
drop (mm H2O) Simulation
DP1 100 107 DP2 200-500 335 DP3 250 270 DP4 70 73
Pressure Drop
10
20
30
40
50
60
70
1 1.5 2 2.5 3 3.5
CO
2R
emov
al %
Inlet Gas Velocity (m/s)
Experiment
Simulation-Diactivation model
Simulation-Homogenous Model
Baseline operation condition
sensitivity to the Inlet Gas Velocity
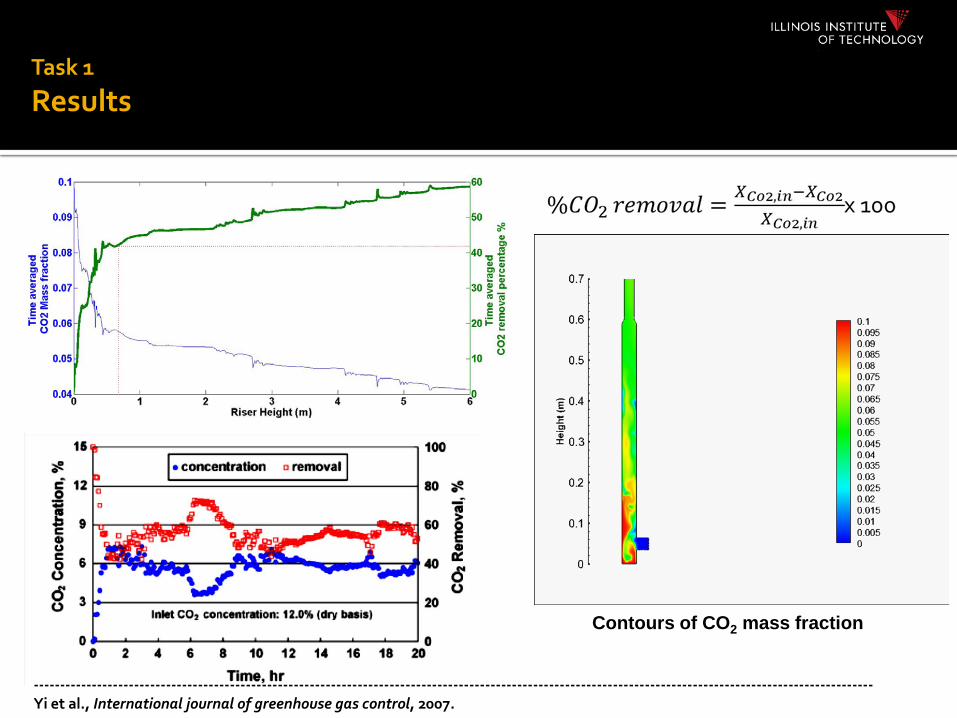
Contours of CO2 mass fraction
Task 1
Results
-------------------------------------------------------------------------------------------------------------------------------------------------------------- Yi et al., International journal of greenhouse gas control, 2007.
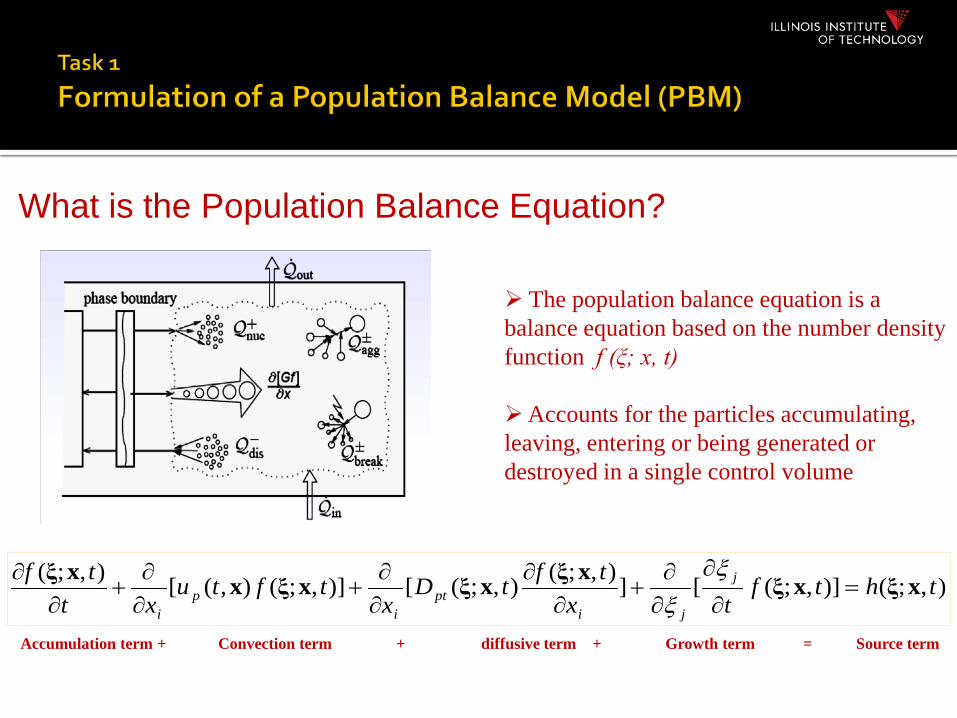
What is the Population Balance Equation?
The population balance equation is a balance equation based on the number density function f (ξ; x, t)
Accounts for the particles accumulating, leaving, entering or being generated or destroyed in a single control volume
),;()],;([]),;(),;([)],;(),([),;( thtftx
tftDx
tftuxt
tf j
jipt
ip
i
xξxξxξxξxξxxξ=
∂
∂
∂∂
+∂
∂∂∂
+∂∂
+∂
∂ ξξ
Accumulation term + Convection term + diffusive term + Growth term = Source term
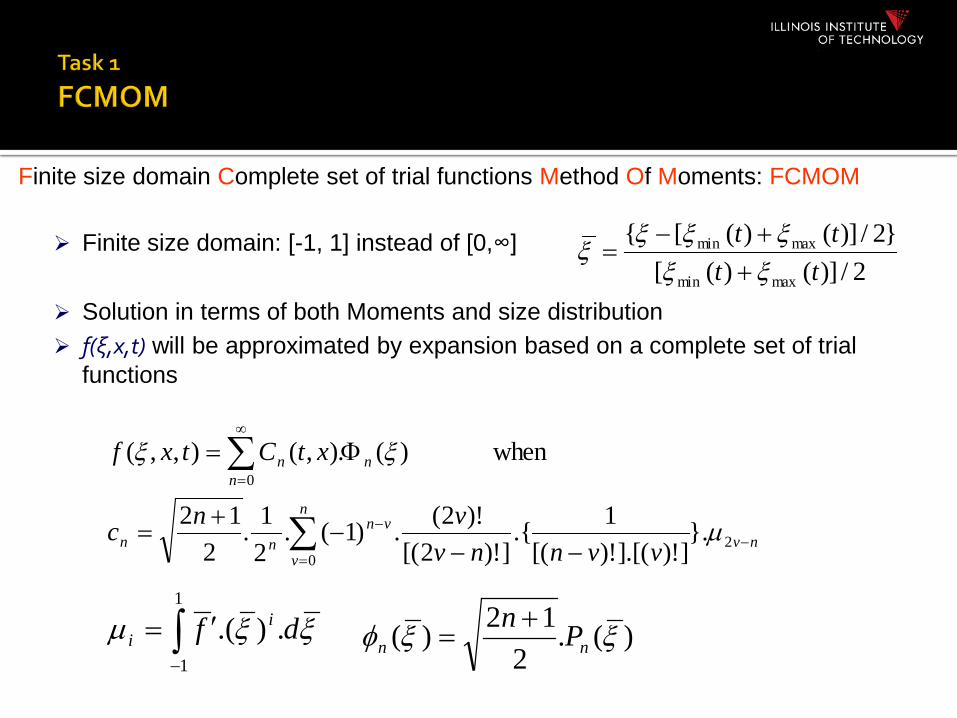
Finite size domain Complete set of trial functions Method Of Moments: FCMOM Finite size domain: [-1, 1] instead of [0,∞]
Solution in terms of both Moments and size distribution f(ξ,x,t) will be approximated by expansion based on a complete set of trial
functions
∑
∑
=−
−
∞
=
−−−
+=
Φ=
n
vnv
vnnn
nn
n
vvnnvvnc
xtCtxf
02
0
}.])!].[()![(
1.{])!2[(
)!2(.)1(.21.
212
when )().,(),,(
µ
ξξ
ξξµ df ii .).(
1
1∫−
′= )(.2
12)( ξξφ nn Pn +=
2/)]()([}2/)]()([{
maxmin
maxmin
tttt
ξξξξξ
ξ++−
=
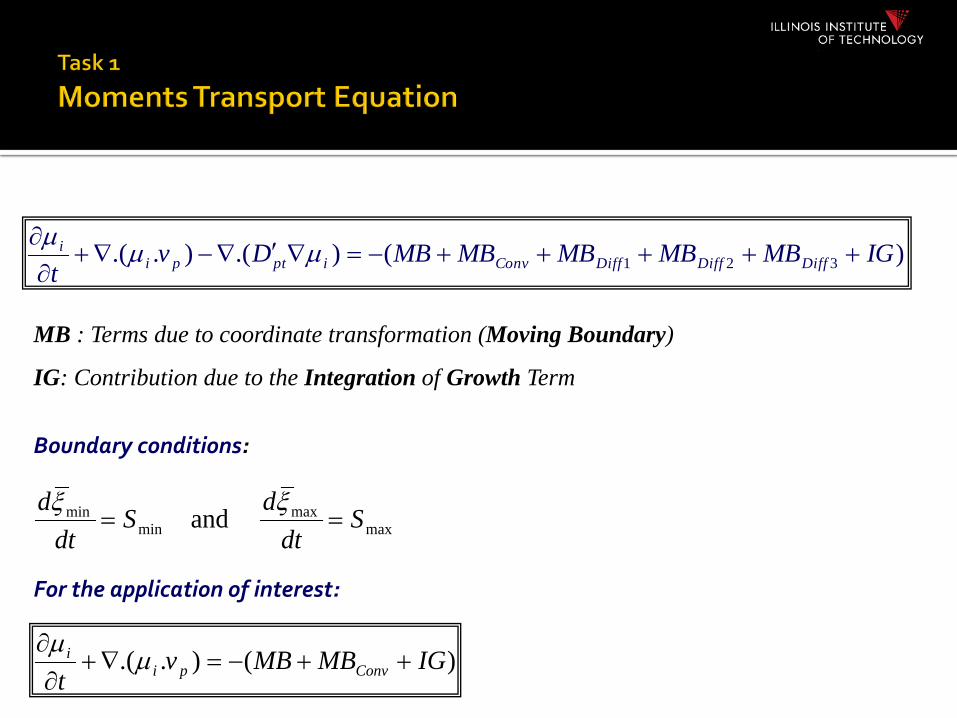
)().()..( 321 IGMBMBMBMBMBDvt DiffDiffDiffConviptpi
i +++++−=∇′∇−∇+∂∂
µµµ
MB : Terms due to coordinate transformation (Moving Boundary)
IG: Contribution due to the Integration of Growth Term
maxmax
minmin and S
dtd
Sdt
d==
ξξ
Boundary conditions:
)()..( IGMBMBvt Convpi
i ++−=∇+∂∂
µµ
For the application of interest:
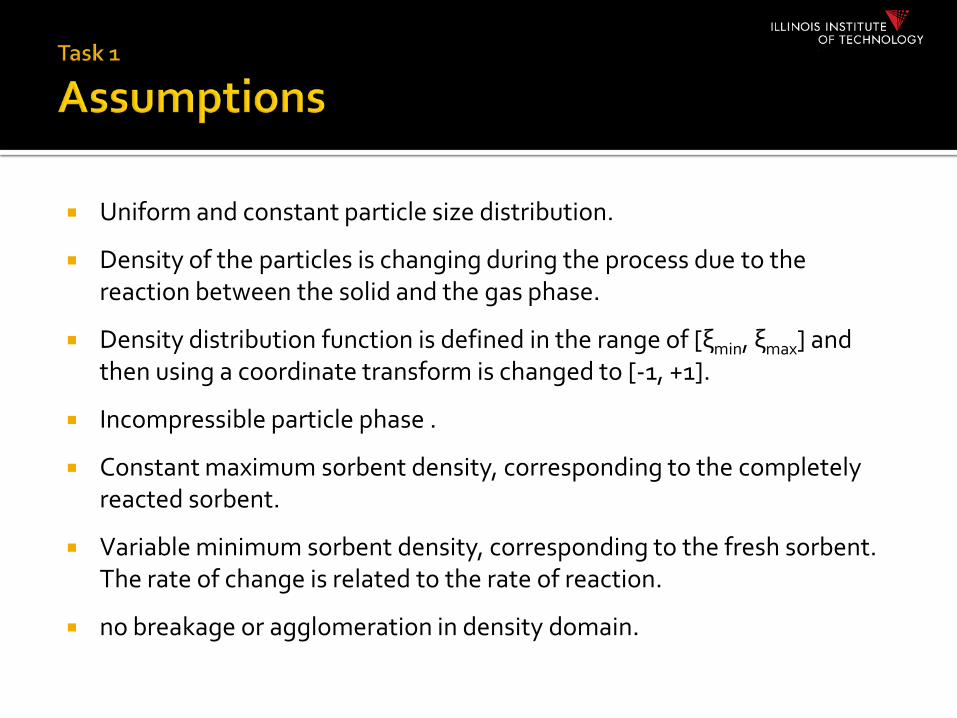
Uniform and constant particle size distribution.
Density of the particles is changing during the process due to the reaction between the solid and the gas phase.
Density distribution function is defined in the range of [ξmin, ξmax] and then using a coordinate transform is changed to [-1, +1].
Incompressible particle phase .
Constant maximum sorbent density, corresponding to the completely reacted sorbent.
Variable minimum sorbent density, corresponding to the fresh sorbent. The rate of change is related to the rate of reaction.
no breakage or agglomeration in density domain.

Implementation in Ansys Fluent via UDS is
is
iss
ispss
isss SDv
t φφεφρεφρε
=∇−∇+∂
∂).(
s
iis ε
µφ =
)()..( IGMBMBvt Convpi
i ++−=∇+∂∂
µµ

Test case1: Linear Growth, No convection
Kt i
i .µµ
=∂∂
Case study for k=0.05 and t=10 sec
1− 0.5− 0 0.5 15−
0
5
10
15
Particle Property (Dimensionless)
Num
ber d
ensit
y fu
nctio
n (D
imen
sionl
ess) 11.333
0.011−
I ξ( )
A ξ( )
f10 ξ( )
11− ξ1− 0.5− 0 0.5 1
5−
0
5
10
15
Particle Property (Dimensionless)
Num
ber d
ensit
y fu
nctio
n (D
imen
sionl
ess) 11.33
3.345−
I ξ( )
A ξ( )
f6 ξ( )
11− ξ
6 moments 10 moments

CFD
Two Fluid Model
Phase velocity, Volume Fraction
Mean Solid Density
UDS Source terms Moments of Density Distribution
Population Balance Model
Reaction

Assumption: Moments are convected with mixture velocity
Kvt p =∇+∂
∂ . minmin ξ
ξ
).()(
}.).1(].)1({[
).()(
}..].)1({[
).()(
1}.).1(].)1({[
).()(
1}..].)1({[ ][
min
minmax
,1
11
min
minmax
,111
min
minmax1
11
min
minmax111,
j
jpi
i
j
jpi
i
ii
ii
ijpj
i
xv
iff
xv
iff
dtdiff
dtdiffv
xt
∂∂
−−
+−′−−′
−∂∂
−−′−−′
−−−
+−′−−′
−−
−′−−′−=∂∂
+∂∂
−+
+
−−+
−+
+
−−+
ξξξ
µ
ξξξ
µ
ξξξ
µ
ξξξ
µµµ
2
)())(( maxminminmax0
1 ξξξξµµ
ρ++−
=s
vg= vs= 1 m/s
εs = 0.2
f2 f
f1
1m

1st Moment 2nd Moment
1− 0.5− 0 0.5 1
0
5
10
15
Particle Property (Dimensionless)
Num
ber d
ensit
y fu
nctio
n (D
imen
sionl
ess)
I ξ( )
f ξ( )
f1 ξ( )
f2 ξ( )
ξ
t = 10s
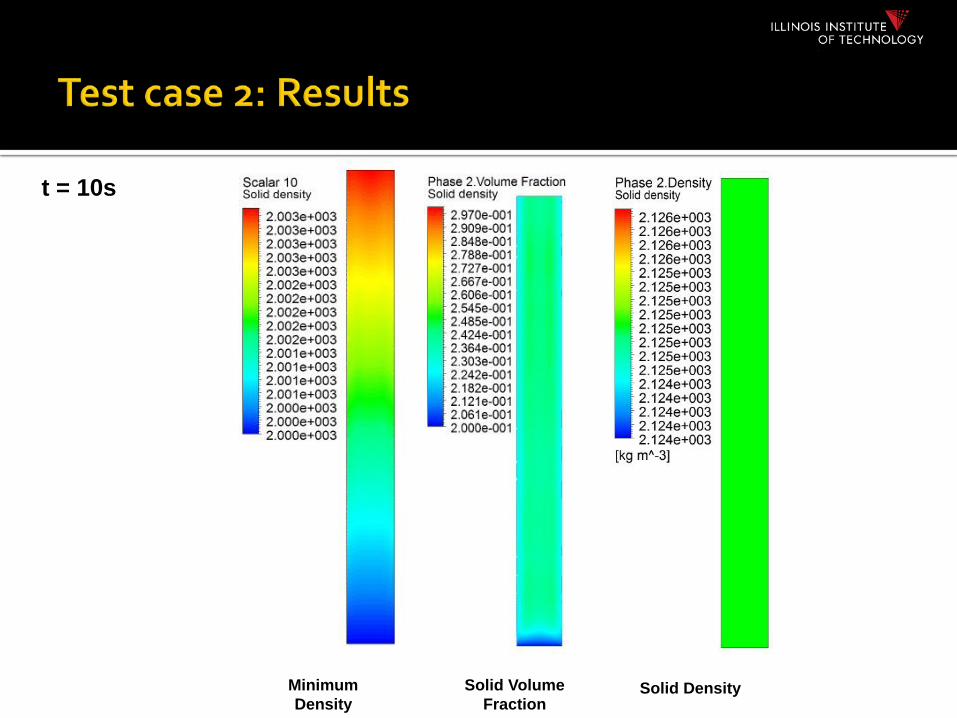
t = 10s
Minimum Density
Solid Volume Fraction
Solid Density
* A. Hassanzadeh, 2007
0
5
10
15
20
25
30
35
40
0 5 10 15 20 25 30Time, min
Con
vers
ion,
%
20 µm Scale:
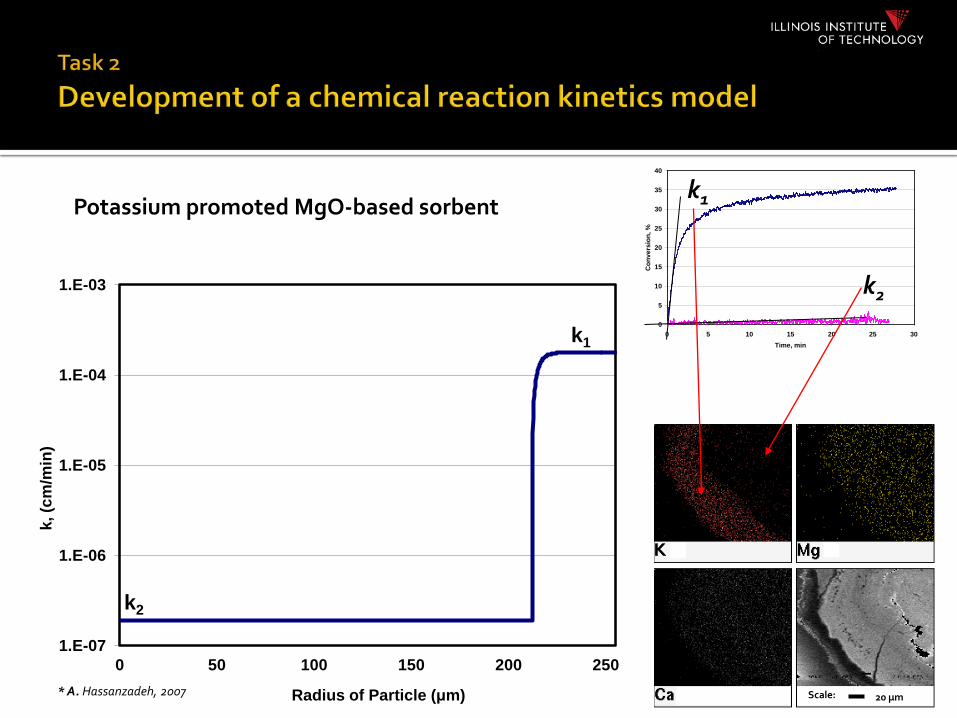
k2
k1
1.E-07
1.E-06
1.E-05
1.E-04
1.E-03
0 50 100 150 200 250
k, (c
m/m
in)
Radius of Particle (μm)
k2
k1
Potassium promoted MgO-based sorbent
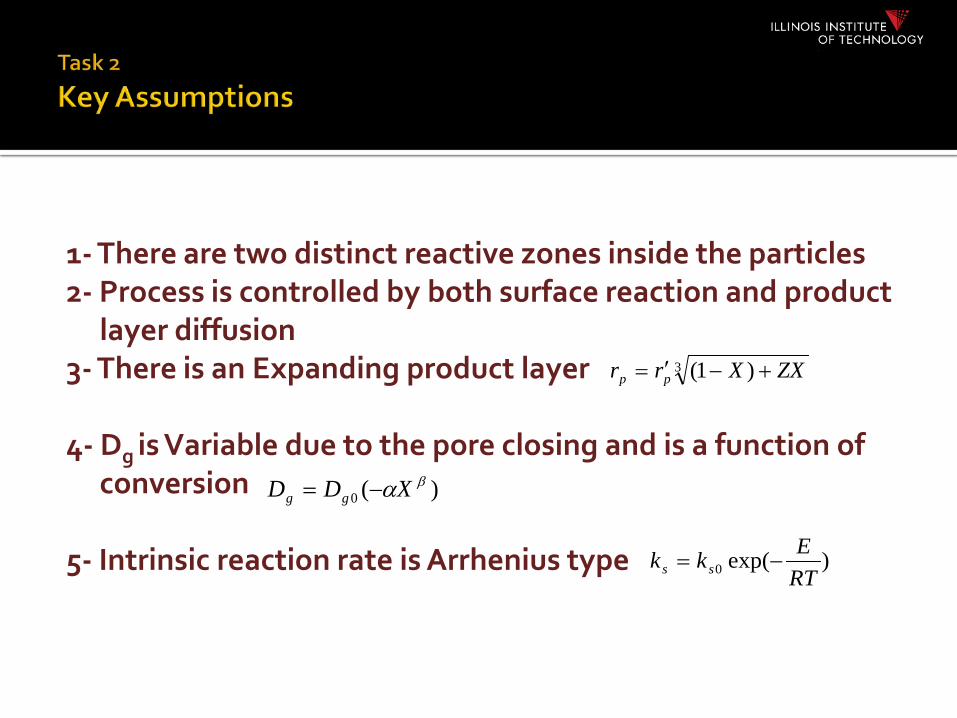
1- There are two distinct reactive zones inside the particles 2- Process is controlled by both surface reaction and product
layer diffusion 3- There is an Expanding product layer 4- Dg is Variable due to the pore closing and is a function of
conversion 5- Intrinsic reaction rate is Arrhenius type
)exp(0 RTEkk ss −=
)(0βαXDD gg −=
3 )1( ZXXrr pp +−′=
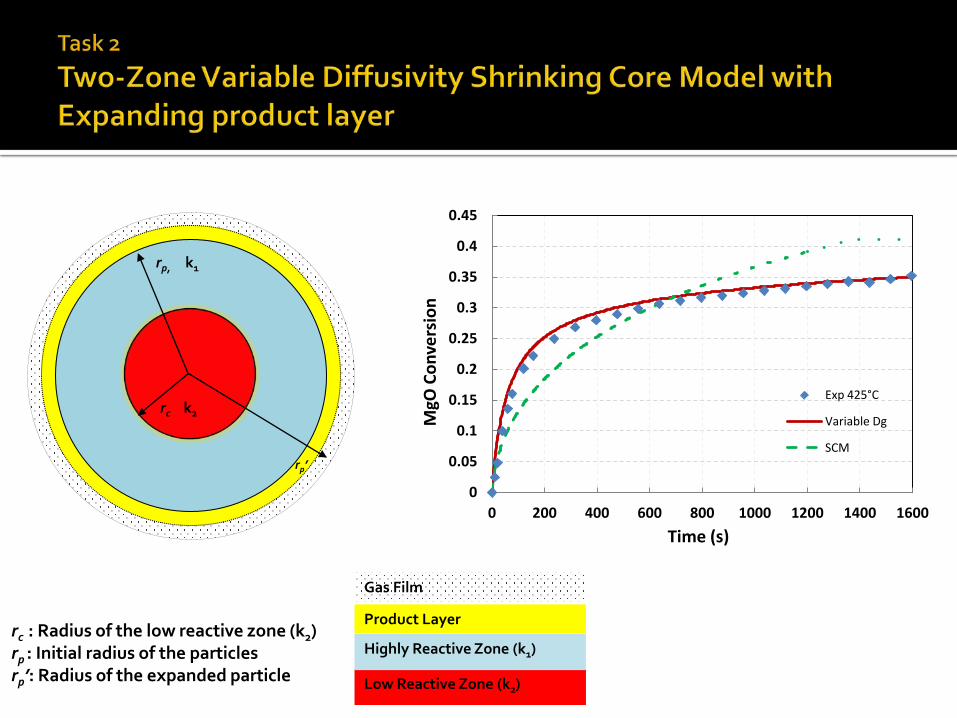
rc : Radius of the low reactive zone (k2) rp : Initial radius of the particles rp’: Radius of the expanded particle Low Reactive Zone (k2)
Highly Reactive Zone (k1)
Product Layer
Gas Film
rp, k1
rc k2
rp’
0
0.05
0.1
0.15
0.2
0.25
0.3
0.35
0.4
0.45
0 200 400 600 800 1000 1200 1400 1600
MgO
Con
vers
ion
Time (s)
Exp 425°C
Variable Dg
SCM

action
s
Layeroduct
gp
iip
gp
i
oMgOebi
kDrrrr
krr
NCCdtdr
RePrfilm
2 1)(/)(
+−
+
−=−
3 )1( ZXXrr pp +−′=
productreact
reactproduct
MM
Z⋅
⋅=ρρ
′−+
−−=
)1(1
)(
p
ii
g
s
eboMgO
si
rr
rDk
CCN
kdtdr
)
111()1(1
)1)((3
331
32
XZXXXr
Dk
XCCN
kr
dtdX
pg
s
eboMgO
s
p
+−−
−−+
−−
−=rp, k1
rc,k2
c
cs rrfork
rrforkk
<≥
=
2
1
)(0βαXDD gg −=
0
0.05
0.1
0.15
0.2
0.25
0.3
0.35
0.4
0 500 1000 1500
MgO
Con
vers
ion
Time (s)
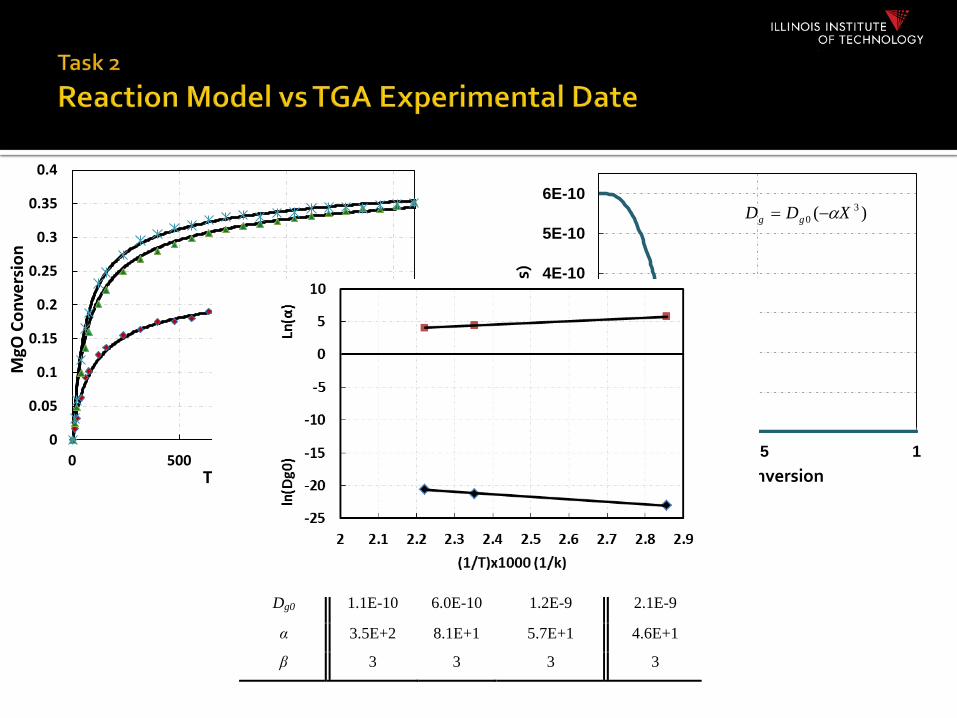
Exp 350 °C
Exp 425°C
Exp 450°C
Model
0
1E-10
2E-10
3E-10
4E-10
5E-10
6E-10
0 0.5 1
Dg
(m2/
s)
MgO Conversion
Model
Parameter
Without Steam With Steam
350 o C 425
o C 450
o C 425
o C
Dg0 1.1E-10 6.0E-10 1.2E-9 2.1E-9
α 3.5E+2 8.1E+1 5.7E+1 4.6E+1
β 3 3 3 3
)( 30 XDD gg α−=


------------------------------------------------------------------------------------------------------------------------------------------- Onischak and Gidaspow, ”Separation of Gaseous Mixtures by Regenerative sorption on Porous Solids. Part II: Regenerative separation of CO2”, Recent Developments in Separation Science, ed. N. Li, 1972
0
5
10
15
20
25
30
0 500 1000 1500 2000 2500 3000 ϕ
(t)
t(s)
Thiele Modulus in our study

45 cm
30 cm
Thermocouple
Thermocouple
8 cm
7 cm
T1
Thermowell
Bed of Sorbent
Quartz Beads
SS Annulus
SS Annulus
Frit
Reactor Body
T2
T1
T2
420
425
430
435
440
445
450
455
0 5 10 15 20 25 30 35 40 45 50Time, min
Tem
pera
ture
, C
T11T12T13T14
420 425 430 435Bed Temp., C
Posi
tion
of th
e be
d, c
m
0
8
4 8 cm
2 cm
T11
T12
T14
T13
Thermowell
420 425 430 435Bed Temp., C
Posi
tion
of th
e be
d, c
m
0
8
4 8 cm
2 cm
T11
T12
T14
T13
Thermowell
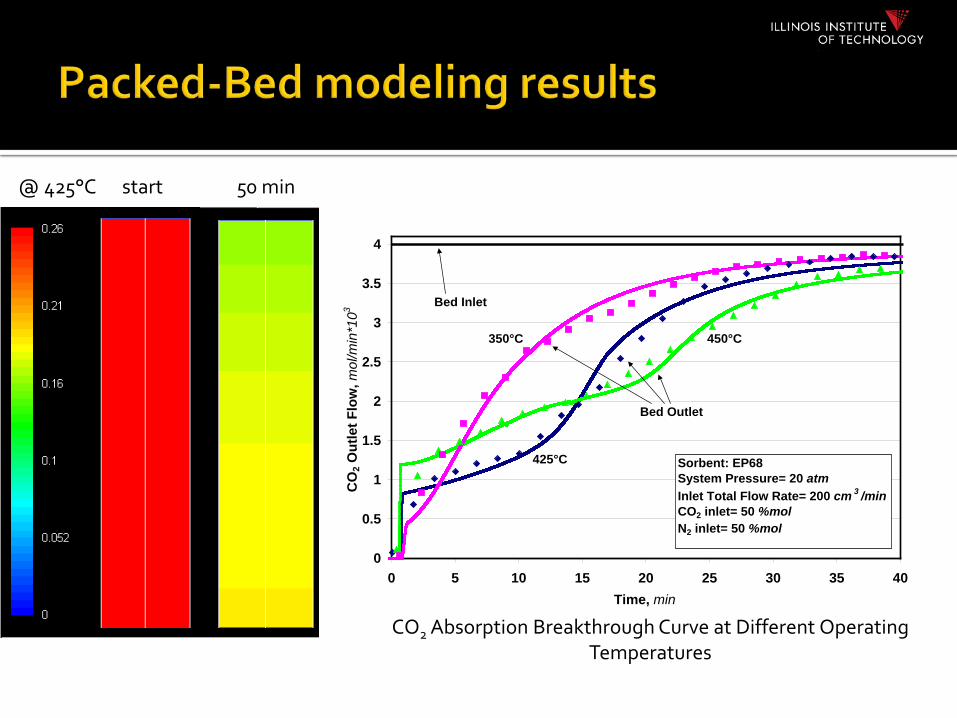
@ 425°C start 50 min
CO2 Absorption Breakthrough Curve at Different Operating Temperatures
0
0.5
1
1.5
2
2.5
3
3.5
4
0 5 10 15 20 25 30 35 40Time, min
CO
2 Out
let F
low
, mol
/min
*103
Sorbent: EP68System Pressure= 20 atmInlet Total Flow Rate= 200 cm 3 /minCO2 inlet= 50 %molN2 inlet= 50 %mol
450°C
425°C
350°C
Bed Inlet
Bed Outlet
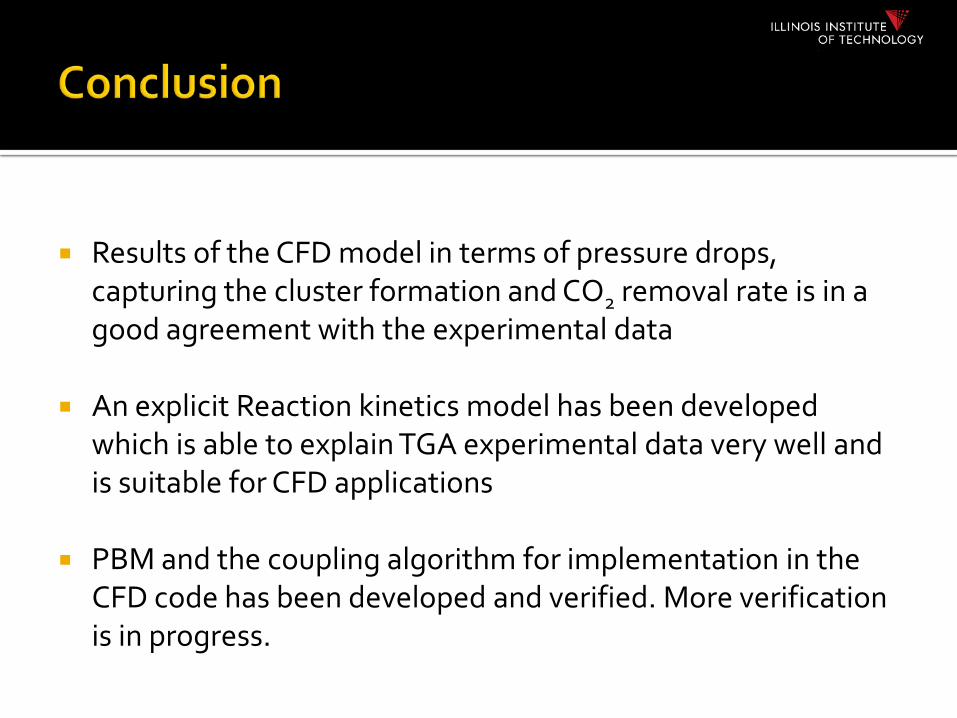
Results of the CFD model in terms of pressure drops, capturing the cluster formation and CO2 removal rate is in a good agreement with the experimental data
An explicit Reaction kinetics model has been developed which is able to explain TGA experimental data very well and is suitable for CFD applications
PBM and the coupling algorithm for implementation in the CFD code has been developed and verified. More verification is in progress.
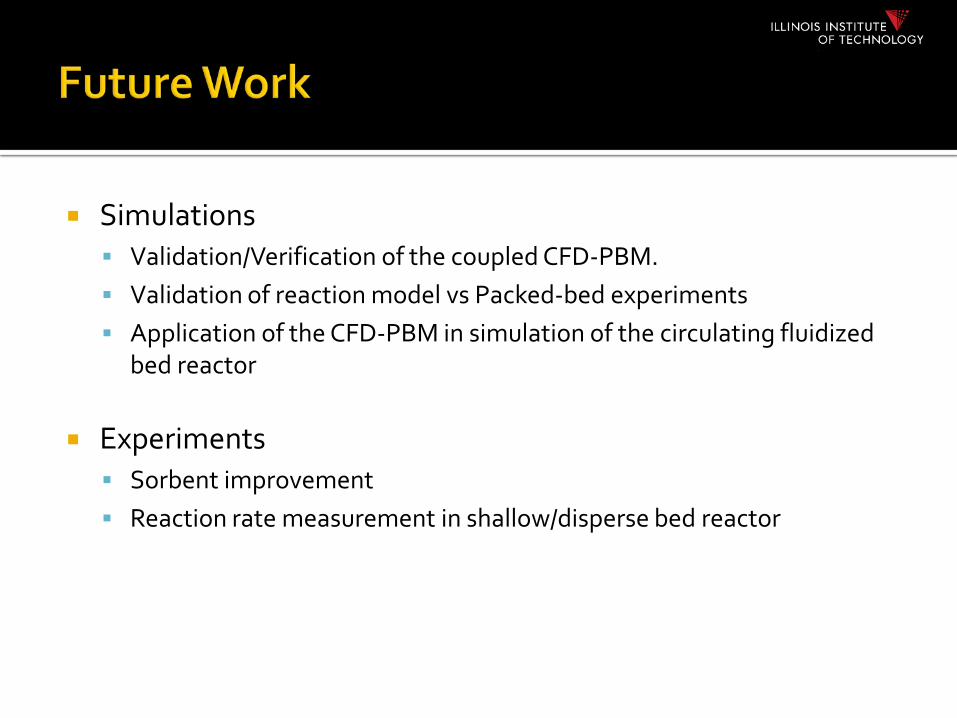
Simulations Validation/Verification of the coupled CFD-PBM. Validation of reaction model vs Packed-bed experiments Application of the CFD-PBM in simulation of the circulating fluidized
bed reactor
Experiments Sorbent improvement Reaction rate measurement in shallow/disperse bed reactor
Thanks to the Department of Energy (DOE-NETL) and ICCI for financial support.
38/43

Thanks for your attention
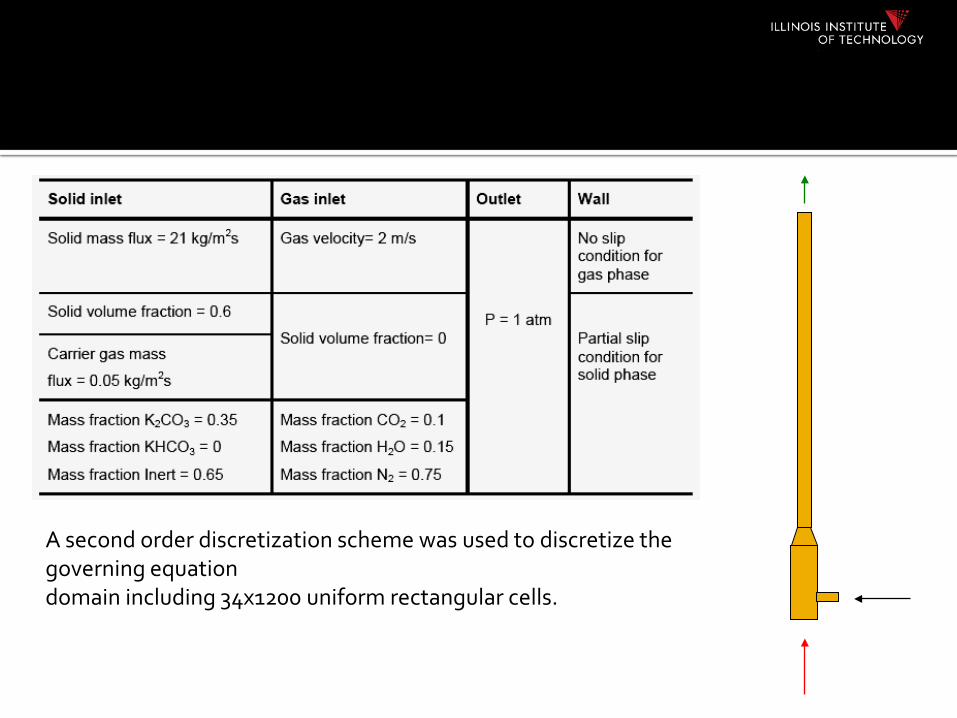
A second order discretization scheme was used to discretize the governing equation domain including 34x1200 uniform rectangular cells.
Recommended