1 - EMC Isilon Customer Troubleshooting Guide: Troubleshoot Performance Issues on your Isilon
Cluster
For links to all Isilon customer troubleshooting guides, visit the Customer Troubleshooting - Isilon Info Hub.
We appreciate your help in improving this document. Submit your feedback at http://bit.ly/isi-docfeedback._________________
___________________________
Abstract
This guide helps you to identify and troubleshoot performance issues with your Isilon cluster.
January 11, 2018
EMC ISILON CUSTOMER TROUBLESHOOTING GUIDE
TROUBLESHOOT PERFORMANCE ISSUES ON YOUR ISILON CLUSTER
OneFS 7.2 - 8.1.0
2 - EMC Isilon Customer Troubleshooting Guide: Troubleshoot Performance Issues on your Isilon
Cluster
For links to all Isilon customer troubleshooting guides, visit the Customer Troubleshooting - Isilon Info Hub.
We appreciate your help in improving this document. Submit your feedback at http://bit.ly/isi-docfeedback._________________
___________________________
Contents and overview
Page 4 Before you begin
Appendix A If you need further assistance
Page 7 Start troubleshooting
Page 23 Hardware
Page 27 File system
Note Follow all of these steps, in order, until you reach a resolution.
1. Follow these
steps.
2. Perform
troubleshooting
steps in order.
3. Appendixes
Appendix B How to use this flowchart
Page 38 Protocols
Page 3 How to use this guide
Page 39 Protocols - SMB
Page 51 Protocols - NFS
Page 55 Test using iperf
Page 57 Gather a packet capture from the client
Page 58 Gather a packet capture from the cluster
Page 59 Gather a packet capture from the cluster and client
Page 5 Gather data
Appendix C Example output: isi_for_array -s "top | head -n 15"
Appendix D Example output: isi smb shares list
Appendix E Example output: isi smb settings global view
Appendix F Example output: isi statistics protocol --protocols=nfs3,nfs4 --
orderby=timeavg
Appendix G Example output: isi statistics clients --protocol=nfs3,nfs4 --
orderby=timeavg
Page 8 Network
3 - EMC Isilon Customer Troubleshooting Guide: Troubleshoot Performance Issues on your Isilon
Cluster
For links to all Isilon customer troubleshooting guides, visit the Customer Troubleshooting - Isilon Info Hub.
We appreciate your help in improving this document. Submit your feedback at http://bit.ly/isi-docfeedback._________________
___________________________
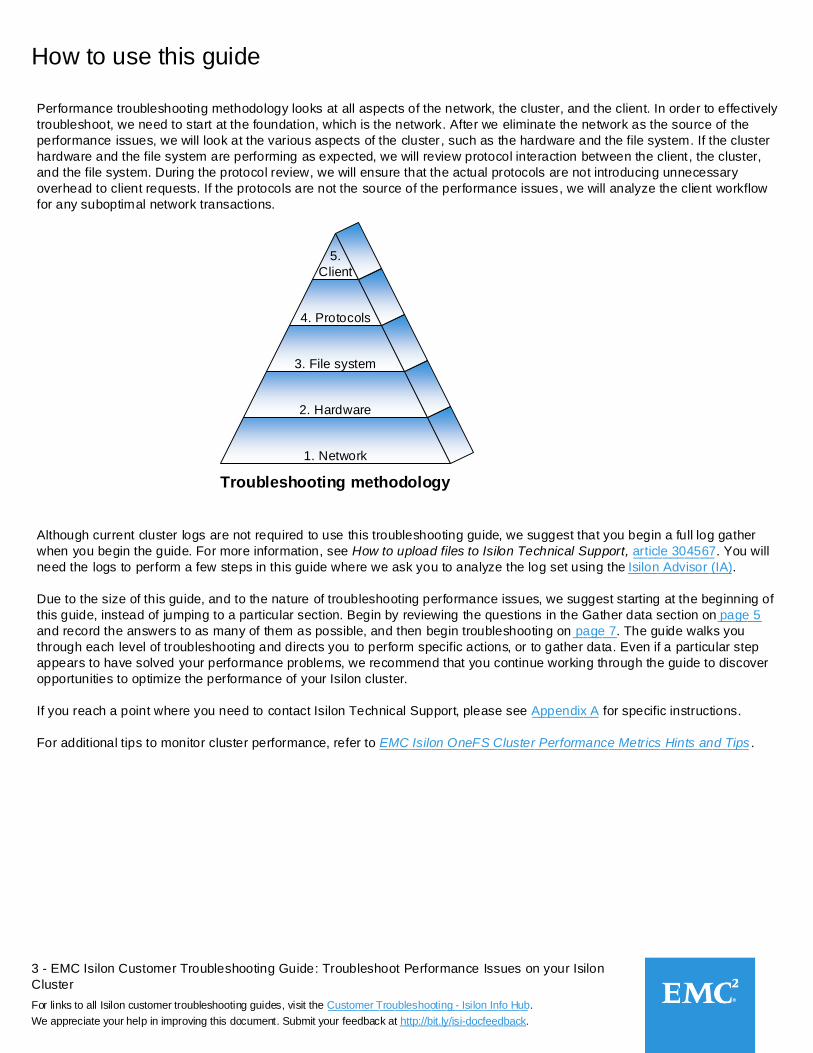
Performance troubleshooting methodology looks at all aspects of the network, the cluster, and the client. In order to effectively
troubleshoot, we need to start at the foundation, which is the network. After we eliminate the network as the source of the
performance issues, we will look at the various aspects of the cluster, such as the hardware and the file system. If the cluster
hardware and the file system are performing as expected, we will review protocol interaction between the client, the cluster,
and the file system. During the protocol review, we will ensure that the actual protocols are not introducing unnecessary
overhead to client requests. If the protocols are not the source of the performance issues, we will analyze the client workflow
for any suboptimal network transactions.
How to use this guide
Although current cluster logs are not required to use this troubleshooting guide, we suggest that you begin a full log gather
when you begin the guide. For more information, see How to upload files to Isilon Technical Support, article 304567. You will
need the logs to perform a few steps in this guide where we ask you to analyze the log set using the Isilon Advisor (IA).
Due to the size of this guide, and to the nature of troubleshooting performance issues, we suggest starting at the beginning of
this guide, instead of jumping to a particular section. Begin by reviewing the questions in the Gather data section on page 5
and record the answers to as many of them as possible, and then begin troubleshooting on page 7. The guide walks you
through each level of troubleshooting and directs you to perform specific actions, or to gather data. Even if a particular step
appears to have solved your performance problems, we recommend that you continue working through the guide to discover
opportunities to optimize the performance of your Isilon cluster.
If you reach a point where you need to contact Isilon Technical Support, please see Appendix A for specific instructions.
For additional tips to monitor cluster performance, refer to EMC Isilon OneFS Cluster Performance Metrics Hints and Tips .
1. Network
2. Hardware
3. File system
4. Protocols
Troubleshooting methodology
5.
Client
___________
______________
______
______
_________
__________________________________________________
4 - EMC Isilon Customer Troubleshooting Guide: Troubleshoot Performance Issues on your Isilon
Cluster
For links to all Isilon customer troubleshooting guides, visit the Customer Troubleshooting - Isilon Info Hub.
We appreciate your help in improving this document. Submit your feedback at http://bit.ly/isi-docfeedback._________________
___________________________
Configure screen logging through SSH
We recommend that you configure screen logging to log all session input and output during your troubleshooting session.
This log file can be shared with EMC Isilon Technical Support, if you require assistance at any point during troubleshooting.
Note: The screen session capability does not work in OneFS 7.1.0.6 and 7.1.1.2. If you are running either of these versions,
you can configure logging by using your local SSH client's logging feature.
1. Open an SSH connection to the cluster and log in by using the root account .
Note: If the cluster is in compliance mode, use the compadmin account to log in. All compadmin commands must be
preceded by the sudo prefix.
2. Change the directory to /ifs/data/Isilon_Support by running the following command:
cd /ifs/data/Isilon_Support
3. Run the following command to capture all input and output from the session:
screen -L
This will create a file named screenlog.0 that will be appended to during your session.
4. Perform troubleshooting.
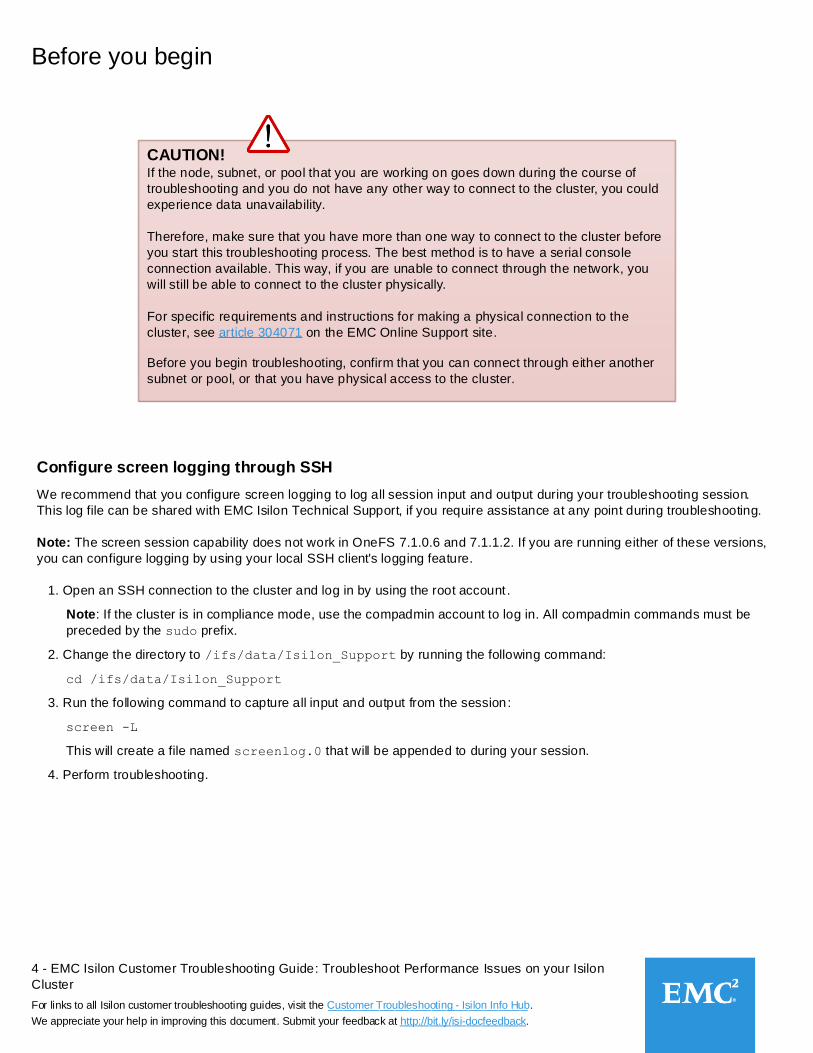
Before you begin
CAUTION!If the node, subnet, or pool that you are working on goes down during the course of
troubleshooting and you do not have any other way to connect to the cluster, you could
experience data unavailability.
Therefore, make sure that you have more than one way to connect to the cluster before
you start this troubleshooting process. The best method is to have a serial console
connection available. This way, if you are unable to connect through the network, you
will still be able to connect to the cluster physically.
For specific requirements and instructions for making a physical connection to the
cluster, see article 304071 on the EMC Online Support site.
Before you begin troubleshooting, confirm that you can connect through either another
subnet or pool, or that you have physical access to the cluster.

5 - EMC Isilon Customer Troubleshooting Guide: Troubleshoot Performance Issues on your Isilon
Cluster
For links to all Isilon customer troubleshooting guides, visit the Customer Troubleshooting - Isilon Info Hub.
We appreciate your help in improving this document. Submit your feedback at http://bit.ly/isi-docfeedback._________________
___________________________
Before beginning troubleshooting, answer as many of these questions as you can. The answers to these questions will help
Isilon Technical Support with troubleshooting if you need to contact them.
1. What kind of performance issues are you experiencing? __________________________________________________
__________________________________________________________________________________________________
2. What performance numbers are you seeing? Examples: an image file is taking up to 60 seconds to load; accessing a
share is taking up to 90 seconds. ____________________________________________________________________
__________________________________________________________________________________________________
3. What performance numbers are you expecting? Examples: the same image file normally takes 4 seconds to load;
accessing the same share normally takes 7 seconds. ____________________________________________________
__________________________________________________________________________________________________
4. What action(s) are being performed when you experience the issue? Examples: accessing data, writing to the cluster,
opening files, browsing shares, listing files. ____________________________________________________________
_________________________________________________________________________________________________
5. Is the issue happening right now? ___________________________________________________________________
5a. If not, can you reproduce the issue? (yes/no) _____________________________________________________
6. How often does the issue occur? All the time, at regular intervals (for example, every hour; or the same time every day),
or sporadically? _________________________________________________________________________________
_________________________________________________________________________________________________
7. When did this issue start happening? Provide a precise date and time, if possible. _____________________________
__________________________________________________________________________________________________
8. Did this issue start upon initial cluster set up, or after your workflow began? __________________________________
__________________________________________________________________________________________________
9. Were any workflow or configuration changes made to the cluster, client, or network right before the performance issues
started? Check with any other cluster, system, or network administrators in your organization to see if they have made
any changes.
__________________________________________________________________________________________________
__________________________________________________________________________________________________
10. Run isi job events list to obtain a list of recent cluster jobs. Which cluster jobs were running when the issue
occurred? ______________________________________________________________________________________
__________________________________________________________________________________________________
10a. When did the jobs start and end? _______________________________________________________________
_______________________________________________________________________________________________
Continued on next page.
Gather data

6 - EMC Isilon Customer Troubleshooting Guide: Troubleshoot Performance Issues on your Isilon
Cluster
For links to all Isilon customer troubleshooting guides, visit the Customer Troubleshooting - Isilon Info Hub.
We appreciate your help in improving this document. Submit your feedback at http://bit.ly/isi-docfeedback._________________
___________________________
12. Does this issue affect one specific client, or multiple clients? _______________________________________________
__________________________________________________________________________________________________
13. Which operating systems are affected by this issue? Examples: Windows 7 works, but Windows 10 does not; Mac OSX
works, but Windows 7 does not. _____________________________________________________________________
__________________________________________________________________________________________________
14. Does the issue occur only when using a specific protocol (SMB, NFS, etc.) or does it occur across all protocols?
__________________________________________________________________________________________________
15. Which client applications are affected by this issue? _____________________________________________________
__________________________________________________________________________________________________
16. Describe your network topology between affected clients and the cluster (switches, firewalls, routers, WAN). If you have
a network diagram available, please obtain it. __________________________________________________________
__________________________________________________________________________________________________
17. How many users or clients are affected? ______________________________________________________________
17a. Provide the IP addresses, subnet masks, and host names of all affected clients.
_______________________________________________________________________________________________
_______________________________________________________________________________________________
17b. Provide the IP addresses, subnet masks, and host names of some non-affected clients (if there are any) for
comparison purposes.
_______________________________________________________________________________________________
_______________________________________________________________________________________________
18. Are there any error messages on the clients or the cluster? ________________________________________________
18a. If so, what is the exact syntax of the error(s) and what application(s) is producing the error? _________________
_______________________________________________________________________________________________
_______________________________________________________________________________________________
Gather data (2)
7 - EMC Isilon Customer Troubleshooting Guide: Troubleshoot Performance Issues on your Isilon
Cluster
For links to all Isilon customer troubleshooting guides, visit the Customer Troubleshooting - Isilon Info Hub.
We appreciate your help in improving this document. Submit your feedback at http://bit.ly/isi-docfeedback._________________
___________________________
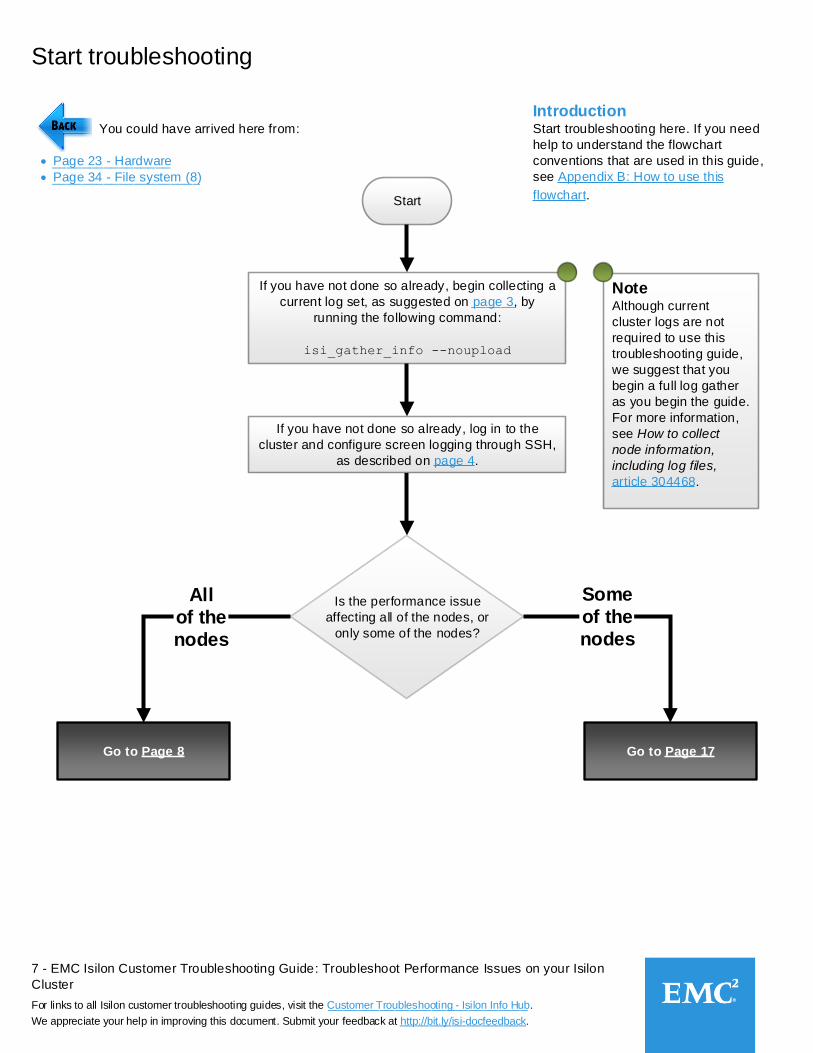
Start troubleshooting
Is the performance issue
affecting all of the nodes, or
only some of the nodes?
Start
IntroductionStart troubleshooting here. If you need
help to understand the flowchart
conventions that are used in this guide,
see Appendix B: How to use this
flowchart.
If you have not done so already, log in to the
cluster and configure screen logging through SSH,
as described on page 4.
If you have not done so already, begin collecting a
current log set, as suggested on page 3, by
running the following command:
isi_gather_info --noupload
Go to Page 8 Go to Page 17
Some
of the
nodes
All
of the
nodes
Note Although current
cluster logs are not
required to use this
troubleshooting guide,
we suggest that you
begin a full log gather
as you begin the guide.
For more information,
see How to collect
node information,
including log files,
article 304468.
______
You could have arrived here from:
Page 23 - Hardware
Page 34 - File system (8)
________________
____________________
8 - EMC Isilon Customer Troubleshooting Guide: Troubleshoot Performance Issues on your Isilon
Cluster
For links to all Isilon customer troubleshooting guides, visit the Customer Troubleshooting - Isilon Info Hub.
We appreciate your help in improving this document. Submit your feedback at http://bit.ly/isi-docfeedback._________________
___________________________
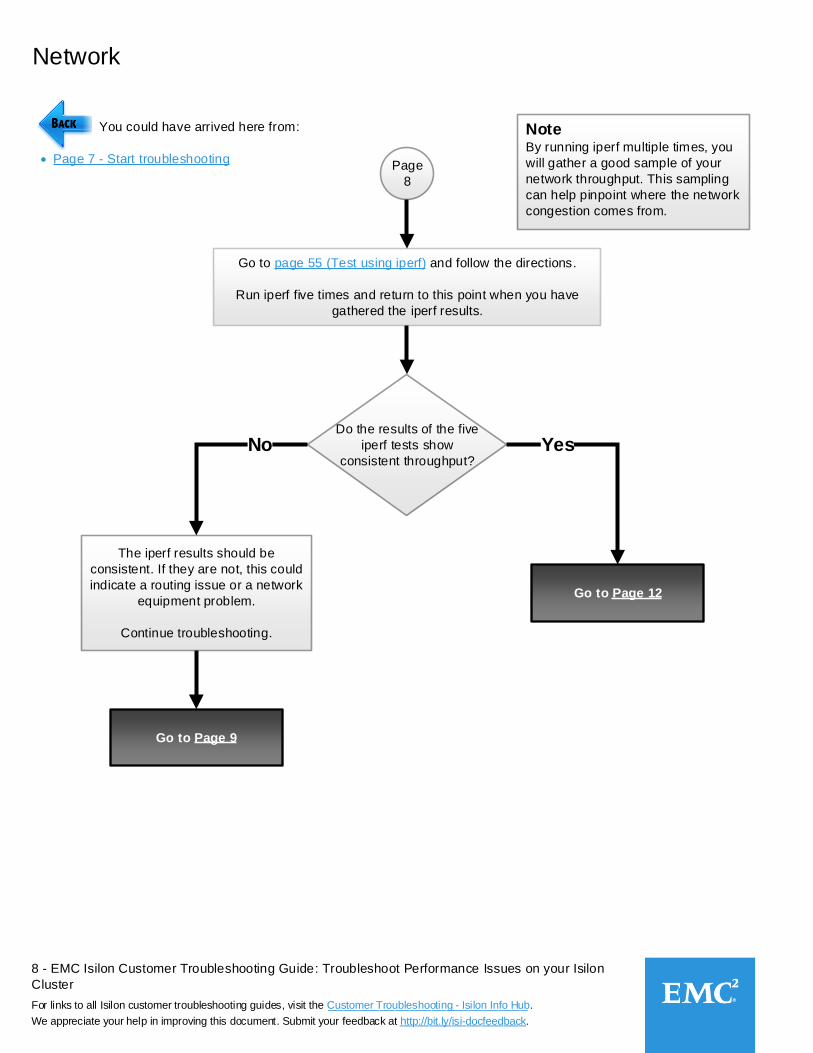
Network
Go to page 55 (Test using iperf) and follow the directions.
Run iperf five times and return to this point when you have
gathered the iperf results.
Page
8
You could have arrived here from:
Page 7 - Start troubleshooting
Do the results of the five
iperf tests show
consistent throughput?
Go to Page 9
Go to Page 12
No Yes
The iperf results should be
consistent. If they are not, this could
indicate a routing issue or a network
equipment problem.
Continue troubleshooting.
Note By running iperf multiple times, you
will gather a good sample of your
network throughput. This sampling
can help pinpoint where the network
congestion comes from.
9 - EMC Isilon Customer Troubleshooting Guide: Troubleshoot Performance Issues on your Isilon
Cluster
For links to all Isilon customer troubleshooting guides, visit the Customer Troubleshooting - Isilon Info Hub.
We appreciate your help in improving this document. Submit your feedback at http://bit.ly/isi-docfeedback._________________
___________________________
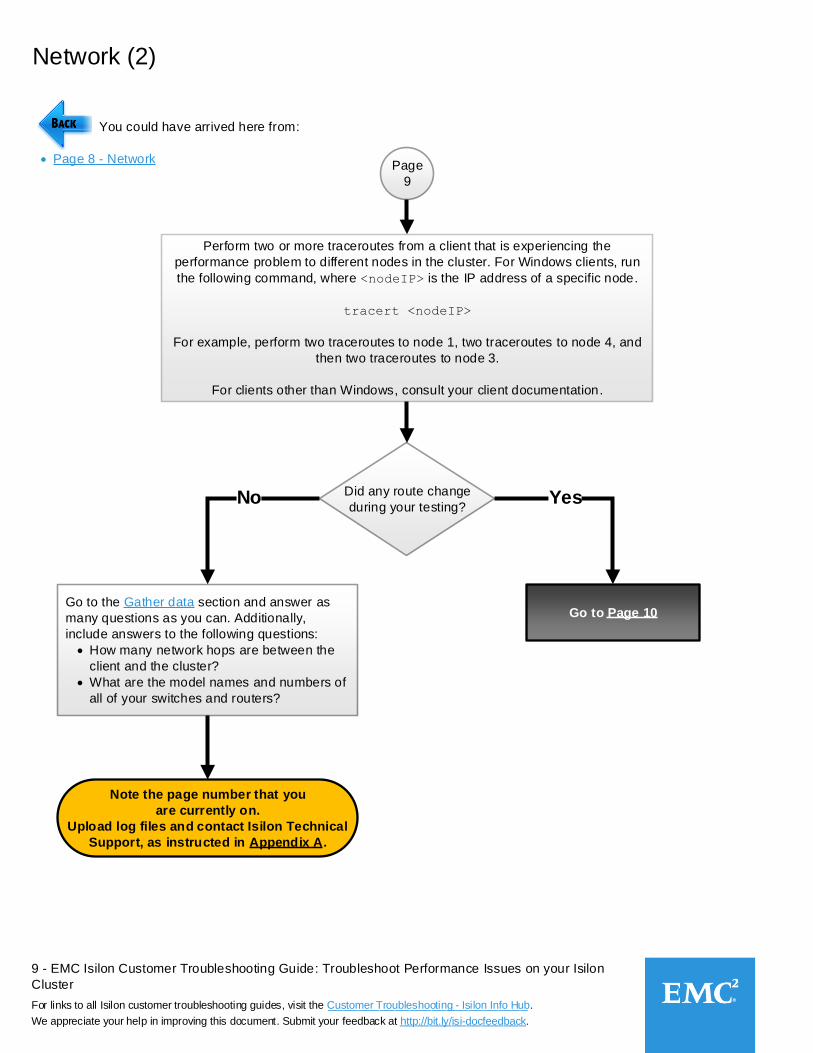
Network (2)
Perform two or more traceroutes from a client that is experiencing the
performance problem to different nodes in the cluster. For Windows clients, run
the following command, where <nodeIP> is the IP address of a specific node.
tracert <nodeIP>
For example, perform two traceroutes to node 1, two traceroutes to node 4, and
then two traceroutes to node 3.
For clients other than Windows, consult your client documentation.
Page
9
You could have arrived here from:
Page 8 - Network
Did any route change
during your testing?
Go to Page 10
Yes
Note the page number that you
are currently on.
Upload log files and contact Isilon Technical
Support, as instructed in Appendix A.
Go to the Gather data section and answer as
many questions as you can. Additionally,
include answers to the following questions:
How many network hops are between the
client and the cluster?
What are the model names and numbers of
all of your switches and routers?
No
10 - EMC Isilon Customer Troubleshooting Guide: Troubleshoot Performance Issues on your
Isilon Cluster
For links to all Isilon customer troubleshooting guides, visit the Customer Troubleshooting - Isilon Info Hub.
We appreciate your help in improving this document. Submit your feedback at http://bit.ly/isi-docfeedback._________________
___________________________
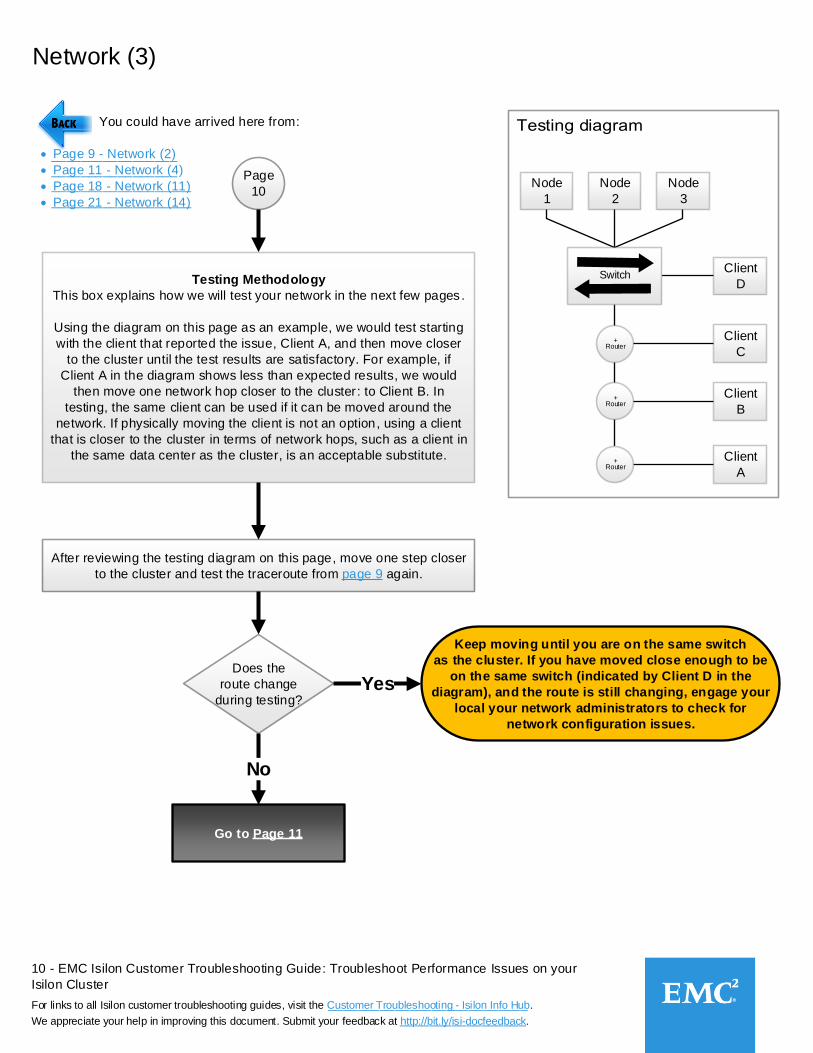
Network (3)
Testing Methodology
This box explains how we will test your network in the next few pages .
Using the diagram on this page as an example, we would test starting
with the client that reported the issue, Client A, and then move closer
to the cluster until the test results are satisfactory. For example, if
Client A in the diagram shows less than expected results, we would
then move one network hop closer to the cluster: to Client B. In
testing, the same client can be used if it can be moved around the
network. If physically moving the client is not an option, using a client
that is closer to the cluster in terms of network hops, such as a client in
the same data center as the cluster, is an acceptable substitute.
Page
10
You could have arrived here from:
Page 9 - Network (2)
Page 11 - Network (4)
Page 18 - Network (11)
Page 21 - Network (14)
Node
1
Node
2
Node
3
Client
D
Client
C
Client
B
Client
A
+Router
+Router
Go to Page 11
Switch
+Router
After reviewing the testing diagram on this page, move one step closer
to the cluster and test the traceroute from page 9 again.
No
Does the
route change
during testing?Yes
Keep moving until you are on the same switch
as the cluster. If you have moved close enough to be
on the same switch (indicated by Client D in the
diagram), and the route is still changing, engage your
local your network administrators to check for
network configuration issues.
_________________
___________________
____________________________________
11 - EMC Isilon Customer Troubleshooting Guide: Troubleshoot Performance Issues on your
Isilon Cluster
For links to all Isilon customer troubleshooting guides, visit the Customer Troubleshooting - Isilon Info Hub.
We appreciate your help in improving this document. Submit your feedback at http://bit.ly/isi-docfeedback._________________
___________________________
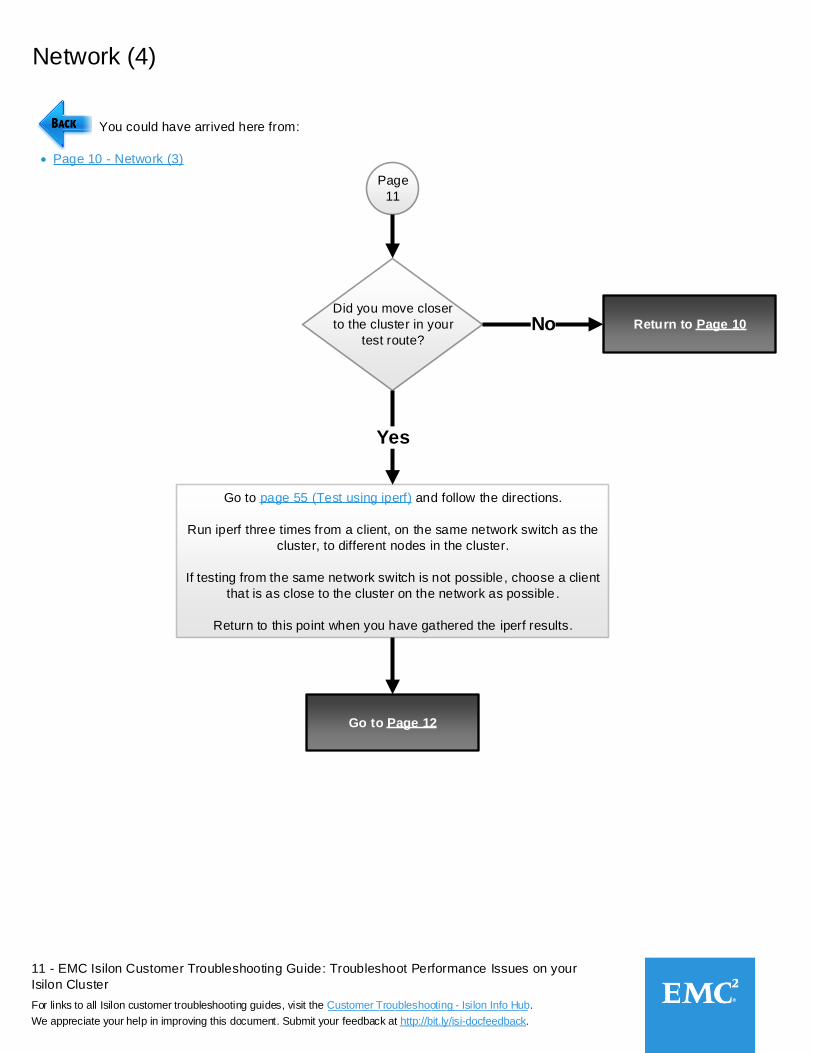
Network (4)
Page
11
You could have arrived here from:
Page 10 - Network (3)
Go to page 55 (Test using iperf) and follow the directions.
Run iperf three times from a client, on the same network switch as the
cluster, to different nodes in the cluster.
If testing from the same network switch is not possible, choose a client
that is as close to the cluster on the network as possible .
Return to this point when you have gathered the iperf results.
Go to Page 12
Yes
Did you move closer
to the cluster in your
test route?
Return to Page 10No
12 - EMC Isilon Customer Troubleshooting Guide: Troubleshoot Performance Issues on your
Isilon Cluster
For links to all Isilon customer troubleshooting guides, visit the Customer Troubleshooting - Isilon Info Hub.
We appreciate your help in improving this document. Submit your feedback at http://bit.ly/isi-docfeedback._________________
___________________________
Network (5)
Page
12
You could have arrived here from:
Page 8 - Network
Page 11 - Network (4)
Are you
using a
1 GbE or 10 GbE
interface?
Average throughput:
800 Mb/second
1 GbE
10
GbE
What is the
MTU:
1500 or 9000?
Average throughput:
3 Gb/second
1500 MTU
Average throughput:
6 Gb/second
9000 MTU
Are your iperf results
within 20% of the
average throughput for
your interface?
Go to Page 13No
Go to Page 23
Hardware
Yes
Average interface valuesThese values are average interface
throughput for low load between network,
cluster, and client. They can be used as a
guide in the following steps to suggest
whether the problem is a network issue or not.
Network interface type
Average throughput
1 GbE
10 GbE
800 Mb/sec
3 Gb/sec with MTU 15006 Gb/sec with MTU 9000
1 GbE aggregate(0.95 Gb/sec) x (number of interfaces)
10 GbE aggregate 6 Gb/sec
______________
__________________Note To locate the maximum
transmission unit
(MTU), run ifconfig,
the MTU will be listed
for each interface.
13 - EMC Isilon Customer Troubleshooting Guide: Troubleshoot Performance Issues on your
Isilon Cluster
For links to all Isilon customer troubleshooting guides, visit the Customer Troubleshooting - Isilon Info Hub.
We appreciate your help in improving this document. Submit your feedback at http://bit.ly/isi-docfeedback._________________
___________________________
Network (6)
Page
13
You could have arrived here from:
Page 12 - Network (5)
Page 21 - Network (14)
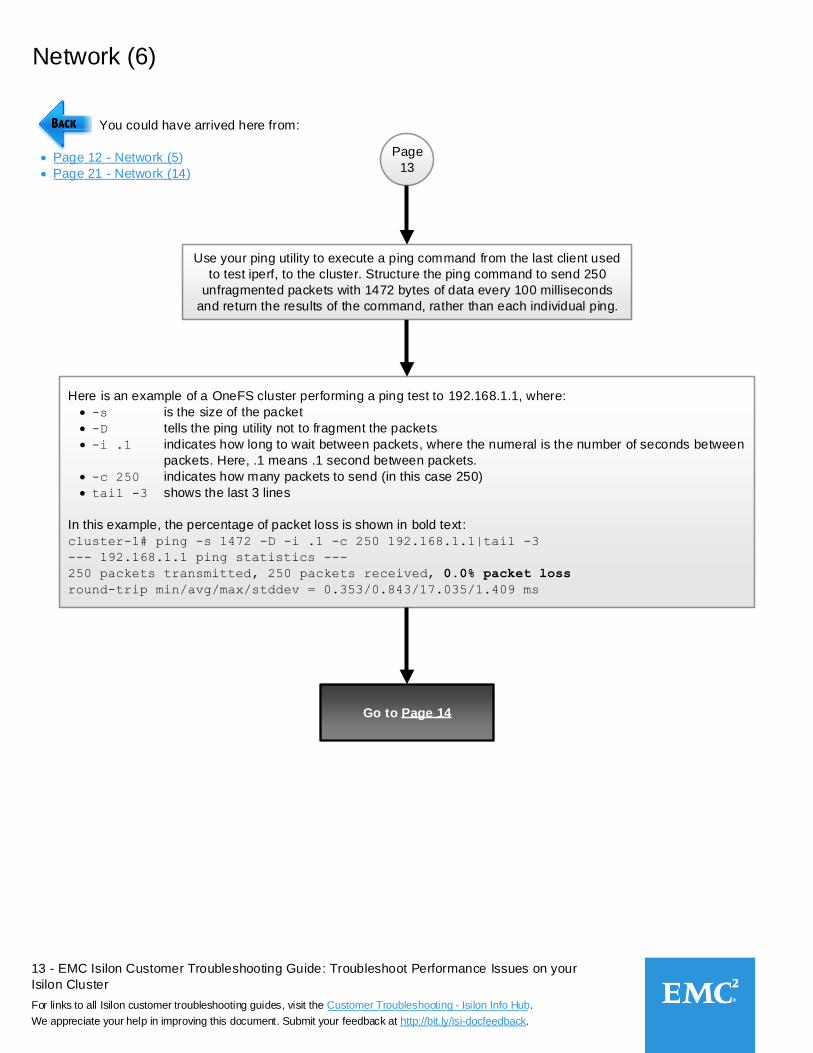
Here is an example of a OneFS cluster performing a ping test to 192.168.1.1, where:
-s is the size of the packet
-D tells the ping utility not to fragment the packets
-i .1 indicates how long to wait between packets, where the numeral is the number of seconds between
packets. Here, .1 means .1 second between packets.
-c 250 indicates how many packets to send (in this case 250)
tail -3 shows the last 3 lines
In this example, the percentage of packet loss is shown in bold text:
cluster-1# ping -s 1472 -D -i .1 -c 250 192.168.1.1|tail -3
--- 192.168.1.1 ping statistics ---
250 packets transmitted, 250 packets received, 0.0% packet loss
round-trip min/avg/max/stddev = 0.353/0.843/17.035/1.409 ms
Go to Page 14
_________________
__________________
Use your ping utility to execute a ping command from the last client used
to test iperf, to the cluster. Structure the ping command to send 250
unfragmented packets with 1472 bytes of data every 100 milliseconds
and return the results of the command, rather than each individual ping.
14 - EMC Isilon Customer Troubleshooting Guide: Troubleshoot Performance Issues on your
Isilon Cluster
For links to all Isilon customer troubleshooting guides, visit the Customer Troubleshooting - Isilon Info Hub.
We appreciate your help in improving this document. Submit your feedback at http://bit.ly/isi-docfeedback._________________
___________________________
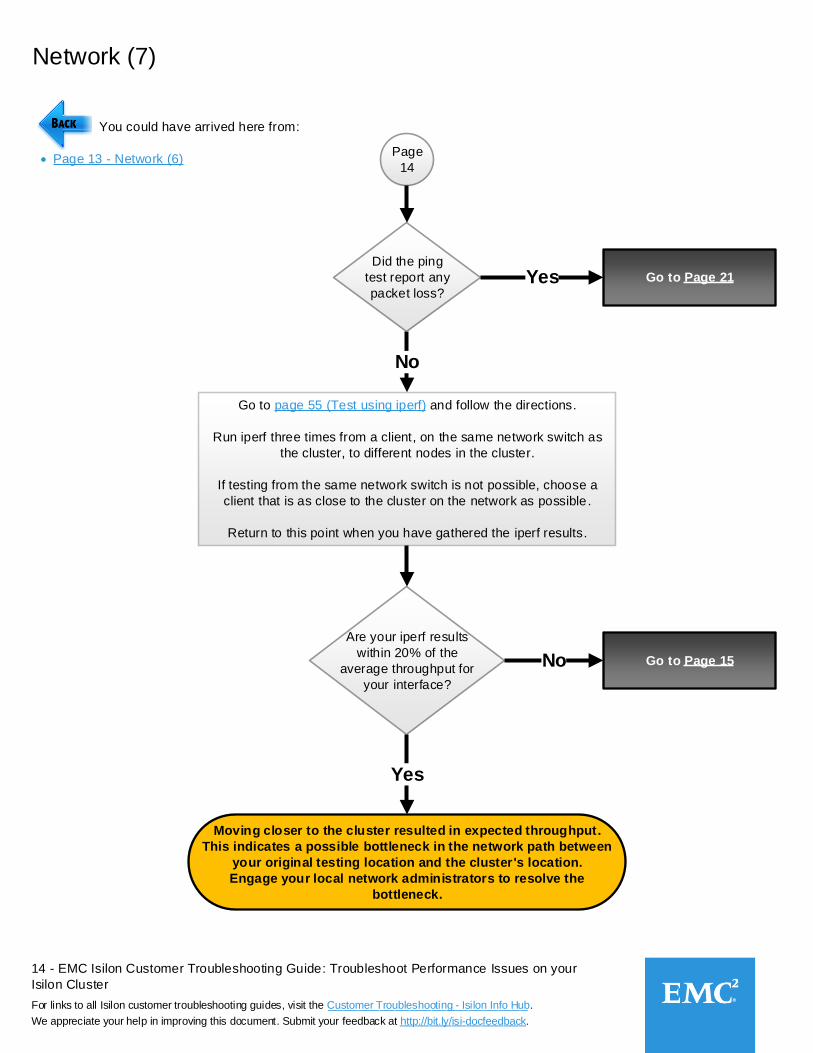
Network (7)
Page
14
You could have arrived here from:
Page 13 - Network (6)
No
Did the ping
test report any
packet loss?
Go to page 55 (Test using iperf) and follow the directions.
Run iperf three times from a client, on the same network switch as
the cluster, to different nodes in the cluster.
If testing from the same network switch is not possible, choose a
client that is as close to the cluster on the network as possible.
Return to this point when you have gathered the iperf results.
Are your iperf results
within 20% of the
average throughput for
your interface?
Yes
Go to Page 15No
Go to Page 21Yes
Moving closer to the cluster resulted in expected throughput.
This indicates a possible bottleneck in the network path between
your original testing location and the cluster's location.
Engage your local network administrators to resolve the
bottleneck.
15 - EMC Isilon Customer Troubleshooting Guide: Troubleshoot Performance Issues on your
Isilon Cluster
For links to all Isilon customer troubleshooting guides, visit the Customer Troubleshooting - Isilon Info Hub.
We appreciate your help in improving this document. Submit your feedback at http://bit.ly/isi-docfeedback._________________
___________________________
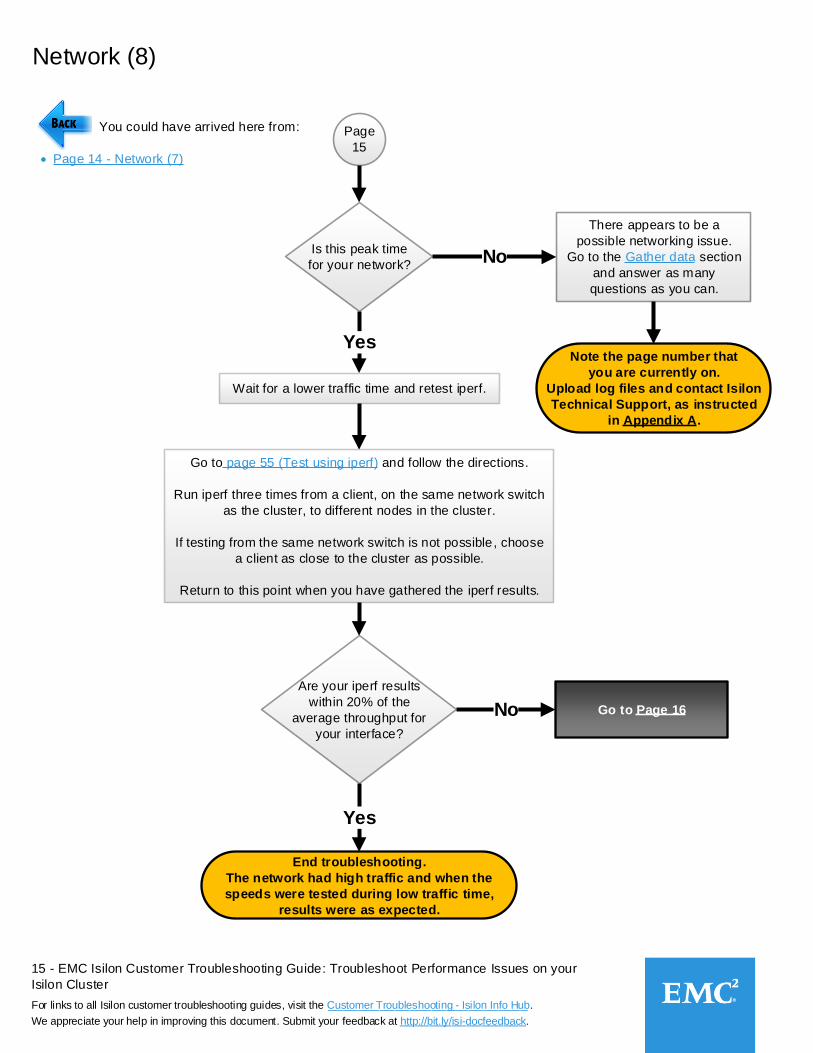
Network (8)
Page
15
You could have arrived here from:
Page 14 - Network (7)
Yes
Is this peak time
for your network?
Wait for a lower traffic time and retest iperf.
Are your iperf results
within 20% of the
average throughput for
your interface?
Yes
Go to Page 16No
Go to page 55 (Test using iperf) and follow the directions.
Run iperf three times from a client, on the same network switch
as the cluster, to different nodes in the cluster.
If testing from the same network switch is not possible, choose
a client as close to the cluster as possible.
Return to this point when you have gathered the iperf results.
Note the page number that
you are currently on.
Upload log files and contact Isilon
Technical Support, as instructed
in Appendix A.
No
There appears to be a
possible networking issue.
Go to the Gather data section
and answer as many
questions as you can.
End troubleshooting.
The network had high traffic and when the
speeds were tested during low traffic time,
results were as expected.
16 - EMC Isilon Customer Troubleshooting Guide: Troubleshoot Performance Issues on your
Isilon Cluster
For links to all Isilon customer troubleshooting guides, visit the Customer Troubleshooting - Isilon Info Hub.
We appreciate your help in improving this document. Submit your feedback at http://bit.ly/isi-docfeedback._________________
___________________________
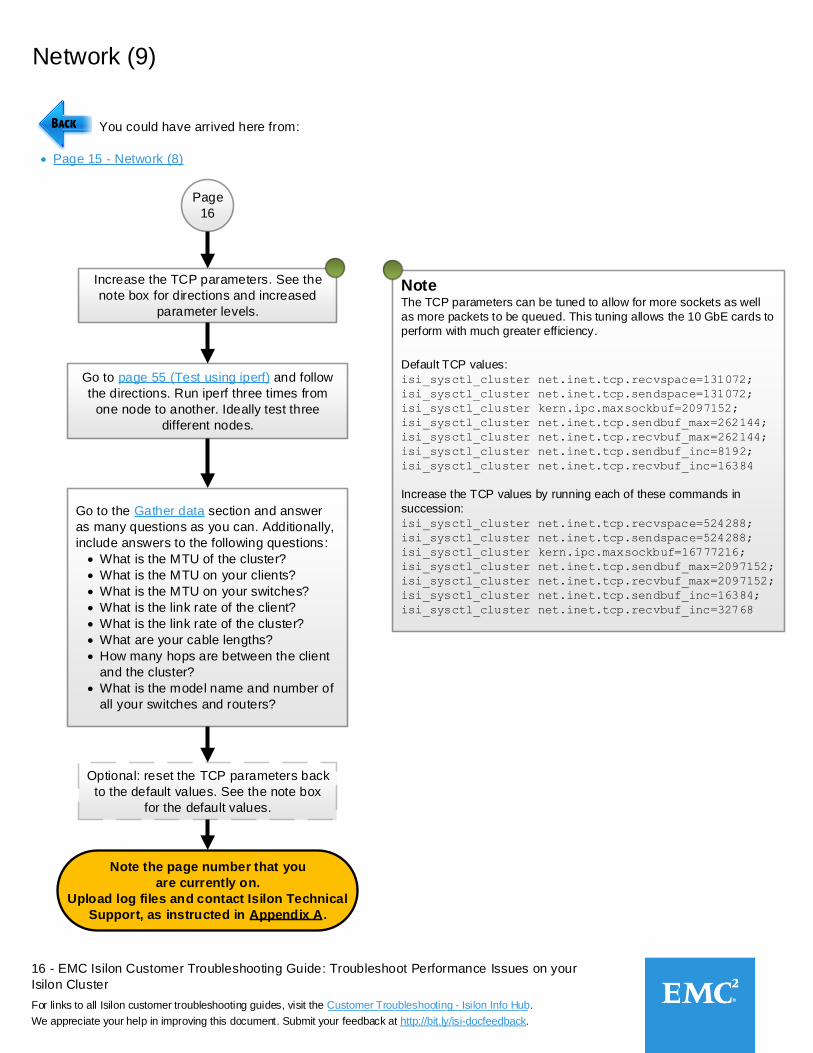
Network (9)
Page
16
You could have arrived here from:
Page 15 - Network (8)
Increase the TCP parameters. See the
note box for directions and increased
parameter levels.
Note The TCP parameters can be tuned to allow for more sockets as well
as more packets to be queued. This tuning allows the 10 GbE cards to
perform with much greater efficiency.
Default TCP values:
isi_sysctl_cluster net.inet.tcp.recvspace=131072;
isi_sysctl_cluster net.inet.tcp.sendspace=131072;
isi_sysctl_cluster kern.ipc.maxsockbuf=2097152;
isi_sysctl_cluster net.inet.tcp.sendbuf_max=262144;
isi_sysctl_cluster net.inet.tcp.recvbuf_max=262144;
isi_sysctl_cluster net.inet.tcp.sendbuf_inc=8192;
isi_sysctl_cluster net.inet.tcp.recvbuf_inc=16384
Increase the TCP values by running each of these commands in
succession:
isi_sysctl_cluster net.inet.tcp.recvspace=524288;
isi_sysctl_cluster net.inet.tcp.sendspace=524288;
isi_sysctl_cluster kern.ipc.maxsockbuf=16777216;
isi_sysctl_cluster net.inet.tcp.sendbuf_max=2097152;
isi_sysctl_cluster net.inet.tcp.recvbuf_max=2097152;
isi_sysctl_cluster net.inet.tcp.sendbuf_inc=16384;
isi_sysctl_cluster net.inet.tcp.recvbuf_inc=32768
Go to page 55 (Test using iperf) and follow
the directions. Run iperf three times from
one node to another. Ideally test three
different nodes.
Go to the Gather data section and answer
as many questions as you can. Additionally,
include answers to the following questions:
What is the MTU of the cluster?
What is the MTU on your clients?
What is the MTU on your switches?
What is the link rate of the client?
What is the link rate of the cluster?
What are your cable lengths?
How many hops are between the client
and the cluster?
What is the model name and number of
all your switches and routers?
Note the page number that you
are currently on.
Upload log files and contact Isilon Technical
Support, as instructed in Appendix A.
Optional: reset the TCP parameters back
to the default values. See the note box
for the default values.
17 - EMC Isilon Customer Troubleshooting Guide: Troubleshoot Performance Issues on your
Isilon Cluster
For links to all Isilon customer troubleshooting guides, visit the Customer Troubleshooting - Isilon Info Hub.
We appreciate your help in improving this document. Submit your feedback at http://bit.ly/isi-docfeedback._________________
___________________________
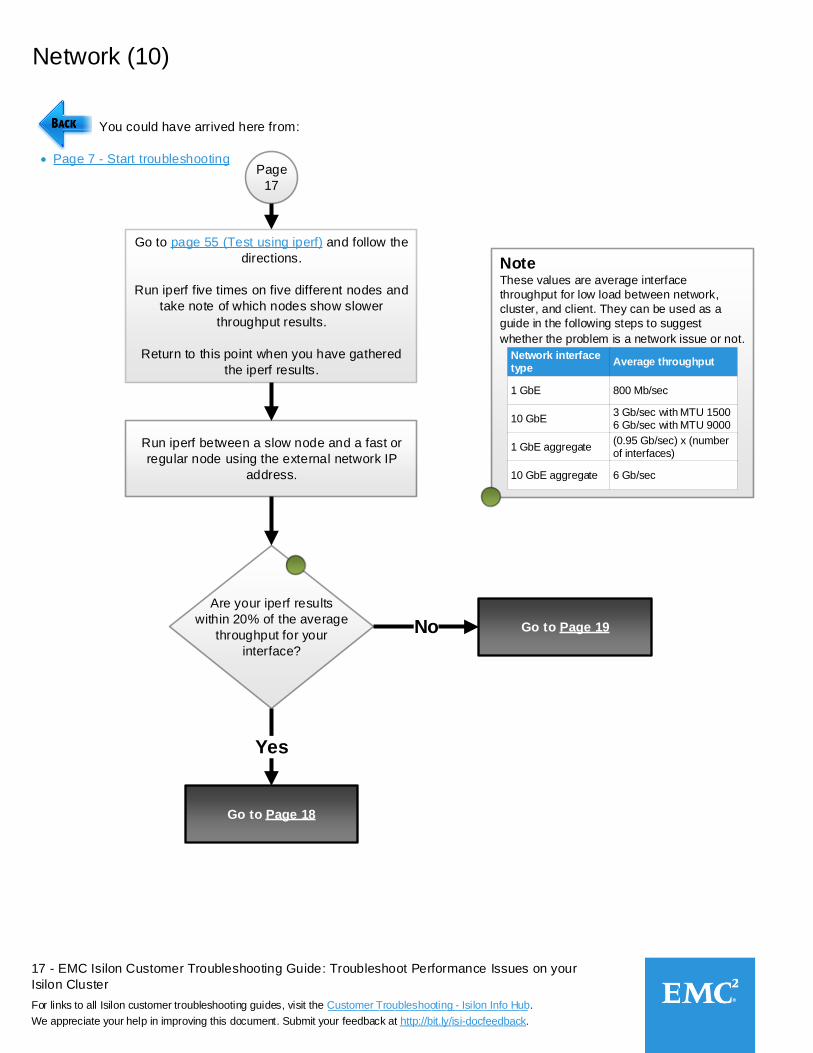
Note These values are average interface
throughput for low load between network,
cluster, and client. They can be used as a
guide in the following steps to suggest
whether the problem is a network issue or not.
Network interface type
Average throughput
1 GbE
10 GbE
800 Mb/sec
3 Gb/sec with MTU 15006 Gb/sec with MTU 9000
1 GbE aggregate(0.95 Gb/sec) x (number of interfaces)
10 GbE aggregate 6 Gb/sec
Network (10)
Page
17
You could have arrived here from:
Page 7 - Start troubleshooting
Go to page 55 (Test using iperf) and follow the
directions.
Run iperf five times on five different nodes and
take note of which nodes show slower
throughput results.
Return to this point when you have gathered
the iperf results.
Run iperf between a slow node and a fast or
regular node using the external network IP
address.
Are your iperf results
within 20% of the average
throughput for your
interface?
Go to Page 18
Go to Page 19
Yes
No
18 - EMC Isilon Customer Troubleshooting Guide: Troubleshoot Performance Issues on your
Isilon Cluster
For links to all Isilon customer troubleshooting guides, visit the Customer Troubleshooting - Isilon Info Hub.
We appreciate your help in improving this document. Submit your feedback at http://bit.ly/isi-docfeedback._________________
___________________________
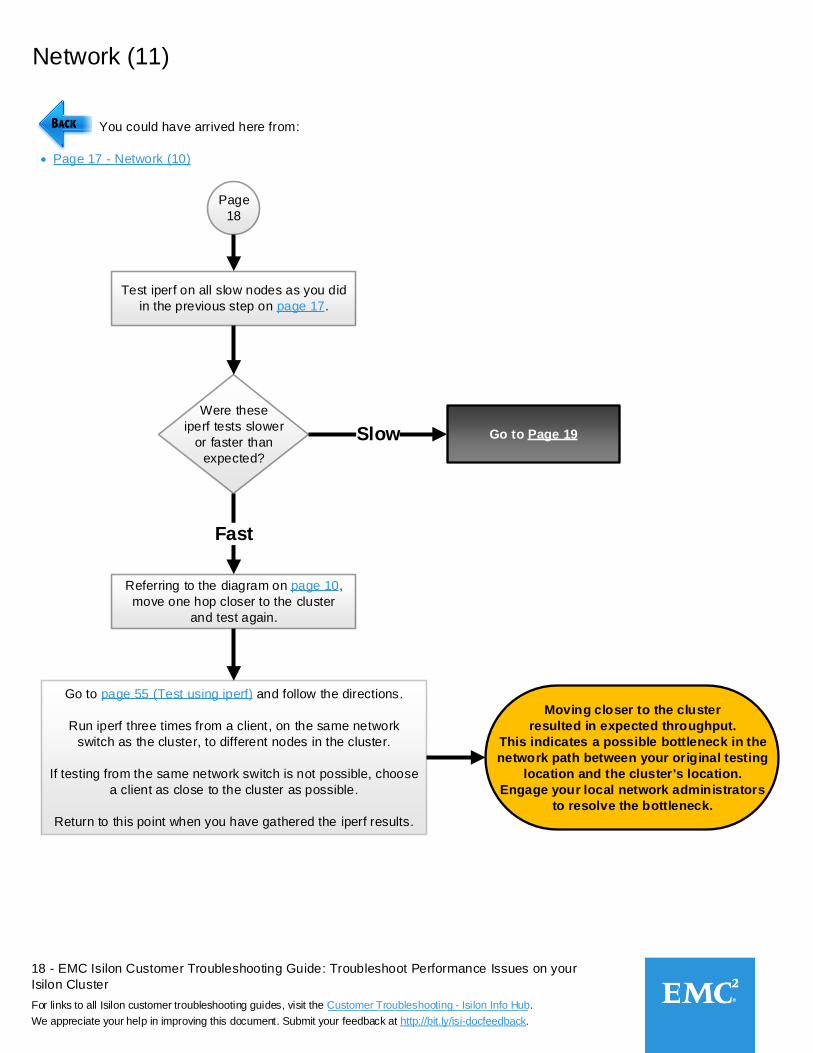
Network (11)
Page
18
You could have arrived here from:
Page 17 - Network (10)
Test iperf on all slow nodes as you did
in the previous step on page 17.
Were these
iperf tests slower
or faster than
expected?
Referring to the diagram on page 10,
move one hop closer to the cluster
and test again.
Fast
Slow Go to Page 19
Go to page 55 (Test using iperf) and follow the directions.
Run iperf three times from a client, on the same network
switch as the cluster, to different nodes in the cluster.
If testing from the same network switch is not possible, choose
a client as close to the cluster as possible.
Return to this point when you have gathered the iperf results.
Moving closer to the cluster
resulted in expected throughput.
This indicates a possible bottleneck in the
network path between your original testing
location and the cluster's location.
Engage your local network administrators
to resolve the bottleneck.
19 - EMC Isilon Customer Troubleshooting Guide: Troubleshoot Performance Issues on your
Isilon Cluster
For links to all Isilon customer troubleshooting guides, visit the Customer Troubleshooting - Isilon Info Hub.
We appreciate your help in improving this document. Submit your feedback at http://bit.ly/isi-docfeedback._________________
___________________________
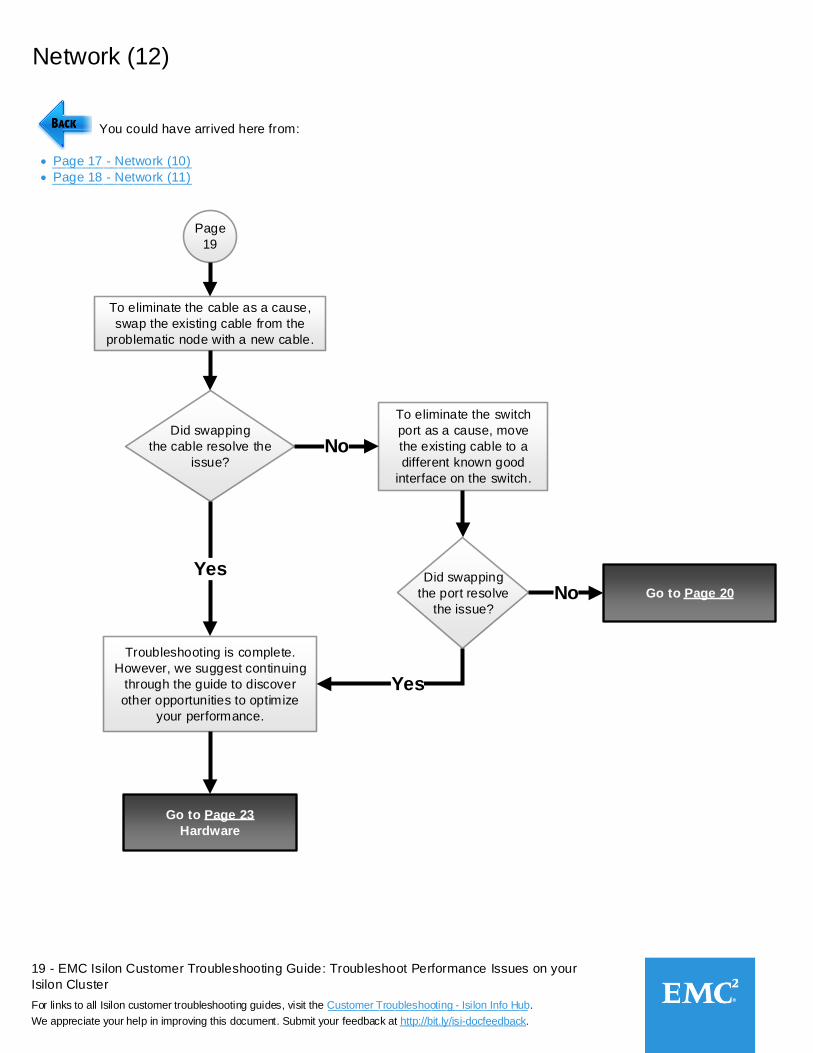
Network (12)
Page
19
You could have arrived here from:
Page 17 - Network (10)
Page 18 - Network (11)
To eliminate the cable as a cause,
swap the existing cable from the
problematic node with a new cable.
Did swapping
the cable resolve the
issue?
Troubleshooting is complete.
However, we suggest continuing
through the guide to discover
other opportunities to optimize
your performance.
To eliminate the switch
port as a cause, move
the existing cable to a
different known good
interface on the switch.
Yes
No
Go to Page 23
Hardware
Did swapping
the port resolve
the issue?
Yes
Go to Page 20No
___________________
___________________
20 - EMC Isilon Customer Troubleshooting Guide: Troubleshoot Performance Issues on your
Isilon Cluster
For links to all Isilon customer troubleshooting guides, visit the Customer Troubleshooting - Isilon Info Hub.
We appreciate your help in improving this document. Submit your feedback at http://bit.ly/isi-docfeedback._________________
___________________________
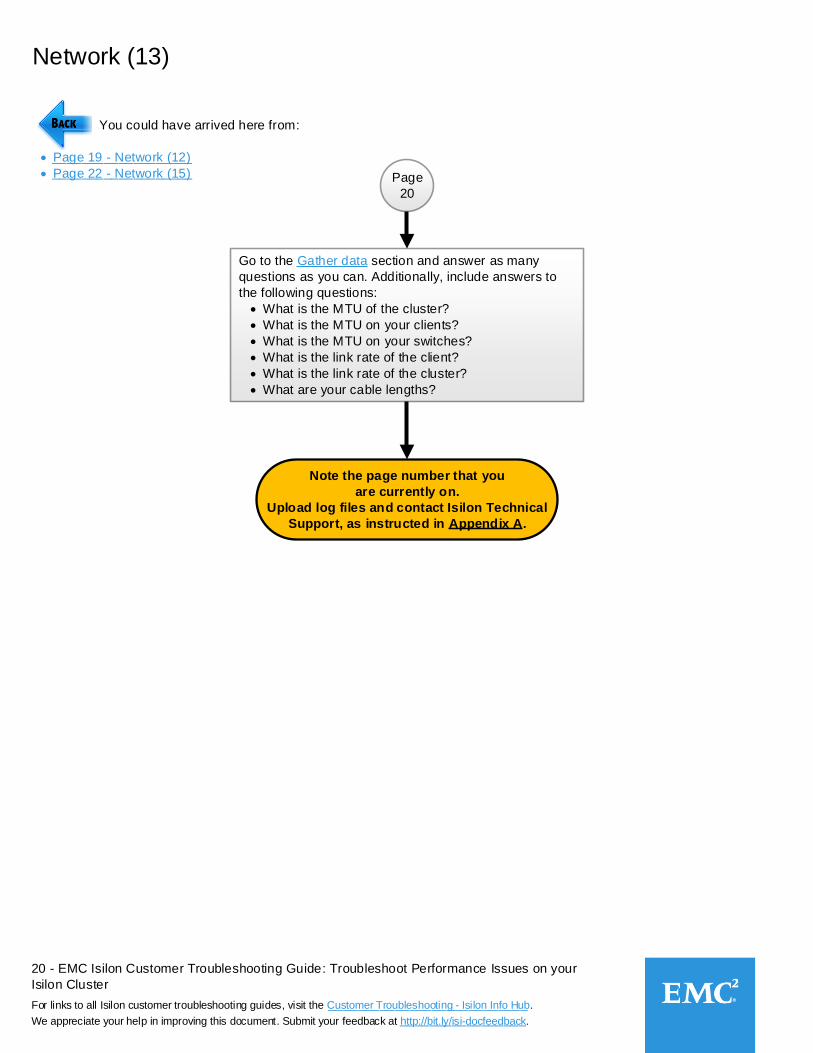
Network (13)
Page
20
You could have arrived here from:
Page 19 - Network (12)
Page 22 - Network (15)
Go to the Gather data section and answer as many
questions as you can. Additionally, include answers to
the following questions:
What is the MTU of the cluster?
What is the MTU on your clients?
What is the MTU on your switches?
What is the link rate of the client?
What is the link rate of the cluster?
What are your cable lengths?
Note the page number that you
are currently on.
Upload log files and contact Isilon Technical
Support, as instructed in Appendix A.
___________________
___________________
21 - EMC Isilon Customer Troubleshooting Guide: Troubleshoot Performance Issues on your
Isilon Cluster
For links to all Isilon customer troubleshooting guides, visit the Customer Troubleshooting - Isilon Info Hub.
We appreciate your help in improving this document. Submit your feedback at http://bit.ly/isi-docfeedback._________________
___________________________
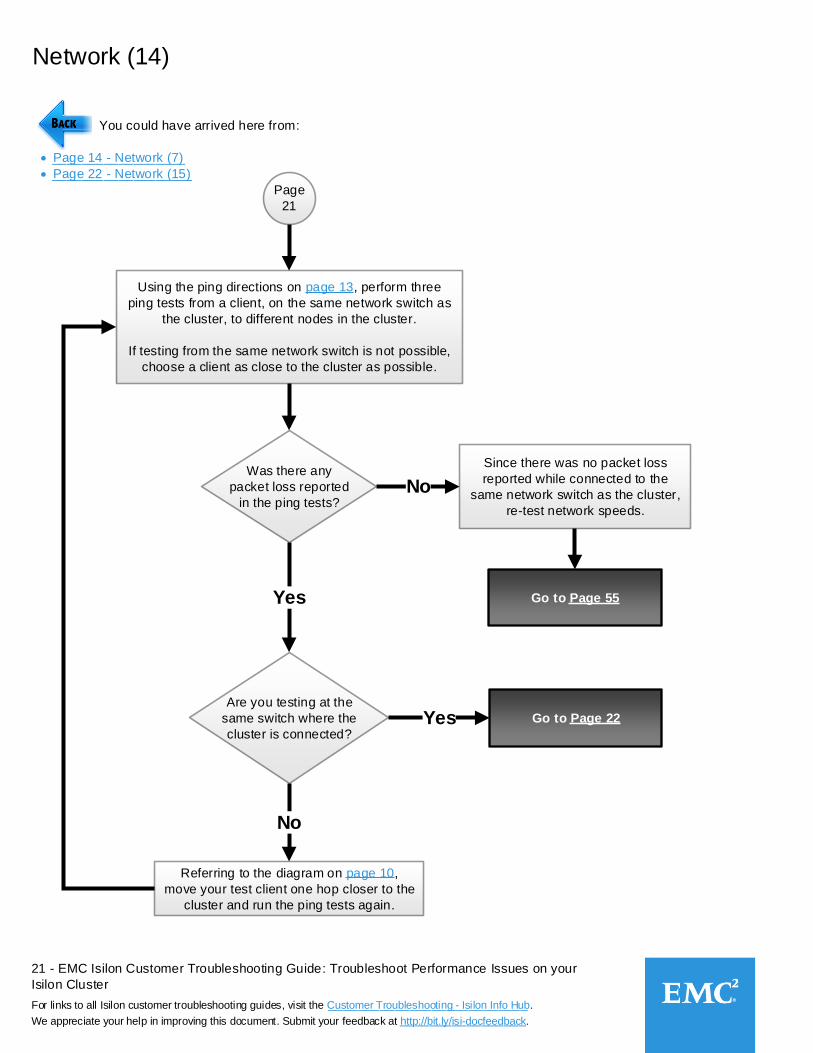
Network (14)
Page
21
You could have arrived here from:
Page 14 - Network (7)
Page 22 - Network (15)
Using the ping directions on page 13, perform three
ping tests from a client, on the same network switch as
the cluster, to different nodes in the cluster.
If testing from the same network switch is not possible,
choose a client as close to the cluster as possible.
Was there any
packet loss reported
in the ping tests?
Are you testing at the
same switch where the
cluster is connected?
Yes
No
No
Go to Page 22Yes
Referring to the diagram on page 10,
move your test client one hop closer to the
cluster and run the ping tests again.
__________________
___________________
Since there was no packet loss
reported while connected to the
same network switch as the cluster,
re-test network speeds.
Go to Page 55
22 - EMC Isilon Customer Troubleshooting Guide: Troubleshoot Performance Issues on your
Isilon Cluster
For links to all Isilon customer troubleshooting guides, visit the Customer Troubleshooting - Isilon Info Hub.
We appreciate your help in improving this document. Submit your feedback at http://bit.ly/isi-docfeedback._________________
___________________________
Network (15)
Page
22
You could have arrived here from:
Page 21 - Network (14)
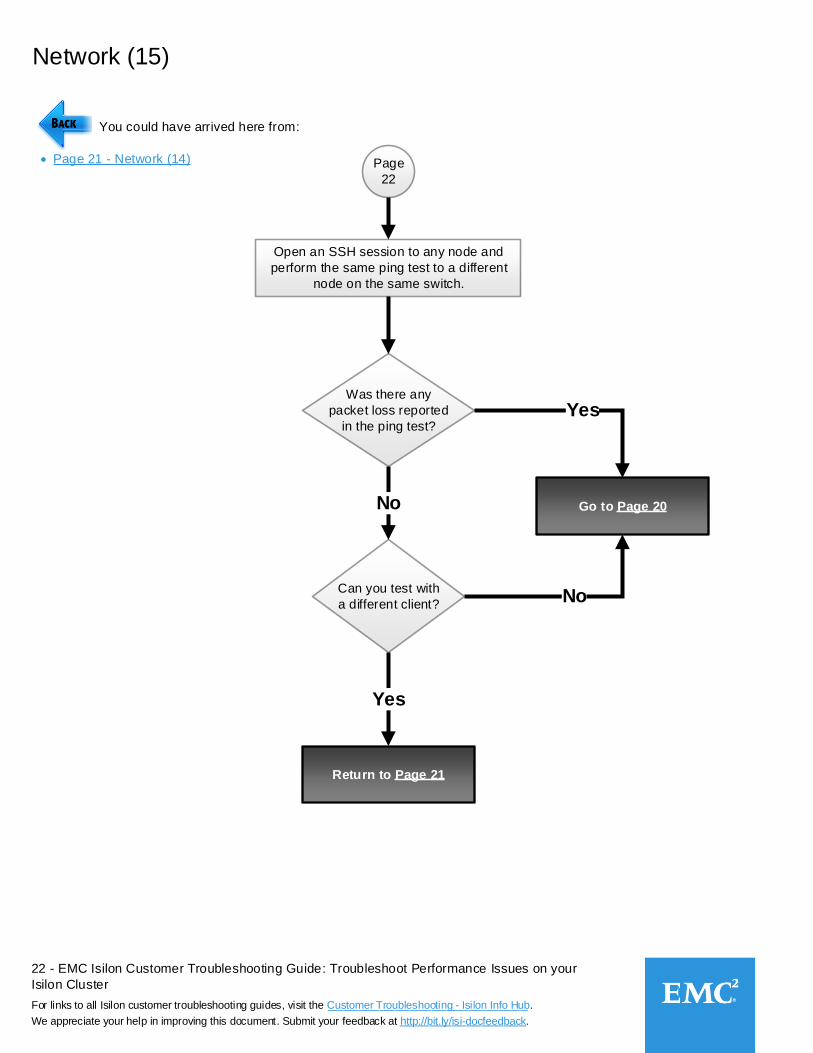
Open an SSH session to any node and
perform the same ping test to a different
node on the same switch.
Was there any
packet loss reported
in the ping test?
Go to Page 20
Yes
Can you test with
a different client?
No
No
Return to Page 21
Yes
23 - EMC Isilon Customer Troubleshooting Guide: Troubleshoot Performance Issues on your
Isilon Cluster
For links to all Isilon customer troubleshooting guides, visit the Customer Troubleshooting - Isilon Info Hub.
We appreciate your help in improving this document. Submit your feedback at http://bit.ly/isi-docfeedback._________________
___________________________
Hardware
Page
23
You could have arrived here from:
Page 12 - Network (5)
Page 19 - Network (12)
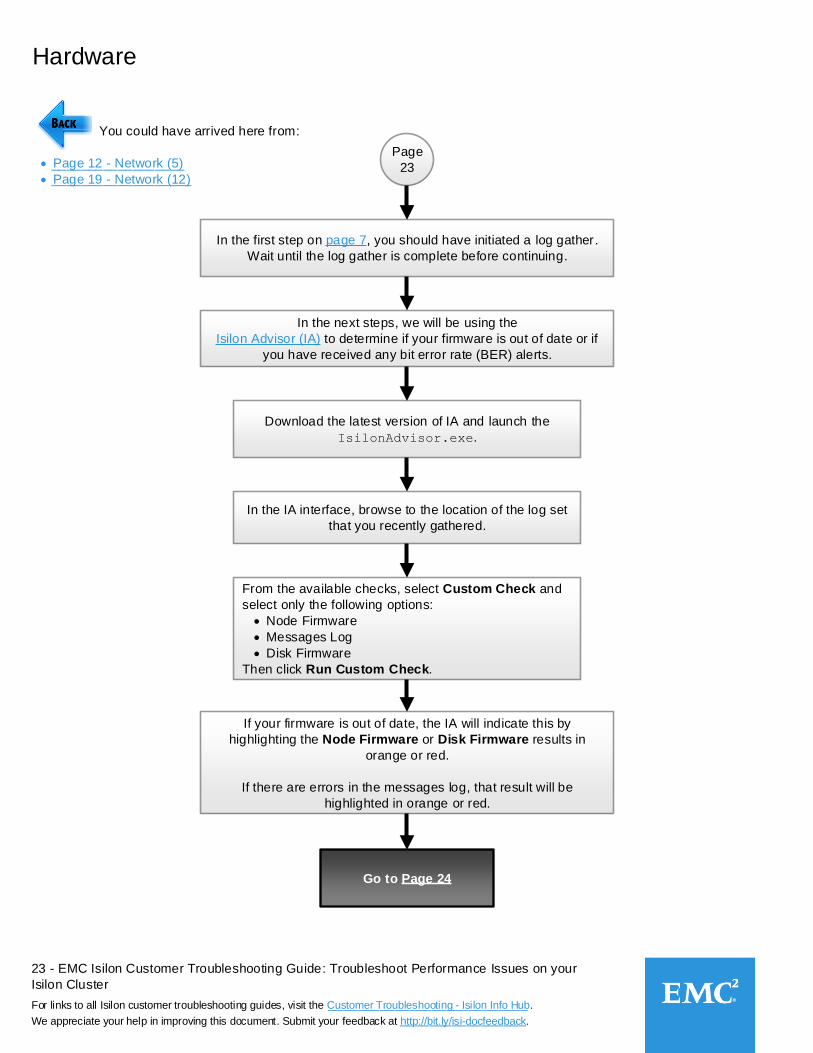
In the first step on page 7, you should have initiated a log gather.
Wait until the log gather is complete before continuing.
In the next steps, we will be using the
Isilon Advisor (IA) to determine if your firmware is out of date or if
you have received any bit error rate (BER) alerts.
In the IA interface, browse to the location of the log set
that you recently gathered.
From the available checks, select Custom Check and
select only the following options:
Node Firmware
Messages Log
Disk Firmware
Then click Run Custom Check.
Go to Page 24
Download the latest version of IA and launch the
IsilonAdvisor.exe.
__________________
___________________
If your firmware is out of date, the IA will indicate this by
highlighting the Node Firmware or Disk Firmware results in
orange or red.
If there are errors in the messages log, that result will be
highlighted in orange or red.
24 - EMC Isilon Customer Troubleshooting Guide: Troubleshoot Performance Issues on your
Isilon Cluster
For links to all Isilon customer troubleshooting guides, visit the Customer Troubleshooting - Isilon Info Hub.
We appreciate your help in improving this document. Submit your feedback at http://bit.ly/isi-docfeedback._________________
___________________________
Hardware (2)
Page
24
You could have arrived here from:
Page 23 - Hardware
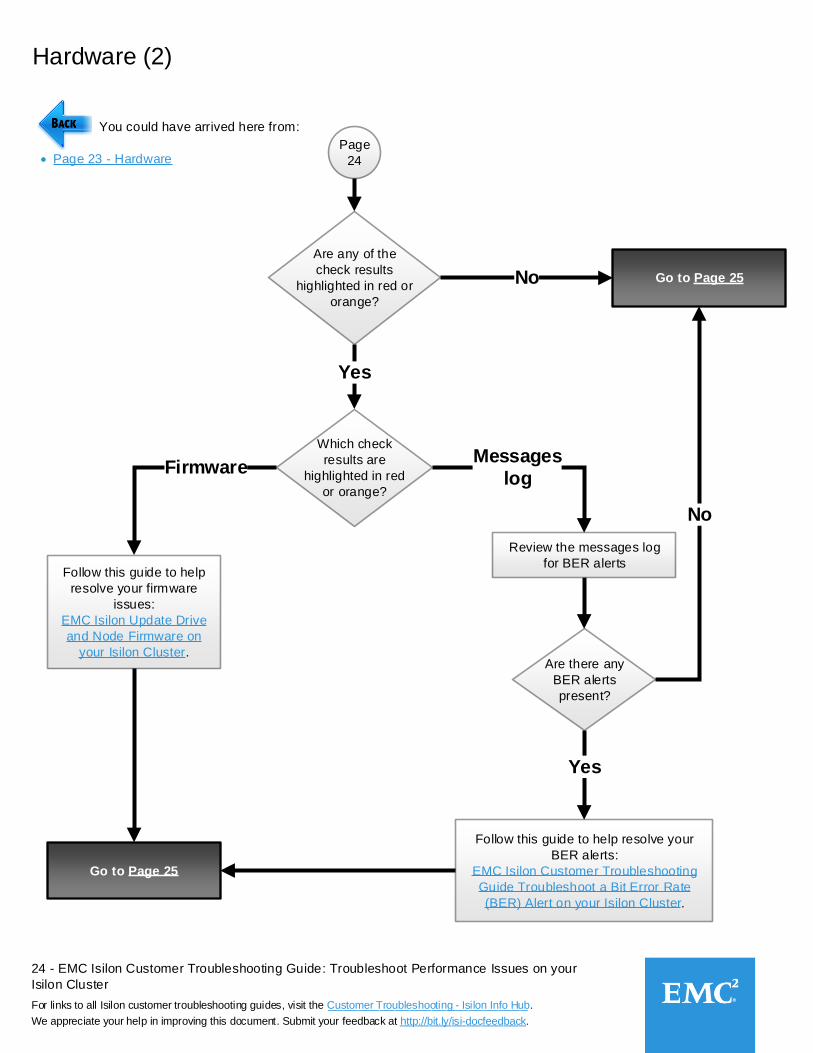
Are any of the
check results
highlighted in red or
orange?
Go to Page 25No
Which check
results are
highlighted in red
or orange?
Yes
Follow this guide to help
resolve your firmware
issues:
EMC Isilon Update Drive
and Node Firmware on
your Isilon Cluster.
Follow this guide to help resolve your
BER alerts:
EMC Isilon Customer Troubleshooting
Guide Troubleshoot a Bit Error Rate
(BER) Alert on your Isilon Cluster.
FirmwareMessages
log
Go to Page 25
Review the messages log
for BER alerts
Are there any
BER alerts
present?
Yes
No
25 - EMC Isilon Customer Troubleshooting Guide: Troubleshoot Performance Issues on your
Isilon Cluster
For links to all Isilon customer troubleshooting guides, visit the Customer Troubleshooting - Isilon Info Hub.
We appreciate your help in improving this document. Submit your feedback at http://bit.ly/isi-docfeedback._________________
___________________________
Hardware (3)
Page
25
You could have arrived here from:
Page 24 - Hardware (2)
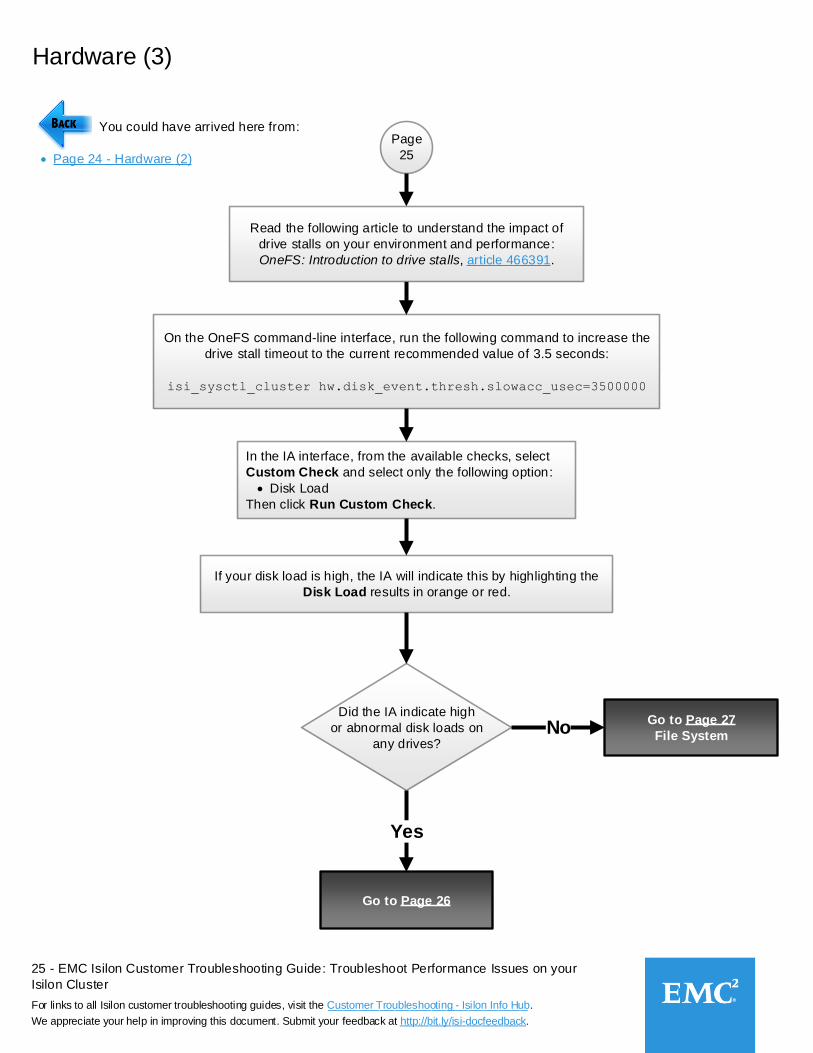
On the OneFS command-line interface, run the following command to increase the
drive stall timeout to the current recommended value of 3.5 seconds:
isi_sysctl_cluster hw.disk_event.thresh.slowacc_usec=3500000
In the IA interface, from the available checks, select
Custom Check and select only the following option:
Disk Load
Then click Run Custom Check.
Did the IA indicate high
or abnormal disk loads on
any drives?
Go to Page 27
File SystemNo
Go to Page 26
Yes
Read the following article to understand the impact of
drive stalls on your environment and performance:
OneFS: Introduction to drive stalls, article 466391.
If your disk load is high, the IA will indicate this by highlighting the
Disk Load results in orange or red.
26 - EMC Isilon Customer Troubleshooting Guide: Troubleshoot Performance Issues on your
Isilon Cluster
For links to all Isilon customer troubleshooting guides, visit the Customer Troubleshooting - Isilon Info Hub.
We appreciate your help in improving this document. Submit your feedback at http://bit.ly/isi-docfeedback._________________
___________________________
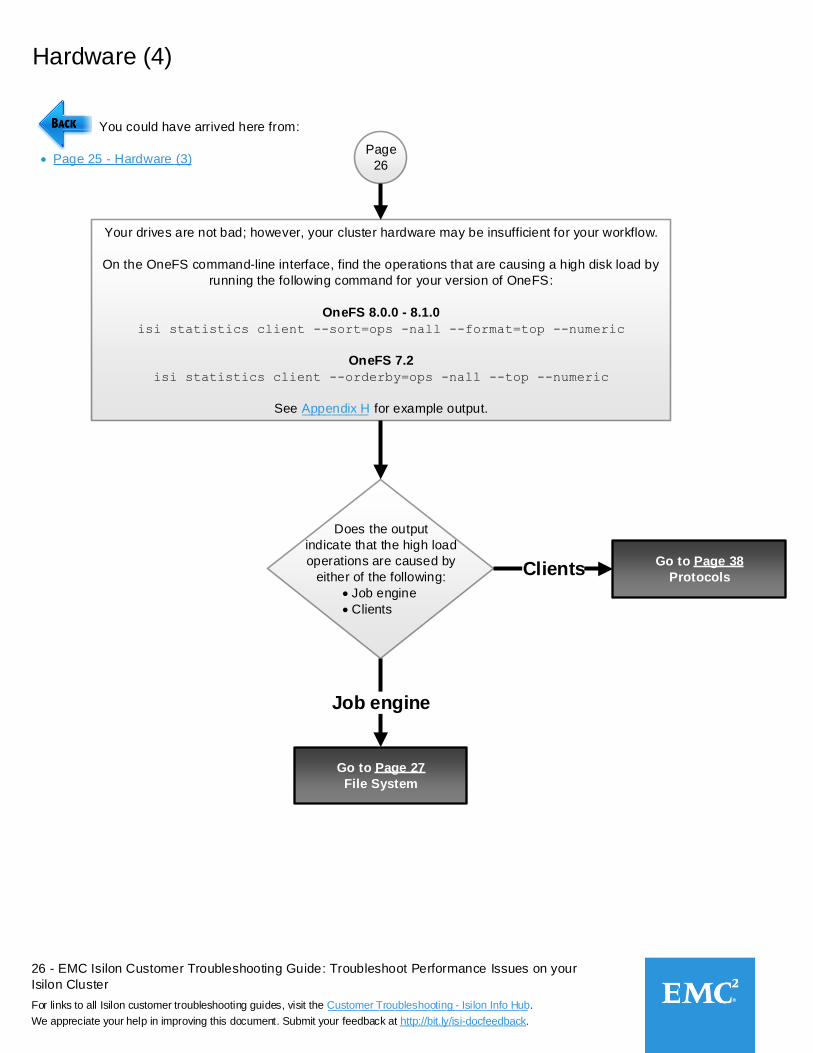
Hardware (4)
Page
26
You could have arrived here from:
Page 25 - Hardware (3)
Your drives are not bad; however, your cluster hardware may be insufficient for your workflow.
On the OneFS command-line interface, find the operations that are causing a high disk load by
running the following command for your version of OneFS:
OneFS 8.0.0 - 8.1.0
isi statistics client --sort=ops -nall --format=top --numeric
OneFS 7.2
isi statistics client --orderby=ops -nall --top --numeric
See Appendix H for example output.
Does the output
indicate that the high load
operations are caused by
either of the following:
Job engine
Clients
Go to Page 27
File System
Job engine
Go to Page 38
ProtocolsClients
_________
27 - EMC Isilon Customer Troubleshooting Guide: Troubleshoot Performance Issues on your
Isilon Cluster
For links to all Isilon customer troubleshooting guides, visit the Customer Troubleshooting - Isilon Info Hub.
We appreciate your help in improving this document. Submit your feedback at http://bit.ly/isi-docfeedback._________________
___________________________
File system
Page
27
You could have arrived here from:
Page 25 - Hardware (3)
Page 26 - Hardware (4)
Atime is the file access time and, when enabled,
is updated every time a file is accessed.
Check to see whether atime is enabled by
running the following command:
sysctl efs.bam.atime_enabled
See the box on this page for example output.
Is atime
enabled?
Optional:
Disable atime by performing the following steps
from the OneFS Web Administration Interface:
Go to File System > File System Settings and
uncheck the box for Enable access time
tracking.
Yes
Example sysctl efs.bam.atime_enabled output
Example of disabled atime:
cluster-1# sysctl efs.bam.atime_enabled
efs.bam.atime_enabled: 0
Example of enabled atime:
cluster-1# sysctl efs.bam.atime_enabled=1
efs.bam.atime_enabled: 0 -> 1
cluster-1# sysctl efs.bam.atime_enabled
efs.bam.atime_enabled: 1
Go to Page 28No
Go to Page 28
Note In OneFS, atime is disabled by default.
However, if your workflow requires atime,
you can set a grace period by following the
instructions in OneFS: How to enable
access time tracking (atime), article 303681.
This grace period is the minimum amount of
time that must pass between file accesses
before OneFS will update the last-accessed
time. Using the grace period reduces the
performance penalty from recording atime
on every file access.
___________________
___________________
28 - EMC Isilon Customer Troubleshooting Guide: Troubleshoot Performance Issues on your
Isilon Cluster
For links to all Isilon customer troubleshooting guides, visit the Customer Troubleshooting - Isilon Info Hub.
We appreciate your help in improving this document. Submit your feedback at http://bit.ly/isi-docfeedback._________________
___________________________
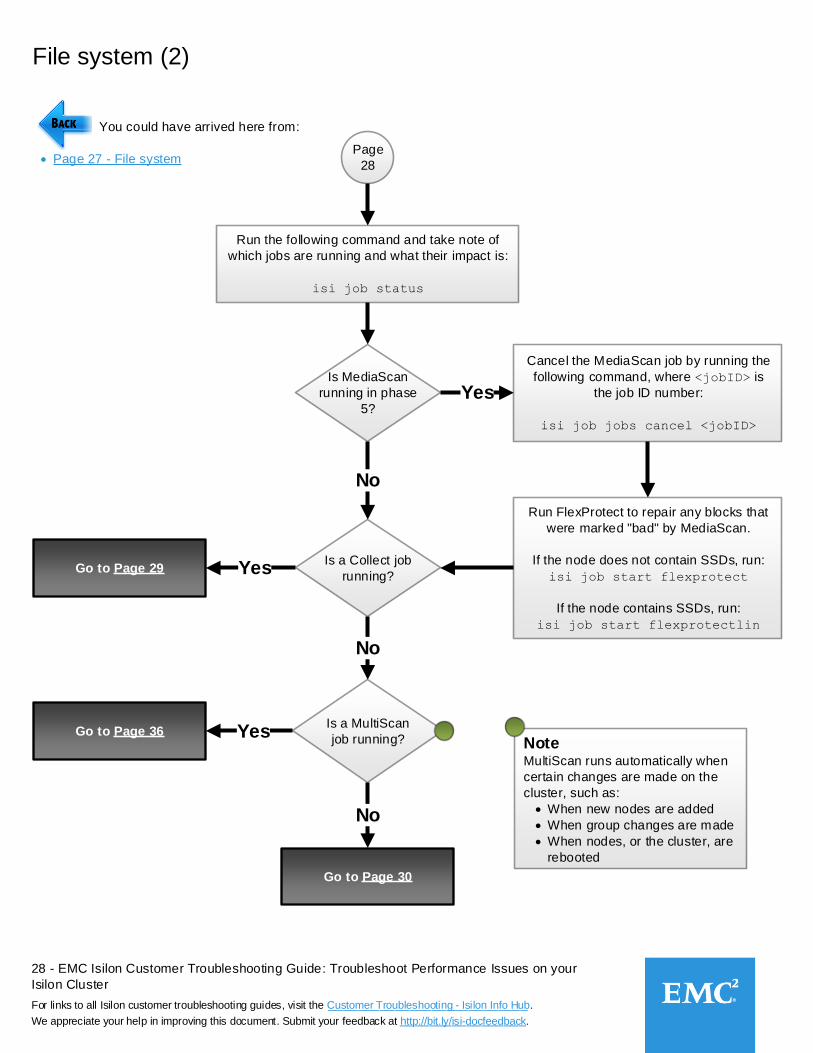
File system (2)
Page
28
You could have arrived here from:
Page 27 - File system
Run the following command and take note of
which jobs are running and what their impact is:
isi job status
Is MediaScan
running in phase
5?
Cancel the MediaScan job by running the
following command, where <jobID> is
the job ID number:
isi job jobs cancel <jobID>
Yes
Is a Collect job
running?
No
Run FlexProtect to repair any blocks that
were marked "bad" by MediaScan.
If the node does not contain SSDs, run:
isi job start flexprotect
If the node contains SSDs, run:
isi job start flexprotectlin
Go to Page 29 Yes
Go to Page 30
No
Is a MultiScan
job running?
No
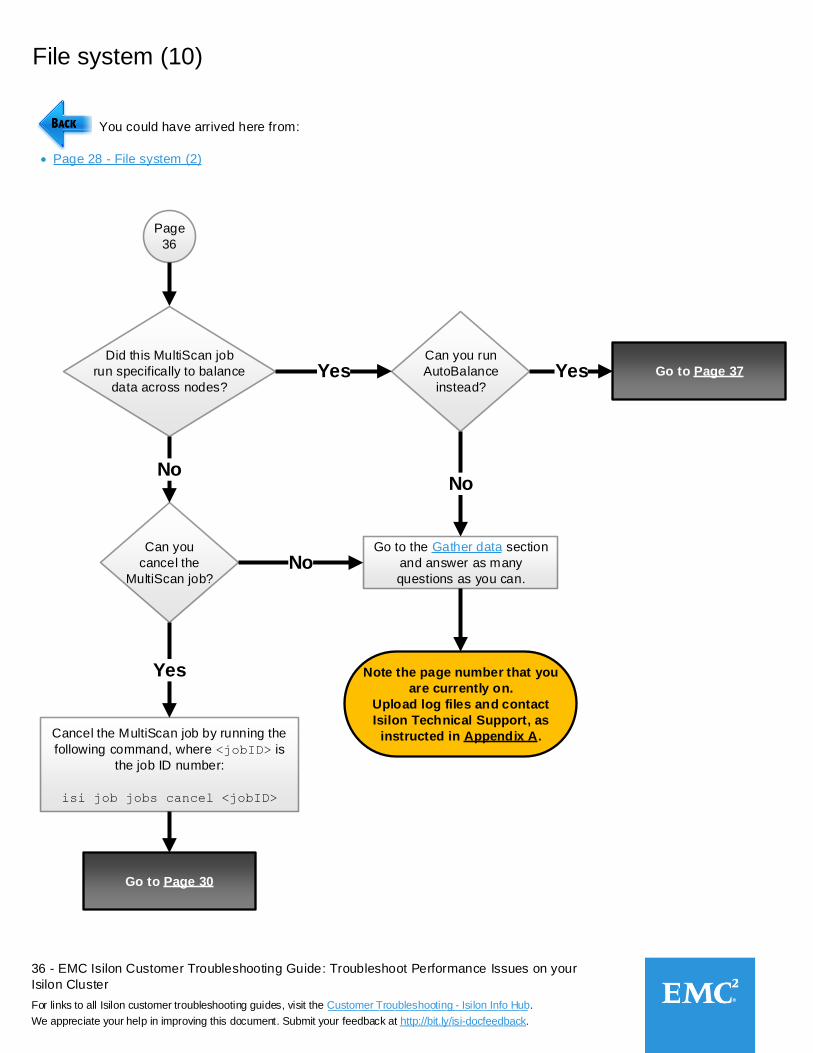
Go to Page 36 YesNote MultiScan runs automatically when
certain changes are made on the
cluster, such as:
When new nodes are added
When group changes are made
When nodes, or the cluster, are
rebooted
29 - EMC Isilon Customer Troubleshooting Guide: Troubleshoot Performance Issues on your
Isilon Cluster
For links to all Isilon customer troubleshooting guides, visit the Customer Troubleshooting - Isilon Info Hub.
We appreciate your help in improving this document. Submit your feedback at http://bit.ly/isi-docfeedback._________________
___________________________
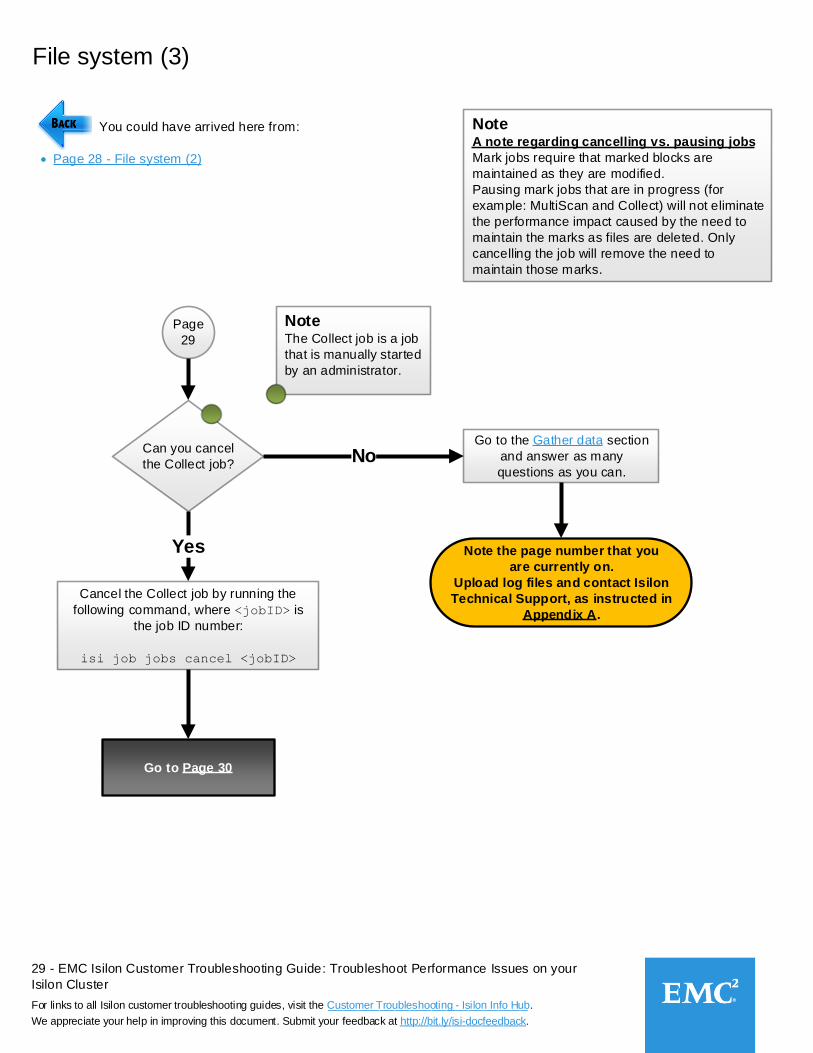
File system (3)
Page
29
You could have arrived here from:
Page 28 - File system (2)
Can you cancel
the Collect job?
Note the page number that you
are currently on.
Upload log files and contact Isilon
Technical Support, as instructed in
Appendix A.
Go to the Gather data section
and answer as many
questions as you can.No
Cancel the Collect job by running the
following command, where <jobID> is
the job ID number:
isi job jobs cancel <jobID>
Yes
Note The Collect job is a job
that is manually started
by an administrator.
Note A note regarding cancelling vs. pausing jobs
Mark jobs require that marked blocks are
maintained as they are modified.
Pausing mark jobs that are in progress (for
example: MultiScan and Collect) will not eliminate
the performance impact caused by the need to
maintain the marks as files are deleted. Only
cancelling the job will remove the need to
maintain those marks.
Go to Page 30
30 - EMC Isilon Customer Troubleshooting Guide: Troubleshoot Performance Issues on your
Isilon Cluster
For links to all Isilon customer troubleshooting guides, visit the Customer Troubleshooting - Isilon Info Hub.
We appreciate your help in improving this document. Submit your feedback at http://bit.ly/isi-docfeedback._________________
___________________________
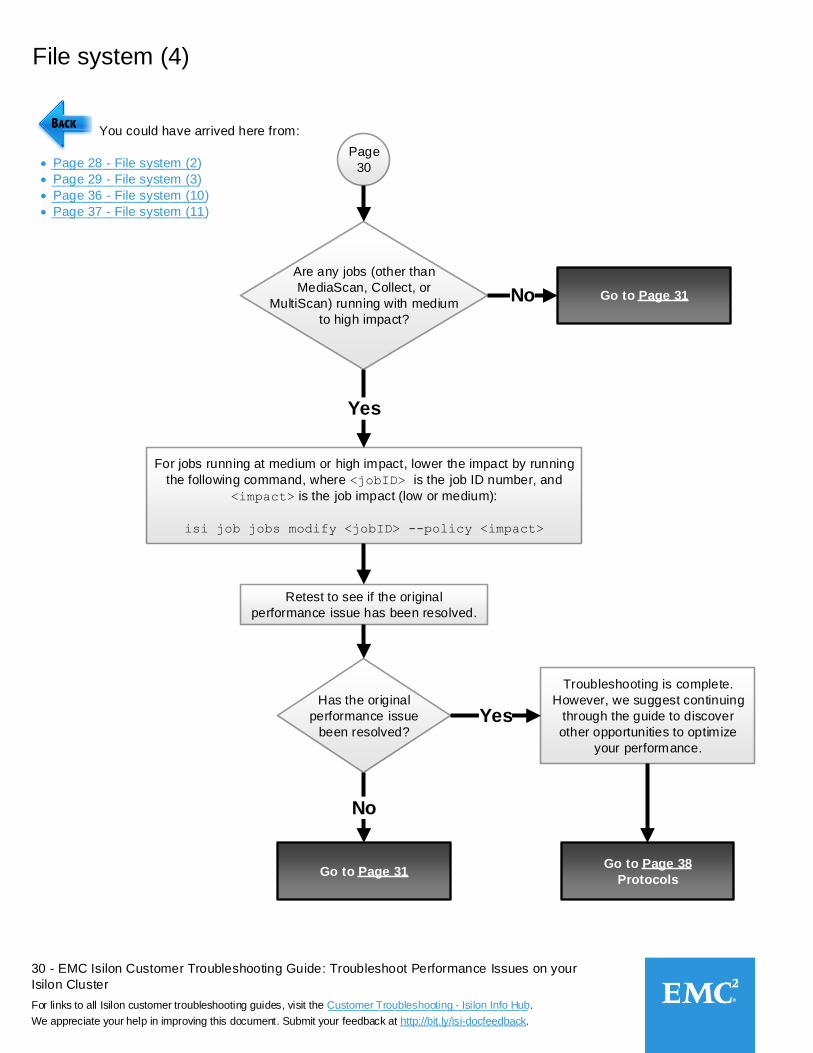
File system (4)
Page
30
You could have arrived here from:
Page 28 - File system (2)
Page 29 - File system (3)
Page 36 - File system (10)
Page 37 - File system (11)
Are any jobs (other than
MediaScan, Collect, or
MultiScan) running with medium
to high impact?
For jobs running at medium or high impact, lower the impact by running
the following command, where <jobID> is the job ID number, and
<impact> is the job impact (low or medium):
isi job jobs modify <jobID> --policy <impact>
Yes
Retest to see if the original
performance issue has been resolved.
Has the original
performance issue
been resolved?
Troubleshooting is complete.
However, we suggest continuing
through the guide to discover
other opportunities to optimize
your performance.
Yes
Go to Page 38
ProtocolsGo to Page 31
No
Go to Page 31No
____________________
____________________
_____________________
_____________________
31 - EMC Isilon Customer Troubleshooting Guide: Troubleshoot Performance Issues on your
Isilon Cluster
For links to all Isilon customer troubleshooting guides, visit the Customer Troubleshooting - Isilon Info Hub.
We appreciate your help in improving this document. Submit your feedback at http://bit.ly/isi-docfeedback._________________
___________________________
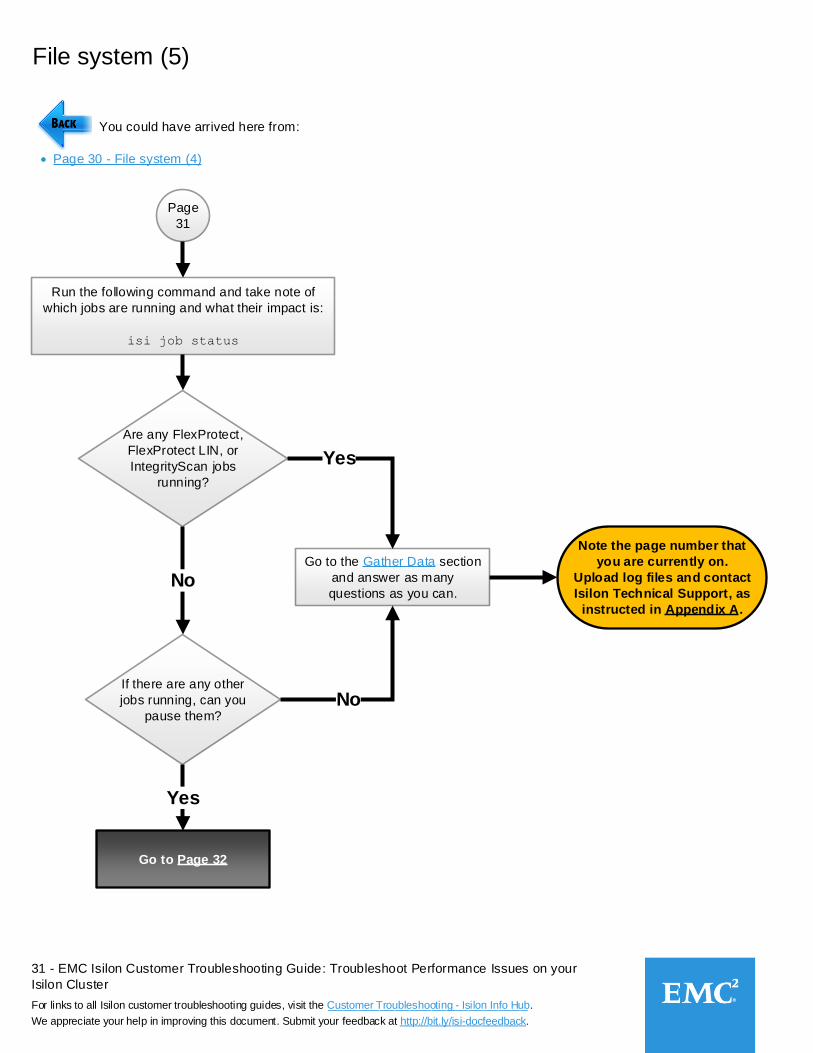
File system (5)
Page
31
You could have arrived here from:
Page 30 - File system (4)
Are any FlexProtect,
FlexProtect LIN, or
IntegrityScan jobs
running?
Yes
Note the page number that
you are currently on.
Upload log files and contact
Isilon Technical Support, as
instructed in Appendix A.
Go to the Gather Data section
and answer as many
questions as you can.No
If there are any other
jobs running, can you
pause them?No
Go to Page 32
Yes
Run the following command and take note of
which jobs are running and what their impact is:
isi job status
32 - EMC Isilon Customer Troubleshooting Guide: Troubleshoot Performance Issues on your
Isilon Cluster
For links to all Isilon customer troubleshooting guides, visit the Customer Troubleshooting - Isilon Info Hub.
We appreciate your help in improving this document. Submit your feedback at http://bit.ly/isi-docfeedback._________________
___________________________
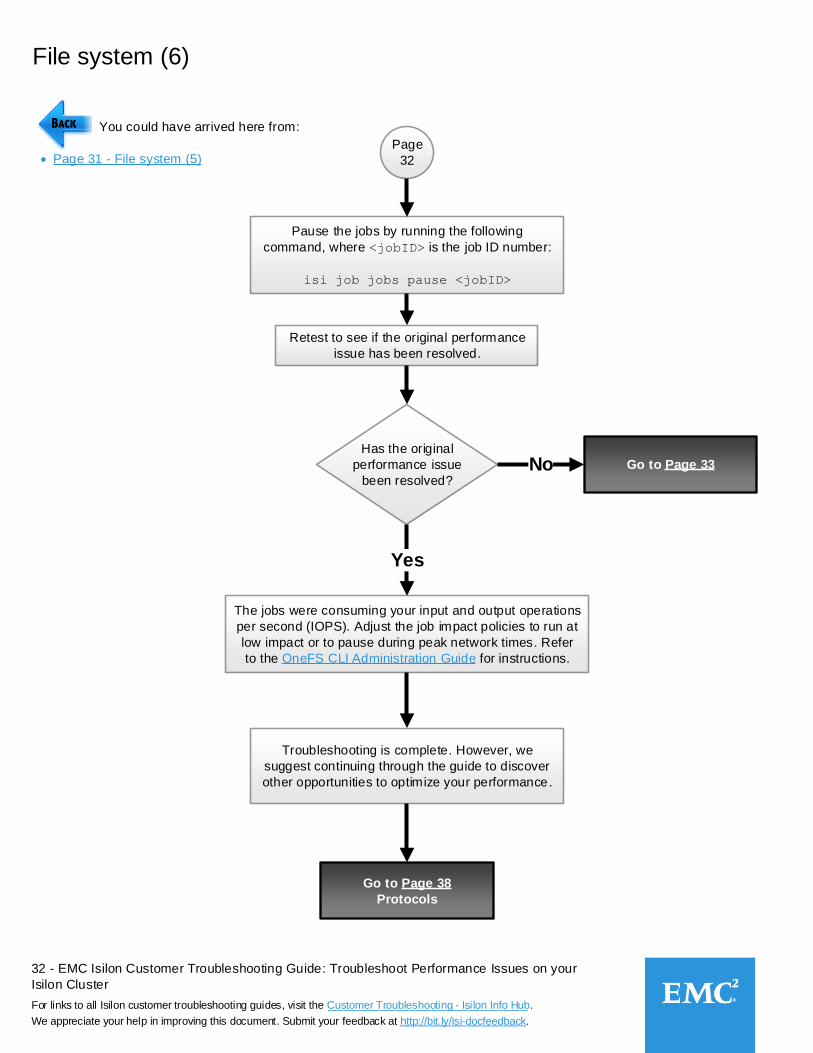
File system (6)
Page
32
You could have arrived here from:
Page 31 - File system (5)
Pause the jobs by running the following
command, where <jobID> is the job ID number:
isi job jobs pause <jobID>
Has the original
performance issue
been resolved?
Retest to see if the original performance
issue has been resolved.
Yes
The jobs were consuming your input and output operations
per second (IOPS). Adjust the job impact policies to run at
low impact or to pause during peak network times. Refer
to the OneFS CLI Administration Guide for instructions.
Troubleshooting is complete. However, we
suggest continuing through the guide to discover
other opportunities to optimize your performance.
Go to Page 38
Protocols
Go to Page 33No
33 - EMC Isilon Customer Troubleshooting Guide: Troubleshoot Performance Issues on your
Isilon Cluster
For links to all Isilon customer troubleshooting guides, visit the Customer Troubleshooting - Isilon Info Hub.
We appreciate your help in improving this document. Submit your feedback at http://bit.ly/isi-docfeedback._________________
___________________________
File system (7)
Page
33
You could have arrived here from:
Page 32 - File system (6)
Check for high CPU usage on all nodes by
running the following command:
isi_for_array -s "top | head -n 15"
See Appendix C for example output.
Is any particular
process using over
400% CPU?
Note The following processes take 100%
CPU or more:
lwio
lsass
job processes
SyncIQ
NFS and SMB
Go to Page 34No
Yes
Which processes
are using over 400%
CPU?
Go to Page 39
Protocols - SMBSMB
Any other process
Note the page number that you
are currently on.
Upload log files and contact Isilon Technical
Support, as instructed in Appendix A.
Go to Page 51
Protocols - NFSNFS
Go to the Gather data section
and answer as many
questions as you can.
_________
34 - EMC Isilon Customer Troubleshooting Guide: Troubleshoot Performance Issues on your
Isilon Cluster
For links to all Isilon customer troubleshooting guides, visit the Customer Troubleshooting - Isilon Info Hub.
We appreciate your help in improving this document. Submit your feedback at http://bit.ly/isi-docfeedback._________________
___________________________
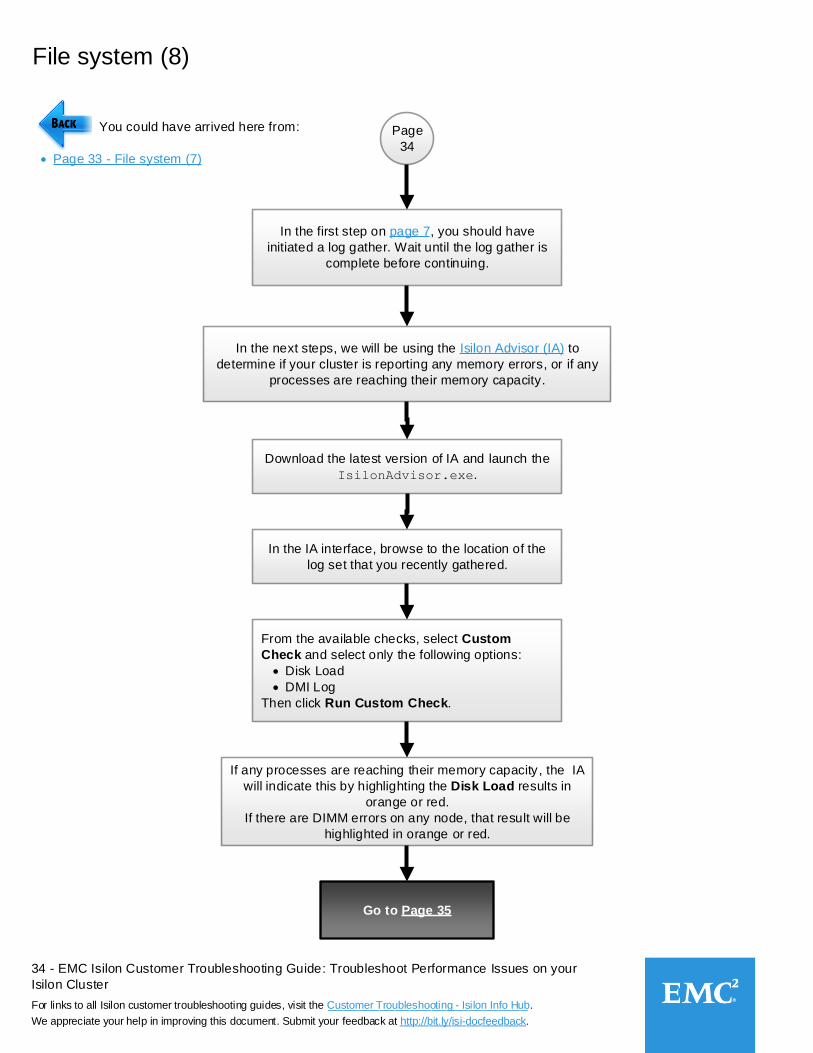
File system (8)
Page
34
You could have arrived here from:
Page 33 - File system (7)
In the first step on page 7, you should have
initiated a log gather. Wait until the log gather is
complete before continuing.
In the next steps, we will be using the Isilon Advisor (IA) to
determine if your cluster is reporting any memory errors, or if any
processes are reaching their memory capacity.
In the IA interface, browse to the location of the
log set that you recently gathered.
From the available checks, select Custom
Check and select only the following options:
Disk Load
DMI Log
Then click Run Custom Check.
Download the latest version of IA and launch the
IsilonAdvisor.exe.
Go to Page 35
If any processes are reaching their memory capacity, the IA
will indicate this by highlighting the Disk Load results in
orange or red.
If there are DIMM errors on any node, that result will be
highlighted in orange or red.
35 - EMC Isilon Customer Troubleshooting Guide: Troubleshoot Performance Issues on your
Isilon Cluster
For links to all Isilon customer troubleshooting guides, visit the Customer Troubleshooting - Isilon Info Hub.
We appreciate your help in improving this document. Submit your feedback at http://bit.ly/isi-docfeedback._________________
___________________________
File system (9)
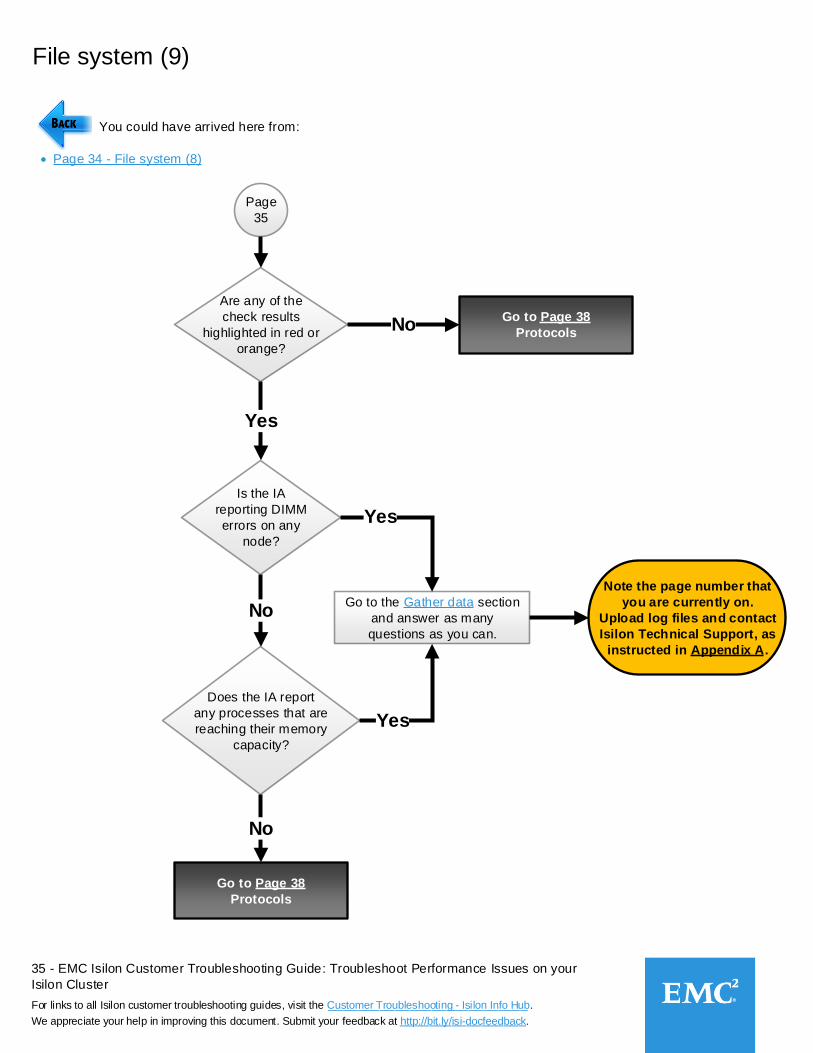
Page
35
You could have arrived here from:
Page 34 - File system (8)
Is the IA
reporting DIMM
errors on any
node?
Are any of the
check results
highlighted in red or
orange?
Yes
Note the page number that
you are currently on.
Upload log files and contact
Isilon Technical Support, as
instructed in Appendix A.
Go to the Gather data section
and answer as many
questions as you can.
Yes
Does the IA report
any processes that are
reaching their memory
capacity?
No
Yes
Go to Page 38
Protocols
No
NoGo to Page 38
Protocols
36 - EMC Isilon Customer Troubleshooting Guide: Troubleshoot Performance Issues on your
Isilon Cluster
For links to all Isilon customer troubleshooting guides, visit the Customer Troubleshooting - Isilon Info Hub.
We appreciate your help in improving this document. Submit your feedback at http://bit.ly/isi-docfeedback._________________
___________________________
File system (10)
Page
36
You could have arrived here from:
Page 28 - File system (2)
Did this MultiScan job
run specifically to balance
data across nodes?
No
Can you
cancel the
MultiScan job?
Yes
Cancel the MultiScan job by running the
following command, where <jobID> is
the job ID number:
isi job jobs cancel <jobID>
Go to Page 30
YesCan you run
AutoBalance
instead?
Note the page number that you
are currently on.
Upload log files and contact
Isilon Technical Support, as
instructed in Appendix A.
Go to the Gather data section
and answer as many
questions as you can.
No
No
Go to Page 37Yes
37 - EMC Isilon Customer Troubleshooting Guide: Troubleshoot Performance Issues on your
Isilon Cluster
For links to all Isilon customer troubleshooting guides, visit the Customer Troubleshooting - Isilon Info Hub.
We appreciate your help in improving this document. Submit your feedback at http://bit.ly/isi-docfeedback._________________
___________________________
File system (11)
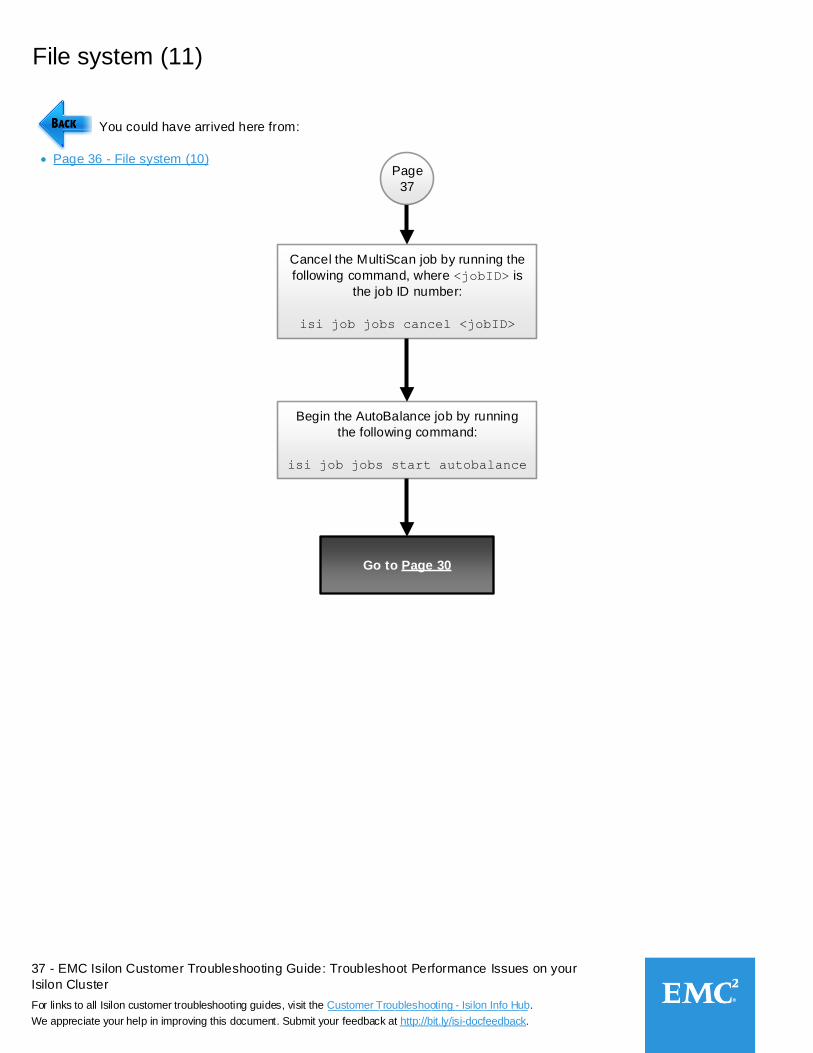
Page
37
You could have arrived here from:
Page 36 - File system (10)
Cancel the MultiScan job by running the
following command, where <jobID> is
the job ID number:
isi job jobs cancel <jobID>
Begin the AutoBalance job by running
the following command:
isi job jobs start autobalance
Go to Page 30
38 - EMC Isilon Customer Troubleshooting Guide: Troubleshoot Performance Issues on your
Isilon Cluster
For links to all Isilon customer troubleshooting guides, visit the Customer Troubleshooting - Isilon Info Hub.
We appreciate your help in improving this document. Submit your feedback at http://bit.ly/isi-docfeedback._________________
___________________________
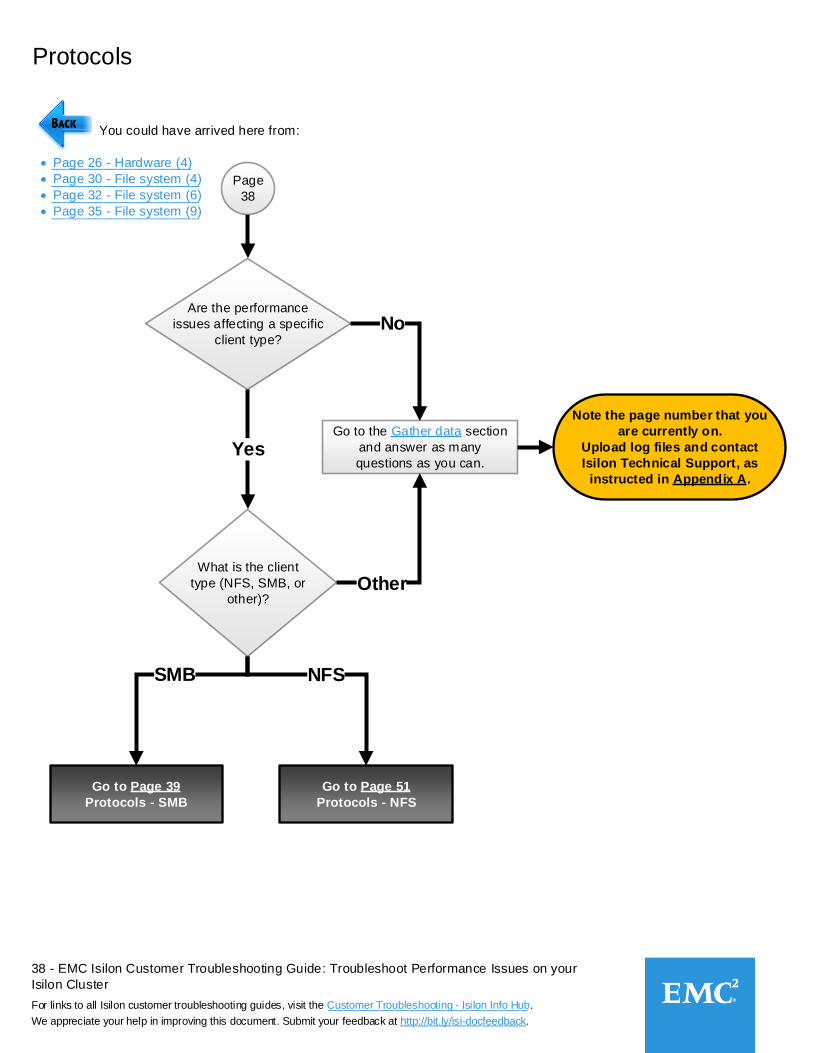
Protocols
Page
38
You could have arrived here from:
Page 26 - Hardware (4)
Page 30 - File system (4)
Page 32 - File system (6)
Page 35 - File system (9)
Are the performance
issues affecting a specific
client type?
Note the page number that you
are currently on.
Upload log files and contact
Isilon Technical Support, as
instructed in Appendix A.
Go to the Gather data section
and answer as many
questions as you can.
No
Yes
What is the client
type (NFS, SMB, or
other)?
Go to Page 51
Protocols - NFS
Go to Page 39
Protocols - SMB
NFSSMB
Other
___________________
____________________
____________________
____________________
39 - EMC Isilon Customer Troubleshooting Guide: Troubleshoot Performance Issues on your
Isilon Cluster
For links to all Isilon customer troubleshooting guides, visit the Customer Troubleshooting - Isilon Info Hub.
We appreciate your help in improving this document. Submit your feedback at http://bit.ly/isi-docfeedback._________________
___________________________
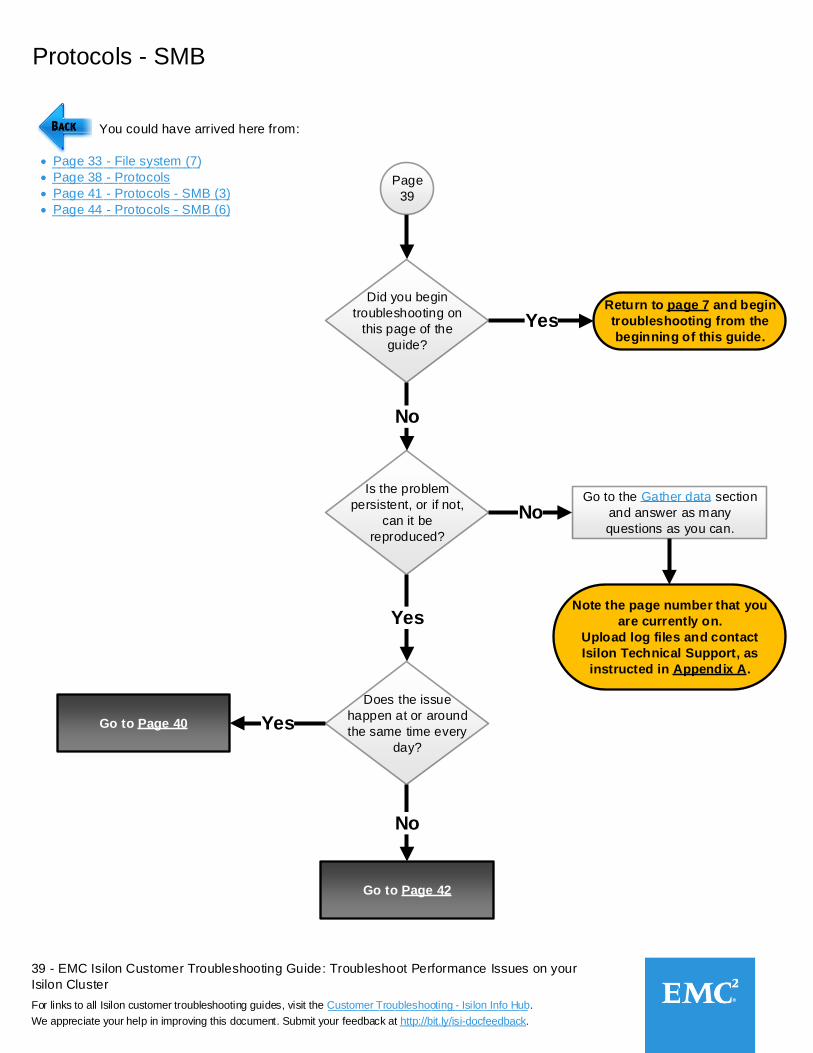
Protocols - SMB
Page
39
You could have arrived here from:
Page 33 - File system (7)
Page 38 - Protocols
Page 41 - Protocols - SMB (3)
Page 44 - Protocols - SMB (6)
Did you begin
troubleshooting on
this page of the
guide?
Return to page 7 and begin
troubleshooting from the
beginning of this guide.Yes
No
Is the problem
persistent, or if not,
can it be
reproduced?
Note the page number that you
are currently on.
Upload log files and contact
Isilon Technical Support, as
instructed in Appendix A.
Go to the Gather data section
and answer as many
questions as you can.No
Yes
Does the issue
happen at or around
the same time every
day?
Go to Page 40
Go to Page 42
No
Yes
____________________
________________________
________________________
________________
40 - EMC Isilon Customer Troubleshooting Guide: Troubleshoot Performance Issues on your
Isilon Cluster
For links to all Isilon customer troubleshooting guides, visit the Customer Troubleshooting - Isilon Info Hub.
We appreciate your help in improving this document. Submit your feedback at http://bit.ly/isi-docfeedback._________________
___________________________
Protocols - SMB (2)
Page
40
Does the performance issue
occur when the user logs in to
the client, or when the client first
accesses the cluster?
Go to Page 42Neither
scenario
Are you using
SmartConnect?
Either or both
scenarios
Yes Go to Page 41
No
Go to Page 50
You could have arrived here from:
Page 39 - Protocols - SMB
Refer toOneFS: Intermittent slow SMB authentication
or share enumeration performance;
isi_cbind_d DNS delays, article 513927
Note If the DNS cache is already
disabled, or you if you are running
any of these OneFS versions:
8.0.0.6
8.0.1.3
8.1.0.2
8.1.1.1
Contact Isilon Support for further
assistance.
41 - EMC Isilon Customer Troubleshooting Guide: Troubleshoot Performance Issues on your
Isilon Cluster
For links to all Isilon customer troubleshooting guides, visit the Customer Troubleshooting - Isilon Info Hub.
We appreciate your help in improving this document. Submit your feedback at http://bit.ly/isi-docfeedback._________________
___________________________
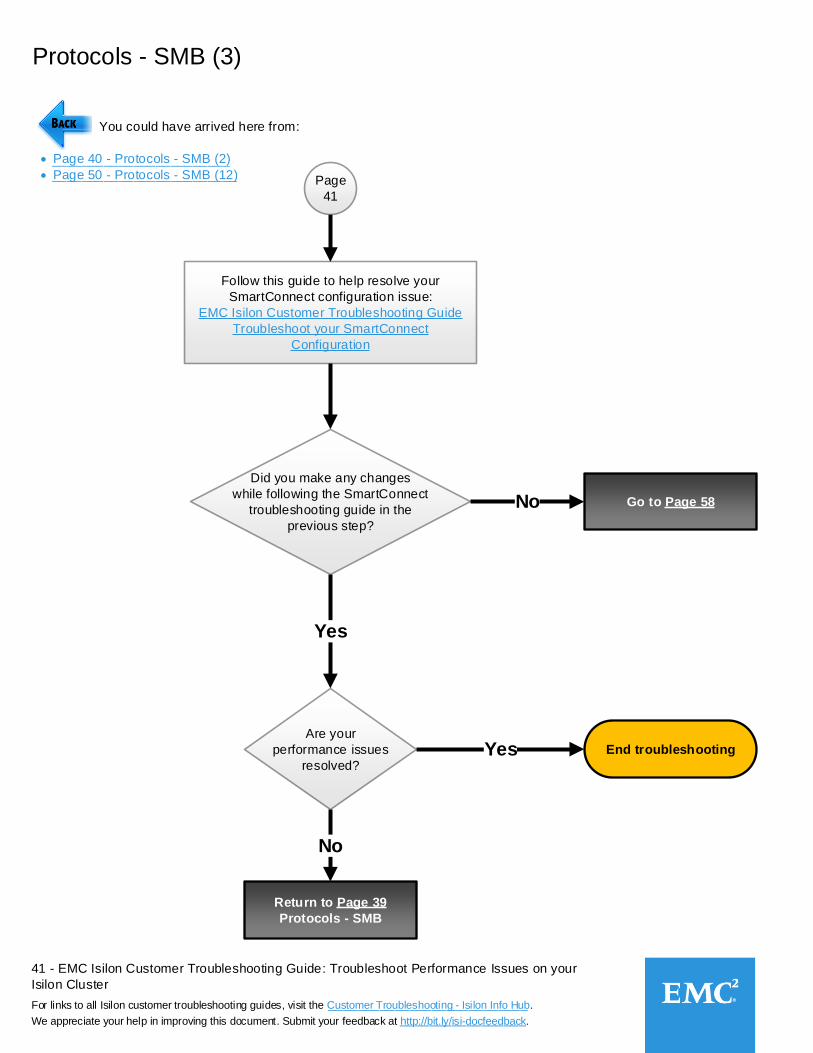
Protocols - SMB (3)
Page
41
You could have arrived here from:
Page 40 - Protocols - SMB (2)
Page 50 - Protocols - SMB (12)
Did you make any changes
while following the SmartConnect
troubleshooting guide in the
previous step?
Go to Page 58No
Yes
Are your
performance issues
resolved?Yes
No
Return to Page 39
Protocols - SMB
End troubleshooting
Follow this guide to help resolve your
SmartConnect configuration issue:
EMC Isilon Customer Troubleshooting Guide
Troubleshoot your SmartConnect
Configuration
________________________
_________________________
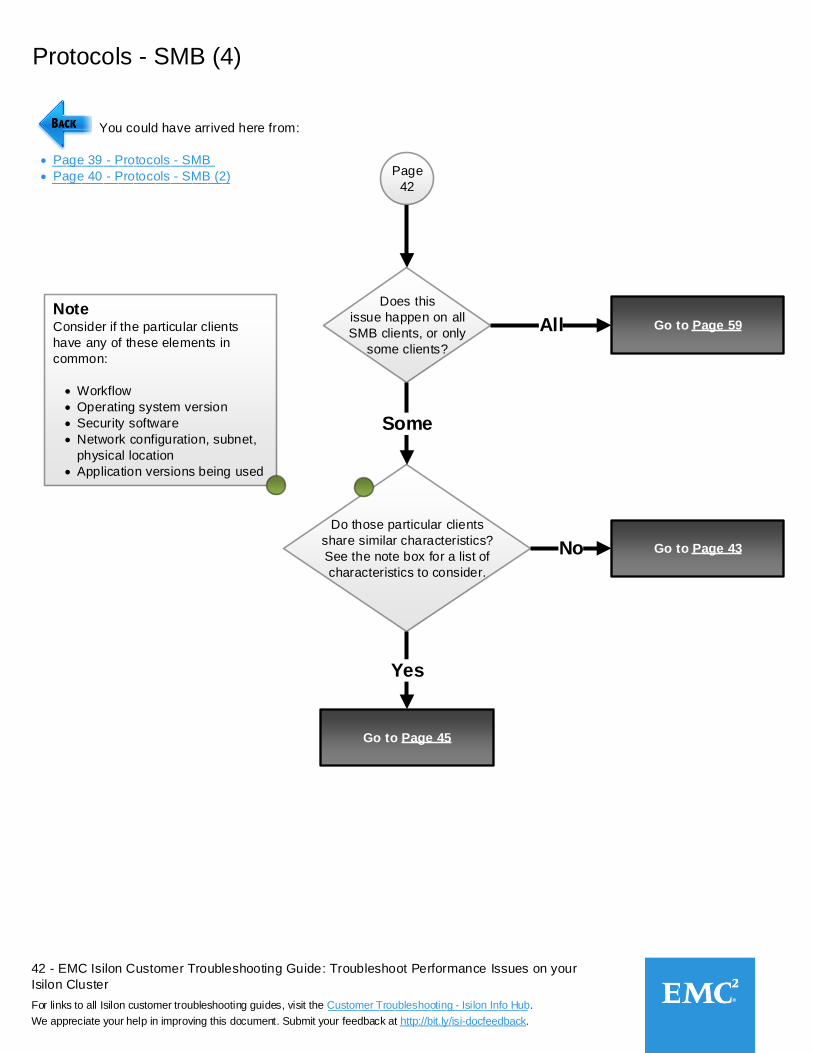
42 - EMC Isilon Customer Troubleshooting Guide: Troubleshoot Performance Issues on your
Isilon Cluster
For links to all Isilon customer troubleshooting guides, visit the Customer Troubleshooting - Isilon Info Hub.
We appreciate your help in improving this document. Submit your feedback at http://bit.ly/isi-docfeedback._________________
___________________________
Protocols - SMB (4)
Page
42
You could have arrived here from:
Page 39 - Protocols - SMB
Page 40 - Protocols - SMB (2)
Does this
issue happen on all
SMB clients, or only
some clients?
Go to Page 59All
Do those particular clients
share similar characteristics?
See the note box for a list of
characteristics to consider.
Some
Note Consider if the particular clients
have any of these elements in
common:
Workflow
Operating system version
Security software
Network configuration, subnet,
physical location
Application versions being used
Go to Page 43No
Go to Page 45
Yes
______________________
________________________
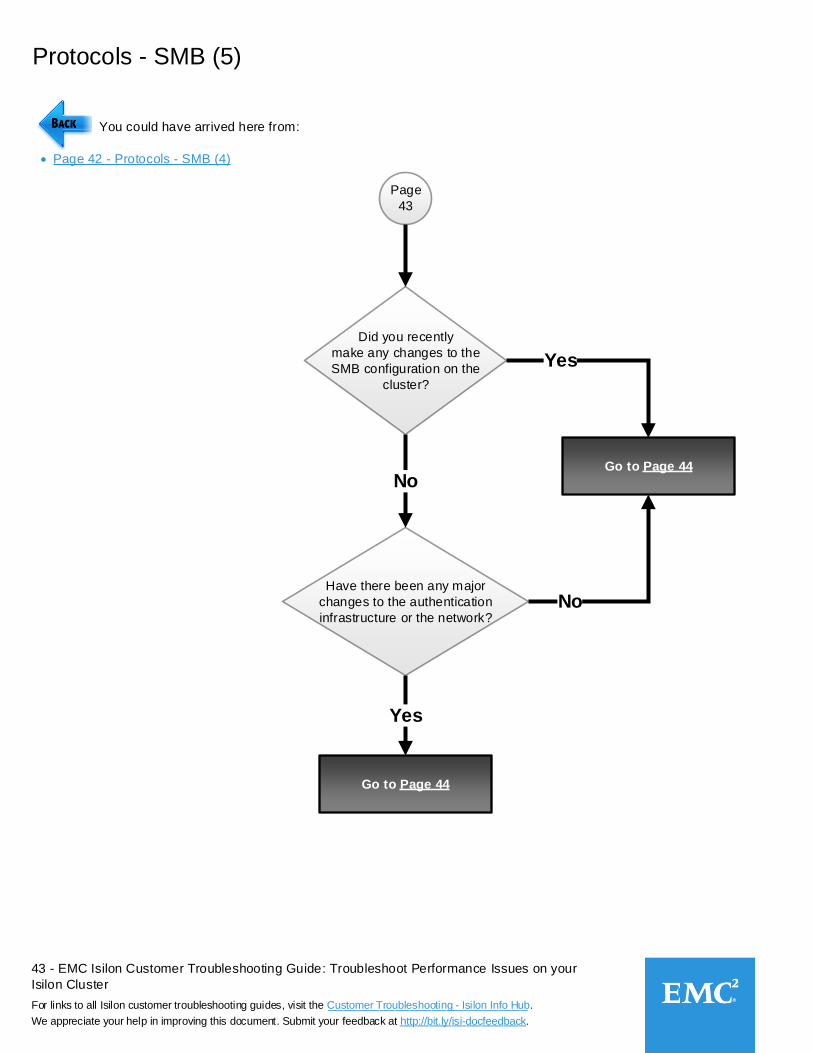
43 - EMC Isilon Customer Troubleshooting Guide: Troubleshoot Performance Issues on your
Isilon Cluster
For links to all Isilon customer troubleshooting guides, visit the Customer Troubleshooting - Isilon Info Hub.
We appreciate your help in improving this document. Submit your feedback at http://bit.ly/isi-docfeedback._________________
___________________________
Protocols - SMB (5)
Page
43
You could have arrived here from:
Page 42 - Protocols - SMB (4)
Did you recently
make any changes to the
SMB configuration on the
cluster?
Yes
No
Have there been any major
changes to the authentication
infrastructure or the network?No
Go to Page 44
Go to Page 44
Yes
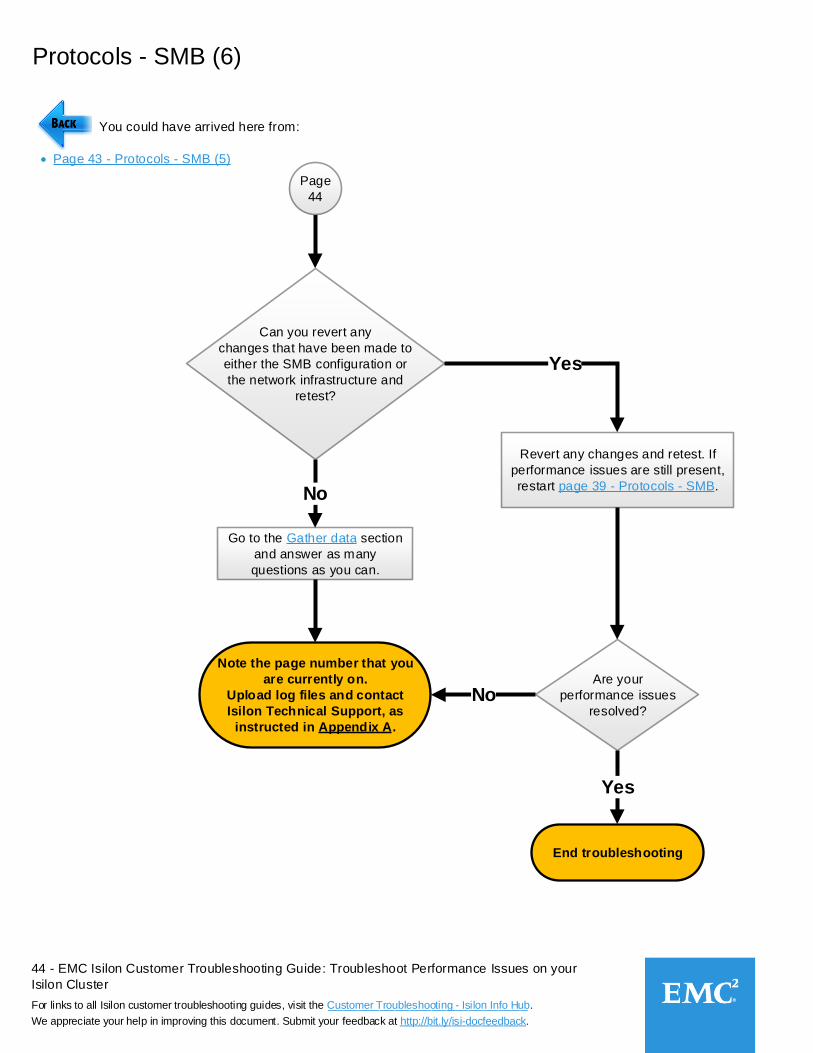
44 - EMC Isilon Customer Troubleshooting Guide: Troubleshoot Performance Issues on your
Isilon Cluster
For links to all Isilon customer troubleshooting guides, visit the Customer Troubleshooting - Isilon Info Hub.
We appreciate your help in improving this document. Submit your feedback at http://bit.ly/isi-docfeedback._________________
___________________________
Protocols - SMB (6)
Page
44
You could have arrived here from:
Page 43 - Protocols - SMB (5)
Can you revert any
changes that have been made to
either the SMB configuration or
the network infrastructure and
retest?
Yes
Revert any changes and retest. If
performance issues are still present,
restart page 39 - Protocols - SMB.
Note the page number that you
are currently on.
Upload log files and contact
Isilon Technical Support, as
instructed in Appendix A.
Go to the Gather data section
and answer as many
questions as you can.
No
Are your
performance issues
resolved?
Yes
End troubleshooting
No
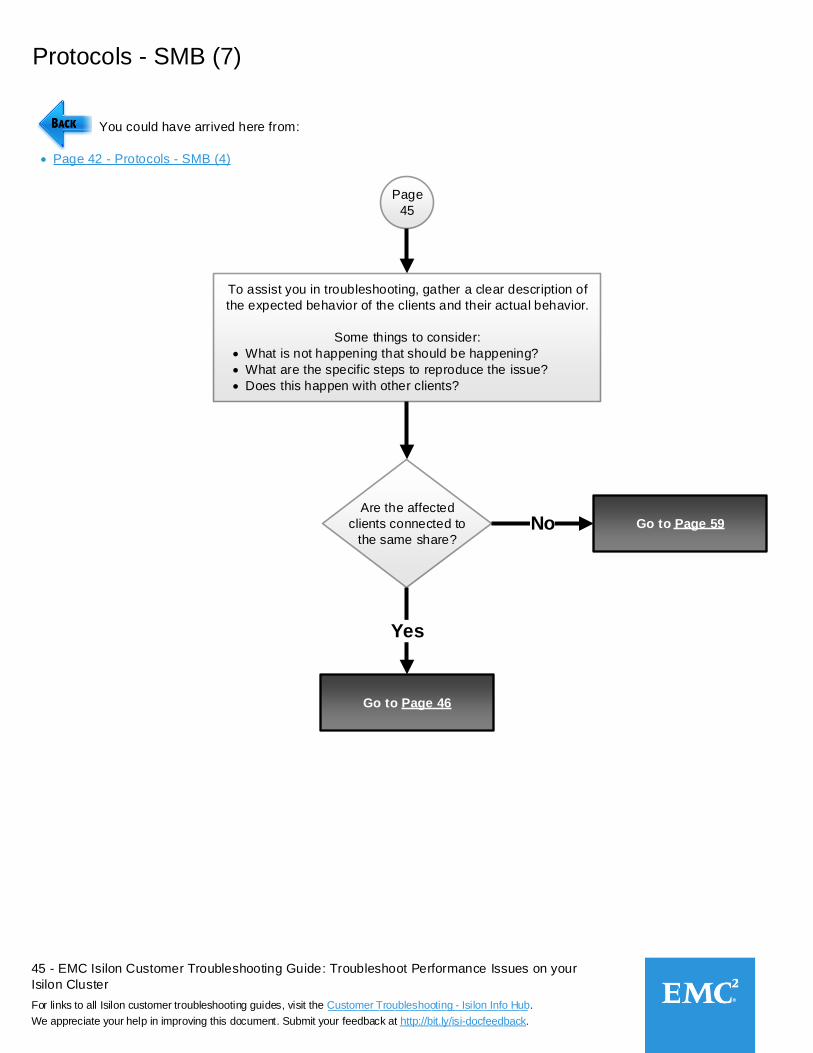
45 - EMC Isilon Customer Troubleshooting Guide: Troubleshoot Performance Issues on your
Isilon Cluster
For links to all Isilon customer troubleshooting guides, visit the Customer Troubleshooting - Isilon Info Hub.
We appreciate your help in improving this document. Submit your feedback at http://bit.ly/isi-docfeedback._________________
___________________________
Protocols - SMB (7)
Page
45
You could have arrived here from:
Page 42 - Protocols - SMB (4)
To assist you in troubleshooting, gather a clear description of
the expected behavior of the clients and their actual behavior.
Some things to consider:
What is not happening that should be happening?
What are the specific steps to reproduce the issue?
Does this happen with other clients?
Are the affected
clients connected to
the same share?
Go to Page 59No
Yes
Go to Page 46
46 - EMC Isilon Customer Troubleshooting Guide: Troubleshoot Performance Issues on your
Isilon Cluster
For links to all Isilon customer troubleshooting guides, visit the Customer Troubleshooting - Isilon Info Hub.
We appreciate your help in improving this document. Submit your feedback at http://bit.ly/isi-docfeedback._________________
___________________________
Protocols - SMB (8)
Page
46
You could have arrived here from:
Page 45 - Protocols - SMB (7)
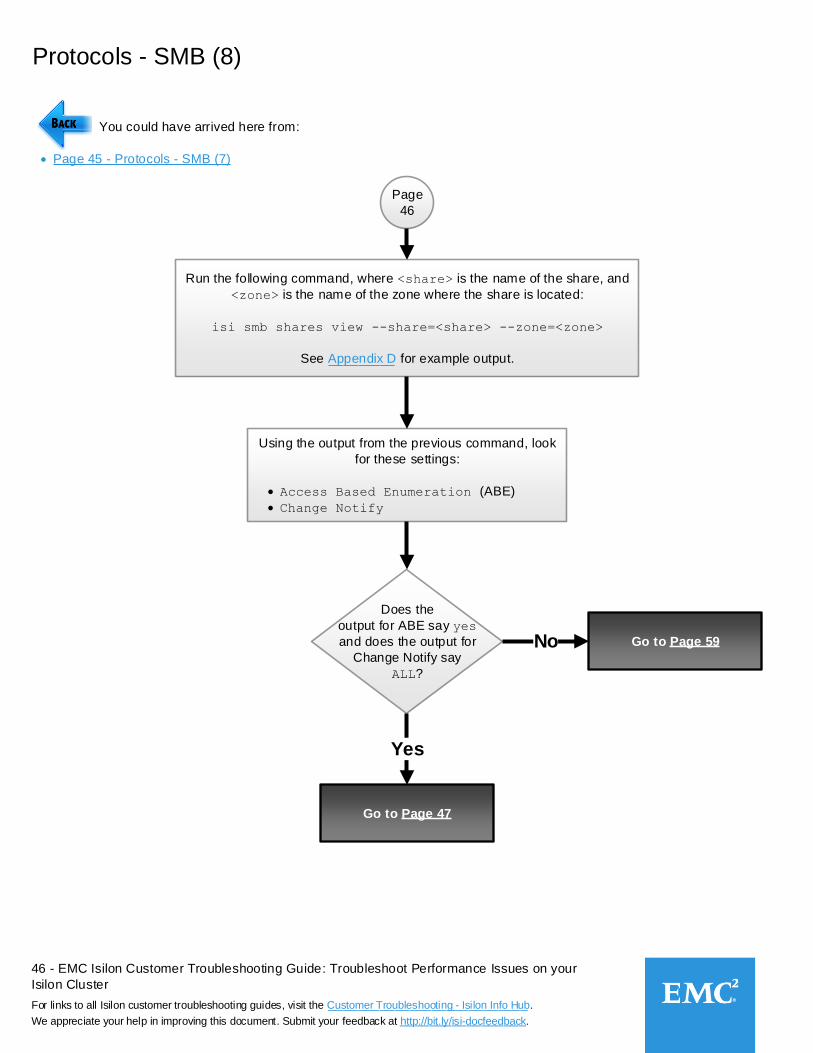
Run the following command, where <share> is the name of the share, and
<zone> is the name of the zone where the share is located:
isi smb shares view --share=<share> --zone=<zone>
See Appendix D for example output.
Using the output from the previous command, look
for these settings:
Access Based Enumeration (ABE)
Change Notify
Does the
output for ABE say yes
and does the output for
Change Notify say
ALL?
Go to Page 59No
Go to Page 47
Yes
_________
47 - EMC Isilon Customer Troubleshooting Guide: Troubleshoot Performance Issues on your
Isilon Cluster
For links to all Isilon customer troubleshooting guides, visit the Customer Troubleshooting - Isilon Info Hub.
We appreciate your help in improving this document. Submit your feedback at http://bit.ly/isi-docfeedback._________________
___________________________
Protocols - SMB (9)
Page
47
You could have arrived here from:
Page 46 - Protocols - SMB (8)
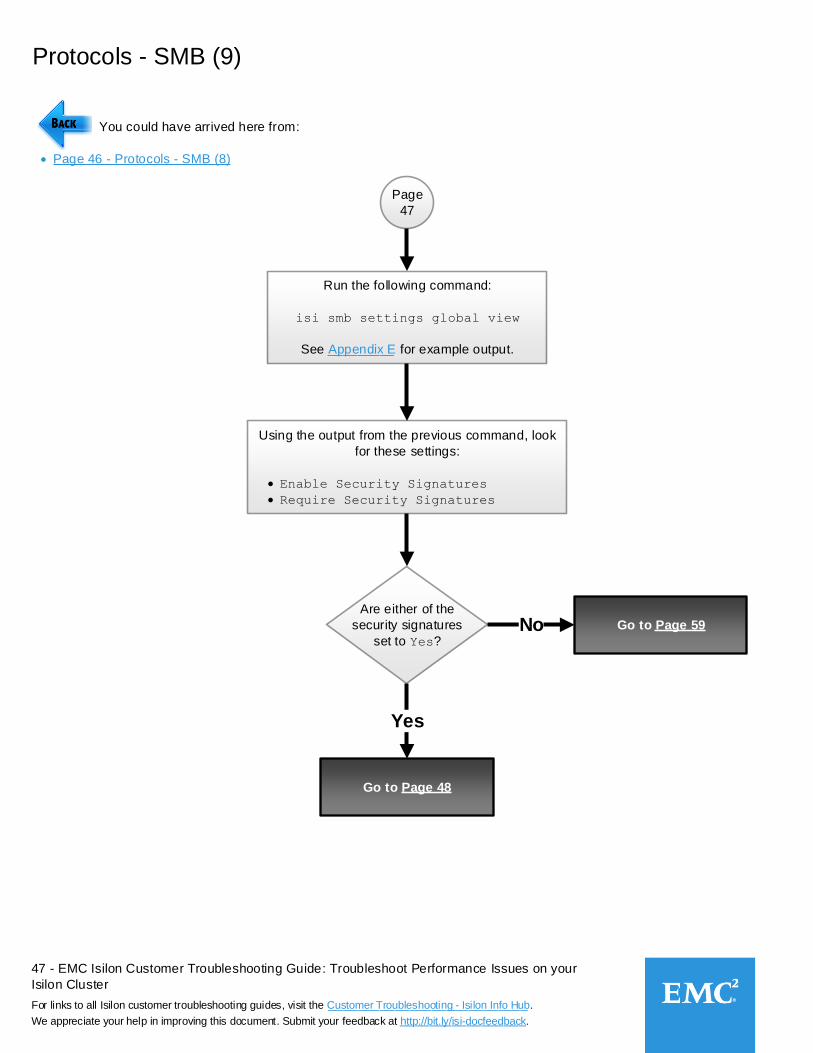
Run the following command:
isi smb settings global view
See Appendix E for example output.
Using the output from the previous command, look
for these settings:
Enable Security Signatures
Require Security Signatures
Are either of the
security signatures
set to Yes?
Go to Page 59No
Go to Page 48
Yes
_________
48 - EMC Isilon Customer Troubleshooting Guide: Troubleshoot Performance Issues on your
Isilon Cluster
For links to all Isilon customer troubleshooting guides, visit the Customer Troubleshooting - Isilon Info Hub.
We appreciate your help in improving this document. Submit your feedback at http://bit.ly/isi-docfeedback._________________
___________________________
Protocols - SMB (10)
Page
48
You could have arrived here from:
Page 47 - Protocols - SMB (9)
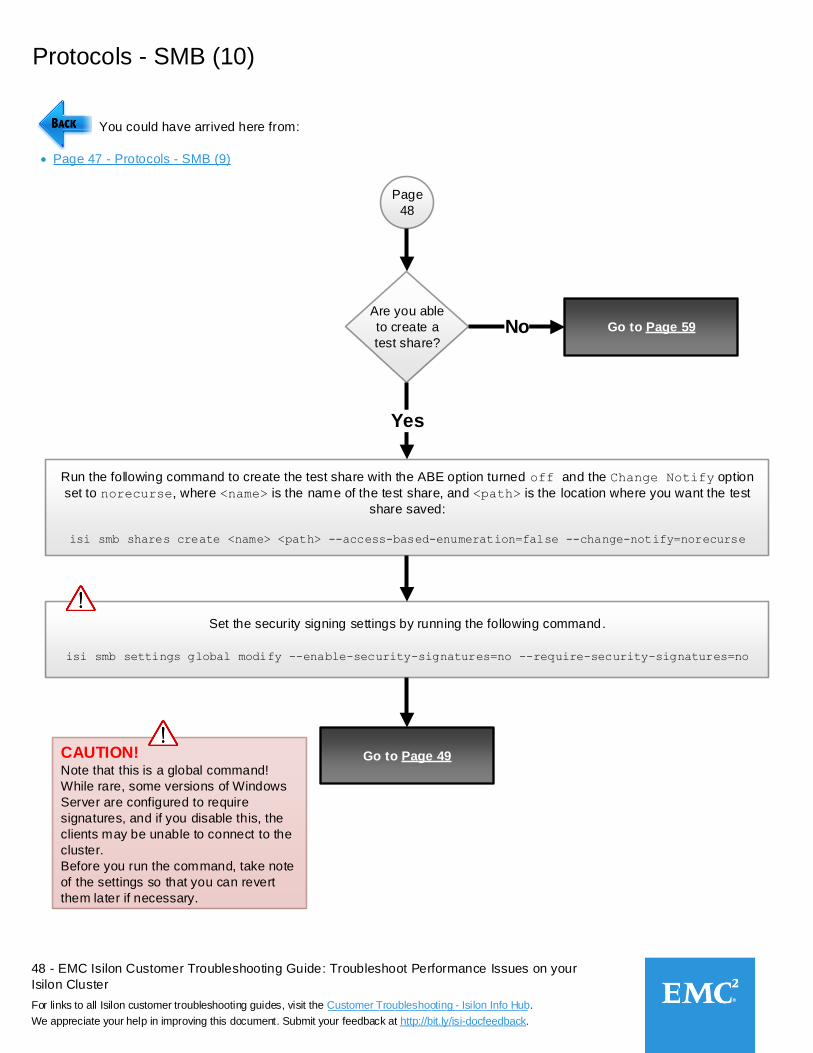
Are you able
to create a
test share?
Run the following command to create the test share with the ABE option turned off and the Change Notify option
set to norecurse, where <name> is the name of the test share, and <path> is the location where you want the test
share saved:
isi smb shares create <name> <path> --access-based-enumeration=false --change-notify=norecurse
Yes
Go to Page 59No
Set the security signing settings by running the following command.
isi smb settings global modify --enable-security-signatures=no --require-security-signatures=no
Go to Page 49CAUTION!Note that this is a global command!
While rare, some versions of Windows
Server are configured to require
signatures, and if you disable this, the
clients may be unable to connect to the
cluster.
Before you run the command, take note
of the settings so that you can revert
them later if necessary.
49 - EMC Isilon Customer Troubleshooting Guide: Troubleshoot Performance Issues on your
Isilon Cluster
For links to all Isilon customer troubleshooting guides, visit the Customer Troubleshooting - Isilon Info Hub.
We appreciate your help in improving this document. Submit your feedback at http://bit.ly/isi-docfeedback._________________
___________________________
Protocols - SMB (11)
Page
49
You could have arrived here from:
Page 48 - Protocols - SMB (10)
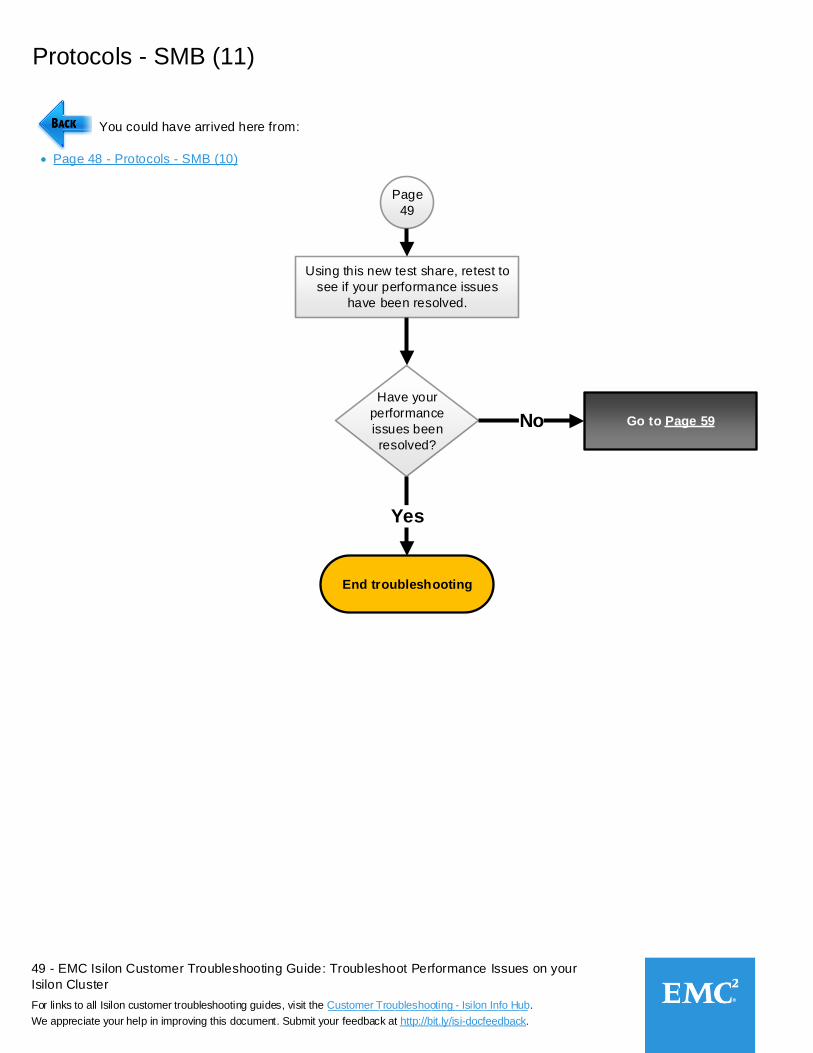
Have your
performance
issues been
resolved?
Yes
Go to Page 59No
Using this new test share, retest to
see if your performance issues
have been resolved.
End troubleshooting
50 - EMC Isilon Customer Troubleshooting Guide: Troubleshoot Performance Issues on your
Isilon Cluster
For links to all Isilon customer troubleshooting guides, visit the Customer Troubleshooting - Isilon Info Hub.
We appreciate your help in improving this document. Submit your feedback at http://bit.ly/isi-docfeedback._________________
___________________________
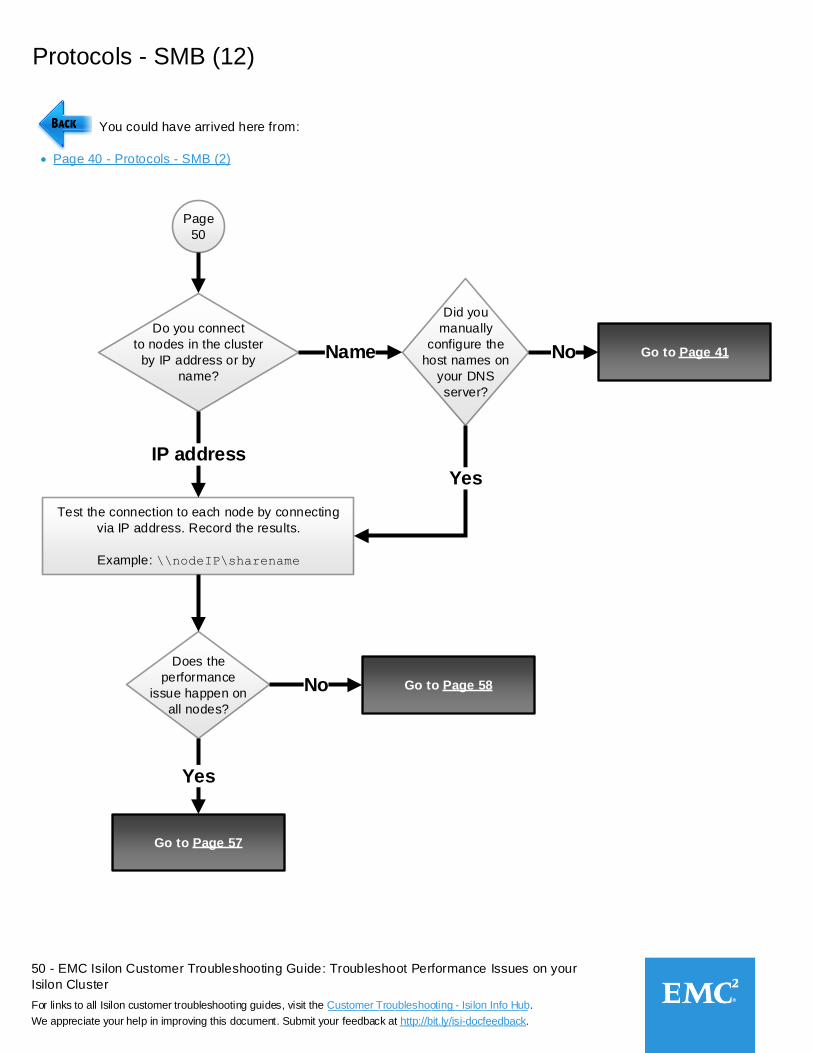
Protocols - SMB (12)
Page
50
You could have arrived here from:
Page 40 - Protocols - SMB (2)
Do you connect
to nodes in the cluster
by IP address or by
name?
IP address
Test the connection to each node by connecting
via IP address. Record the results.
Example: \\nodeIP\sharename
Go to Page 41Name No
Did you
manually
configure the
host names on
your DNS
server?
Yes
Does the
performance
issue happen on
all nodes?
Go to Page 57
Go to Page 58No
Yes
51 - EMC Isilon Customer Troubleshooting Guide: Troubleshoot Performance Issues on your
Isilon Cluster
For links to all Isilon customer troubleshooting guides, visit the Customer Troubleshooting - Isilon Info Hub.
We appreciate your help in improving this document. Submit your feedback at http://bit.ly/isi-docfeedback._________________
___________________________
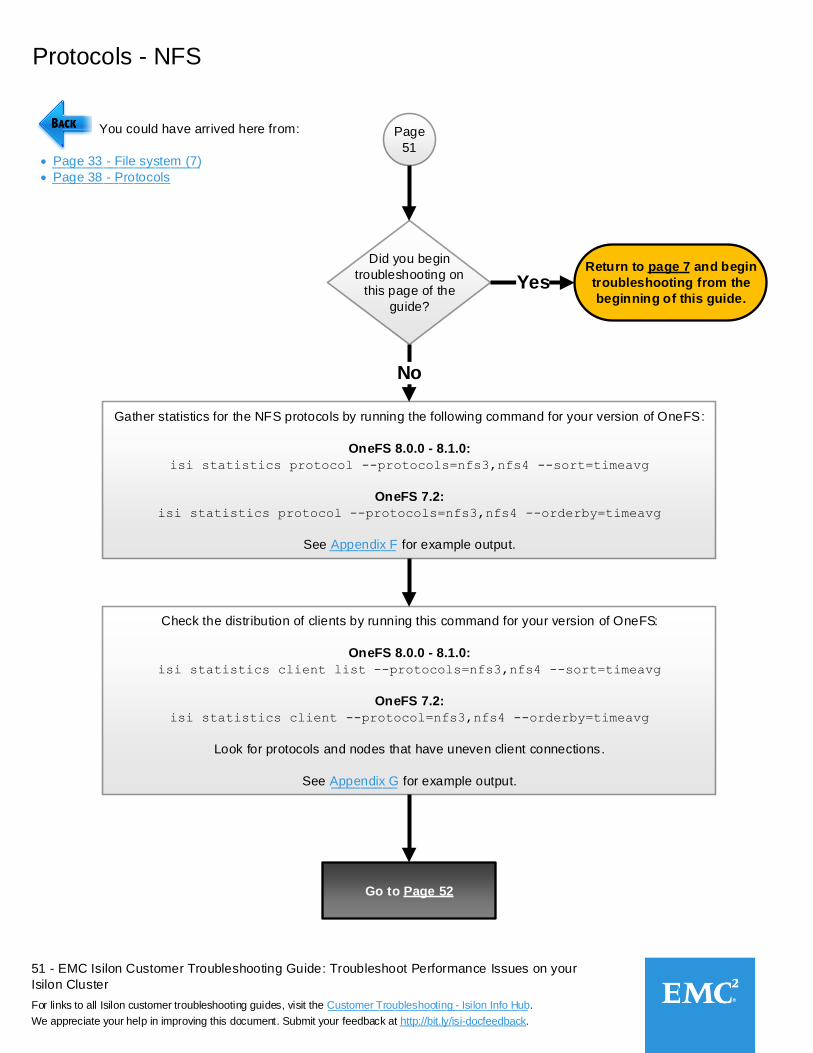
Protocols - NFS
Page
51
You could have arrived here from:
Page 33 - File system (7)
Page 38 - Protocols
Did you begin
troubleshooting on
this page of the
guide?
Return to page 7 and begin
troubleshooting from the
beginning of this guide.
Gather statistics for the NFS protocols by running the following command for your version of OneFS:
OneFS 8.0.0 - 8.1.0:
isi statistics protocol --protocols=nfs3,nfs4 --sort=timeavg
OneFS 7.2:
isi statistics protocol --protocols=nfs3,nfs4 --orderby=timeavg
See Appendix F for example output.
Yes
No
Check the distribution of clients by running this command for your version of OneFS:
OneFS 8.0.0 - 8.1.0:
isi statistics client list --protocols=nfs3,nfs4 --sort=timeavg
OneFS 7.2:
isi statistics client --protocol=nfs3,nfs4 --orderby=timeavg
Look for protocols and nodes that have uneven client connections.
See Appendix G for example output.
Go to Page 52
_________
_________
____________________
________________
52 - EMC Isilon Customer Troubleshooting Guide: Troubleshoot Performance Issues on your
Isilon Cluster
For links to all Isilon customer troubleshooting guides, visit the Customer Troubleshooting - Isilon Info Hub.
We appreciate your help in improving this document. Submit your feedback at http://bit.ly/isi-docfeedback._________________
___________________________
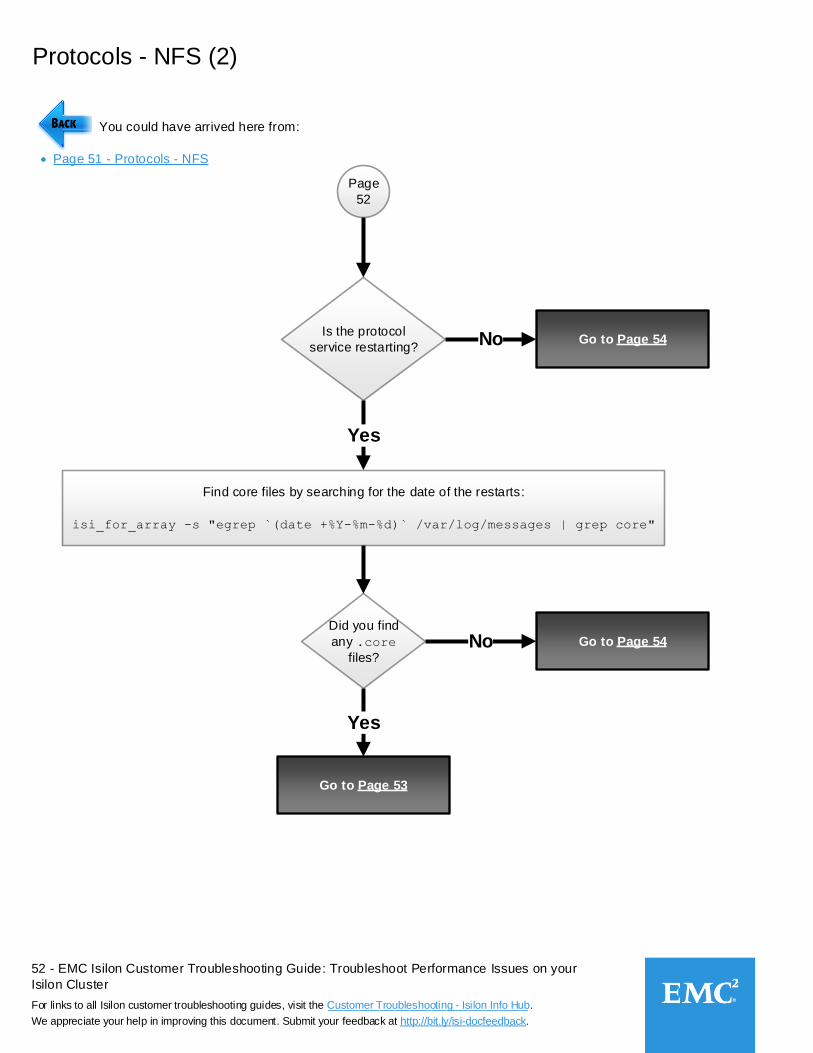
Protocols - NFS (2)
Page
52
Is the protocol
service restarting?
Yes
Find core files by searching for the date of the restarts:
isi_for_array -s "egrep `(date +%Y-%m-%d)` /var/log/messages | grep core"
No
Did you find
any .core
files?
Go to Page 54
Go to Page 54No
Yes
Go to Page 53
You could have arrived here from:
Page 51 - Protocols - NFS
53 - EMC Isilon Customer Troubleshooting Guide: Troubleshoot Performance Issues on your
Isilon Cluster
For links to all Isilon customer troubleshooting guides, visit the Customer Troubleshooting - Isilon Info Hub.
We appreciate your help in improving this document. Submit your feedback at http://bit.ly/isi-docfeedback._________________
___________________________
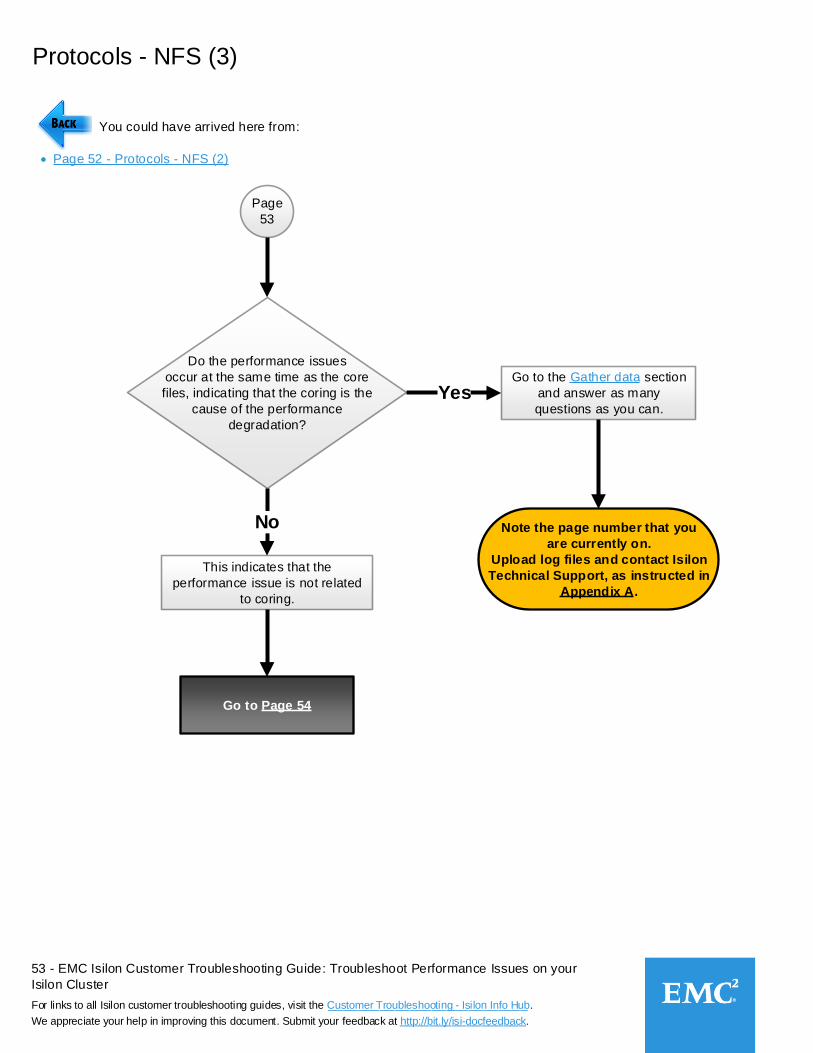
Protocols - NFS (3)
Page
53
You could have arrived here from:
Page 52 - Protocols - NFS (2)
Do the performance issues
occur at the same time as the core
files, indicating that the coring is the
cause of the performance
degradation?
No
This indicates that the
performance issue is not related
to coring.
Go to Page 54
Note the page number that you
are currently on.
Upload log files and contact Isilon
Technical Support, as instructed in
Appendix A.
Go to the Gather data section
and answer as many
questions as you can.Yes
54 - EMC Isilon Customer Troubleshooting Guide: Troubleshoot Performance Issues on your
Isilon Cluster
For links to all Isilon customer troubleshooting guides, visit the Customer Troubleshooting - Isilon Info Hub.
We appreciate your help in improving this document. Submit your feedback at http://bit.ly/isi-docfeedback._________________
___________________________
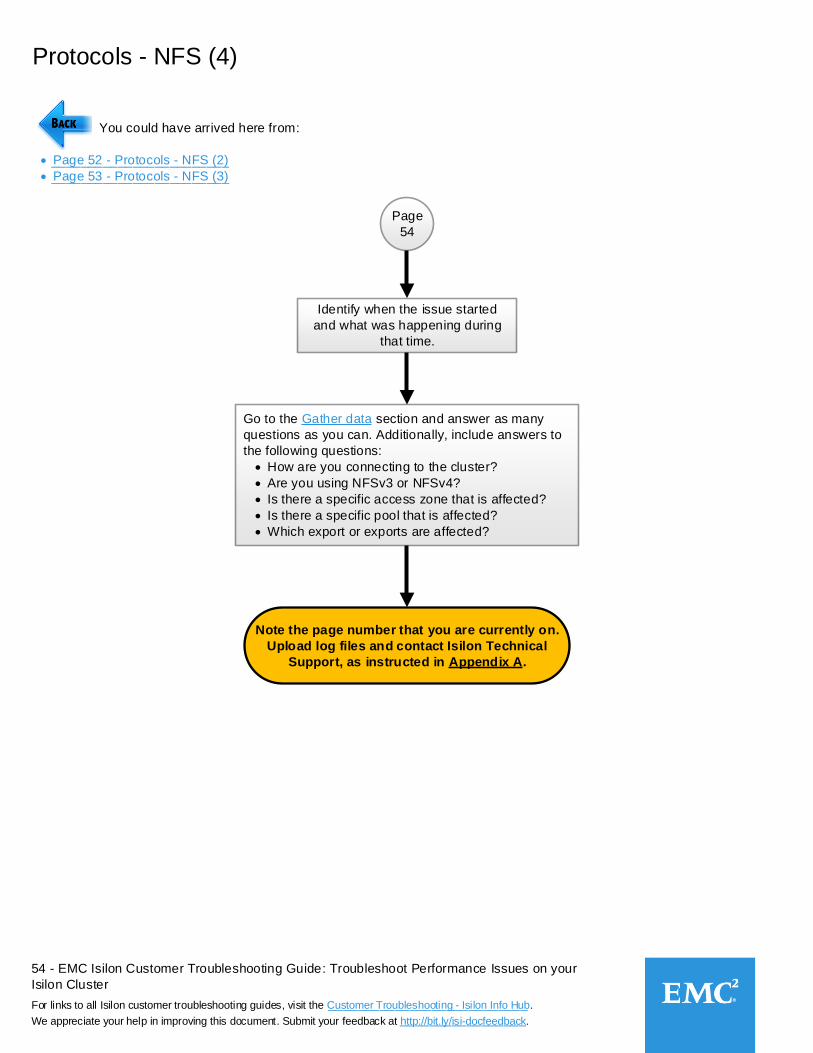
Protocols - NFS (4)
Page
54
You could have arrived here from:
Page 52 - Protocols - NFS (2)
Page 53 - Protocols - NFS (3)
Identify when the issue started
and what was happening during
that time.
Note the page number that you are currently on.
Upload log files and contact Isilon Technical
Support, as instructed in Appendix A.
Go to the Gather data section and answer as many
questions as you can. Additionally, include answers to
the following questions:
How are you connecting to the cluster?
Are you using NFSv3 or NFSv4?
Is there a specific access zone that is affected?
Is there a specific pool that is affected?
Which export or exports are affected?
________________________
________________________
55 - EMC Isilon Customer Troubleshooting Guide: Troubleshoot Performance Issues on your
Isilon Cluster
For links to all Isilon customer troubleshooting guides, visit the Customer Troubleshooting - Isilon Info Hub.
We appreciate your help in improving this document. Submit your feedback at http://bit.ly/isi-docfeedback._________________
___________________________
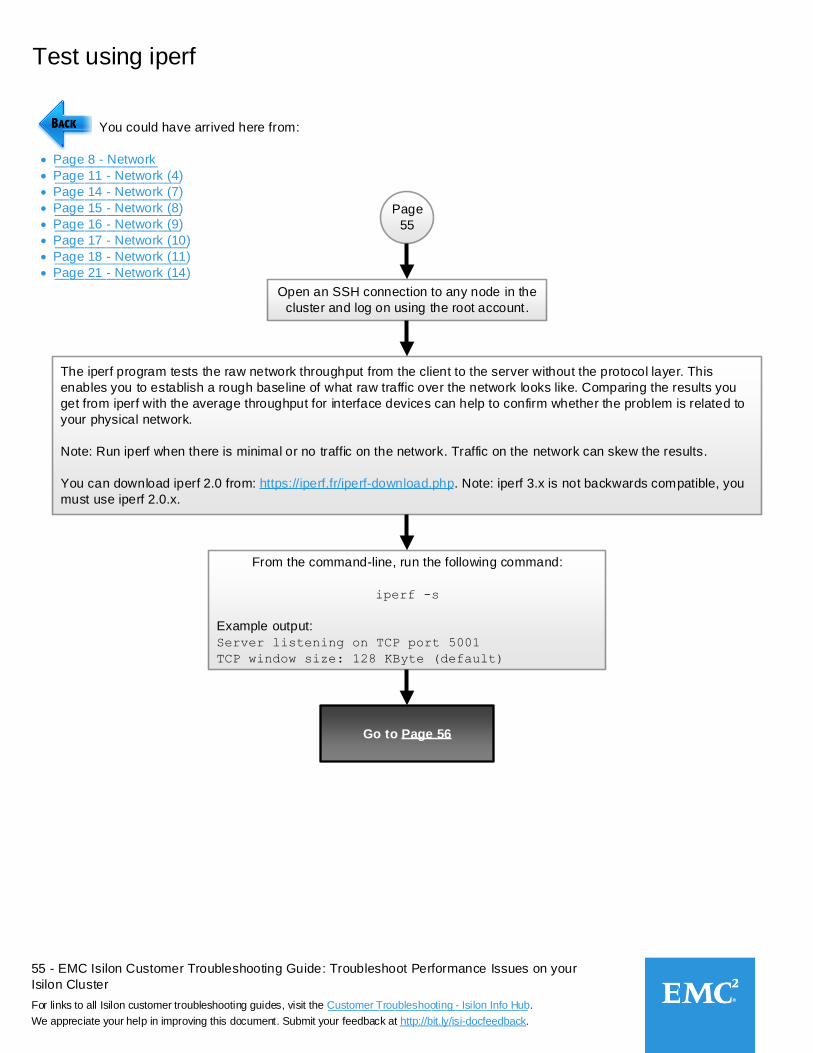
Test using iperf
You could have arrived here from:
Page 8 - Network
Page 11 - Network (4)
Page 14 - Network (7)
Page 15 - Network (8)
Page 16 - Network (9)
Page 17 - Network (10)
Page 18 - Network (11)
Page 21 - Network (14)
The iperf program tests the raw network throughput from the client to the server without the protocol layer. This
enables you to establish a rough baseline of what raw traffic over the network looks like. Comparing the results you
get from iperf with the average throughput for interface devices can help to confirm whether the problem is related to
your physical network.
Note: Run iperf when there is minimal or no traffic on the network. Traffic on the network can skew the results.
You can download iperf 2.0 from: https://iperf.fr/iperf-download.php. Note: iperf 3.x is not backwards compatible, you
must use iperf 2.0.x.
Open an SSH connection to any node in the
cluster and log on using the root account.
From the command-line, run the following command:
iperf -s
Example output:
Server listening on TCP port 5001
TCP window size: 128 KByte (default)
Go to Page 56
Page
55
______________
_________________
_________________
_________________
_________________
__________________
__________________
__________________
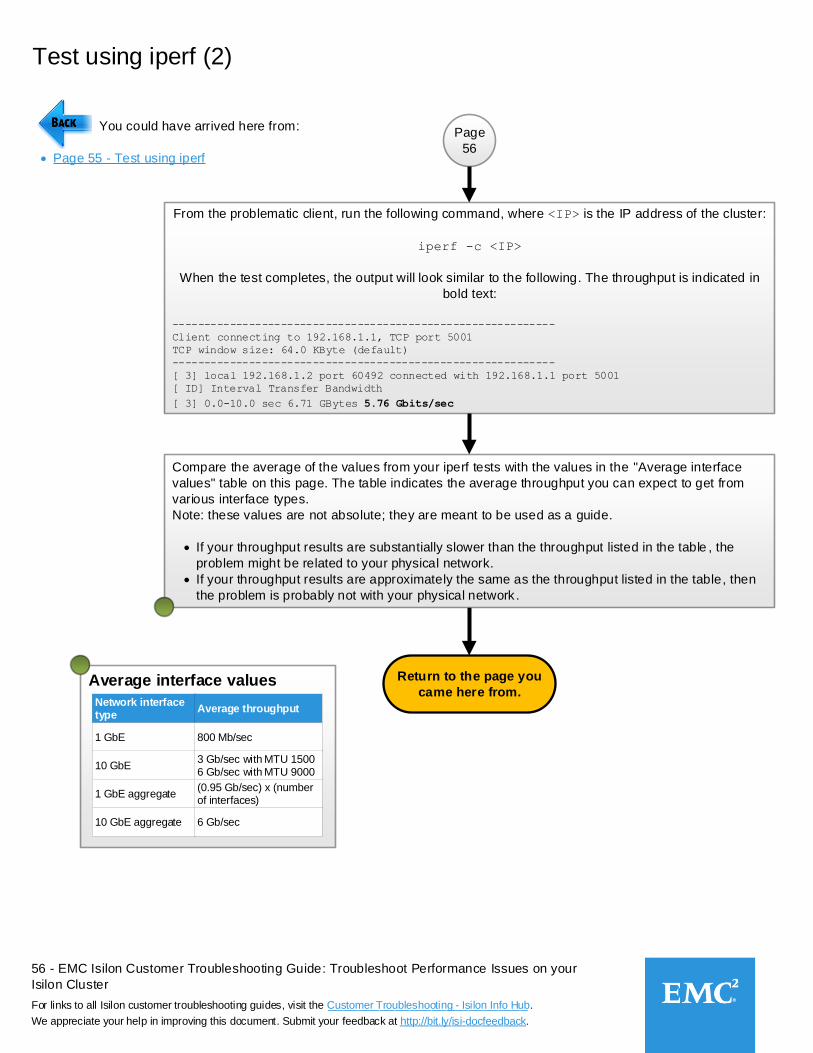
56 - EMC Isilon Customer Troubleshooting Guide: Troubleshoot Performance Issues on your
Isilon Cluster
For links to all Isilon customer troubleshooting guides, visit the Customer Troubleshooting - Isilon Info Hub.
We appreciate your help in improving this document. Submit your feedback at http://bit.ly/isi-docfeedback._________________
___________________________
Test using iperf (2)
You could have arrived here from:
Page 55 - Test using iperf
Page
56
Compare the average of the values from your iperf tests with the values in the "Average interface
values" table on this page. The table indicates the average throughput you can expect to get from
various interface types.
Note: these values are not absolute; they are meant to be used as a guide.
If your throughput results are substantially slower than the throughput listed in the table , the
problem might be related to your physical network.
If your throughput results are approximately the same as the throughput listed in the table, then
the problem is probably not with your physical network .
Return to the page you
came here from.Average interface values
Network interface type
Average throughput
1 GbE
10 GbE
800 Mb/sec
3 Gb/sec with MTU 15006 Gb/sec with MTU 9000
1 GbE aggregate(0.95 Gb/sec) x (number of interfaces)
10 GbE aggregate 6 Gb/sec
From the problematic client, run the following command, where <IP> is the IP address of the cluster:
iperf -c <IP>
When the test completes, the output will look similar to the following. The throughput is indicated in
bold text:
------------------------------------------------------------
Client connecting to 192.168.1.1, TCP port 5001
TCP window size: 64.0 KByte (default)
------------------------------------------------------------
[ 3] local 192.168.1.2 port 60492 connected with 192.168.1.1 port 5001
[ ID] Interval Transfer Bandwidth
[ 3] 0.0-10.0 sec 6.71 GBytes 5.76 Gbits/sec
57 - EMC Isilon Customer Troubleshooting Guide: Troubleshoot Performance Issues on your
Isilon Cluster
For links to all Isilon customer troubleshooting guides, visit the Customer Troubleshooting - Isilon Info Hub.
We appreciate your help in improving this document. Submit your feedback at http://bit.ly/isi-docfeedback._________________
___________________________
Gather a packet capture from the client
You could have arrived here from:
Page 50 - Protocols - SMB (12)
Page
57
Perform a packet capture on the client, using the method appropriate for
your operation system and configuration.
Can you resolve
the issue using the
results of the
PCAP?
Yes
Note the page number that you
are currently on.
Upload log files and contact
Isilon Technical Support, as
instructed in Appendix A.
Go to the Gather data section
and answer as many
questions as you can. Gather
all data that you have
collected up until this point.
No
Review the results of the PCAP with your network and security teams to
determine whether any ports or sockets need to be opened to allow
connectivity to succeed.
For a list of port ranges that should be open, see the EMC Secure Remote
Services Port Requirements guide.
Note A packet capture (PCAP) will help
you to determine whether there is a
problem with an intermediary device
that is between your cluster and the
resource that you are trying to
access.
End troubleshooting
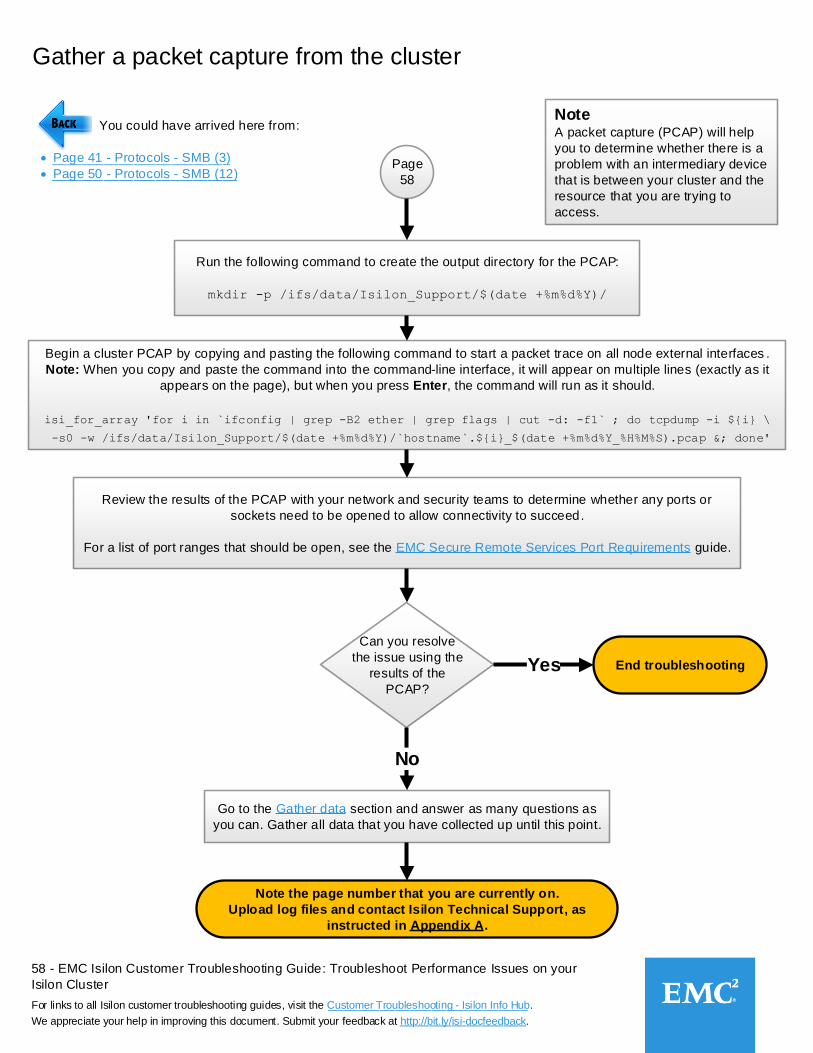
58 - EMC Isilon Customer Troubleshooting Guide: Troubleshoot Performance Issues on your
Isilon Cluster
For links to all Isilon customer troubleshooting guides, visit the Customer Troubleshooting - Isilon Info Hub.
We appreciate your help in improving this document. Submit your feedback at http://bit.ly/isi-docfeedback._________________
___________________________
Gather a packet capture from the cluster
You could have arrived here from:
Page 41 - Protocols - SMB (3)
Page 50 - Protocols - SMB (12)Page
58
Can you resolve
the issue using the
results of the
PCAP?
Yes
Note the page number that you are currently on.
Upload log files and contact Isilon Technical Support, as
instructed in Appendix A.
Go to the Gather data section and answer as many questions as
you can. Gather all data that you have collected up until this point.
No
Note A packet capture (PCAP) will help
you to determine whether there is a
problem with an intermediary device
that is between your cluster and the
resource that you are trying to
access.
End troubleshooting
Review the results of the PCAP with your network and security teams to determine whether any ports or
sockets need to be opened to allow connectivity to succeed.
For a list of port ranges that should be open, see the EMC Secure Remote Services Port Requirements guide.
________________________
_________________________
Begin a cluster PCAP by copying and pasting the following command to start a packet trace on all node external interfaces .
Note: When you copy and paste the command into the command-line interface, it will appear on multiple lines (exactly as it
appears on the page), but when you press Enter, the command will run as it should.
isi_for_array 'for i in `ifconfig | grep -B2 ether | grep flags | cut -d: -f1` ; do tcpdump -i ${i} \
-s0 -w /ifs/data/Isilon_Support/$(date +%m%d%Y)/`hostname`.${i}_$(date +%m%d%Y_%H%M%S).pcap &; done'
Run the following command to create the output directory for the PCAP:
mkdir -p /ifs/data/Isilon_Support/$(date +%m%d%Y)/
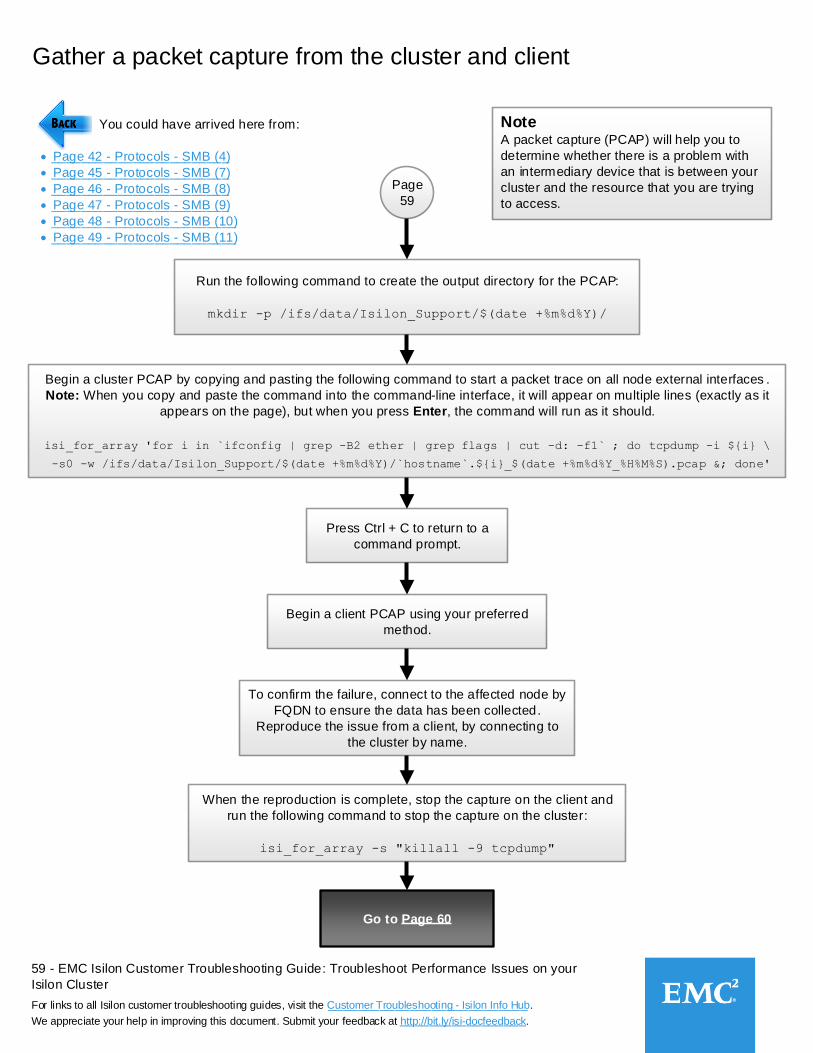
59 - EMC Isilon Customer Troubleshooting Guide: Troubleshoot Performance Issues on your
Isilon Cluster
For links to all Isilon customer troubleshooting guides, visit the Customer Troubleshooting - Isilon Info Hub.
We appreciate your help in improving this document. Submit your feedback at http://bit.ly/isi-docfeedback._________________
___________________________
Gather a packet capture from the cluster and client
You could have arrived here from:
Page 42 - Protocols - SMB (4)
Page 45 - Protocols - SMB (7)
Page 46 - Protocols - SMB (8)
Page 47 - Protocols - SMB (9)
Page 48 - Protocols - SMB (10)
Page 49 - Protocols - SMB (11)
Page
59
Begin a cluster PCAP by copying and pasting the following command to start a packet trace on all node external interfaces .
Note: When you copy and paste the command into the command-line interface, it will appear on multiple lines (exactly as it
appears on the page), but when you press Enter, the command will run as it should.
isi_for_array 'for i in `ifconfig | grep -B2 ether | grep flags | cut -d: -f1` ; do tcpdump -i ${i} \
-s0 -w /ifs/data/Isilon_Support/$(date +%m%d%Y)/`hostname`.${i}_$(date +%m%d%Y_%H%M%S).pcap &; done'
Note A packet capture (PCAP) will help you to
determine whether there is a problem with
an intermediary device that is between your
cluster and the resource that you are trying
to access.
Press Ctrl + C to return to a
command prompt.
Begin a client PCAP using your preferred
method.
To confirm the failure, connect to the affected node by
FQDN to ensure the data has been collected.
Reproduce the issue from a client, by connecting to
the cluster by name.
Go to Page 60
________________________
________________________
________________________
________________________
_________________________
_________________________
Run the following command to create the output directory for the PCAP:
mkdir -p /ifs/data/Isilon_Support/$(date +%m%d%Y)/
When the reproduction is complete, stop the capture on the client and
run the following command to stop the capture on the cluster:
isi_for_array -s "killall -9 tcpdump"
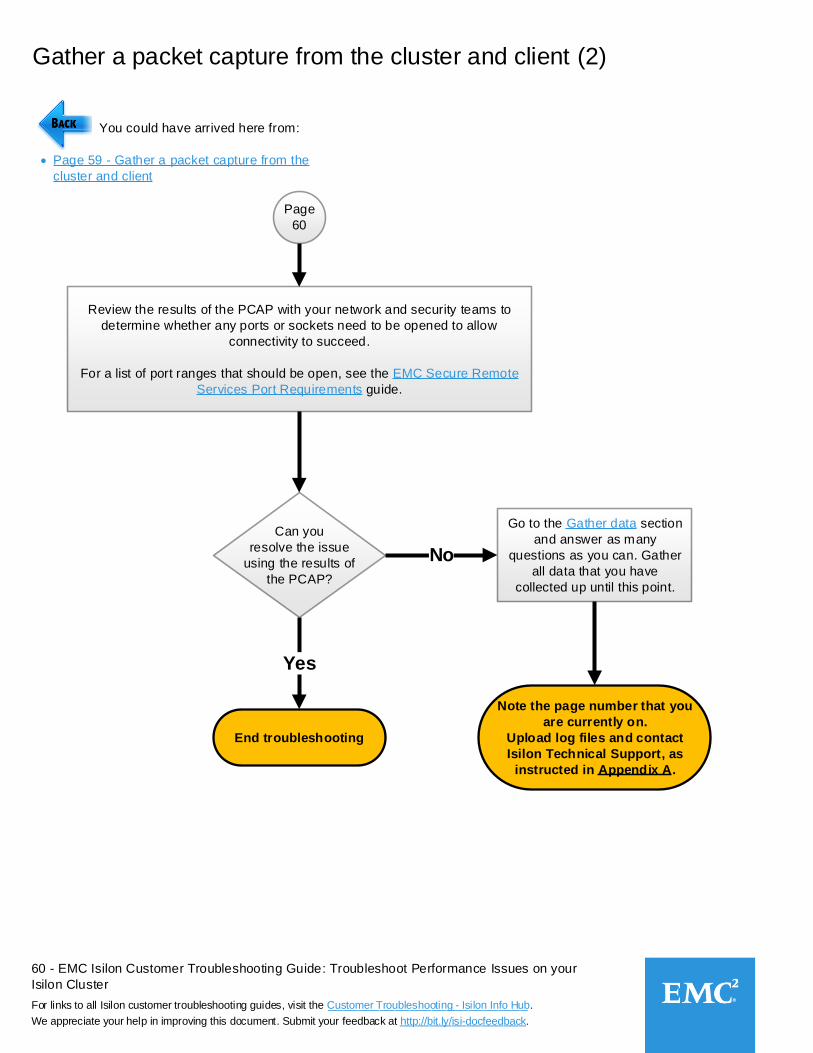
60 - EMC Isilon Customer Troubleshooting Guide: Troubleshoot Performance Issues on your
Isilon Cluster
For links to all Isilon customer troubleshooting guides, visit the Customer Troubleshooting - Isilon Info Hub.
We appreciate your help in improving this document. Submit your feedback at http://bit.ly/isi-docfeedback._________________
___________________________
Gather a packet capture from the cluster and client (2)
Page
60
Can you
resolve the issue
using the results of
the PCAP?
Yes
Note the page number that you
are currently on.
Upload log files and contact
Isilon Technical Support, as
instructed in Appendix A.
Go to the Gather data section
and answer as many
questions as you can. Gather
all data that you have
collected up until this point.
No
End troubleshooting
Review the results of the PCAP with your network and security teams to
determine whether any ports or sockets need to be opened to allow
connectivity to succeed.
For a list of port ranges that should be open, see the EMC Secure Remote
Services Port Requirements guide.
You could have arrived here from:
Page 59 - Gather a packet capture from the
cluster and client
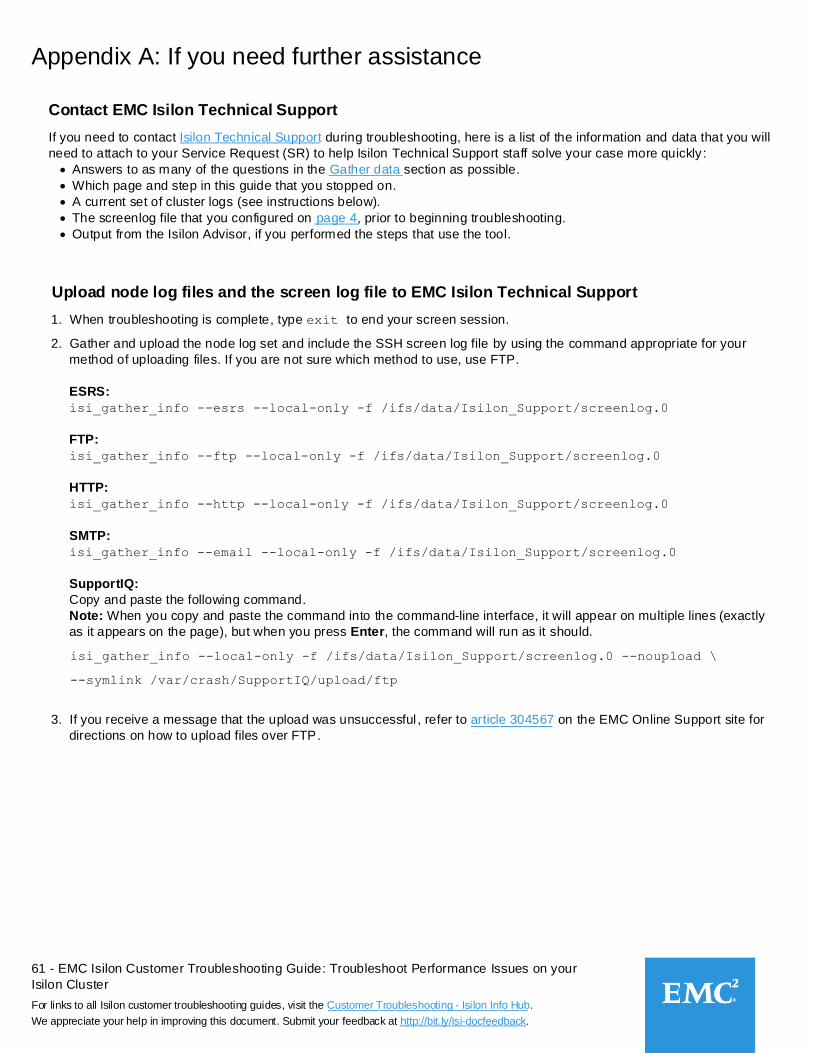
61 - EMC Isilon Customer Troubleshooting Guide: Troubleshoot Performance Issues on your
Isilon Cluster
For links to all Isilon customer troubleshooting guides, visit the Customer Troubleshooting - Isilon Info Hub.
We appreciate your help in improving this document. Submit your feedback at http://bit.ly/isi-docfeedback._________________
___________________________
Contact EMC Isilon Technical Support
If you need to contact Isilon Technical Support during troubleshooting, here is a list of the information and data that you will
need to attach to your Service Request (SR) to help Isilon Technical Support staff solve your case more quickly :
Answers to as many of the questions in the Gather data section as possible.
Which page and step in this guide that you stopped on.
A current set of cluster logs (see instructions below).
The screenlog file that you configured on page 4, prior to beginning troubleshooting.
Output from the Isilon Advisor, if you performed the steps that use the tool.
Appendix A: If you need further assistance
Upload node log files and the screen log file to EMC Isilon Technical Support
1. When troubleshooting is complete, type exit to end your screen session.
2. Gather and upload the node log set and include the SSH screen log file by using the command appropriate for your
method of uploading files. If you are not sure which method to use, use FTP.
ESRS:
isi_gather_info --esrs --local-only -f /ifs/data/Isilon_Support/screenlog.0
FTP:
isi_gather_info --ftp --local-only -f /ifs/data/Isilon_Support/screenlog.0
HTTP:
isi_gather_info --http --local-only -f /ifs/data/Isilon_Support/screenlog.0
SMTP:
isi_gather_info --email --local-only -f /ifs/data/Isilon_Support/screenlog.0
SupportIQ:
Copy and paste the following command.
Note: When you copy and paste the command into the command-line interface, it will appear on multiple lines (exactly
as it appears on the page), but when you press Enter, the command will run as it should.
isi_gather_info --local-only -f /ifs/data/Isilon_Support/screenlog.0 --noupload \
--symlink /var/crash/SupportIQ/upload/ftp
3. If you receive a message that the upload was unsuccessful , refer to article 304567 on the EMC Online Support site for
directions on how to upload files over FTP.
___________
___________________
__________
______
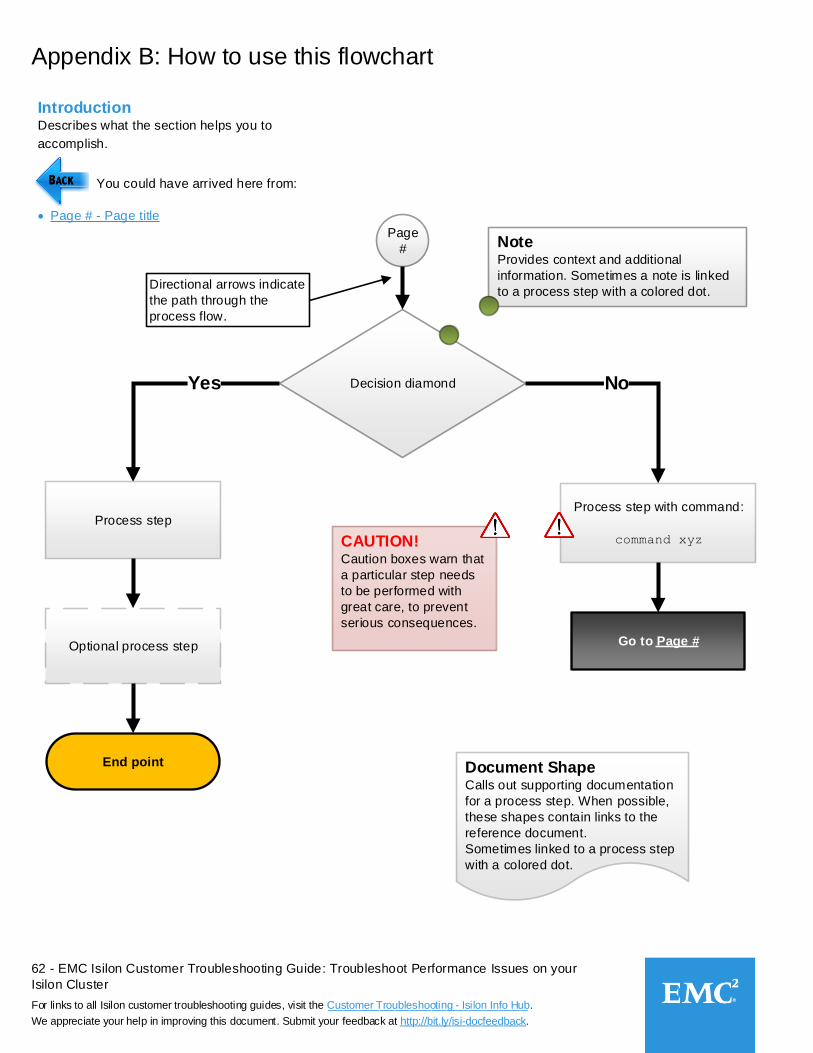
62 - EMC Isilon Customer Troubleshooting Guide: Troubleshoot Performance Issues on your
Isilon Cluster
For links to all Isilon customer troubleshooting guides, visit the Customer Troubleshooting - Isilon Info Hub.
We appreciate your help in improving this document. Submit your feedback at http://bit.ly/isi-docfeedback._________________
___________________________
Decision diamondYes No
Process stepProcess step with command:
command xyz
Go to Page #
Page
# Note Provides context and additional
information. Sometimes a note is linked
to a process step with a colored dot.
CAUTION!Caution boxes warn that
a particular step needs
to be performed with
great care, to prevent
serious consequences.
End point Document ShapeCalls out supporting documentation
for a process step. When possible,
these shapes contain links to the
reference document.
Sometimes linked to a process step
with a colored dot.
Optional process step
Directional arrows indicate
the path through the
process flow.
IntroductionDescribes what the section helps you to
accomplish.
You could have arrived here from:
Page # - Page title
Appendix B: How to use this flowchart
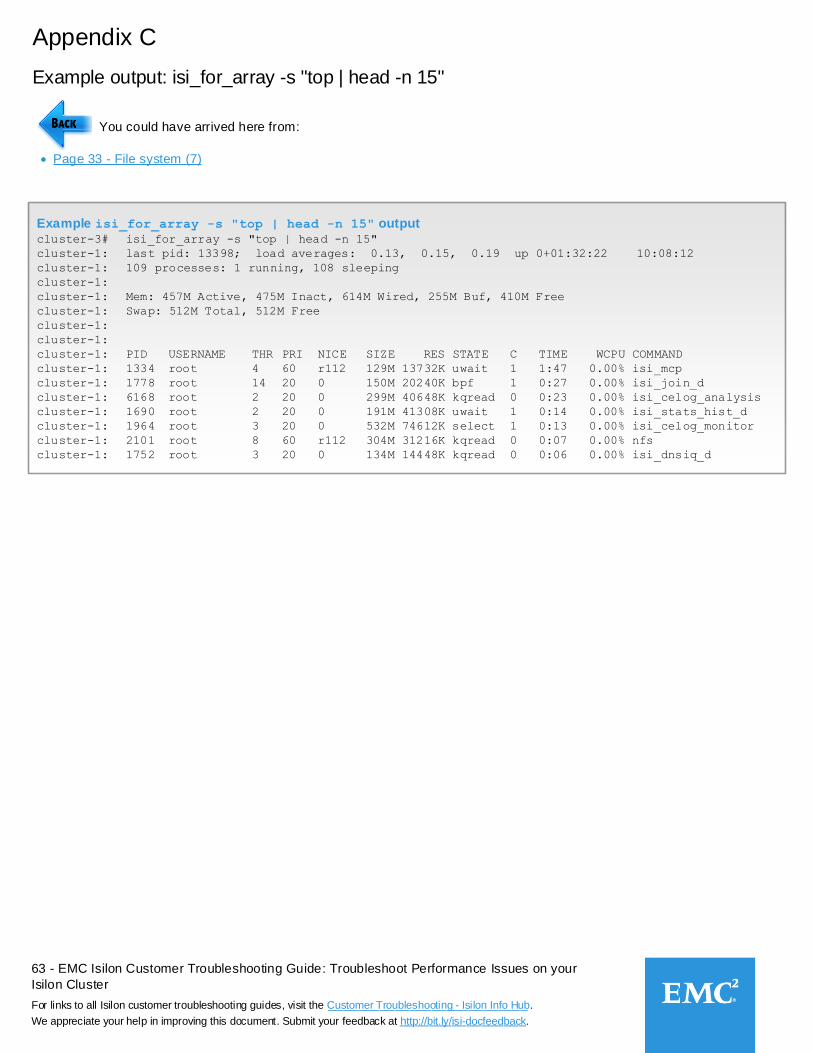
63 - EMC Isilon Customer Troubleshooting Guide: Troubleshoot Performance Issues on your
Isilon Cluster
For links to all Isilon customer troubleshooting guides, visit the Customer Troubleshooting - Isilon Info Hub.
We appreciate your help in improving this document. Submit your feedback at http://bit.ly/isi-docfeedback._________________
___________________________
Appendix C
Example output: isi_for_array -s "top | head -n 15"
You could have arrived here from:
Page 33 - File system (7)
Example isi_for_array -s "top | head -n 15" outputcluster-3# isi_for_array -s "top | head -n 15"
cluster-1: last pid: 13398; load averages: 0.13, 0.15, 0.19 up 0+01:32:22 10:08:12
cluster-1: 109 processes: 1 running, 108 sleeping
cluster-1:
cluster-1: Mem: 457M Active, 475M Inact, 614M Wired, 255M Buf, 410M Free
cluster-1: Swap: 512M Total, 512M Free
cluster-1:
cluster-1:
cluster-1: PID USERNAME THR PRI NICE SIZE RES STATE C TIME WCPU COMMAND
cluster-1: 1334 root 4 60 r112 129M 13732K uwait 1 1:47 0.00% isi_mcp
cluster-1: 1778 root 14 20 0 150M 20240K bpf 1 0:27 0.00% isi_join_d
cluster-1: 6168 root 2 20 0 299M 40648K kqread 0 0:23 0.00% isi_celog_analysis
cluster-1: 1690 root 2 20 0 191M 41308K uwait 1 0:14 0.00% isi_stats_hist_d
cluster-1: 1964 root 3 20 0 532M 74612K select 1 0:13 0.00% isi_celog_monitor
cluster-1: 2101 root 8 60 r112 304M 31216K kqread 0 0:07 0.00% nfs
cluster-1: 1752 root 3 20 0 134M 14448K kqread 0 0:06 0.00% isi_dnsiq_d
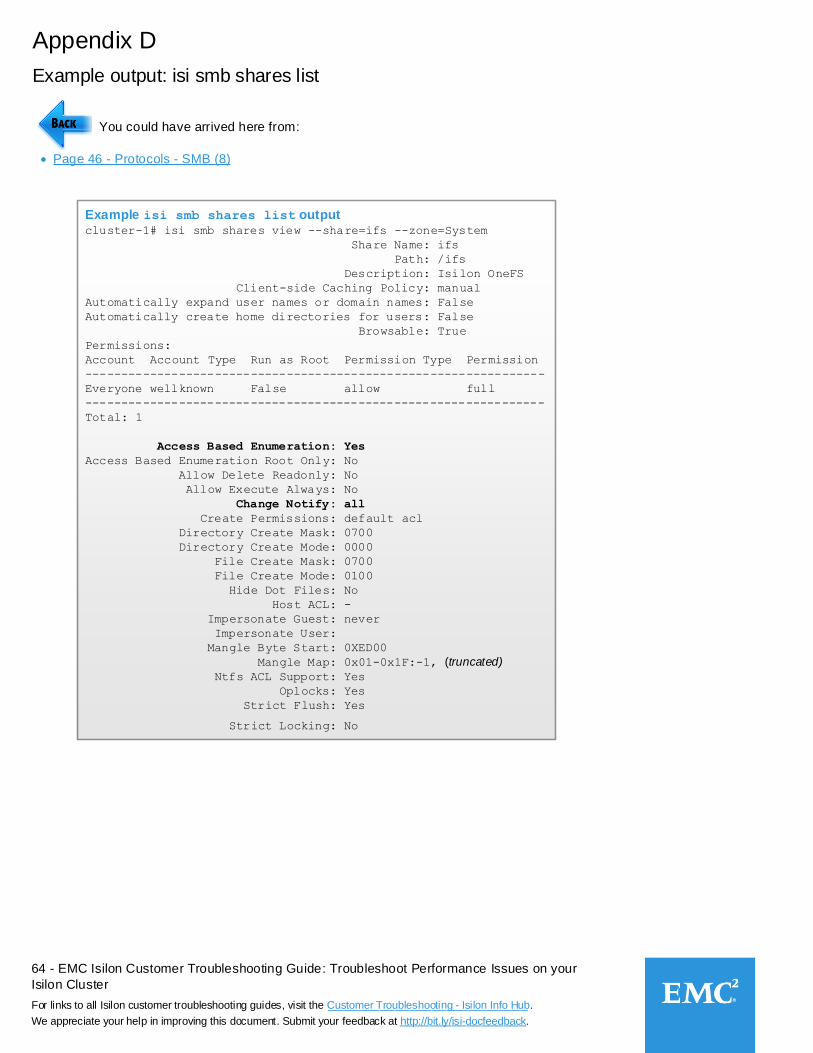
64 - EMC Isilon Customer Troubleshooting Guide: Troubleshoot Performance Issues on your
Isilon Cluster
For links to all Isilon customer troubleshooting guides, visit the Customer Troubleshooting - Isilon Info Hub.
We appreciate your help in improving this document. Submit your feedback at http://bit.ly/isi-docfeedback._________________
___________________________
Example isi smb shares list outputcluster-1# isi smb shares view --share=ifs --zone=System
Share Name: ifs
Path: /ifs
Description: Isilon OneFS
Client-side Caching Policy: manual
Automatically expand user names or domain names: False
Automatically create home directories for users: False
Browsable: True
Permissions:
Account Account Type Run as Root Permission Type Permission
----------------------------------------------------------------
Everyone wellknown False allow full
----------------------------------------------------------------
Total: 1
Access Based Enumeration: Yes
Access Based Enumeration Root Only: No
Allow Delete Readonly: No
Allow Execute Always: No
Change Notify: all
Create Permissions: default acl
Directory Create Mask: 0700
Directory Create Mode: 0000
File Create Mask: 0700
File Create Mode: 0100
Hide Dot Files: No
Host ACL: -
Impersonate Guest: never
Impersonate User:
Mangle Byte Start: 0XED00
Mangle Map: 0x01-0x1F:-1, (truncated)
Ntfs ACL Support: Yes
Oplocks: Yes
Strict Flush: Yes
Strict Locking: No
Appendix D
Example output: isi smb shares list
You could have arrived here from:
Page 46 - Protocols - SMB (8)
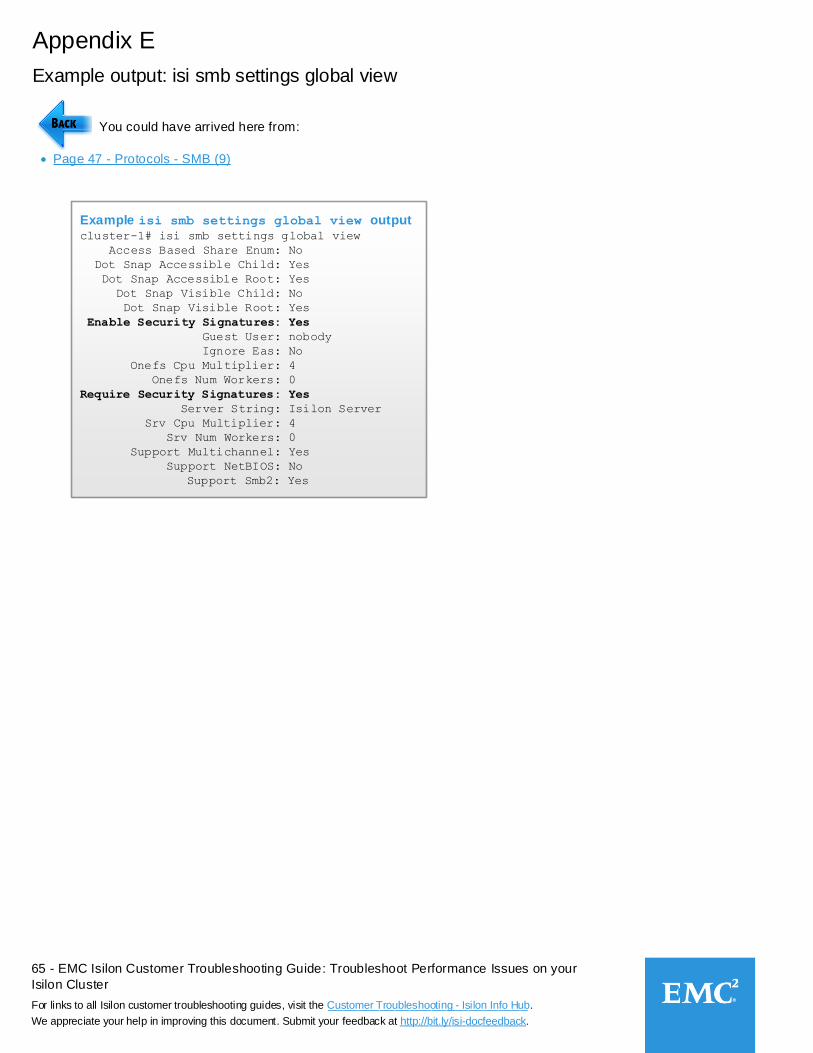
65 - EMC Isilon Customer Troubleshooting Guide: Troubleshoot Performance Issues on your
Isilon Cluster
For links to all Isilon customer troubleshooting guides, visit the Customer Troubleshooting - Isilon Info Hub.
We appreciate your help in improving this document. Submit your feedback at http://bit.ly/isi-docfeedback._________________
___________________________
Appendix E
Example output: isi smb settings global view
You could have arrived here from:
Page 47 - Protocols - SMB (9)
Example isi smb settings global view outputcluster-1# isi smb settings global view
Access Based Share Enum: No
Dot Snap Accessible Child: Yes
Dot Snap Accessible Root: Yes
Dot Snap Visible Child: No
Dot Snap Visible Root: Yes
Enable Security Signatures: Yes
Guest User: nobody
Ignore Eas: No
Onefs Cpu Multiplier: 4
Onefs Num Workers: 0
Require Security Signatures: Yes
Server String: Isilon Server
Srv Cpu Multiplier: 4
Srv Num Workers: 0
Support Multichannel: Yes
Support NetBIOS: No
Support Smb2: Yes
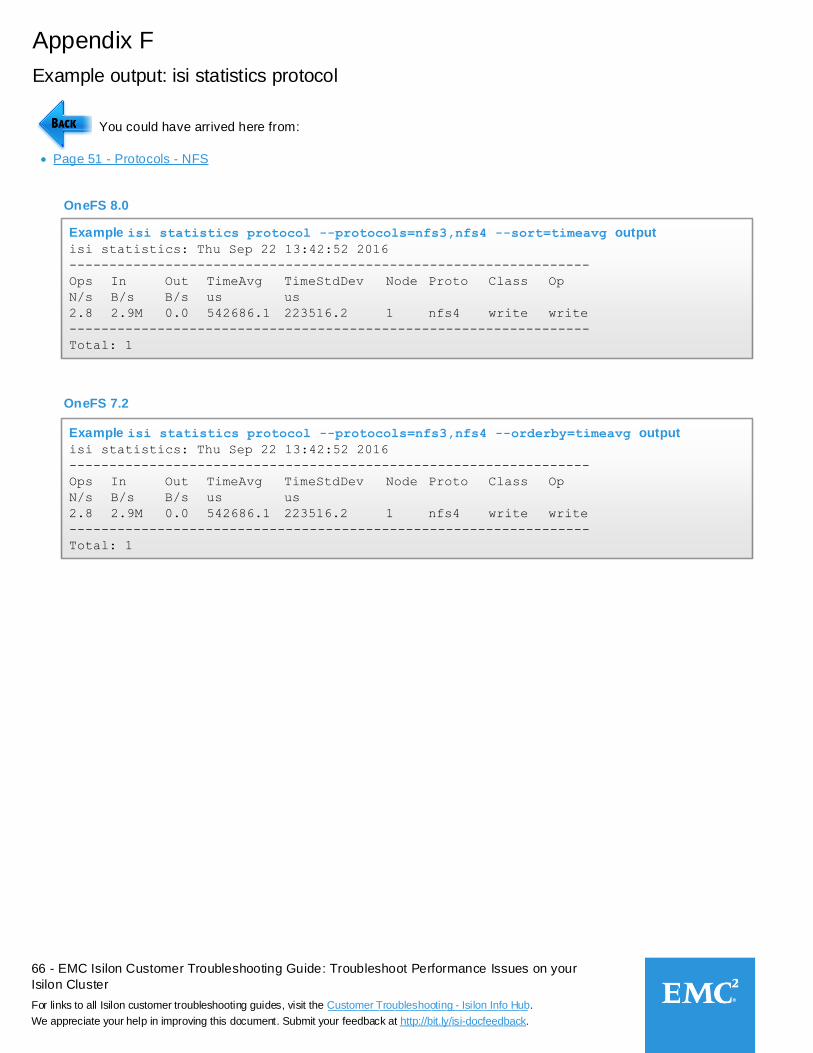
66 - EMC Isilon Customer Troubleshooting Guide: Troubleshoot Performance Issues on your
Isilon Cluster
For links to all Isilon customer troubleshooting guides, visit the Customer Troubleshooting - Isilon Info Hub.
We appreciate your help in improving this document. Submit your feedback at http://bit.ly/isi-docfeedback._________________
___________________________
Appendix F
Example output: isi statistics protocol
Example isi statistics protocol --protocols=nfs3,nfs4 --orderby=timeavg output
isi statistics: Thu Sep 22 13:42:52 2016
-----------------------------------------------------------------
Ops In Out TimeAvg TimeStdDev Node Proto Class Op
N/s B/s B/s us us
2.8 2.9M 0.0 542686.1 223516.2 1 nfs4 write write
-----------------------------------------------------------------
Total: 1
You could have arrived here from:
Page 51 - Protocols - NFS
Example isi statistics protocol --protocols=nfs3,nfs4 --sort=timeavg output
isi statistics: Thu Sep 22 13:42:52 2016
-----------------------------------------------------------------
Ops In Out TimeAvg TimeStdDev Node Proto Class Op
N/s B/s B/s us us
2.8 2.9M 0.0 542686.1 223516.2 1 nfs4 write write
-----------------------------------------------------------------
Total: 1
OneFS 8.0
OneFS 7.2
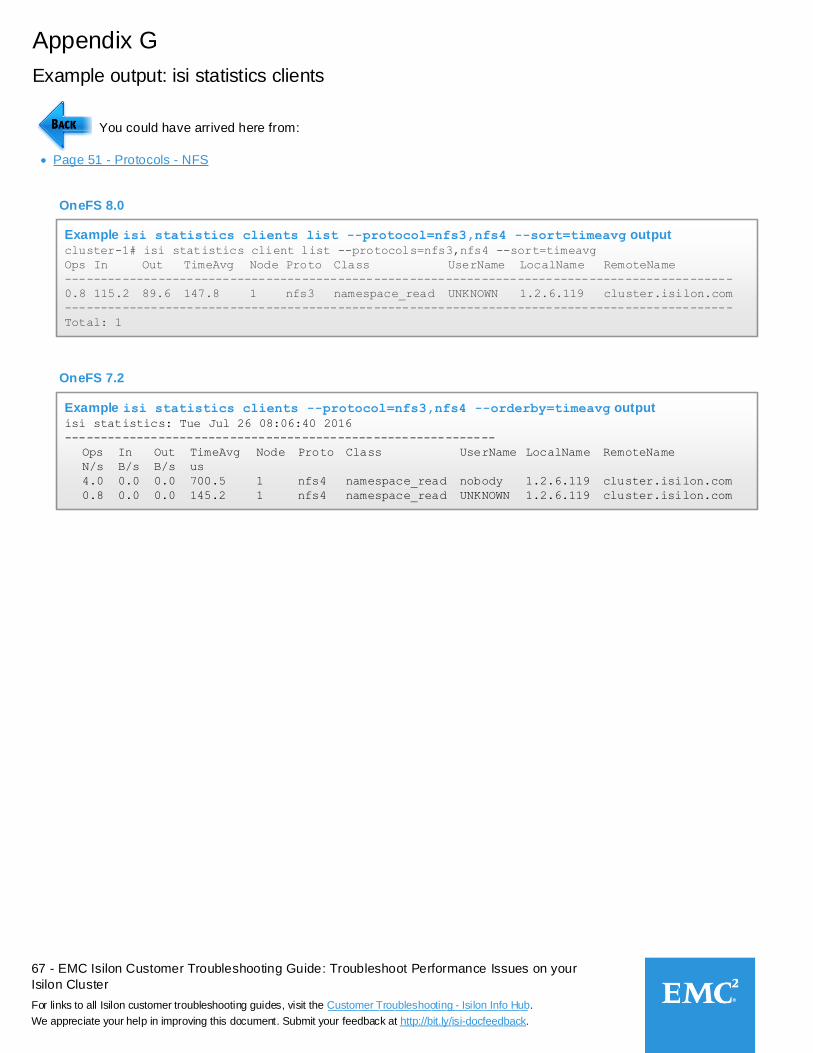
67 - EMC Isilon Customer Troubleshooting Guide: Troubleshoot Performance Issues on your
Isilon Cluster
For links to all Isilon customer troubleshooting guides, visit the Customer Troubleshooting - Isilon Info Hub.
We appreciate your help in improving this document. Submit your feedback at http://bit.ly/isi-docfeedback._________________
___________________________
Appendix G
Example output: isi statistics clients
Example isi statistics clients list --protocol=nfs3,nfs4 --sort=timeavg outputcluster-1# isi statistics client list --protocols=nfs3,nfs4 --sort=timeavg
Ops In Out TimeAvg Node Proto Class UserName LocalName RemoteName
---------------------------------------------------------------------------------------------
0.8 115.2 89.6 147.8 1 nfs3 namespace_read UNKNOWN 1.2.6.119 cluster.isilon.com
---------------------------------------------------------------------------------------------
Total: 1
You could have arrived here from:
Page 51 - Protocols - NFS
Example isi statistics clients --protocol=nfs3,nfs4 --orderby=timeavg outputisi statistics: Tue Jul 26 08:06:40 2016
------------------------------------------------------------
Ops In Out TimeAvg Node Proto Class UserName LocalName RemoteName
N/s B/s B/s us
4.0 0.0 0.0 700.5 1 nfs4 namespace_read nobody 1.2.6.119 cluster.isilon.com
0.8 0.0 0.0 145.2 1 nfs4 namespace_read UNKNOWN 1.2.6.119 cluster.isilon.com
OneFS 8.0
OneFS 7.2
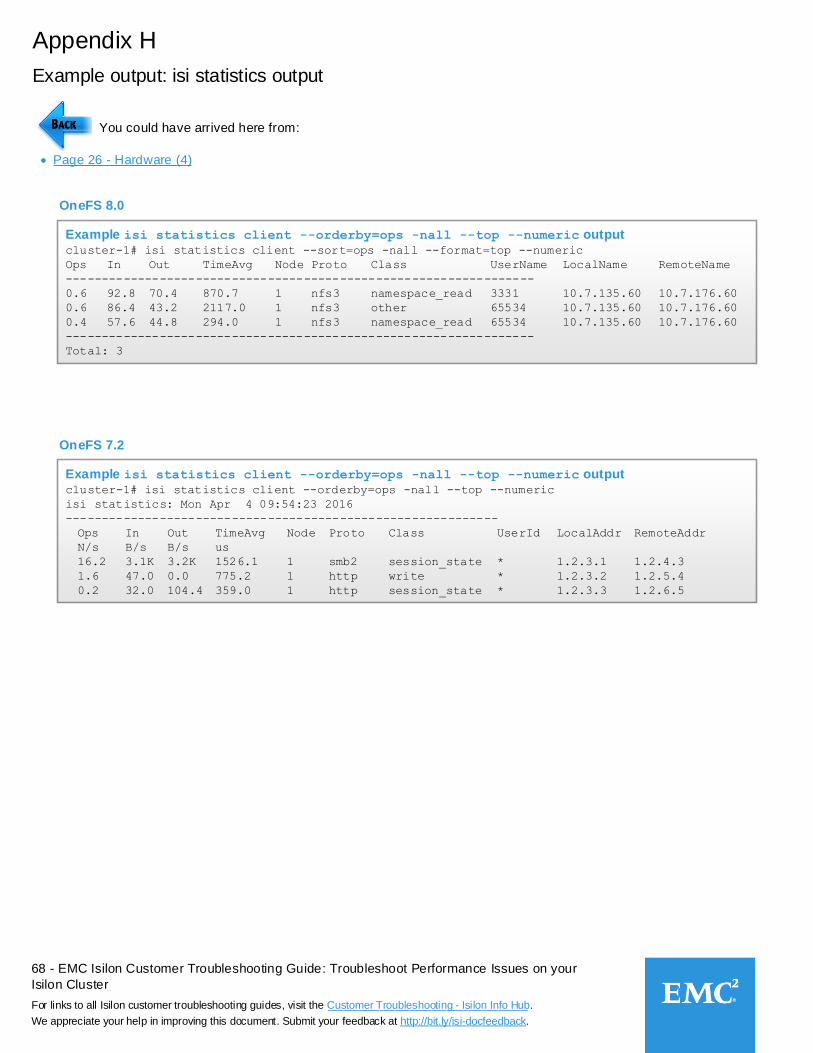
68 - EMC Isilon Customer Troubleshooting Guide: Troubleshoot Performance Issues on your
Isilon Cluster
For links to all Isilon customer troubleshooting guides, visit the Customer Troubleshooting - Isilon Info Hub.
We appreciate your help in improving this document. Submit your feedback at http://bit.ly/isi-docfeedback._________________
___________________________
Appendix H
Example output: isi statistics output
You could have arrived here from:
Page 26 - Hardware (4)
OneFS 8.0
OneFS 7.2
Example isi statistics client --orderby=ops -nall --top --numeric outputcluster-1# isi statistics client --orderby=ops -nall --top --numeric
isi statistics: Mon Apr 4 09:54:23 2016
------------------------------------------------------------
Ops In Out TimeAvg Node Proto Class UserId LocalAddr RemoteAddr
N/s B/s B/s us
16.2 3.1K 3.2K 1526.1 1 smb2 session_state * 1.2.3.1 1.2.4.3
1.6 47.0 0.0 775.2 1 http write * 1.2.3.2 1.2.5.4
0.2 32.0 104.4 359.0 1 http session_state * 1.2.3.3 1.2.6.5
Example isi statistics client --orderby=ops -nall --top --numeric outputcluster-1# isi statistics client --sort=ops -nall --format=top --numeric
Ops In Out TimeAvg Node Proto Class UserName LocalName RemoteName
-----------------------------------------------------------------
0.6 92.8 70.4 870.7 1 nfs3 namespace_read 3331 10.7.135.60 10.7.176.60
0.6 86.4 43.2 2117.0 1 nfs3 other 65534 10.7.135.60 10.7.176.60
0.4 57.6 44.8 294.0 1 nfs3 namespace_read 65534 10.7.135.60 10.7.176.60
-----------------------------------------------------------------
Total: 3

69 - EMC Isilon Customer Troubleshooting Guide: Troubleshoot Performance Issues on your
Isilon Cluster
For links to all Isilon customer troubleshooting guides, visit the Customer Troubleshooting - Isilon Info Hub.
We appreciate your help in improving this document. Submit your feedback at http://bit.ly/isi-docfeedback._________________
___________________________
Copyright © 2018 Dell Inc. or its subsidiaries. All rights reserved.
Dell believes the information in this publication is accurate as of its publication date. The information is subject to change without notice.
THE INFORMATION IN THIS PUBLICATION IS PROVIDED AS-IS. DELL MAKES NO REPRESENTATIONS OR WARRANTIES OF ANY KIND WITH RESPECT TO THE INFORMATION IN THIS PUBLICATION, AND SPECIFICALLY DISCLAIMS IMPLIED WARRANTIES OF MERCHANTABILITY OR FITNESS FOR A PARTICULAR PURPOSE. USE, COPYING, AND DISTRIBUTION OF ANY DELL SOFTWARE DESCRIBED IN THIS PUBLICATION REQUIRES AN APPLICABLE SOFTWARE LICENSE.
Dell, EMC, and other trademarks are trademarks of Dell Inc. or its subsidiaries. Other trademarks may be the property of their respective owners.
EMC CorporationHopkinton, Massachusetts 01748-91031-508-435-1000 in North America 1-866-464-7381www.EMC.com
Recommended