Emerging Trends in US Vehicle Travel Demand
www.travelbehavior.us
2014 EIA Energy Conference Nancy McGuckin
Travel Behavior Analyst

• Historic pattern of VMT per capita • Differences in changes since 2007 by State • Private and Commercial VMT in context • Why Millenials?
www.travelbehavior.us
8,000
8,500
9,000
9,500
10,000
10,500
VMT/
Capi
ta p
er Y
ear
www.travelbehavior.us
VMT per capita: an unprecedented change:
Source: McGuckin’s analysis of Census Population (Jul 1) and HPMS Historic VM-1 Tables including all VMT and Census Population Estimates

-15%
-10%
-5%
0%
5%
10%
15%
20%
Nor
th D
akot
aIn
dian
aAl
abam
aN
evad
aO
hio
Mon
tana
Mas
sach
uset
tsIo
wa
Kans
asW
iscon
sinAr
kans
asId
aho
Illin
ois
Miss
ouri
Sout
h Da
kota
Loui
siana
Min
neso
taN
ew Je
rsey
Calif
orni
aN
ew H
amps
hire
Mar
ylan
dO
klah
oma
Kent
ucky
Tenn
esse
eCo
nnec
ticut
Neb
rask
aN
orth
Car
olin
aM
aine
Was
hing
ton
Verm
ont
Virg
inia
New
Yor
kAr
izona
Mic
higa
nDC Ge
orgi
aO
rego
nU
tah
Dela
war
eW
est V
irgin
iaRh
ode
Isla
ndCo
lora
doN
ew M
exic
oW
yom
ing
Texa
sHa
wai
iSo
uth
Caro
lina
Penn
sylv
ania
Flor
ida
Miss
issip
piAl
aska
Chan
ge in
VM
T pe
r Cap
ita, 2
007-
2012
Changes in per capita VMT by State 2007-2012:
www.travelbehavior.us
Overall US decline is -6%
Source: McGuckin’s analysis of HPMS VM-2 including all VMT and ACS population estimates by state

Changes in per Capita VMT by State (graphic):
www.travelbehavior.us
Source of graphic: Steve Polzin, CUTR

Sources of Roadway VMT:
www.travelbehavior.us
Private vehicle travel:
Percent of Household-based VMT
Percent of Total
Roadway VMT Commuting 27
76
Shopping 15
Personal errands 19
Social and recreational 25
School/Medical/All Other 14
Subtotal Private vehicle VMT 100%
Commercial and Utility Vehicles: 24
Total Roadway Vehicle Travel: 100%
Commuting
Shopping
Personal business and
errands
Social and recreational
All other
Commercial and Utility
Vehicles
Source: McGuckin’s analysis of NHTS 2009 and HPMS VM-1 2009
All Roadway VMT

Private vehicle travel for all purposes has declined: (Measured in VMT per Capita)
www.travelbehavior.us
Source: McGuckin’s analysis of NHTS Data series
0
500
1,000
1,500
2,000
2,500
3,000
1995 2001 2009
Per c
apita
Ann
ual V
ehic
le M
iles
Trends in per Capita Annual Vehicle Miles by Major Purpose
Commuting
Shopping
Errands
SocRec inc. Visit
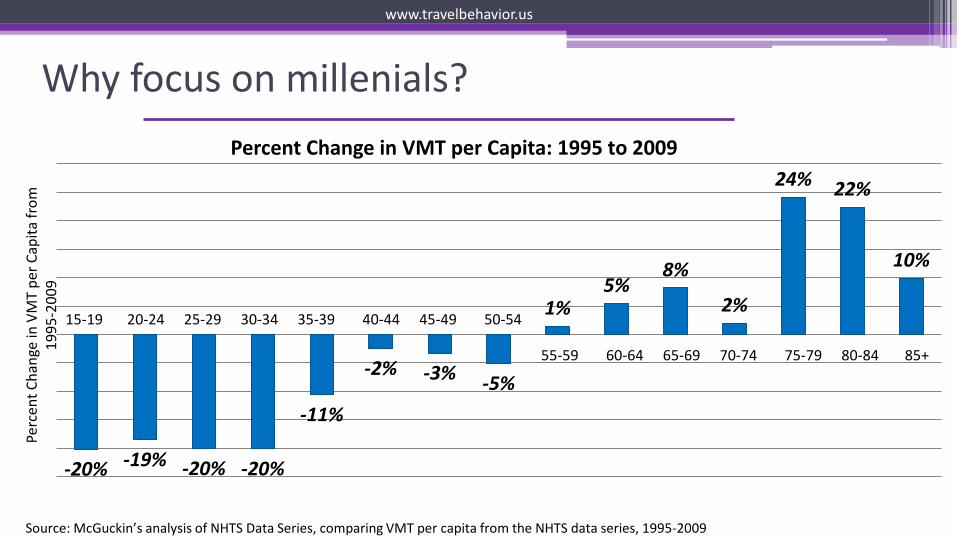
-20% -19% -20% -20%
-11%
-2% -3% -5%
1% 5%
8%
2%
24% 22%
10%
Perc
ent C
hang
e in
VM
T pe
r Cap
ita fr
om
1995
-200
9
Percent Change in VMT per Capita: 1995 to 2009
20-24 25-29 30-34 35-39 40-44 45-49 50-54
55-59 60-64 65-69 70-74 75-79 80-84 85+
Why focus on millenials?
www.travelbehavior.us
Source: McGuckin’s analysis of NHTS Data Series, comparing VMT per capita from the NHTS data series, 1995-2009
15-19
• The Economy • Social Trends • Changes in Values • Information-Communication Technology
www.travelbehavior.us
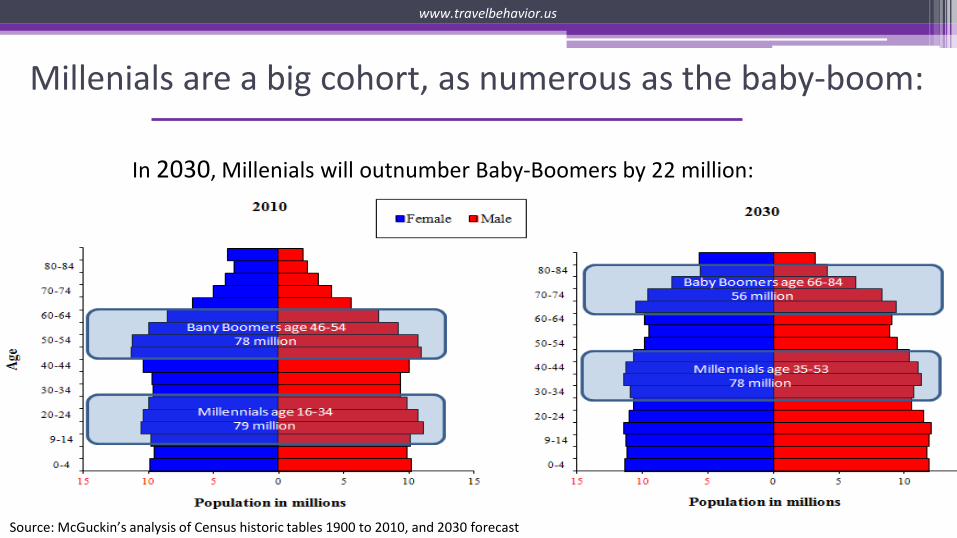
Millenials are a big cohort, as numerous as the baby-boom:
www.travelbehavior.us
In 2030, Millenials will outnumber Baby-Boomers by 22 million:
Source: McGuckin’s analysis of Census historic tables 1900 to 2010, and 2030 forecast
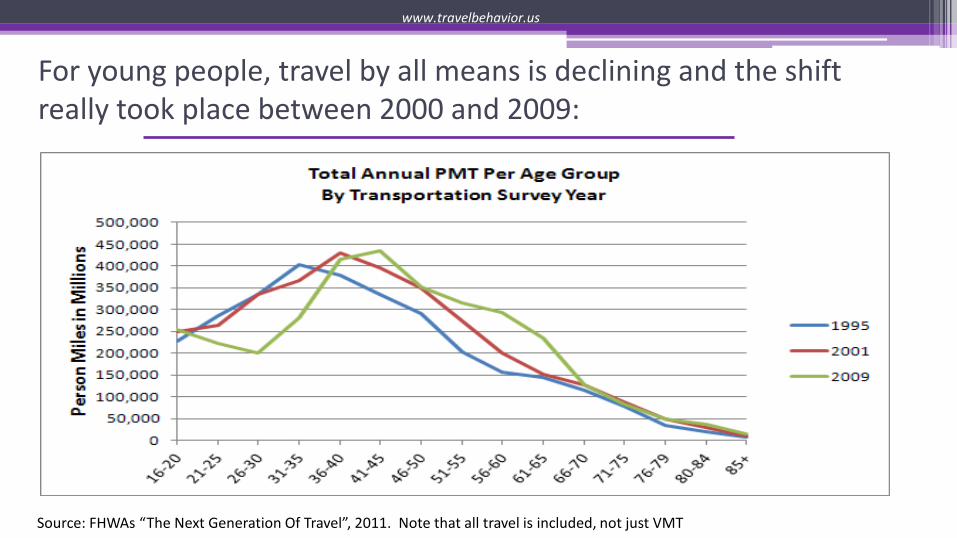
For young people, travel by all means is declining and the shift really took place between 2000 and 2009:
www.travelbehavior.us
Source: FHWAs “The Next Generation Of Travel”, 2011. Note that all travel is included, not just VMT

Young men’s vehicle travel rates declined more than women (16-29 years old):
www.travelbehavior.us
0
5
10
15
20
25
30
35
1990 1995 2001 2009
Trends in Vehicle Miles : 16-29 year olds
Men Women
0.0
0.5
1.0
1.5
2.0
2.5
3.0
3.5
1990 1995 2001 2009
Daily
Trip
s or M
iles p
er P
erso
n
Trends in Vehicle Trips : 16-29 year olds
Source: McGuckin’s analysis of NHTS Data Series

Factors influencing Millenials changing travel demand: www.travelbehavior.us
Information and Communications Technology
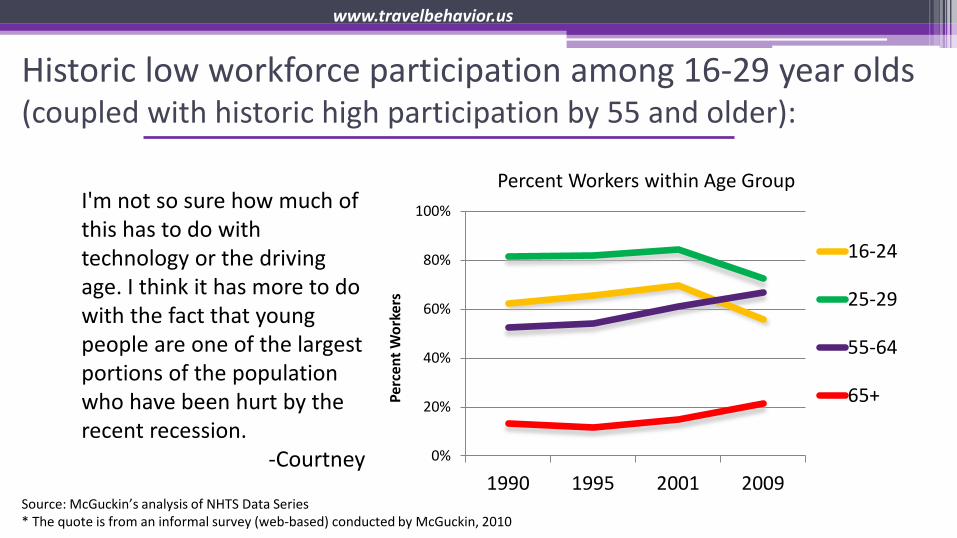
Historic low workforce participation among 16-29 year olds (coupled with historic high participation by 55 and older):
www.travelbehavior.us
0%
20%
40%
60%
80%
100%
1990 1995 2001 2009
Perc
ent W
orke
rs
Percent Workers within Age Group
16-24
25-29
55-64
65+
Source: McGuckin’s analysis of NHTS Data Series * The quote is from an informal survey (web-based) conducted by McGuckin, 2010
I'm not so sure how much of this has to do with technology or the driving age. I think it has more to do with the fact that young people are one of the largest portions of the population who have been hurt by the recent recession.
-Courtney

0.0
10.0
20.0
30.0
40.0
50.0
60.0
70.0
80.0
90.0
100.0
1995 1997 2002 2004 2007
Men Drivers as Percent of the Male Population
25-29
20-24
15-19
Young people (esp. men) delay licensing:
Source: McGuckin’s analysis of Table D20 Highway Statistics Historic Summary
www.travelbehavior.us
-- 39 percent said they’d rather walk/bike or use public transportation --37 percent said they were either too busy or didn't have the time to get a license. --32 percent said that owning and maintaining a vehicle was just too expensive. --31 percent said they could hitch a ride with someone else if needed. ---9 percent said they were worried about driving's effects on the environment. --8 percent said they could work or communicate online. Source: The Reasons for the Recent Decline in Young Driver Licensing in the U.S:, UMTRI, Schoettle and Sivak m Aug 2013, at: http://deepblue.lib.umich.edu/bitstream/handle/2027.42/99124/102951.pdf?sequence=1
www.travelbehavior.us
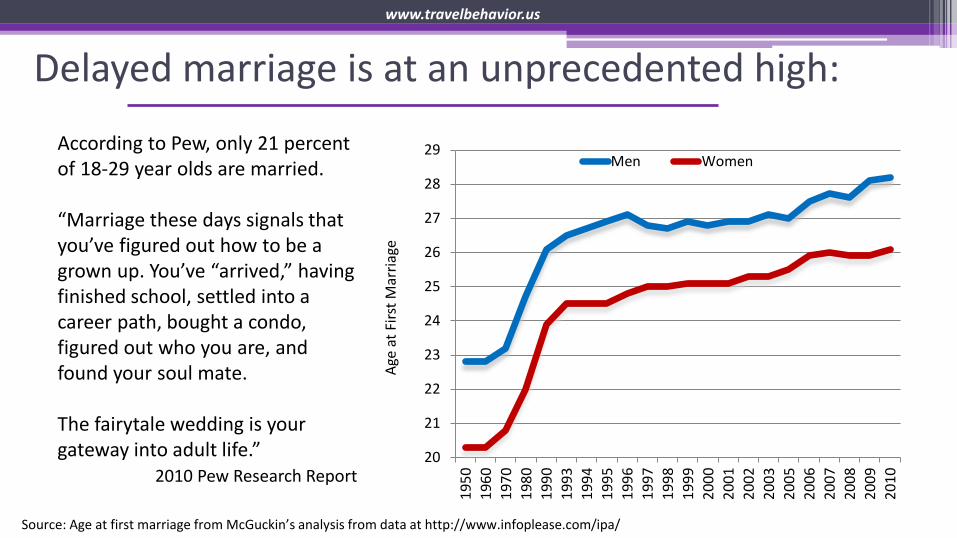
Delayed marriage is at an unprecedented high:
20
21
22
23
24
25
26
27
28
29
1950
1960
1970
1980
1990
1993
1994
1995
1996
1997
1998
1999
2000
2001
2002
2003
2005
2006
2007
2008
2009
2010
Age
at F
irst M
arria
ge
Men Women
Source: Age at first marriage from McGuckin’s analysis from data at http://www.infoplease.com/ipa/
According to Pew, only 21 percent of 18-29 year olds are married. “Marriage these days signals that you’ve figured out how to be a grown up. You’ve “arrived,” having finished school, settled into a career path, bought a condo, figured out who you are, and found your soul mate. The fairytale wedding is your gateway into adult life.” 2010 Pew Research Report
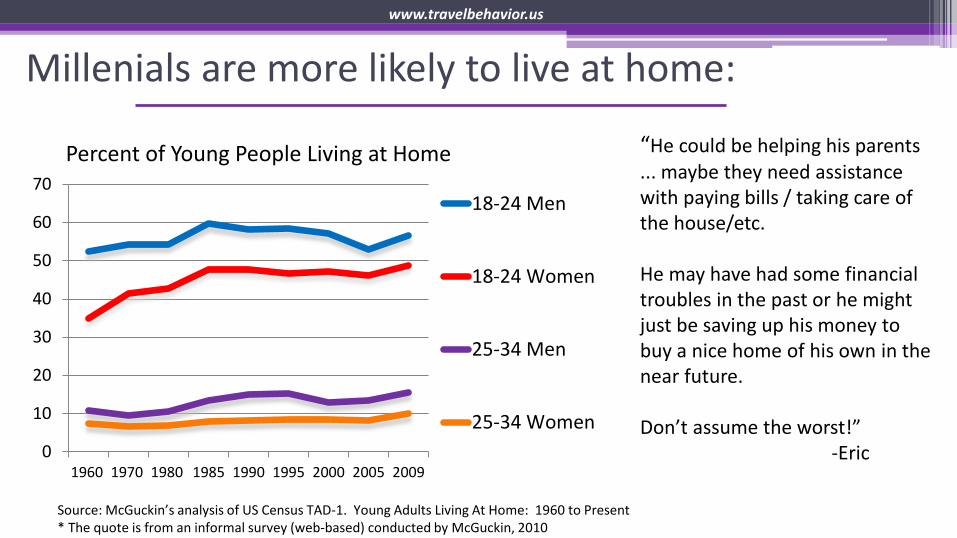
Millenials are more likely to live at home:
0
10
20
30
40
50
60
70
1960 1970 1980 1985 1990 1995 2000 2005 2009
Percent of Young People Living at Home
18-24 Men
18-24 Women
25-34 Men
25-34 Women
Source: McGuckin’s analysis of US Census TAD-1. Young Adults Living At Home: 1960 to Present * The quote is from an informal survey (web-based) conducted by McGuckin, 2010
“He could be helping his parents ... maybe they need assistance with paying bills / taking care of the house/etc. He may have had some financial troubles in the past or he might just be saving up his money to buy a nice home of his own in the near future. Don’t assume the worst!” -Eric
www.travelbehavior.us
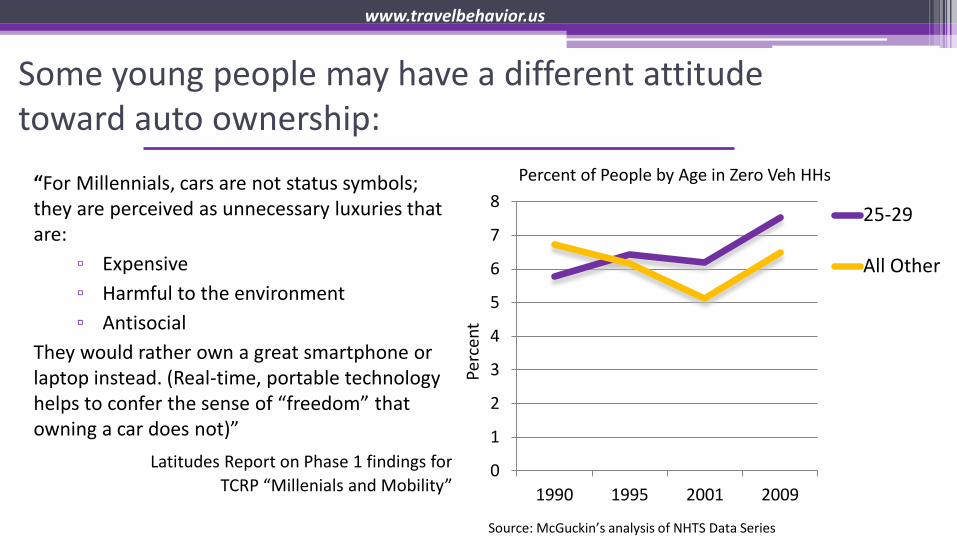
Some young people may have a different attitude toward auto ownership:
www.travelbehavior.us
0
1
2
3
4
5
6
7
8
1990 1995 2001 2009Pe
rcen
t
Percent of People by Age in Zero Veh HHs
25-29
All Other
Source: McGuckin’s analysis of NHTS Data Series
“For Millennials, cars are not status symbols; they are perceived as unnecessary luxuries that are:
▫ Expensive ▫ Harmful to the environment ▫ Antisocial
They would rather own a great smartphone or laptop instead. (Real-time, portable technology helps to confer the sense of “freedom” that owning a car does not)”
Latitudes Report on Phase 1 findings for TCRP “Millenials and Mobility”

Most non-drivers live in households with other drivers...part of the car-sharing culture:
www.travelbehavior.us
0
20
40
60
80
100
16-19 20-24 25-29 All other Non-Drivers
Percent of Non-Drivers who Live with Other Drivers “My roommate thinks I'm nuts for not driving a car, but I think he's nuts for going around the block for a half hour just to find a suitable parking spot.” -Jake
Source: McGuckin’s analysis of 2009 National Household Travel Survey * The quote is from an informal survey (web-based) conducted by McGuckin, 2010
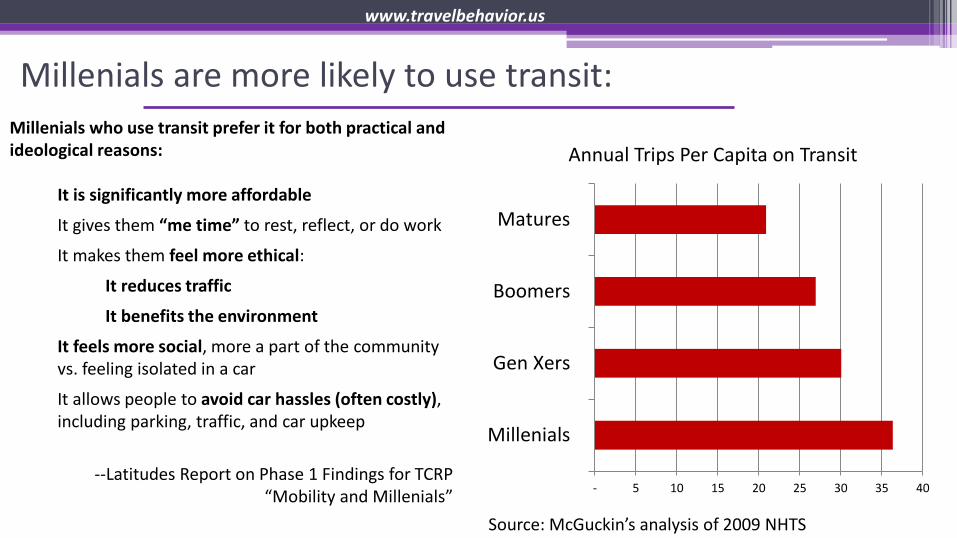
Millenials are more likely to use transit:
www.travelbehavior.us
Source: McGuckin’s analysis of 2009 NHTS
Millenials who use transit prefer it for both practical and ideological reasons:
It is significantly more affordable
It gives them “me time” to rest, reflect, or do work
It makes them feel more ethical:
It reduces traffic
It benefits the environment
It feels more social, more a part of the community vs. feeling isolated in a car
It allows people to avoid car hassles (often costly), including parking, traffic, and car upkeep
--Latitudes Report on Phase 1 Findings for TCRP
“Mobility and Millenials” - 5 10 15 20 25 30 35 40
Millenials
Gen Xers
Boomers
Matures
Annual Trips Per Capita on Transit
www.travelbehavior.us
• Widespread adoption of new technology • Some evidence for substitution effects for social and shopping • System-wide changes in the brick-and-mortar and delivery for goods and services

Unprecedented adoption of communications technology: www.travelbehavior.us
Source: Exploring America’s Online Experience::http://www.ntia.doc.gov/files/ntia/publications
Household Adoption Rates, 1997-2011
“The Internet is becoming the
town square for the global village of
tomorrow.”
Bill Gates Business@the Speed
of Thought

The Connected Generation • 72 percent of US households have internet
connection – 83 percent of individuals 18-29 (Census 2011)
• 90 percent of millenials use the Internet daily, compared to 79 percent of boomers
• 75 percent of millenials use social networking sites, compared to only 30 percent of boomers.
• There was a 21 percent increase in online course enrollment in colleges across the country in 2012.
www.travelbehavior.us
Percent who BYOD (Bring their own device) to the Office—Desk Phones Just Don’t Work for Me:
http://www.eweek.com/mobile/byod-trends-millennials-have-little-use-for-desk-phones-report.html The last three bullets from: Pew Research Center. The
Millenials: Confident. Connected. Open to Change.
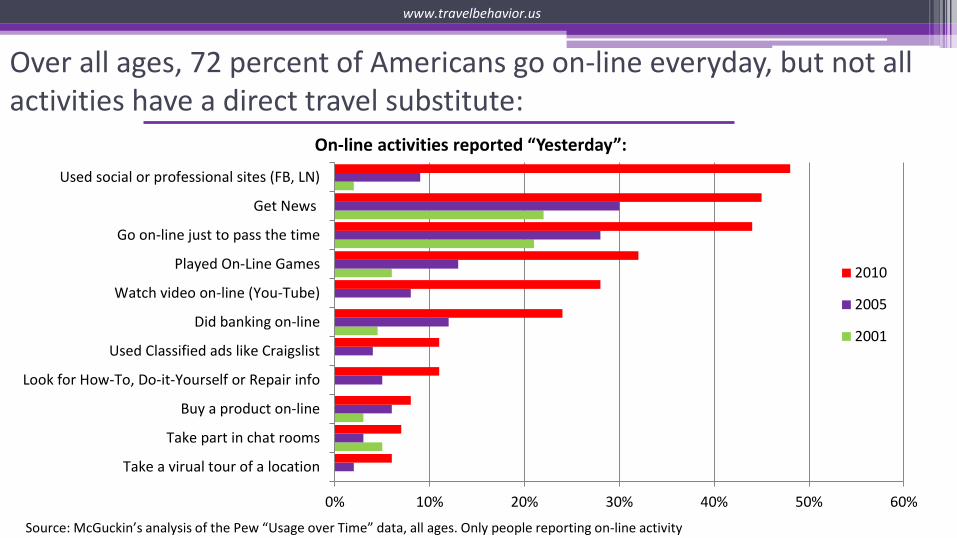
Over all ages, 72 percent of Americans go on-line everyday, but not all activities have a direct travel substitute:
www.travelbehavior.us
0% 10% 20% 30% 40% 50% 60%
Take a virual tour of a location
Take part in chat rooms
Buy a product on-line
Look for How-To, Do-it-Yourself or Repair info
Used Classified ads like Craigslist
Did banking on-line
Watch video on-line (You-Tube)
Played On-Line Games
Go on-line just to pass the time
Get News
Used social or professional sites (FB, LN)
On-line activities reported “Yesterday”:
2010
2005
2001
Source: McGuckin’s analysis of the Pew “Usage over Time” data, all ages. Only people reporting on-line activity
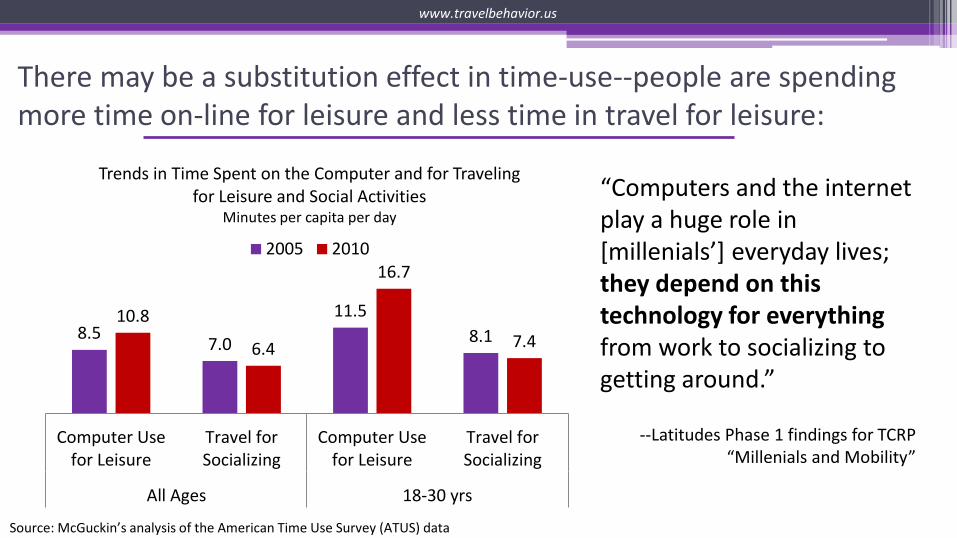
There may be a substitution effect in time-use--people are spending more time on-line for leisure and less time in travel for leisure:
www.travelbehavior.us
Source: McGuckin’s analysis of the American Time Use Survey (ATUS) data
“Computers and the internet play a huge role in [millenials’] everyday lives; they depend on this technology for everything from work to socializing to getting around.”
--Latitudes Phase 1 findings for TCRP “Millenials and Mobility”
8.5 7.0
11.5 8.1
10.8
6.4
16.7
7.4
Computer Usefor Leisure
Travel forSocializing
Computer Usefor Leisure
Travel forSocializing
All Ages 18-30 yrs
Trends in Time Spent on the Computer and for Traveling for Leisure and Social Activities
Minutes per capita per day
2005 2010

We need to be able to link on-line behavior and travel behavior more conclusively...
www.travelbehavior.us
339
412 418 406
317
395 388 392
16-24 24-34 35-54 AllAge of Respondent
Small but significant differences in shopping behavior on-line and on-road
Did Not Shop On-Line Made Purchases On-Line
Per capita shopping trips by on-line purchase behavior
Source: McGuckin’s analysis of 2009 NHTS, self reports only
77.1 percent of millennial respondents reported browsing online before purchasing in the store, nearly 17 percentage points higher than the general population. 58 percent of millennial respondents admitted to ‘showrooming’, nearly 10 percentage points higher than older shoppers. 56.3 percent of millennial respondents admitted to looking at an item in one store, yet purchasing the item online from a different retailer – double the rate of the general population.
Source: Millennial Shopping Habits By Samer Forzley Pythion.com
“Showrooming’ is browsing in a brick and mortar shop and then purchasing on-line for lower cost

System-wide changes are taking place all around us: (and faster than I can make a new slide!)
Old School New School • Bookstores • Travel Agent • Blockbuster • Avis/Hertz • Greyhound • Taxi
• Priceline • Facebook/Myspace • Big Data • The Internet
• Amazon /Kindle • On-line booking • Streaming Video • Zipcar • Megabus • Uber/Lyft
• Hotel Tonight • IM/Skype/Vine • Bigger Data • The Internet of Things
www.travelbehavior.us

People are responding to those changes the way people do:
www.travelbehavior.us
Incrementally
Via Peer Culture
Economically
Hard-to-quantify

• We are at a critical juncture • Many of the demographic factors that pushed VMT in the last few decades have played out • Need to re-evaluate our forecasts
www.travelbehavior.us

Several demographic ‘push’ factors for VMT growth have leveled off:
www.travelbehavior.us
0
20
40
60
80
100
1950 1960 1970 1980 1990 2000 2010Pe
rcen
t of o
f Hou
seho
lds
Changes in Family Structure
Single Person
Other Family (single parent, roomates, same sex couples)
Nuclear Family (Married Couple w/ or w/o children)
1.10
1.15
1.20
1.25
1.30
1.35
1.40
1969 1977 1983 1990 1995 2001 2009
Workers per Household
0.000.200.400.600.801.001.201.401.601.802.00
1969 1977 1983 1990 1995 2001 2009
Vehicles per Household
80 81 82 83 84 85 86 87 88
Millenials (16-27)
Gen X (28-44)
Boomers (45-63)
Matures 64+
Mode Share in POV
• Percent of Families with Children
• Women’s entry into labor force
• Migration from city to suburbs
• Vehicle occupancy (-->Drive alone)
Source: McGuckin’s analysis of NHTS data series
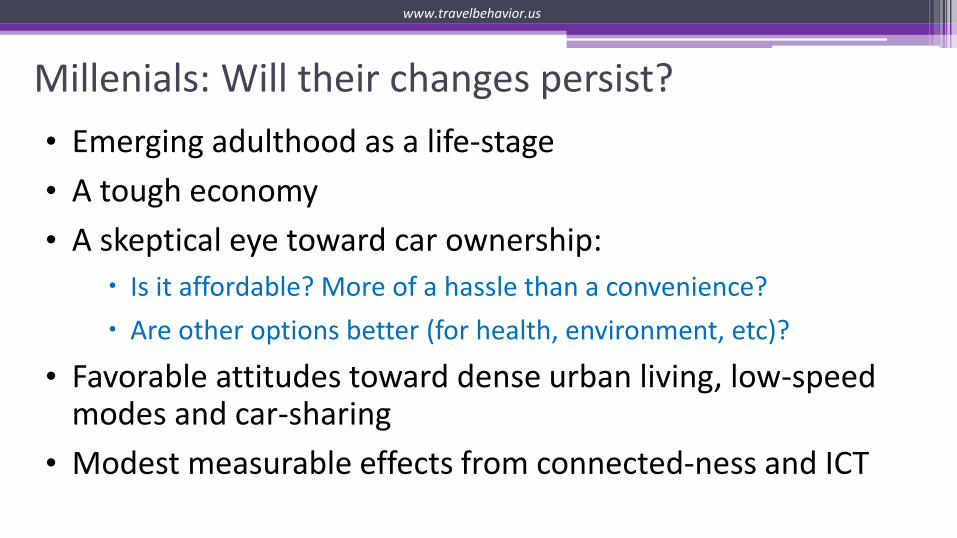
Millenials: Will their changes persist? • Emerging adulthood as a life-stage • A tough economy • A skeptical eye toward car ownership:
Is it affordable? More of a hassle than a convenience? Are other options better (for health, environment, etc)?
• Favorable attitudes toward dense urban living, low-speed modes and car-sharing
• Modest measurable effects from connected-ness and ICT
www.travelbehavior.us

www.travelbehavior.us
The Past is history....
0
1,000,000
2,000,000
3,000,000
4,000,000
5,000,000
6,000,00019
3619
3819
4019
4219
4419
4619
4819
5019
5219
5419
5619
5819
6019
6219
6419
6619
6819
7019
7219
7419
7619
7819
8019
8219
8419
8619
8819
9019
9219
9419
9619
9820
0020
0220
0420
0620
0820
1020
1220
1420
1620
1820
2020
2220
2420
2620
2820
30
Vehi
cle
Mile
s of T
rave
l (00
0,00
0)
Source: McGuckins analysis and projection of HPMS VM-1 data, re-creating the US PIRG graphic Fig 1 in “New Directions’
Return to Historic Growth Slow and Steady per Capita Declines
Stable per Capita VMT
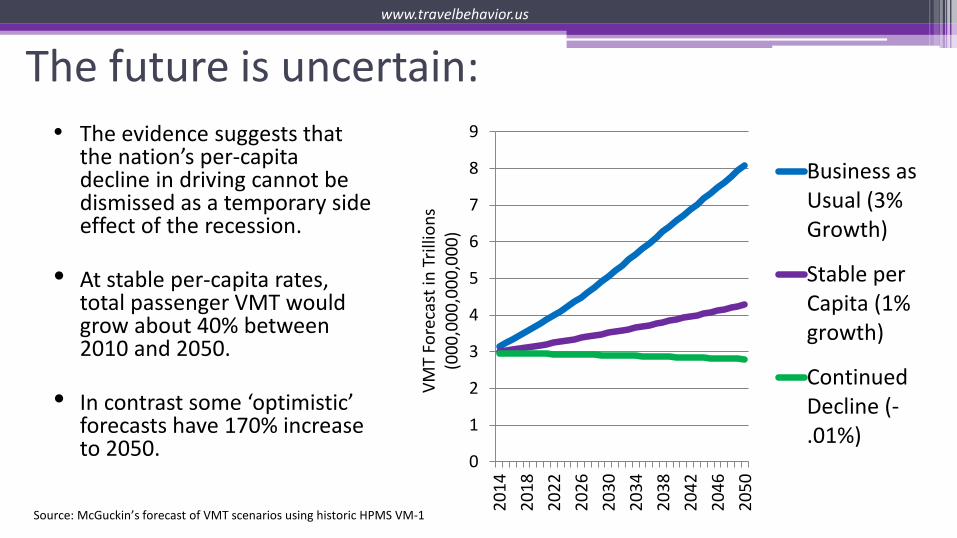
The future is uncertain: • The evidence suggests that
the nation’s per-capita decline in driving cannot be dismissed as a temporary side effect of the recession.
• At stable per-capita rates, total passenger VMT would grow about 40% between 2010 and 2050.
• In contrast some ‘optimistic’ forecasts have 170% increase to 2050.
www.travelbehavior.us
0
1
2
3
4
5
6
7
8
9
2014
2018
2022
2026
2030
2034
2038
2042
2046
2050
VMT
Fore
cast
in T
rillio
ns
(000
,000
,000
,000
)
Business asUsual (3%Growth)
Stable perCapita (1%growth)
ContinuedDecline (-.01%)
Source: McGuckin’s forecast of VMT scenarios using historic HPMS VM-1
Thank you! Emerging Trends in US Vehicle Travel Demand
Nancy McGuckin
www.travelbehavior.us
www.travelbehavior.us
Recommended