1
Post Change Emissions
Emissions Increases: Step 1 of an NSR Applicability Determination
in NSR Reform
Gerallyn DukeMarch 27, 2011
1

2
Context
NSR Reform was promulgated in 2002, then challenged in the DC Circuit Court in 2006.
The Court upheld the concept that Congress, via the Clean Air Act, intended NSR to be based on increases in actual emissions.� No“potential-to-potential” test (see vacature of Clean Unit
Test);� No exceptions to NSR for pollution control equipment (see
vacature of Pollution Control Exclusion).
Post-change emissions – pre-change emissions
= the emissions increase
Step One Basic Calculation
3
4
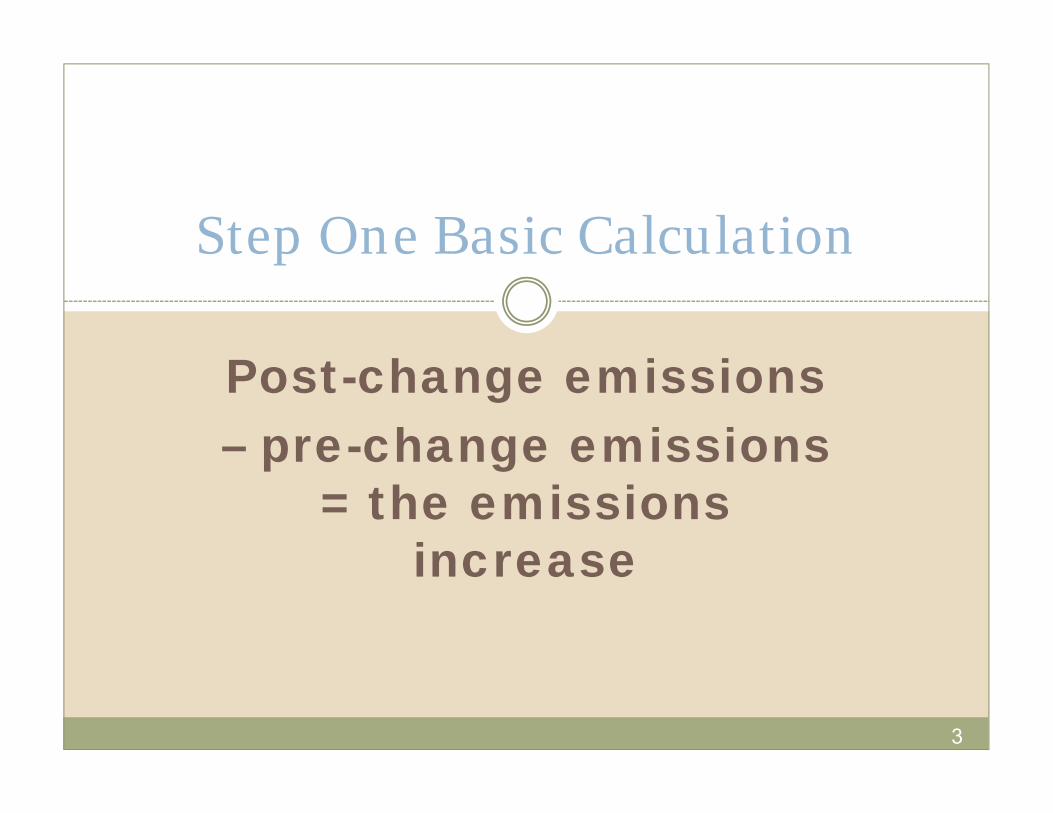
Emissions Factors
Emissions are basically calculated as the product of an emissions factor (EF) and an activity level (AL):
E = EF x AL
AL can be the activity level over a day, a month, a year, etc. Example: E = 5 lbs of VOC/widget x 100 widgets/year = 500 lbs
VOC/year
EFs and ALs will vary depending on whether we are talking about the past (what actually happened) or the future (what will happen).
5
Basic Concepts
Baseline actual emissions (already covered) Post-change emissions will always be a
calculated value based on the projected emission factor and projected activity level after the change.
Differences between how a unit operated during the baseline period and how the unit will be projected to operate in the future are critical!
6
Your Mission
Isolate the actualemissions increase relative to the actual emissions baseline that is projected to occur due solely to the project.
(should you choose to accept it)
- How will the EF change?
- How will the AL change?
Baseline Operations vs. Projected Operations
7

8
PAE: Part 1 – How long into the future?
Projected Actual Emissions (PAE): maximum annual emissions rate, in tons per year, that an existing unit is expected to emit in:
� EITHER: one of the 5 years (12-month period) following the date the unit resumes regular operation after the project;
� OR: one of the 10 years following that date, if the project involves increasing the unit’s design capacity or its PTE and full utilization would result in either a significant increase by itself or a significant net increase.
9
PAE: What not to do
Do not base projected emissions on�average annual emissions expected to
occur, or�unreasonable assumptions.
10
PAE: Part II – What to Include
The maximum annual emissions rate must:� Include fugitive emissions for all source
categories;� Include emissions from start-up, shut-
downs and malfunctions;� Include known future applicable
requirements.
A unit’s maximum annual rate must be calculated as the product of:The projected emissions factor:
�Based on the unit’s post-change reasonable expectations;�Must take into account any legally enforceable restrictions.
-The projected activity level:�Must be aligned with the unit’s historical operation (e.g. downtime);�Must take into account all available information on the expected and the highest maximum post-change utilization.
PAE
Part III:
The Projection
12
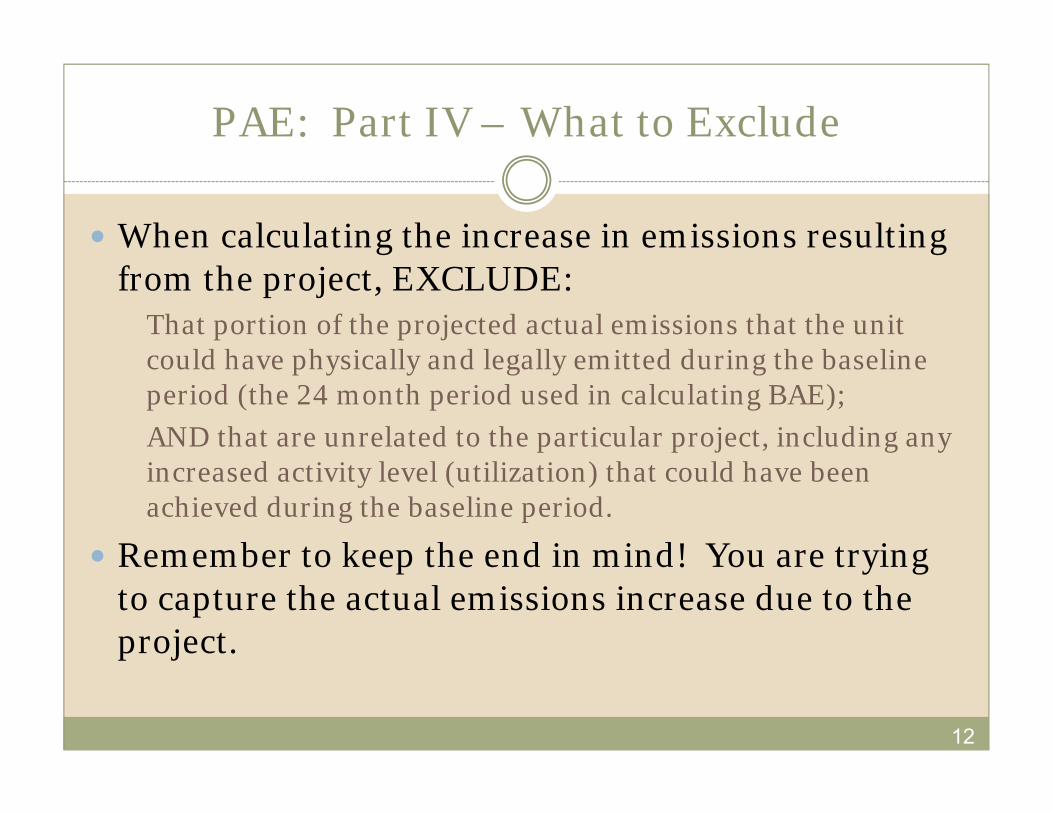
PAE: Part IV – What to Exclude
When calculating the increase in emissions resulting from the project, EXCLUDE:� That portion of the projected actual emissions that the unit
could have physically and legally emitted during the baseline period (the 24 month period used in calculating BAE);
� AND that are unrelated to the particular project, including any increased activity level (utilization) that could have been achieved during the baseline period.
Remember to keep the end in mind! You are trying to capture the actual emissions increase due to the project.
13
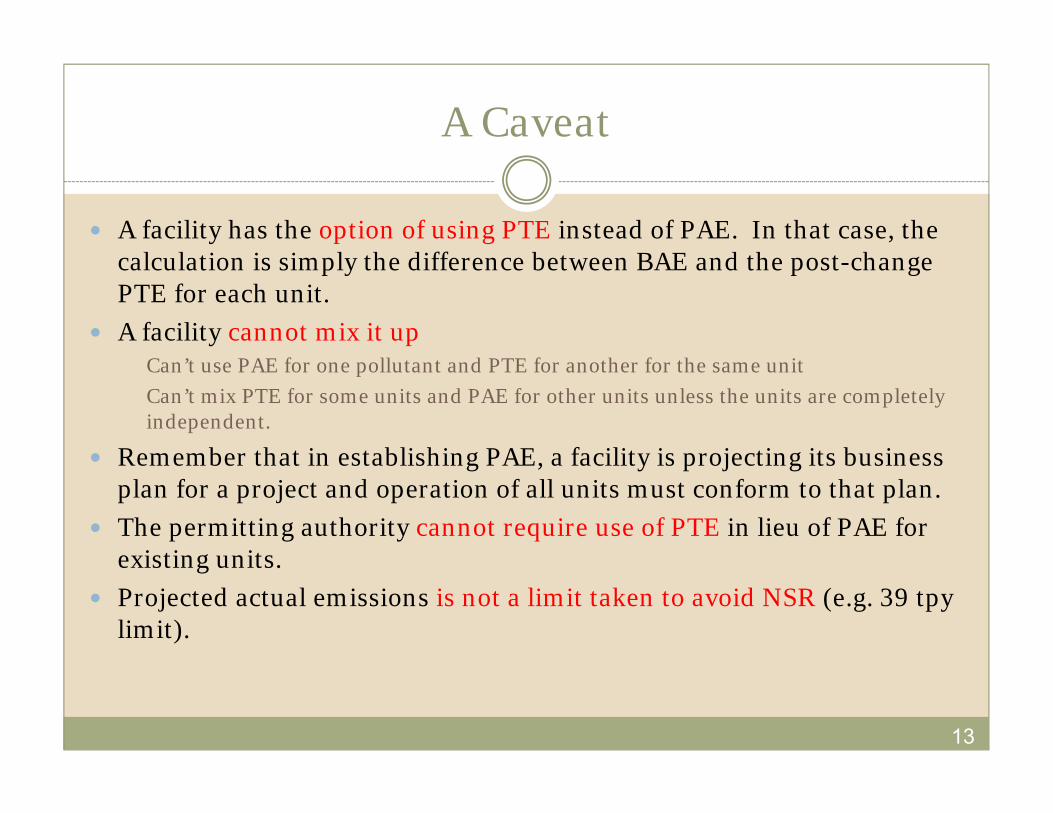
A Caveat
A facility has the option of using PTE instead of PAE. In that case, the calculation is simply the difference between BAE and the post-change PTE for each unit.
A facility cannot mix it up� Can’t use PAE for one pollutant and PTE for another for the same unit� Can’t mix PTE for some units and PAE for other units unless the units are completely
independent.
Remember that in establishing PAE, a facility is projecting its business plan for a project and operation of all units must conform to that plan.
The permitting authority cannot require use of PTE in lieu of PAE for existing units.
Projected actual emissions is not a limit taken to avoid NSR (e.g. 39 tpylimit).
14
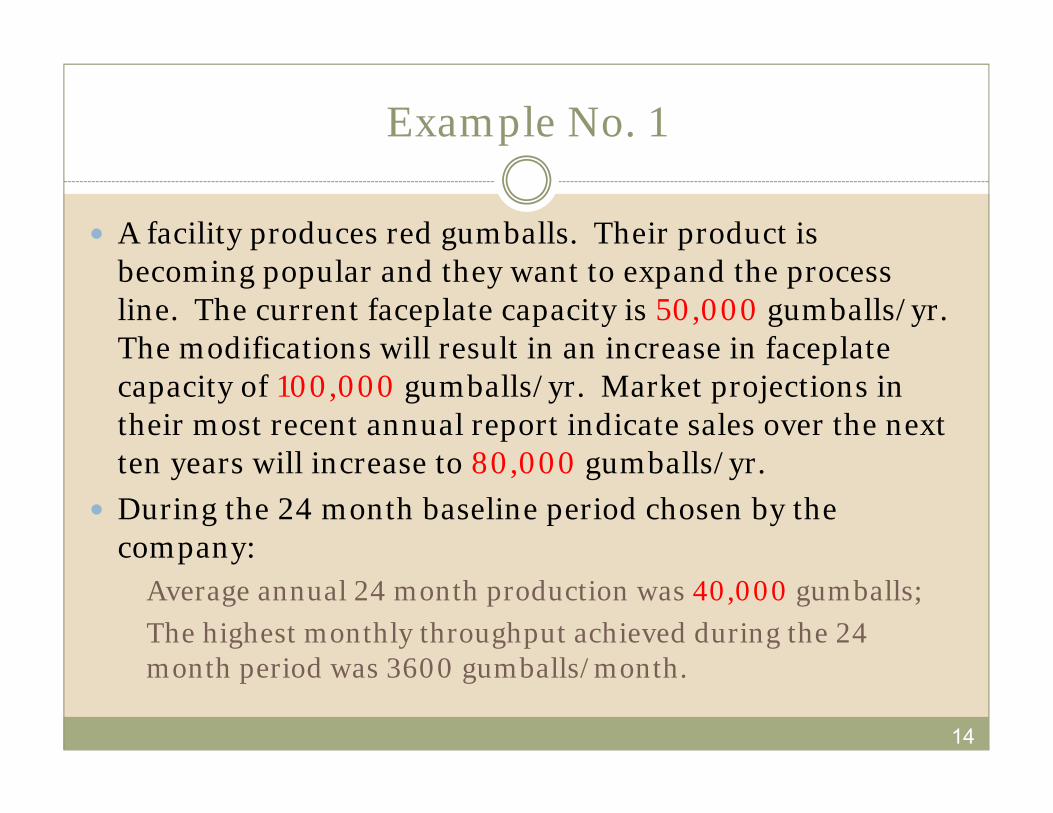
Example No. 1
A facility produces red gumballs. Their product is becoming popular and they want to expand the process line. The current faceplate capacity is 50,000 gumballs/yr. The modifications will result in an increase in faceplate capacity of 100,000 gumballs/yr. Market projections in their most recent annual report indicate sales over the next ten years will increase to 80,000 gumballs/yr.
During the 24 month baseline period chosen by the company:� Average annual 24 month production was 40,000 gumballs;� The highest monthly throughput achieved during the 24
month period was 3600 gumballs/month.
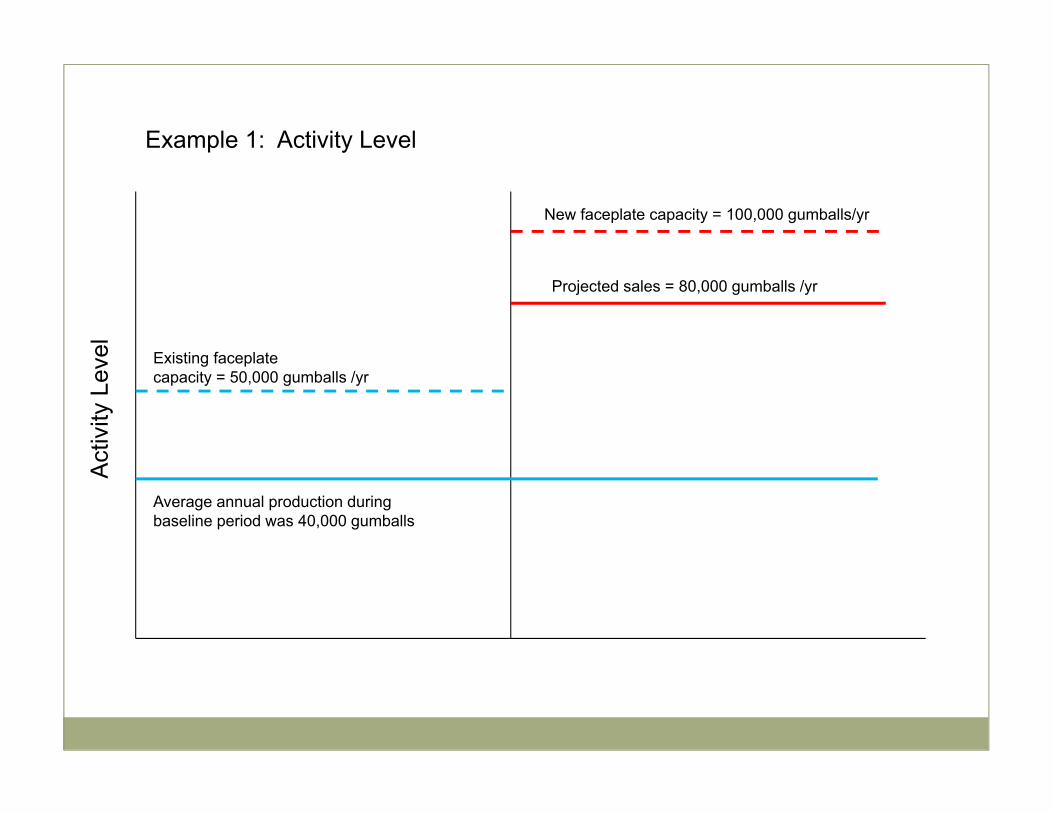
Average annual production during baseline period was 40,000 gumballs
Act
ivity
Lev
el
New faceplate capacity = 100,000 gumballs/yr
Existing faceplate capacity = 50,000 gumballs /yr
Projected sales = 80,000 gumballs /yr
Example 1: Activity Level
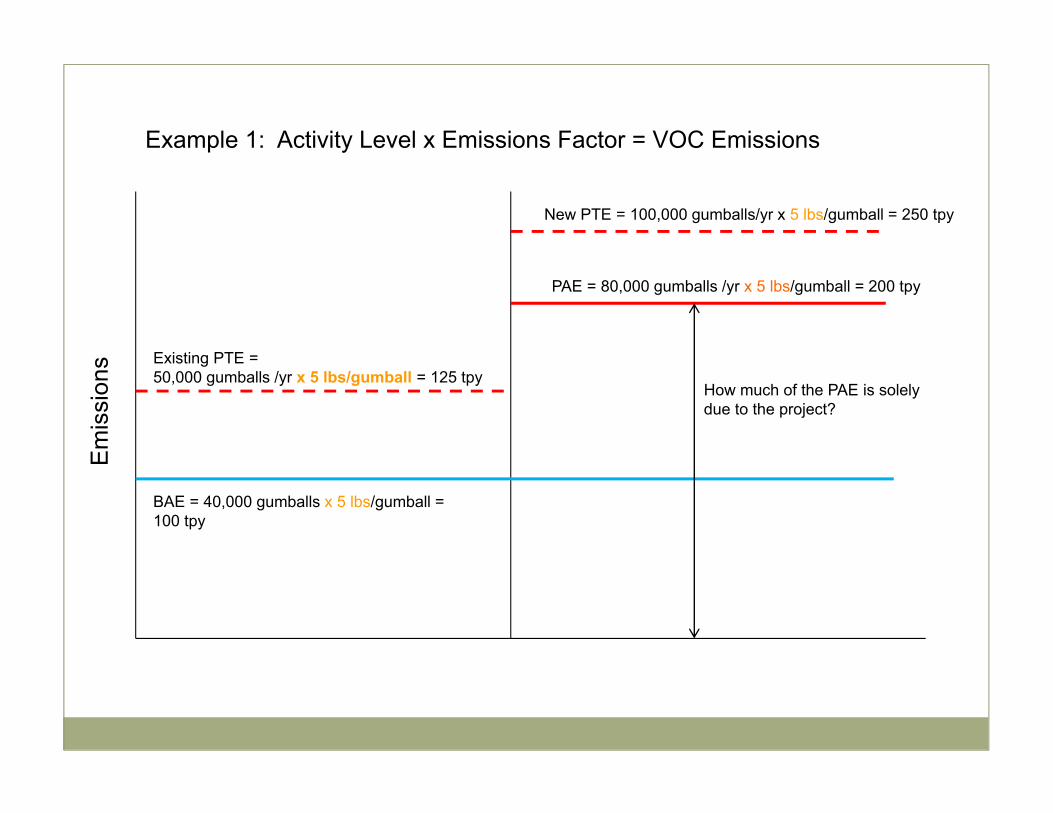
BAE = 40,000 gumballs x 5 lbs/gumball = 100 tpy
Em
issi
ons
New PTE = 100,000 gumballs/yr x 5 lbs/gumball = 250 tpy
Existing PTE = 50,000 gumballs /yr x 5 lbs/gumball = 125 tpy
PAE = 80,000 gumballs /yr x 5 lbs/gumball = 200 tpy
Example 1: Activity Level x Emissions Factor = VOC Emissions
How much of the PAE is solelydue to the project?
17
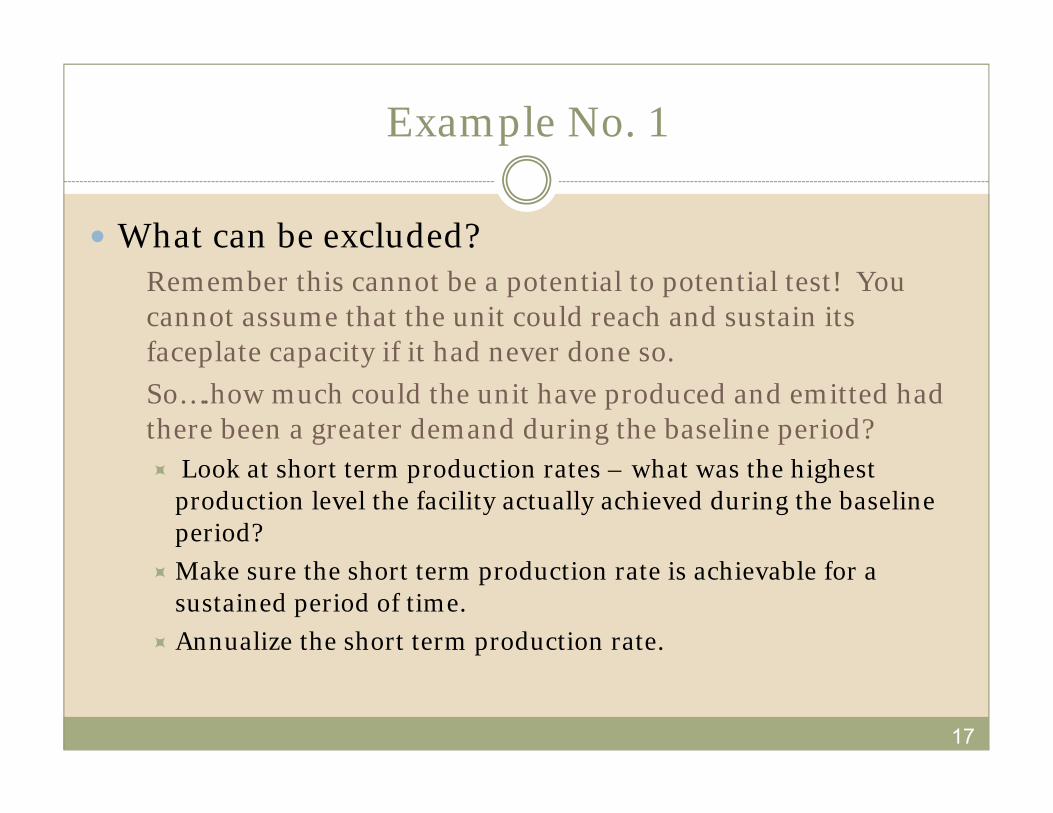
Example No. 1
What can be excluded?� Remember this cannot be a potential to potential test! You
cannot assume that the unit could reach and sustain its faceplate capacity if it had never done so.
� So….how much could the unit have produced and emitted had there been a greater demand during the baseline period? Look at short term production rates – what was the highest
production level the facility actually achieved during the baseline period?
Make sure the short term production rate is achievable for a sustained period of time.
Annualize the short term production rate.
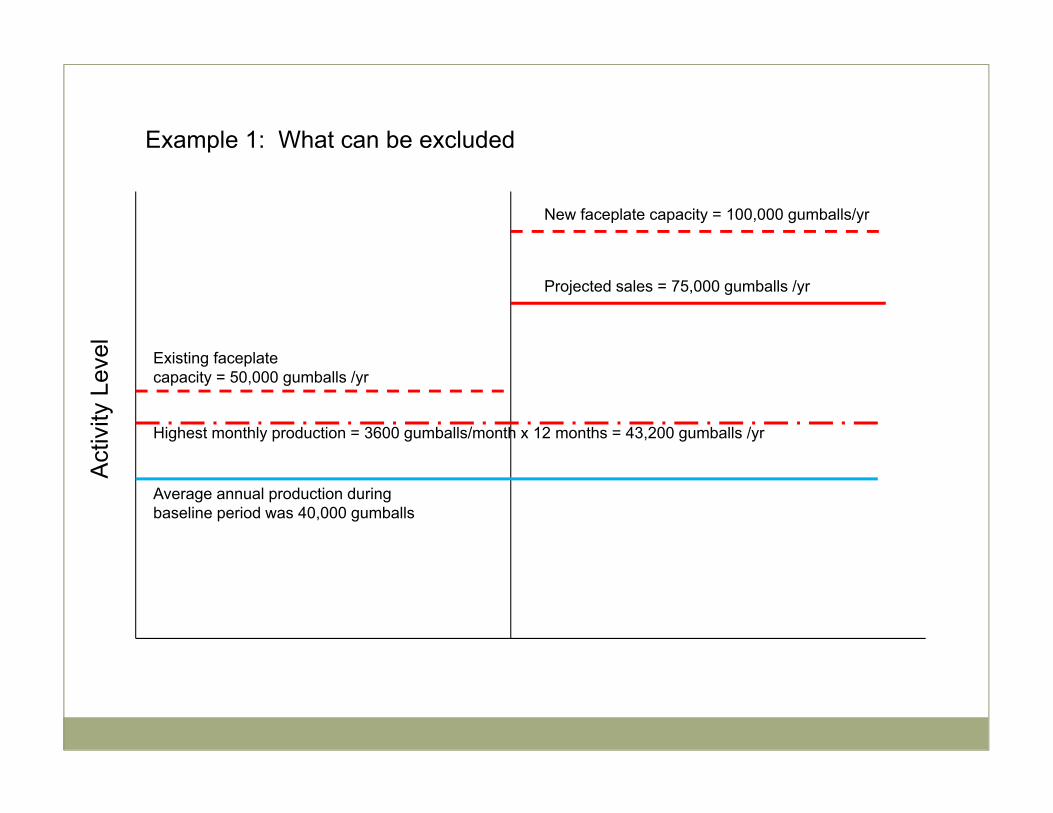
Average annual production during baseline period was 40,000 gumballs
Act
ivity
Lev
el
New faceplate capacity = 100,000 gumballs/yr
Existing faceplate capacity = 50,000 gumballs /yr
Projected sales = 75,000 gumballs /yr
Example 1: What can be excluded
Highest monthly production = 3600 gumballs/month x 12 months = 43,200 gumballs /yr
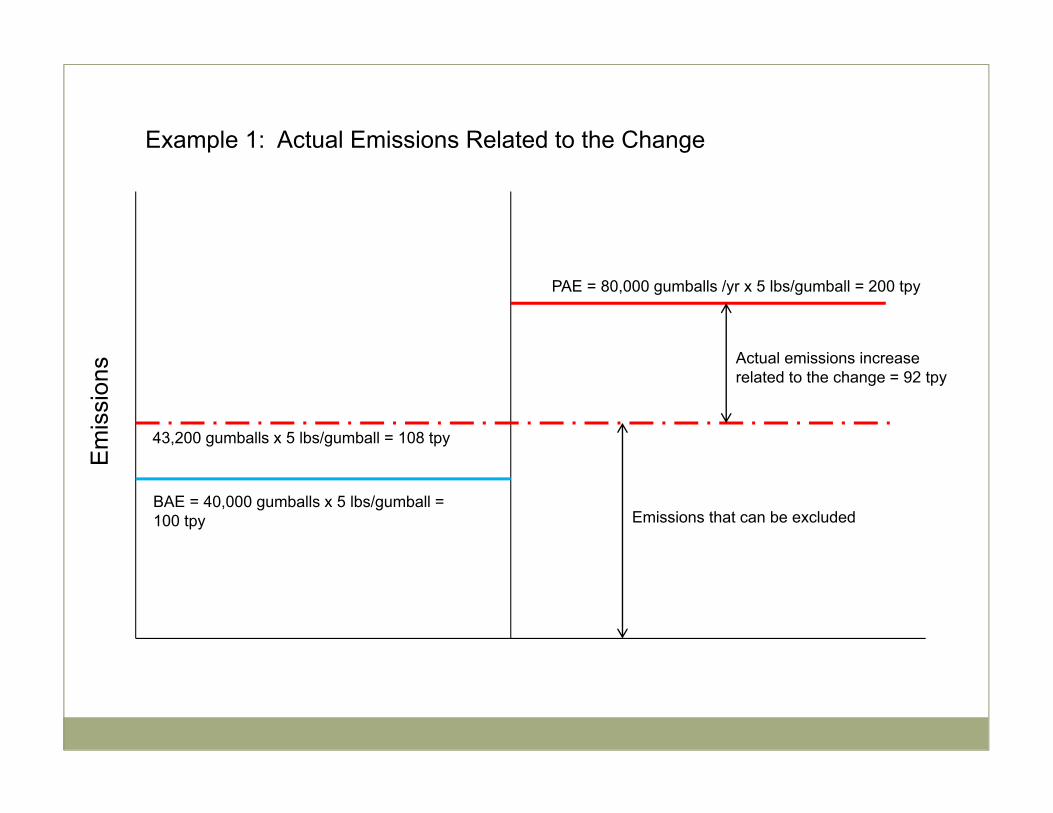
BAE = 40,000 gumballs x 5 lbs/gumball = 100 tpy
Em
issi
ons
PAE = 80,000 gumballs /yr x 5 lbs/gumball = 200 tpy
Example 1: Actual Emissions Related to the Change
Emissions that can be excluded
Actual emissions increase related to the change = 92 tpy
43,200 gumballs x 5 lbs/gumball = 108 tpy
20
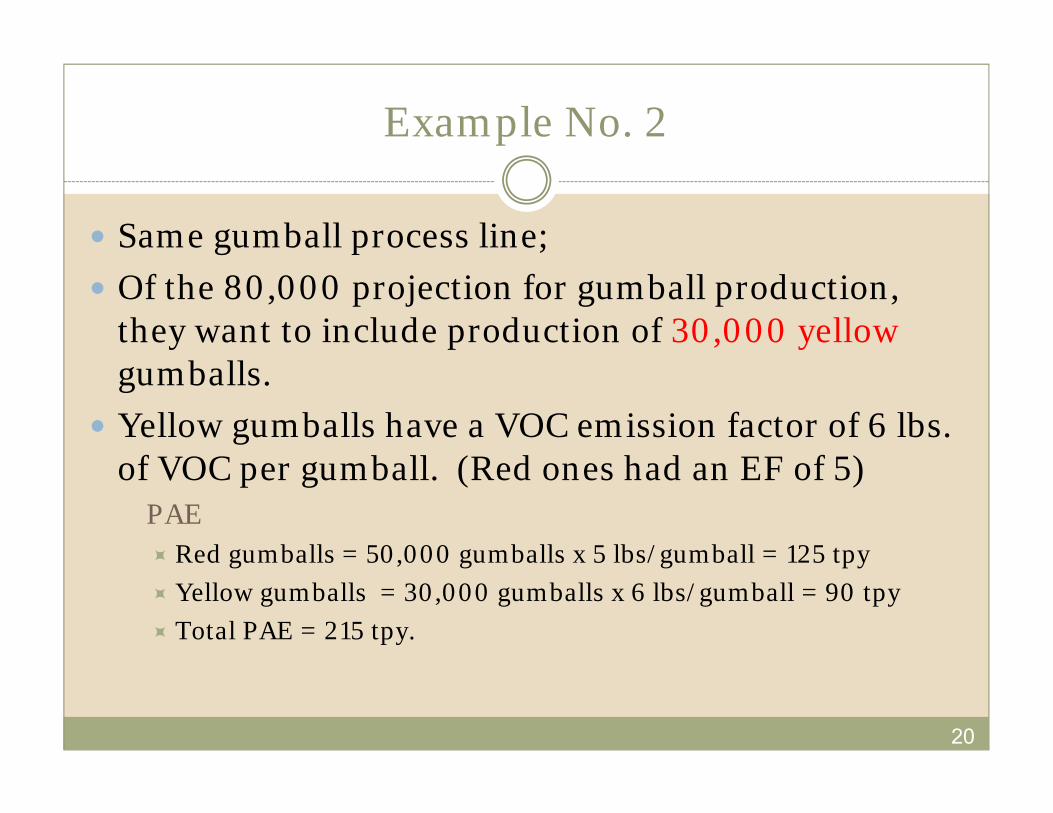
Example No. 2
Same gumball process line; Of the 80,000 projection for gumball production,
they want to include production of 30,000 yellow gumballs.
Yellow gumballs have a VOC emission factor of 6 lbs. of VOC per gumball. (Red ones had an EF of 5) � PAE
Red gumballs = 50,000 gumballs x 5 lbs/gumball = 125 tpy Yellow gumballs = 30,000 gumballs x 6 lbs/gumball = 90 tpy Total PAE = 215 tpy.
Em
issi
ons
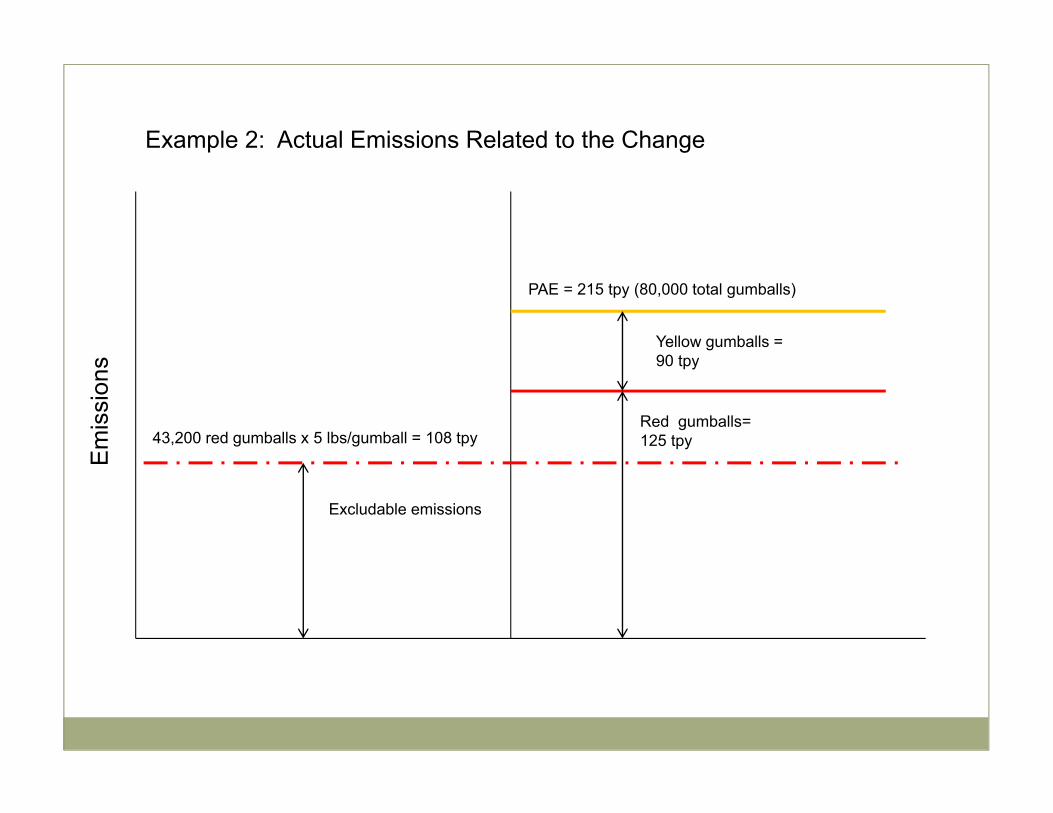
PAE = 215 tpy (80,000 total gumballs)
Example 2: Actual Emissions Related to the Change
43,200 red gumballs x 5 lbs/gumball = 108 tpyRed gumballs=125 tpy
Yellow gumballs =90 tpy
Excludable emissions
22
But….
You can only exclude that portion of the projected actual emissions that you could have accommodated during the baseline period.
The facility could not produce yellow gumballs during the baseline period.
So…

Em
issi
ons
PAE = 215 tpy
Example 2: Actual Emissions Related to the Change
43,200 red gumballs x 5 lbs/gumball = 108 tpyRed gumballs=125 tpy
Yellow gumballs =90 tpy
Excludable emissions
Total increase =90 + 125 – 108 =107 tpy
24
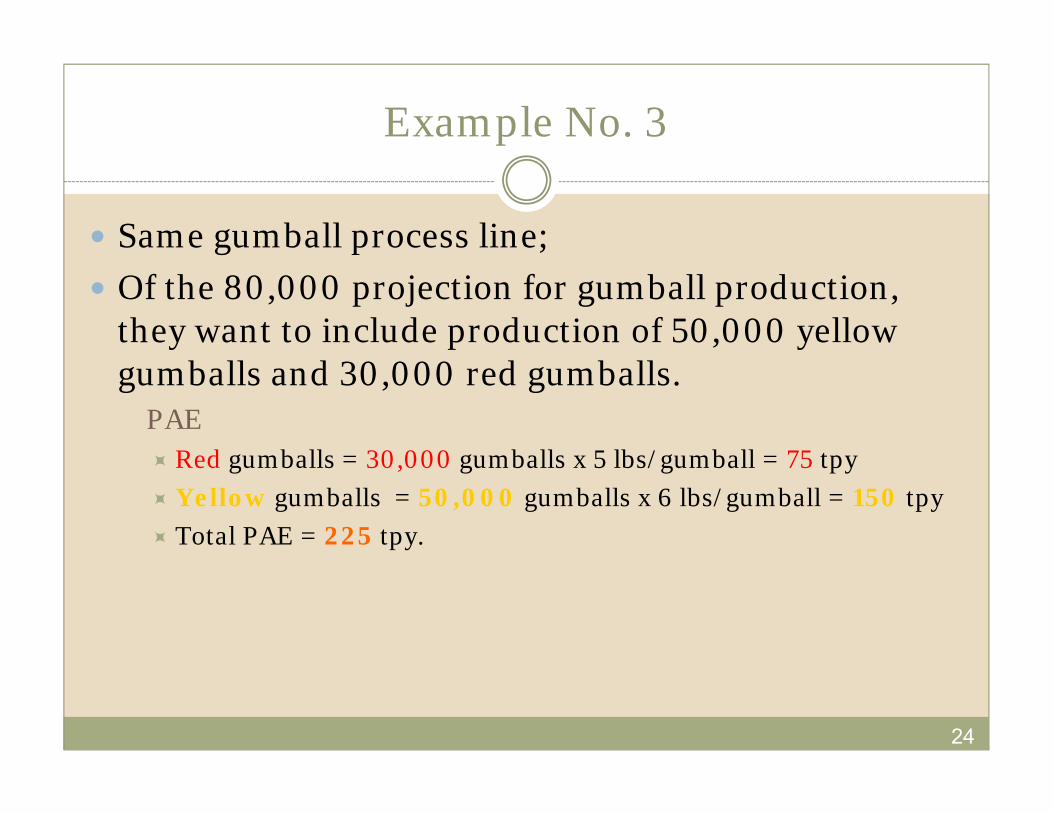
Example No. 3
Same gumball process line; Of the 80,000 projection for gumball production,
they want to include production of 50,000 yellow gumballs and 30,000 red gumballs. � PAE
Red gumballs = 30,000 gumballs x 5 lbs/gumball = 75 tpy Yellow gumballs = 50,000 gumballs x 6 lbs/gumball = 150 tpy Total PAE = 225 tpy.
Em
issi
ons
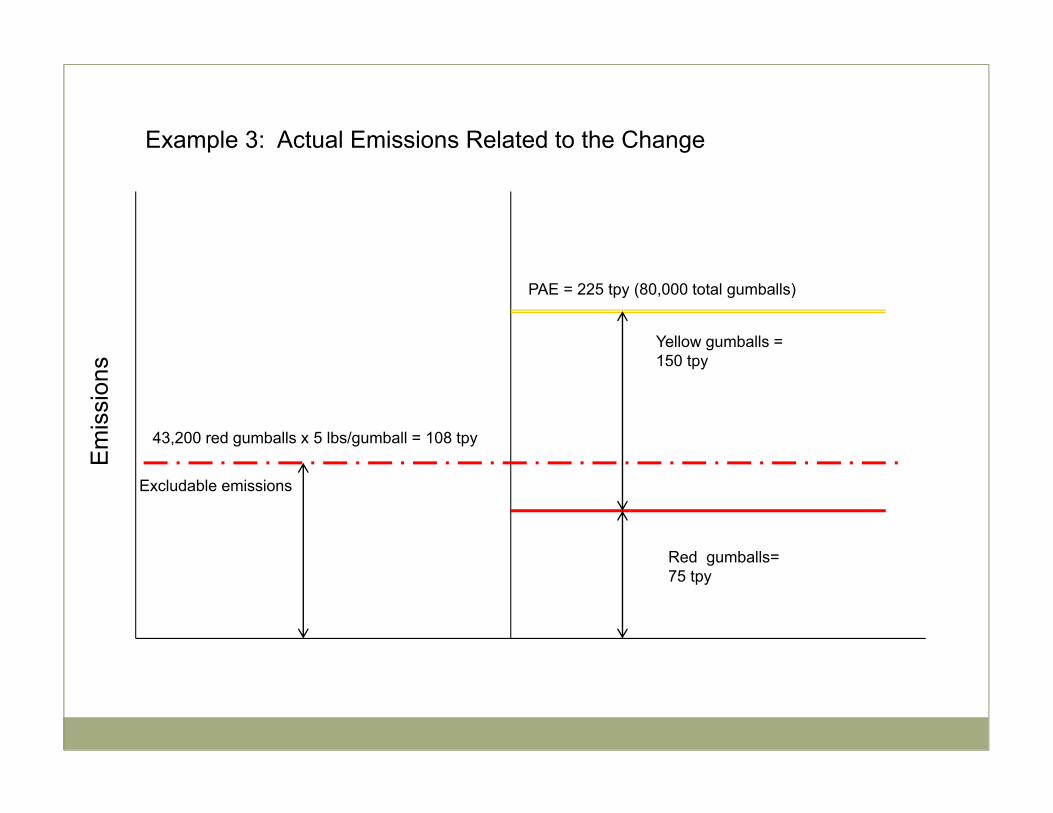
PAE = 225 tpy (80,000 total gumballs)
Example 3: Actual Emissions Related to the Change
43,200 red gumballs x 5 lbs/gumball = 108 tpy
Red gumballs=75 tpy
Yellow gumballs =150 tpy
Excludable emissions
Em
issi
ons
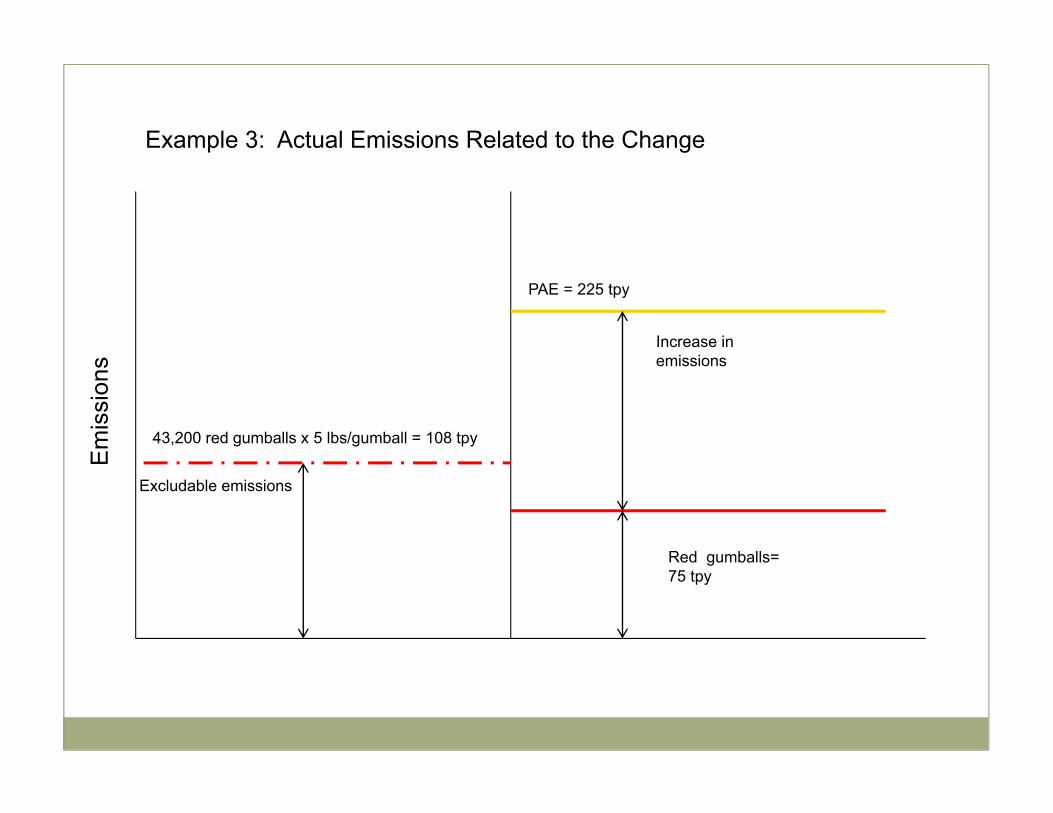
PAE = 225 tpy
Example 3: Actual Emissions Related to the Change
43,200 red gumballs x 5 lbs/gumball = 108 tpy
Red gumballs=75 tpy
Increase in emissions
Excludable emissions

27
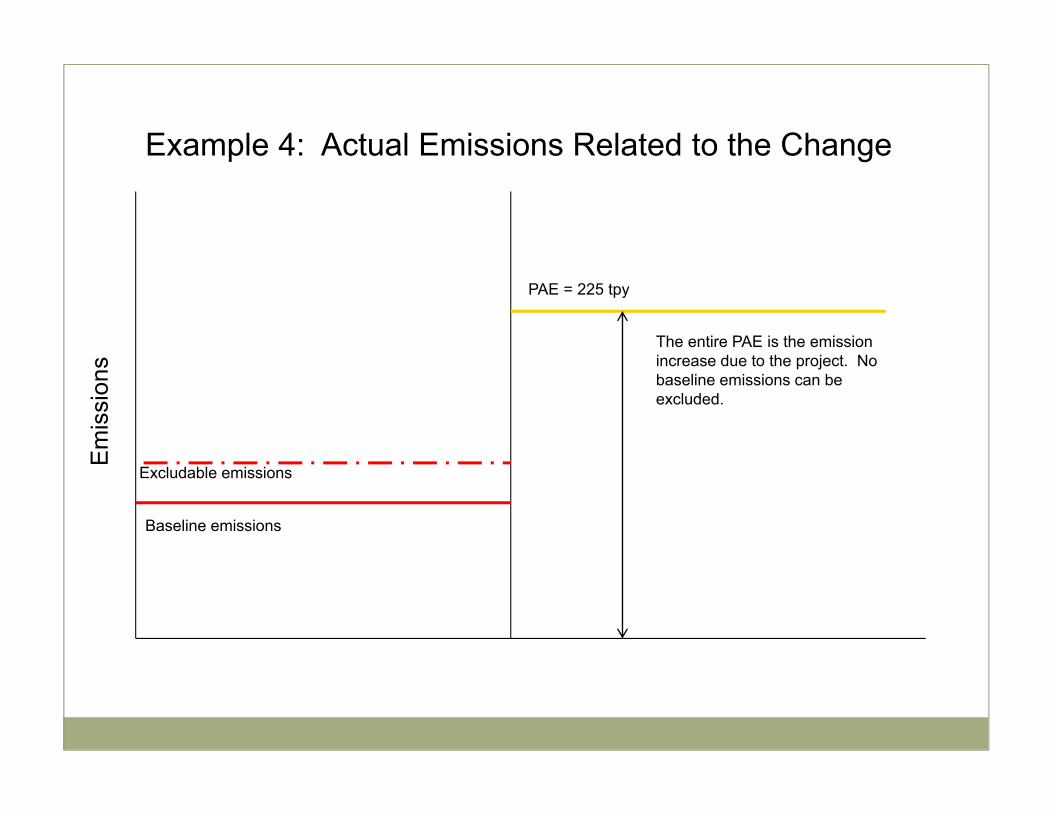
Example No. 4
The company has decided to switch entirely to yellow gumballs.What is the emissions increase?
Em
issi
ons
PAE = 225 tpy
Example 4: Actual Emissions Related to the Change
The entire PAE is the emission increase due to the project. No baseline emissions can be excluded.
Excludable emissions
Baseline emissions
29
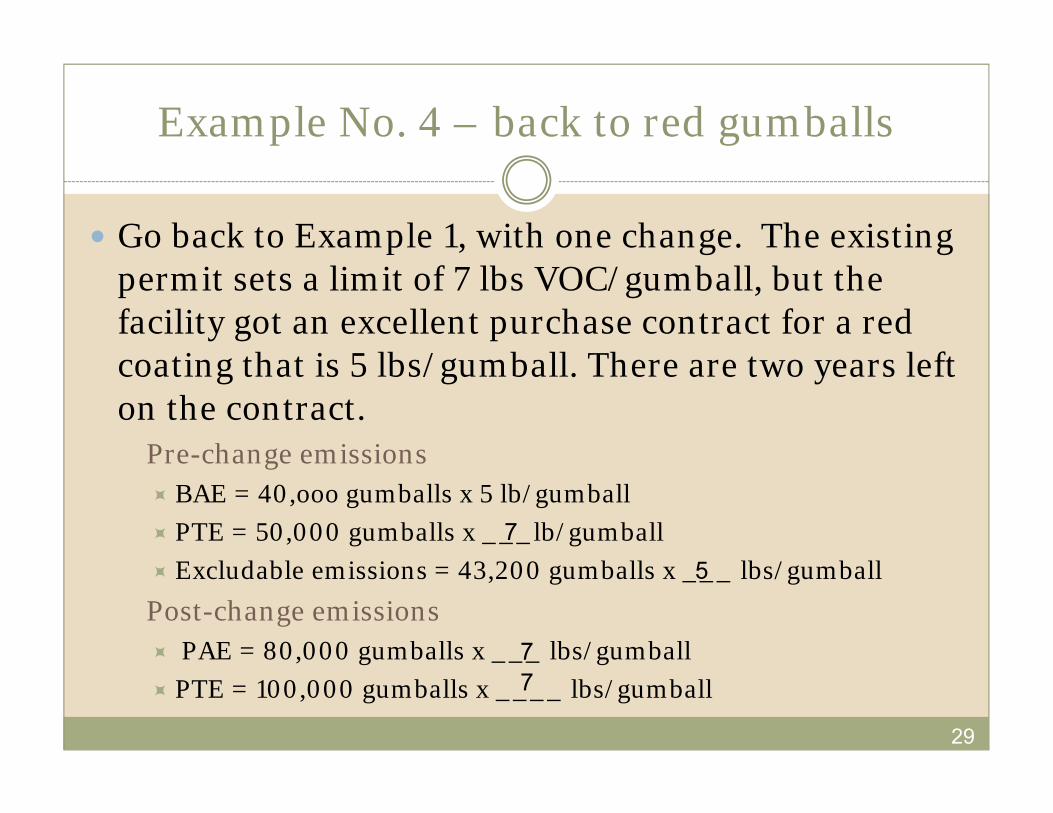
Example No. 4 – back to red gumballs
Go back to Example 1, with one change. The existing permit sets a limit of 7 lbs VOC/gumball, but the facility got an excellent purchase contract for a red coating that is 5 lbs/gumball. There are two years left on the contract. � Pre-change emissions
BAE = 40,ooo gumballs x 5 lb/gumball PTE = 50,000 gumballs x ___lb/gumball Excludable emissions = 43,200 gumballs x ___ lbs/gumball
� Post-change emissions PAE = 80,000 gumballs x ___ lbs/gumball PTE = 100,000 gumballs x ____ lbs/gumball
75
77
30
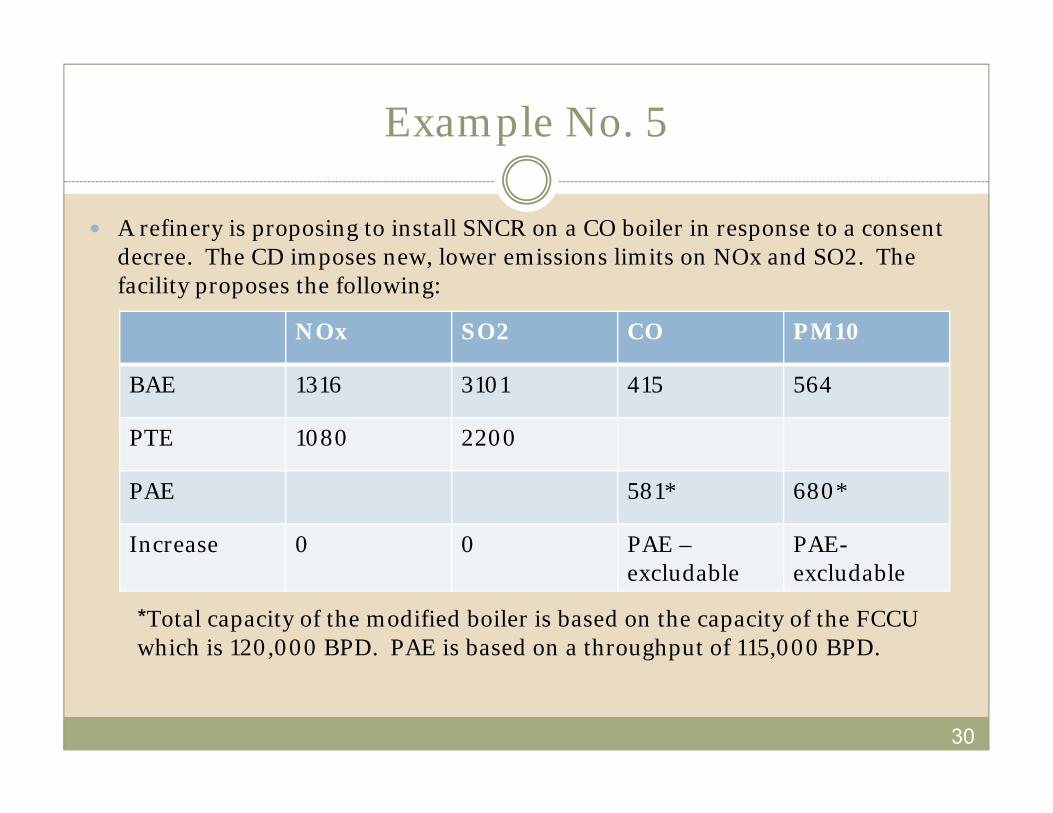
Example No. 5
A refinery is proposing to install SNCR on a CO boiler in response to a consent decree. The CD imposes new, lower emissions limits on NOx and SO2. The facility proposes the following:
NOx SO2 CO PM10
BAE 1316 3101 415 564
PTE 1080 2200
PAE 581* 680*
Increase 0 0 PAE –excludable
PAE-excludable
*Total capacity of the modified boiler is based on the capacity of the FCCU which is 120,000 BPD. PAE is based on a throughput of 115,000 BPD.
31
Example No. 5
For NOx and SO2, the facility must meet a new, lower limit. However, the PTE is based on maximum capacity throughput (120,000, bpd) times a new lower emissions limit. So the facility, for these pollutants is projecting that they will operate at full throughput capacity.
For CO and PM10 the facility is projecting that over the next five years throughput will be less than full capacity, i.e. 115,000 bpd.
Since PAE obligates the facility to commit to how they intend to operate, you cannot mix PTE and PAE.
32
A Few Things to Remember
� Only emission increases are included in Step 1. If the project includes shutting down a unit or restricting operations at a unit, these reductions can only be considered in Step 2 (netting).
� There can be no negative numbers! If a unit’s post change emissions are lower than the baseline actual emissions, the increase is zero, i.e. there is no actual emissions increase.
� When a company claims that their projected actual emissions will be the same as their PTE – get documentation. It is possible that this is true, but highly unlikely.

33
The Devil is in the Details
Recommended