www.energystorage.org
Energy Storage: Overview of Technology
Jason BurwenVice President, Policy
Energy Storage Association
Clean Energy Leadership AcademyJuly 23, 2020

SUBTITLE
Click to edit Master title styleOur Members• manufacturers• component suppliers• system integrators• developers• independent generators• electric utilities• large end-users• law, finance, consulting
Technologies represented
• battery storage• thermal storage• mechanical storage• power-to-gas storage

• Why energy storage• Current & future storage technologies• Overview of deployments & markets• Technology commercialization &
business models
3
In this presentation

4
Why energy storage

5
The 3 fundamental energy technologies
•Conversion
Generators
End-uses
Transportation
Wires
Pipes & Wells
Storage
Fuels
Energy storage

Digitization
Automation
Decentralization
Decarbonization
6
Energy storage creates more possibilities in
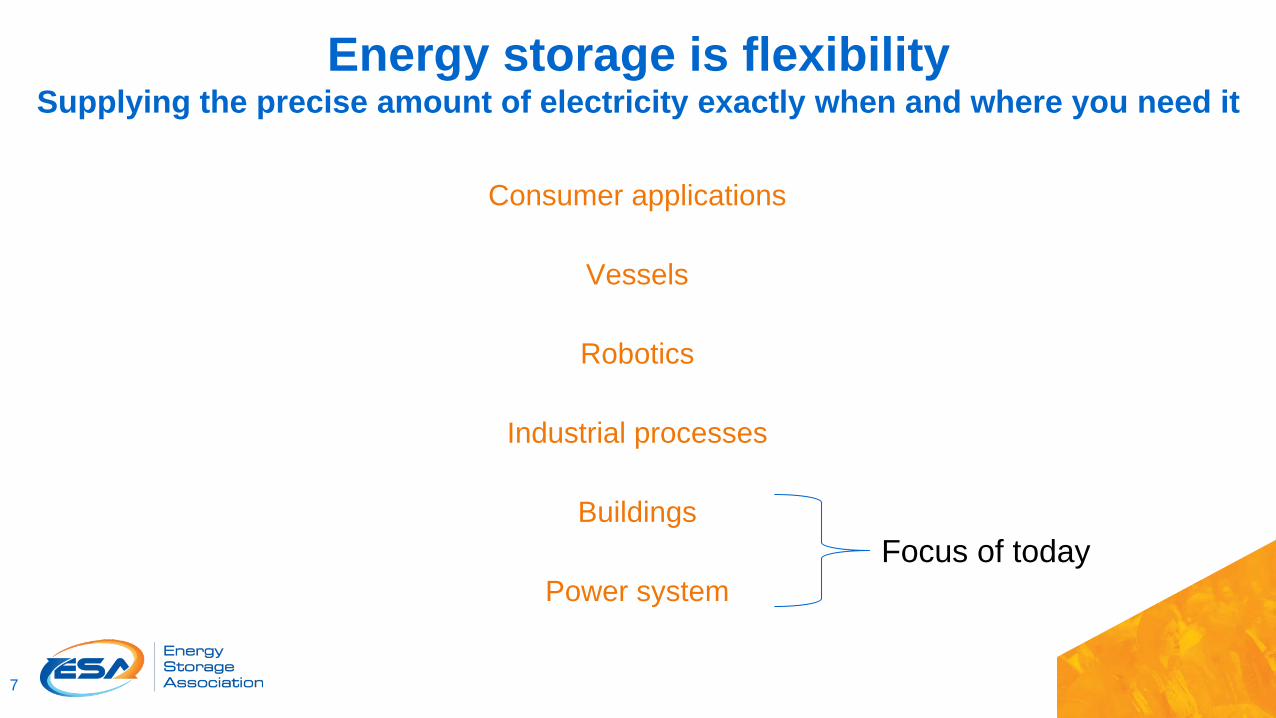
Consumer applications
Vessels
Robotics
Industrial processes
Buildings
Power system
7
Energy storage is flexibilitySupplying the precise amount of electricity exactly when and where you need it
Focus of today
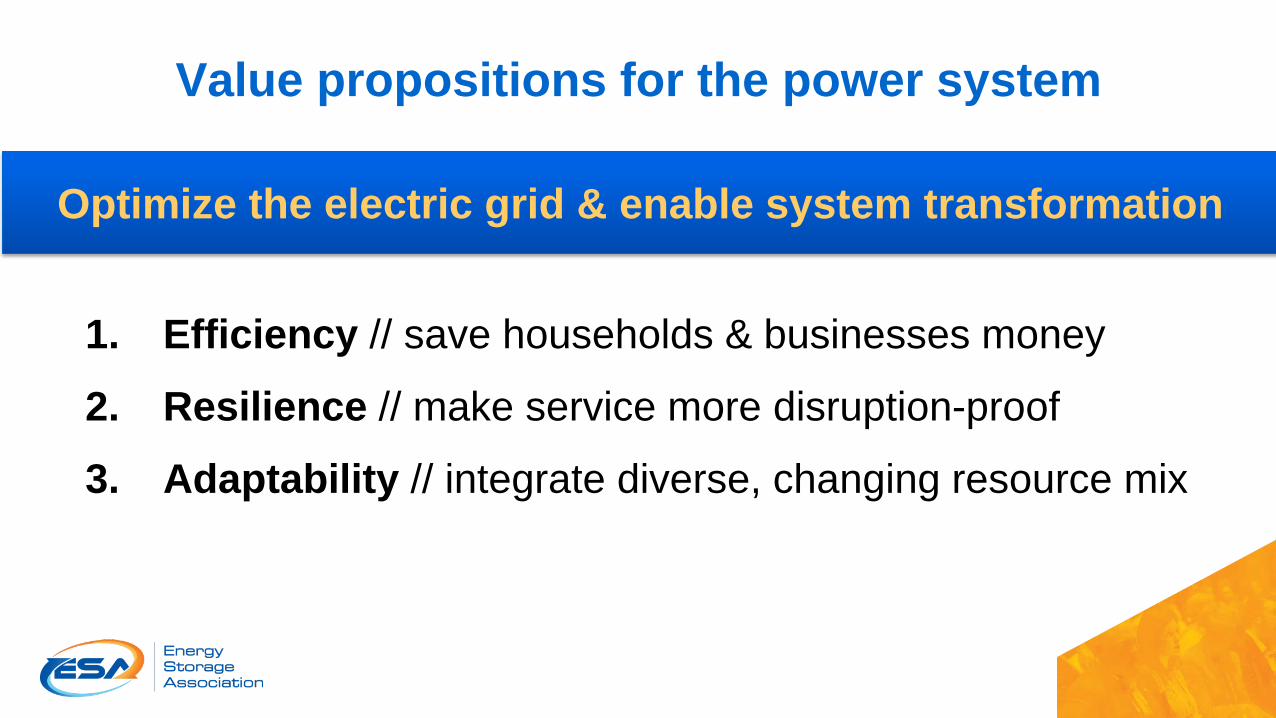
1. Efficiency // save households & businesses money
2. Resilience // make service more disruption-proof
3. Adaptability // integrate diverse, changing resource mix
Optimize the electric grid & enable system transformation
Value propositions for the power system

9

10

Roles of storage in cleaner electricity system• Avoiding peakers & related infrastructure
• Storage already substituting gas capacity in CA, AZ, HI• Integrating higher levels of renewables
• Ramping & other fast-balancing; curtailment avoidance to increase GHG reductions
• Can help integrate nuclear & renewables• Enabling more rooftop solar, EVs, and other DERs
• Storage already enabling DERs in CA, AZ, HI, NY• Making the grid more efficient
• Increases generating fleet efficiency; reduces line losses as DER; can be utilized for multiple services; enables right-sized & just-in-time capacity
11

12
Technologies

www.energystorage.org
Mechanical Storage
Battery Storage
Thermal Storage
13

• Fastest growing storage type• Costs declining rapidly• Located on all part of the grid at any size
• Utilities, customers, and third-parties all operating• Systems from 5 kW to 100,000 kW in use
• Quick to deploy• MW-scale deployments <1 year from contract
• Uniquely flexible & expanding performance capabilities• Instantaneous response and ramp, bi-directional
• Capable of multiple services• Grid balancing, backup, system capacity, network capacity, curtailment
avoidance, energy arbitrage
14
Why All The Buzz On Battery Storage?

Grid batteries are modular, scalable arrays
15

Battery storage installed costs continue to drop
16
Bulk-scale 4-hour lithium-ion grid battery installed cost ($/kWh)
0
200
400
600
800
1,000
1,200
1,400
2010 2015 2020 2025 2030 2035 2040
2018
$/k
Wh
Historical
NREL ATB ForecastsSource: Bloomberg New Energy Finance (2018) and NREL (2019b) with Brattle analysis.
Notes: Historical estimate assumes Bloomberg NEF battery pack cost estimate plus a constant non-pack cost estimate of approximately $170/kWh. NREL costs are for a 4-hour, utility-scale lithium ion battery.
2025 2030 2040Low Cost -10% -9% -6%Mid Cost -6% -5% -3%High Cost -1% -1% -1%
Annual Cost Decline Rates from 2018Hardware (battery, inverter, etc)+ Soft costs (EPC, permitting, etc)
Total installed cost

2008:1 MW, 15 min battery in PJM
2012:36 MW, 40 min battery in ERCOT
2016:30 MW, 4 hour battery in SDG&E
2017:100 MW, 75 min battery in Australia
2021:409 MW, 2.1 hour battery in FPL (approved)
17
Cost goes down, size & duration go up
Shift from primarily providing ancillary services to increasingly providing capacity / resource adequacy
All battery storage installed 2003-2017:800 MW / 1200 MWh
Single NVE battery planned for 2023:380 MW / 1520 MWh
DER storage aggregationsWill follow(largest today ~20 MW)

18
Deployments & Markets

19
Operational U.S. grid battery storage projects(EIA 860-M Data, Sep 2019)

20
Wood Mackenzie P&R/ESA | U.S. energy storage monitor Q2 2020 woodmac.com
85 51 89 168 341 449 778 1,113
3,559
10,962
13,331
17,558
20,151
25,928
-
5,000
10,000
15,000
20,000
25,000
30,000
2012 2013 2014 2015 2016 2017 2018 2019 2020E 2021E 2022E 2023E 2024E 2025E
Ener
gy S
tora
ge D
eplo
ymen
ts b
y Se
gmen
t (M
Wh)
Residential Non-Residential Front-of-the-Meter
Source: Wood Mackenzie Power & Renewables
U.S. market will reach 26 GWh annually by 2025Longer durations for standalone and solar paired projects will drive 7x market growth compared to 2020
U.S. energy storage annual deployment forecast, 2012-2025E (MWh)
As of EOY 2019:1.6 GW / 3.0 GWh cumulative~35% customer-sited
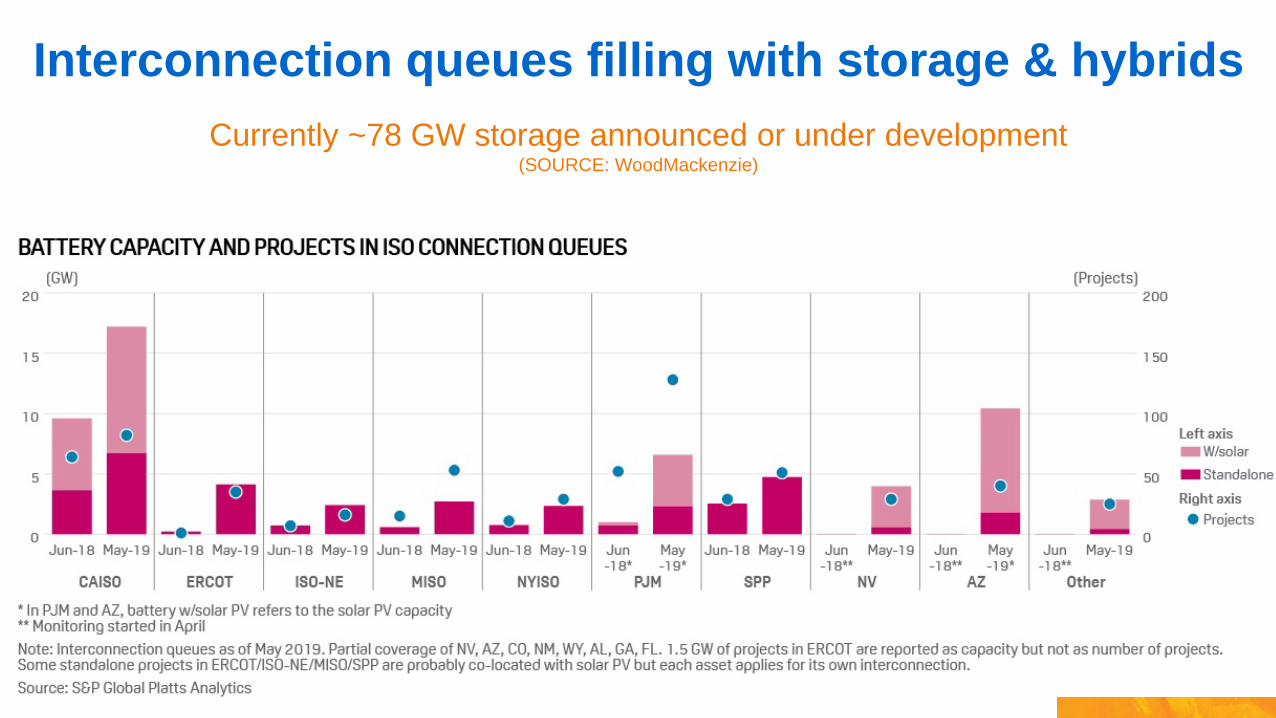
Interconnection queues filling with storage & hybridsCurrently ~78 GW storage announced or under development
(SOURCE: WoodMackenzie)

22
Energy storage applications for electric service
Complement or alternative to peaking generationAvoid curtailment of renewables/nuclearReduce generator cyclingMaintain grid stability
Residential customer demand for solar-paired storageResilience
Increase transmission capacity & extend asset life
Increase distribution capacity & extend asset life
C&I customer demand charge management + power quality improvementResilience, including microgrids

23
The Potential for Battery Energy Storage to Provide Peaking Capacity in the United States
(SOURCE: NREL 2019)
Findings for 4-hr storage:• 28 GW of capacity
potential nationwide• 2-8% of system peak
across regions
Peaking capacity potential increases with more wind/solar

The Potential for Battery Energy Storage to Provide Peaking Capacity in the United States
(SOURCE: NREL 2019)
24

Storage arriving as a peaker power plant
25
AES Alamitos (COD Jan 2021)100 MW / 400 MWh battery
"We believe now that utility-scale battery storage, from a technology standpoint, is sufficiently viable to begin to displace, if you will, what has been virtually exclusively natural gas as that flexible, ramping, backstop resource.”
-- Daniel Froetscher, VP of Operations, APS
Kauaii Island Utility Cooperative20 MW / 100 MWh battery (+ 28 MW solar PV)

Storage also enhancing electric grid infrastructure• Extend the life of existing electric infrastructure• Enhance resilience of network & other critical
infrastructures• Increase hosting capacity to enable customer
choice (e.g., solar, Evs, etc)• Adapt to uncertain futures: supply mix, load &
DER forecasts• Enable the demands of increasingly electrified
economy– Transportation– Heating– Industrial processes– Desalination?
26

• APS (Arizona) projects• 4 MW storage avoids transmission upgrade for rural communities (Punkin Center)• 2 MW storage at 2 substations to increase hosting capacity for customer solar
• HECO (Hawaii) Aggregation• 1 MW aggregation of customer-sited storage providing distribution system stability
• National Grid (New York) Nantucket project• 6 MW, 8-hr storage to avoid new undersea cable & island resilience
• Eversource (New Hampshire) “bring-your-own-device” project• Combination 1.7 MW substation battery + 0.7 MW customer peak demand reduction
to avoid distribution upgrades• Duke Indiana projects
• 5 MW storage at 2 sites in development– Grid infrastructure deferral (Naab Battery Project – distribution sited)– Resilience (Camp Atterbury Project – customer-sited microgrid)
27
Examples of storage as electric infrastructure
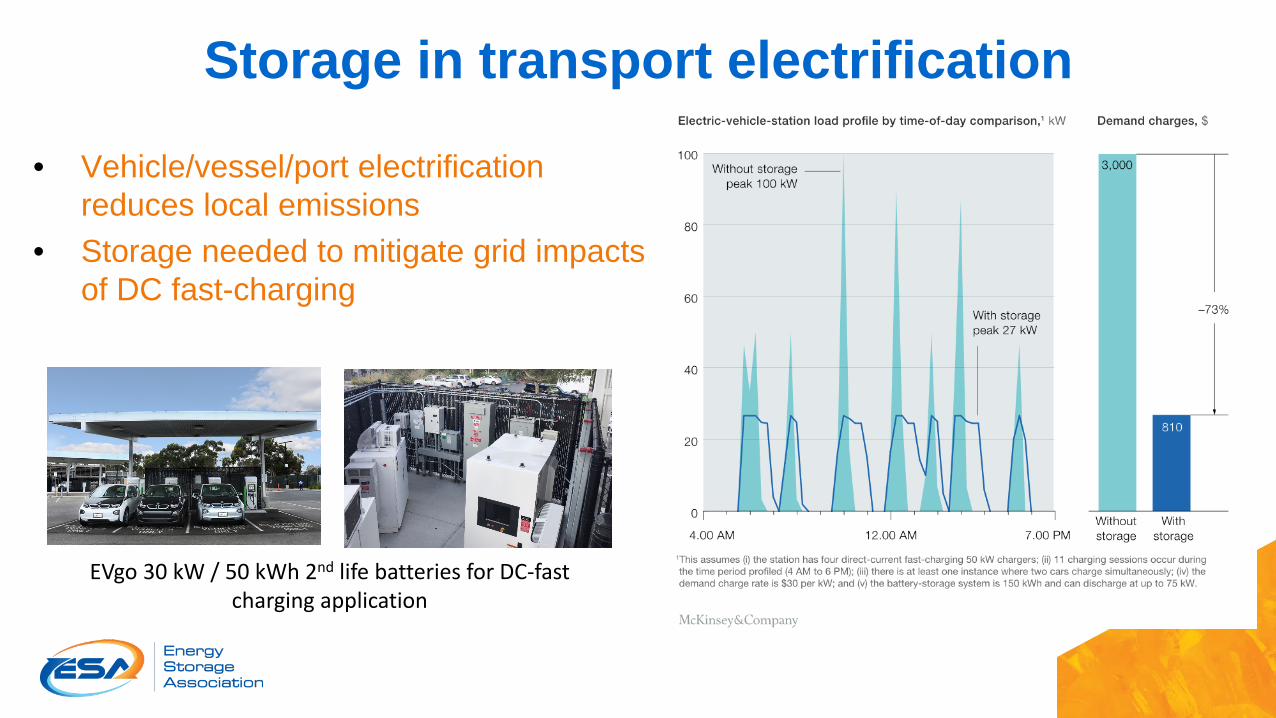
Storage in transport electrification
• Vehicle/vessel/port electrification reduces local emissions
• Storage needed to mitigate grid impacts of DC fast-charging
EVgo 30 kW / 50 kWh 2nd life batteries for DC-fast charging application
29
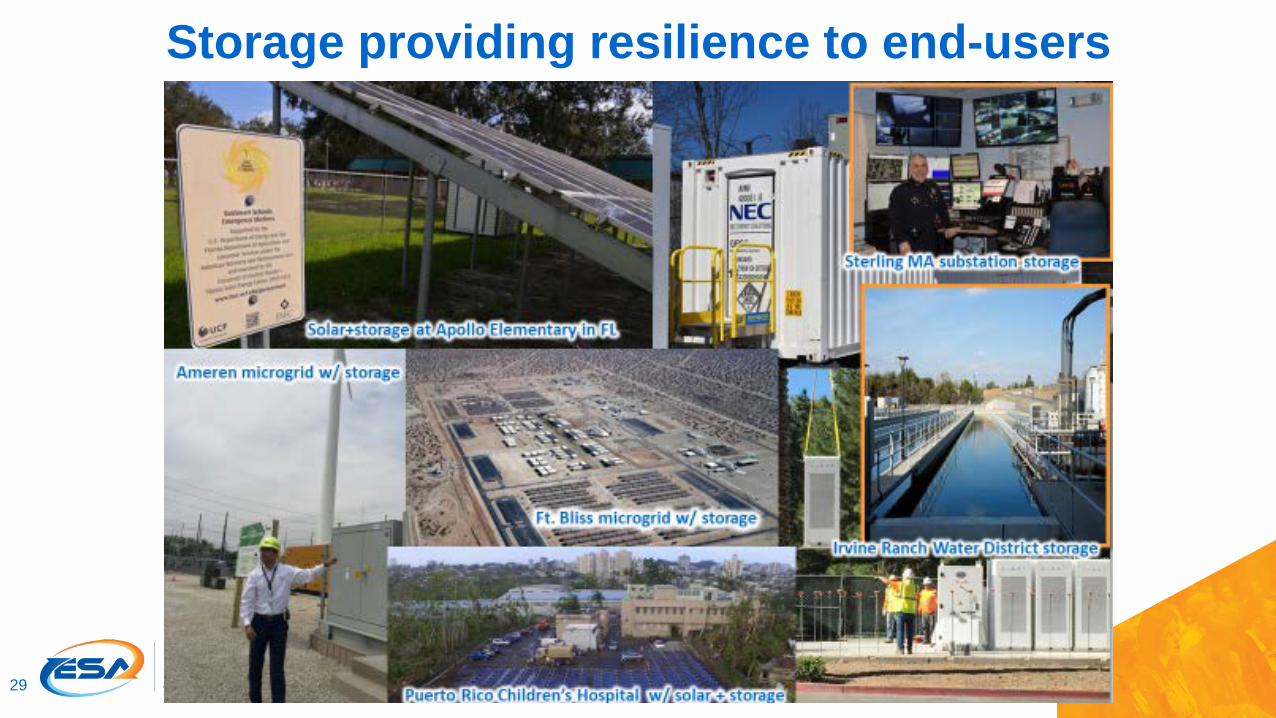
Storage providing resilience to end-users

Storage and Equity
Storage can replace polluting peaker plants DER storage can make community members part of the
solution

Thank [email protected]

www.energystorage.org
Energy Storage: Overview of Policy
Jason BurwenVice President, Policy
Energy Storage Association
Clean Energy Leadership AcademyJuly 23, 2020

33
Barriers to Deployment That Policy Can Address
Cannot VALUE or compensate storage
flexibility
SolutionsDeployment targetsIncentive programs
Tariff/rate design Wholesale market products
Cost-benefit studies
Unable to COMPETEin all grid planning and procurements
SolutionsLong-term resource planning
Distribution planningTransmission planning
GHG/renewables standardsWholesale market rules
Resource adequacy rules
Cannot ACCESS grid or constrained to
narrow use
SolutionsInterconnection processesMultiple-use frameworks
Ownership rules
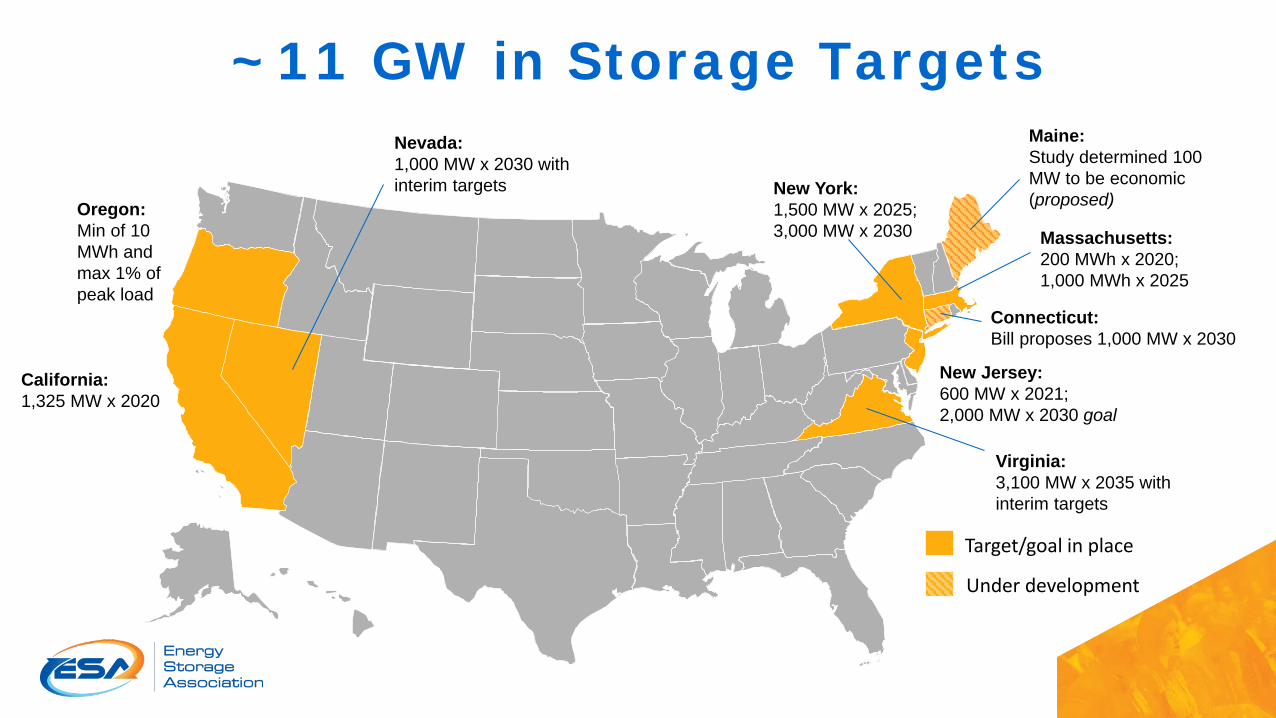
~11 GW in Storage Targets
California:1,325 MW x 2020
Oregon:Min of 10 MWh and max 1% of peak load
Massachusetts: 200 MWh x 2020;1,000 MWh x 2025
New York: 1,500 MW x 2025;3,000 MW x 2030
New Jersey: 600 MW x 2021;2,000 MW x 2030 goal
Nevada:1,000 MW x 2030 with interim targets
Under development
Target/goal in place
Maine:Study determined 100 MW to be economic (proposed)
Virginia:3,100 MW x 2035 with interim targets
Connecticut:Bill proposes 1,000 MW x 2030

Over $1B in Storage IncentivesCurrent Federal:Storage paired with solar eligible for 30% investment tax credit
California:Self-Generation Incentive Program ($800MM)
Massachusetts: Clean Peak Standard; SMART incentive program for solar+storage
New York: Bridge Incentive Program ($280MM) + NY-Sun program ($40MM)
Maryland:Onsite storage tax credit ($3MM)
Nevada:$10MM solar+storageprogram
Oregon:$2MM solar+storageprogram

Regulators Updating Utility Planning for Storage
NARUC & NASEOResolution (2018, EL-4/ERE-1) calls for modeling “the full spectrum of services that energy storage and flexible resources are capable of providing.”
Task Force for Comprehensive Electricity Planning: a two-year project with 16 states to improve modeling and planning methods
32 states now have planning requirements
Over 8,000 MW selected to date
Michigan: PSC issued guidelines considering storage in 2019 IRPsCases U-15896, 18461, 18418
Minnesota:Legislation requires IRPs to include storage modeling best practices
HF 2
Colorado:PUC updated all planning rules to consider storage procurementDocket 18R-0623E, Decision C18-1124Washington:
Policy Statement and draft regs call for sub-hourly modeling and mechanism to value flexibilityDocket U-161024
Arizona:Regulators rejected utility IRPs, called for evaluation of storage, gas moratoriumCase E-00000V-15-0094, Decision 76632
New Mexico:Revised IRP rules require consideration of energy storageCase 17-00022-UT

Storage in Utility Plans & Procurements• Over 18 GW of storage proposed in
utility integrated resource plans• Procurements now GWh scale − 770 MW from SCE− 590 MW from NVE− 570 MW from PG&E− 500 + 350 MW from APS− 409 MW from FPL− 200s-300s MW from HECO,
SDG&E, Xcel, Dominion, etc.
State Utility IRP Year Storage Proposed Timeline IN IPL 2016 833 over 20 yearsHI HECO 2016 535 2020OR PGE 2016 39.8 2020KY Kentucky Power 2016 10 over 10 yearsCO Xcel 2016 (2018 update) 275 2030WA Puget Sound 2017 75 2029NC Duke Carolinas 2017 75 2019-2021AZ UNS Energy Corp 2017 20 2028WA Avista 2017 5 2029OR PacifiCorp 2017 4 2020MI Consumers 2018 450 2040NC Duke Carolinas & Duke Pro 2018 290 2026NM El Paso Electric 2018 115 2035NV NVE 2018 100 2021IN NIPSCO 2018 92 2023FL FPL Energy 2018 50 2020VA Dominion 2018 30 2025VA Appalacian Power 2018 10 2025NV NVE 2019 590 2023AZ APS 2019 500 2025FL FPL Energy 2019 409 2022PNM New Mexico 2019 130 2023GA Georgia Power 2019 80 2024OR Idaho Power 2019 60 2034-2038MI Indiana Michigan Power 2019 50 2028Multi PacifiCorp 2019 2,800 2038
Note: Does not include TVA’s recent 2019 IRP (5,300 MW x 2038 in preferred plan) or 2020 CA IRP of 9.9 GW x 2030
Storage in Utility IRPs through 2019

BTM Storage Interconnection
Key determinant of policy success in promoting DER storage is interconnection Storage often not explicitly contemplated in regulations Some states have recently updated rules for storage; many more yet to go Generally occurs in context of solar + storage
Finalized Under DevelopmentMaryland New York Hawaii Nevada Arizona Minnesota California Colorado Michigan Massachusetts North Carolina
Generator definition x x x x x x x TBD TBD TBD xInadvertent export x x x x x x TBD TBD TBD TBDNet nameplate capacity x x x x TBD TBD TBD TBDProposed use x TBD TBD TBD TBD
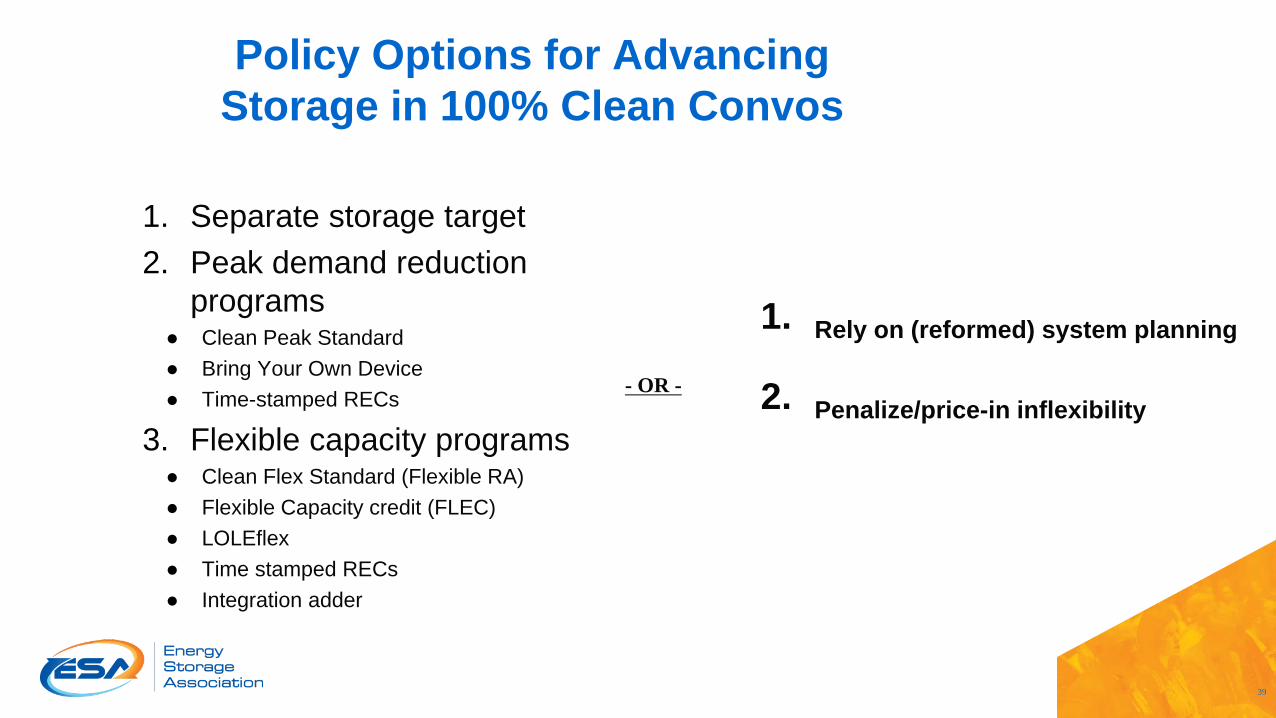
Policy Options for Advancing Storage in 100% Clean Convos
1. Separate storage target2. Peak demand reduction
programs● Clean Peak Standard● Bring Your Own Device● Time-stamped RECs
3. Flexible capacity programs● Clean Flex Standard (Flexible RA) ● Flexible Capacity credit (FLEC) ● LOLEflex● Time stamped RECs● Integration adder
39
- OR -
1. Rely on (reformed) system planning
2. Penalize/price-in inflexibility
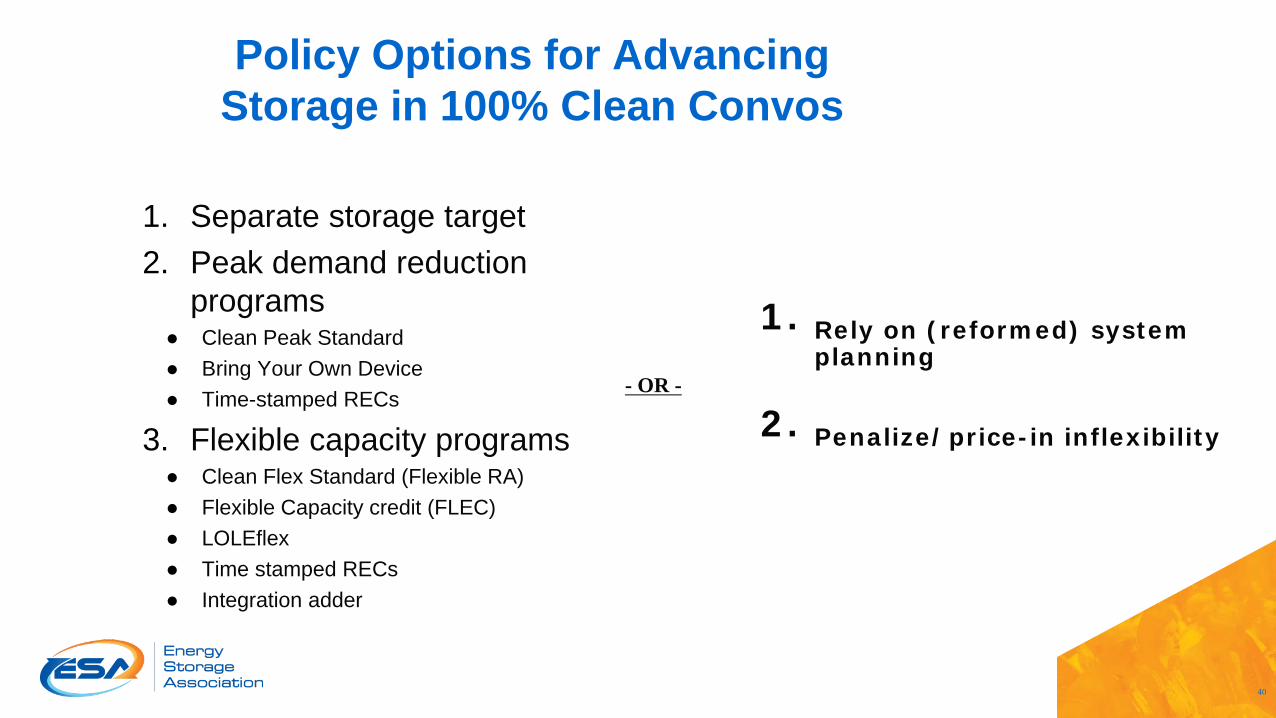
Policy Options for Advancing Storage in 100% Clean Convos
1. Separate storage target2. Peak demand reduction
programs● Clean Peak Standard● Bring Your Own Device● Time-stamped RECs
3. Flexible capacity programs● Clean Flex Standard (Flexible RA) ● Flexible Capacity credit (FLEC) ● LOLEflex● Time stamped RECs● Integration adder
40
- OR -
1. Rely on (reformed) system planning
2. Penalize/price-in inflexibility

Thank [email protected]

Parking Lot
42

Power, energy, & duration in storage
MWh of energy= hours of duration
MW of power
For example, a storage resource described as a 10 MW / 40 MWh unit can sustain its maximum (rated) power of 10 MW for 4 hours.
43

Mechanical storage options• Pumped hydroelectric storage
• Most grid energy storage capacity in U.S. (22 GW), but geographically constrained• Availability constrained by drought, affected by changing climate
• Environmental concerns of hydro power (e.g., siting impacts, power vs. ecological use)• Innovations to come
• Geomechanical pumped storage, such as with abandoned wells/mines (Quidnet)• Marine pumped storage
• Adiabatic storage (e.g., compressed air)• Few large-scale installations worldwide• Innovations to come
• “Cryogenic” liquid air storage (Highview Power)• Compressed liquid
• “Gravity” storage innovations being explored (EnergyVault)• Key benefit = potential for long duration, bulk scale• Flywheel
• Key value is instantaneous response, though generally short duration = niche applications• Innovations pushing for multi-hour
44

Thermal storage options• Customer-sited thermal storage is demand response
• Usually part of building systems• Chilled water/ice displace cooling demand• Water heaters time-shift heating demand• Air conditioners time-shift cooling demand
• Does not inject electrons—different measurement & verification for grid operations• Innovations to come
• Phase-change materials, potentially integrated into building envelope• Key benefit = relatively low cost
• Front-of-meter thermal storage still maturing• Molten salt storage used with concentrated solar thermal• Innovations to come
• Heat-absorbing silicon, concrete, other media• Electricity supply from coolth (Malta)
45

Chemical storage options
• Most chemical storage today involves hydrocarbon fuels• Power-to-gas• Hydrogen from natural gas reforming
• Forthcoming technologies may become relevant for clean energy• Hydrogen from clean energy power-to-gas• Ammonia from clean energy power-to-gas• Net zero hydrocarbons (“fuels from sunlight”)
• Key benefit = seasonal storage (e.g., days/weeks duration); potential drop-in replacement for fuels
• Also, cross-sectoral applications (industrial processes, vessels)• May require separate infrastructure
46

Electrochemical storage options
Solid electrode (battery)• Scales by number of units in array• Common chemistries
• Lithium-ion• NMC• LFP
• Lead-based• Sodium-based• Zinc-based
• Key benefit = fast & flexible
Liquid electrode (flow battery)• Scales by volume of tanks on single unit• Common chemistries
• Vanadium redox• Key benefit = long-lived, potential for longer
duration
47
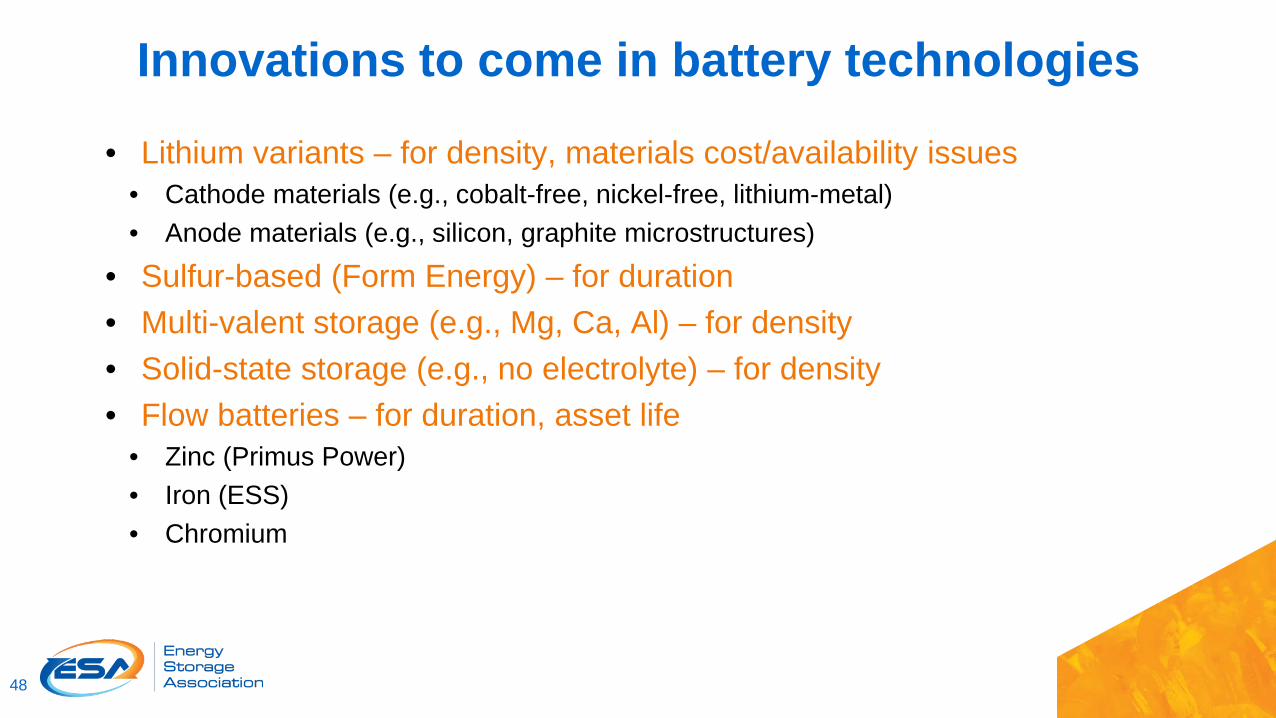
• Lithium variants – for density, materials cost/availability issues• Cathode materials (e.g., cobalt-free, nickel-free, lithium-metal)• Anode materials (e.g., silicon, graphite microstructures)
• Sulfur-based (Form Energy) – for duration• Multi-valent storage (e.g., Mg, Ca, Al) – for density• Solid-state storage (e.g., no electrolyte) – for density• Flow batteries – for duration, asset life
• Zinc (Primus Power)• Iron (ESS)• Chromium
48
Innovations to come in battery technologies
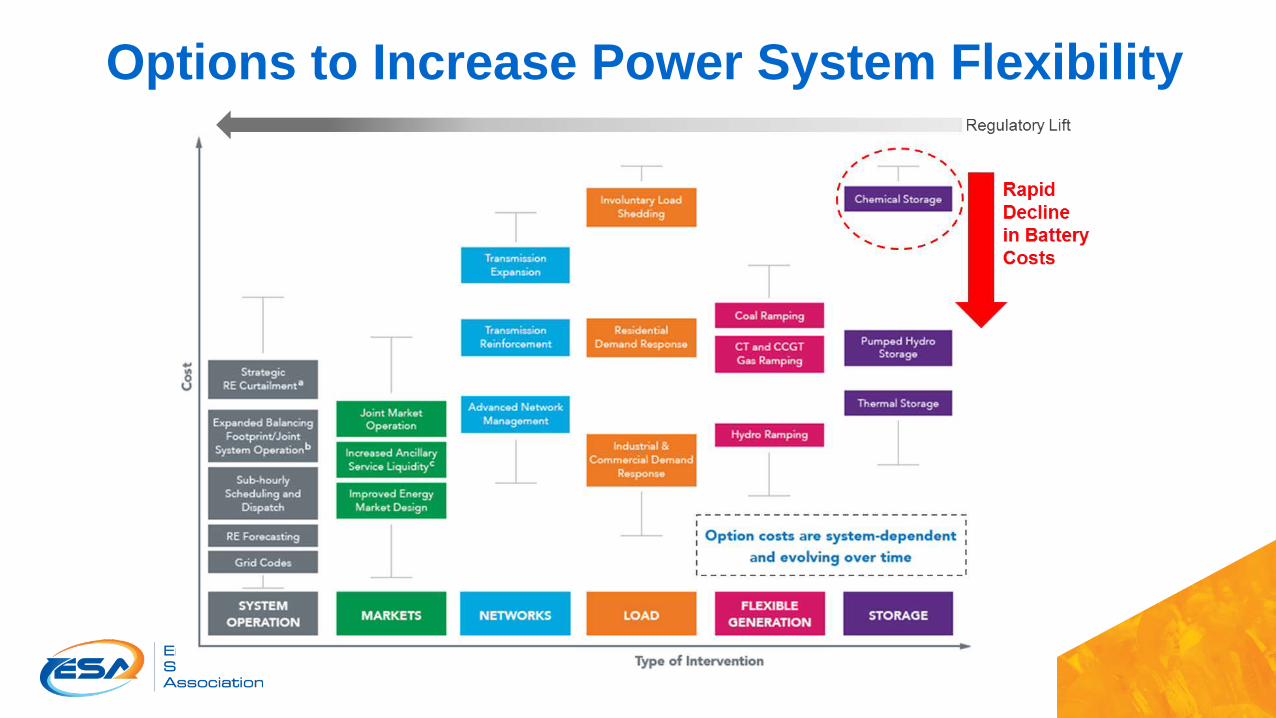
Options to Increase Power System Flexibility

Storage and GHGs
• Storage not a generator—it reflects the emissions and price signals of the grid in which it operates
• Two sets of concerns on storage and GHGs• Increases overall consumption (due to round-trip losses)• Can charge from dirtier supply mix, discharge to displace cleaner supply mix• NOTE: Almost all studies focused on simple arbitrage models
• Solutions• Continue reducing GHG-intensity of supply mix• Send price signals to maximize GHG reductions
• Co-location as solution? Not necessarily• Storage can provide same GHG reduction even when not directly co-located• Key is curtailment avoidance

How much additional wind is needed?
Hittinger, Eric & Azevedo, Inês. (2017). Estimating the Quantity of Wind and Solar Required To Displace Storage-Induced Emissions. Environmental Science & Technology. 51. 10.1021/acs.est.7b03286.
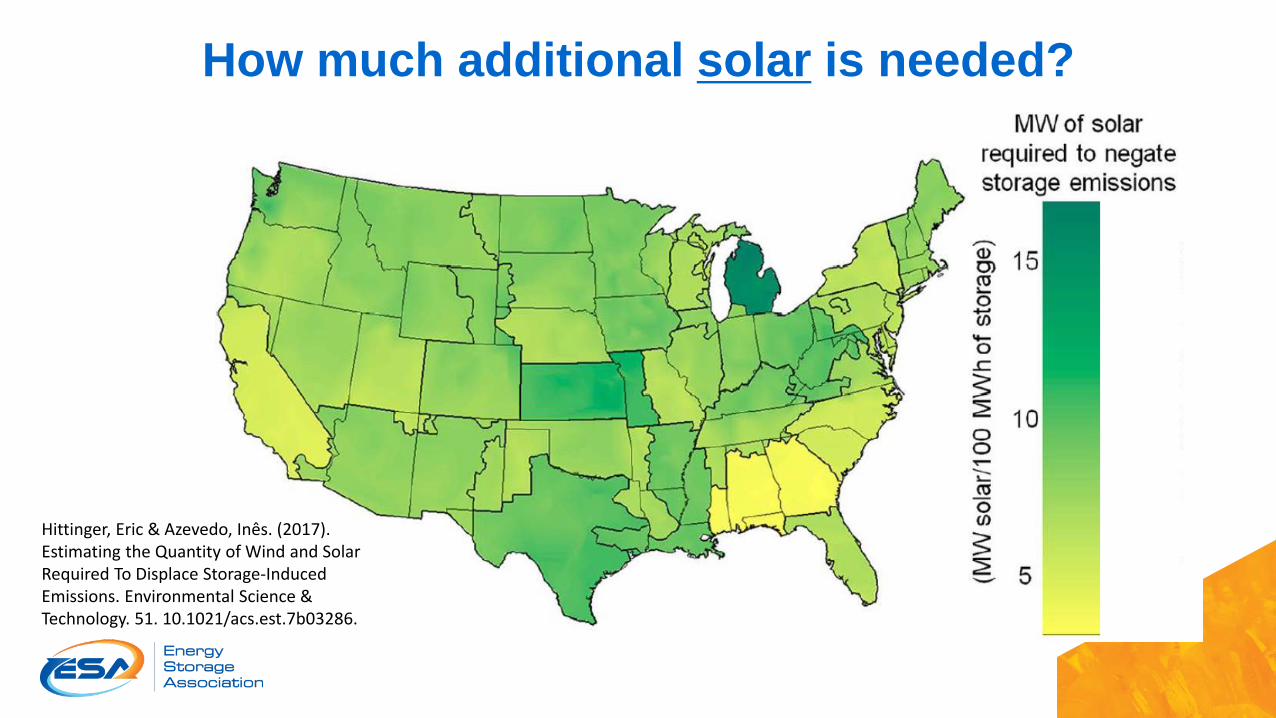
How much additional solar is needed?
Hittinger, Eric & Azevedo, Inês. (2017). Estimating the Quantity of Wind and Solar Required To Displace Storage-Induced Emissions. Environmental Science & Technology. 51. 10.1021/acs.est.7b03286.
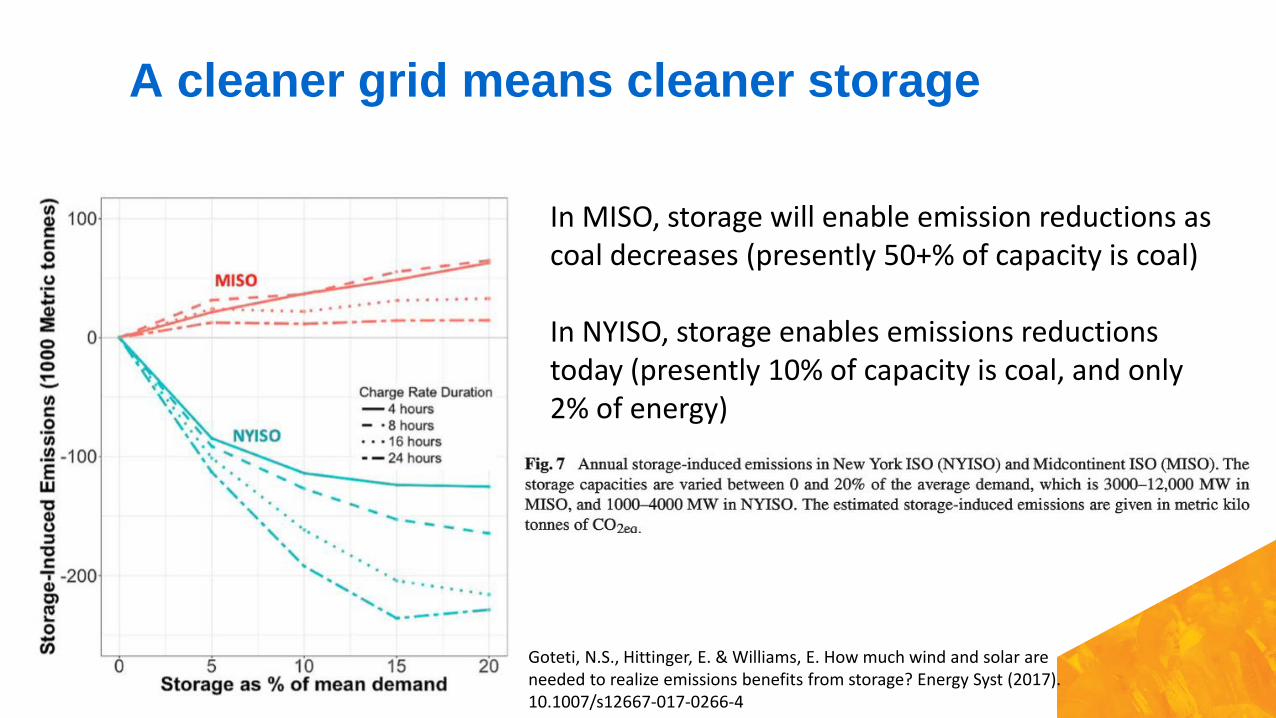
A cleaner grid means cleaner storage
Goteti, N.S., Hittinger, E. & Williams, E. How much wind and solar are needed to realize emissions benefits from storage? Energy Syst (2017). 10.1007/s12667-017-0266-4
In MISO, storage will enable emission reductions as coal decreases (presently 50+% of capacity is coal)
In NYISO, storage enables emissions reductions today (presently 10% of capacity is coal, and only 2% of energy)

What happens as baseload coal retires?

Prices reflecting GHGs will help storage reduce GHGs
Even a modest cost associated with GHG emissions (1-5% revenue loss) reduces those emissions attributable to storage significantly (25-50%)
Effect varies by market, due to supply mix and prices
Arciniegas, Laura & Hittinger, Eric. (2017). Tradeoffs between revenue and emissions in energy storage operation. Energy. 143. 10.1016/j.energy.2017.10.123.

Should we co-locate storage with renewables?• Not necessary for storage RE integration benefits
• RE without storage serves load; RE with added storage now serves storage, load served by marginal unit elsewhere on grid
• Central grid operator can create same coordinated functions of co-located systems• Co-location can be useful for other reasons
• Access to 30% investment tax credit for solar+storage• Lower project costs by sharing power control hardware, avoiding duplicative permitting &
interconnection• Avoid curtailment from local network congestion• Rational response to given rate design (if BTM)• Resilience for onsite power
• So what’s right?• As long as grid mix continues getting cleaner, storage will contribute to GHG reductions
regardless of whether or not it is co-located• Focus co-location on curtailment avoidance (i.e., NWA)
• Maximizes GHG and RE benefit
56

• Landmark rule regularizes energy storage participation in wholesale electricity markets
• In process of implementation
FERC Order 841 opens markets to storage
• Removes barriers to storage as small as 100 kW to participate (i.e., DER storage)
• Opportunity for customer-sited storage to access wholesale markets

U.S. Congress and AdministrationPositives• IRC Sec 48 & 25D investment tax credit
(ITC) for solar-paired storage• Bills to make stand-alone storage ITC eligible
(S. 1142 / H.R. 2096)• Major RD&D interest – Energy Storage
Grand Challenge• Bills increasing federal investments in storage
RD&D (S. 1602 / H.R. 2986)• Interest in storage for infrastructure
resilience
Negatives• Uncertainty from enacted tariffs
• ESA opposes energy storage inclusion• Stalled IRS guidance on tax treatment of
storage• ESA requests in Priority Guidance Plan
• Continuing legislative deadlock
58
States are primary drivers of near-term policy that accelerates storage deployment.
FERC & wholesale market activity moving slower but setting longer-term foundations.
Recommended