Engineering and
Commercial Infrastructure -
Water Services
February 2017
Page 2
Engineering & Commercial Infrastructure Monthly Review > February 2017
OVERVIEW .......................................................................................................................... 3
SAFETY.............................................................................................................................. 4
1.1. Incident Statistics ....................................................................................................... 4
1.2. Lost Time Injuries ...................................................................................................... 4
FINANCE ........................................................................................................................... 5
2.1. Water and Wastewater Financial Fund Report ........................................................... 5
2.2. Accrued Water Operating Revenue Less Expenditure ............................................... 6
2.3. Accrued Wastewater Operating Revenue less Expenditure ....................................... 6
2.4. Capital Expenditure Performance .............................................................................. 7
CUSTOMER SERVICES ................................................................................................. 7
3.1. Requests ................................................................................................................... 7
3.2. Request Types .......................................................................................................... 8
3.3. Plumbing Applications ............................................................................................... 8
3.4. Trade Waste Approvals ............................................................................................. 9
3.5. Annual Trade Waste Activity ...................................................................................... 9
3.6. Building Over Adjacent Sewers ............................................................................... 10
3.7. Scientific and Analytical Services............................................................................. 10
3.8. Community Engagement ......................................................................................... 11
3.9. Leak Detection Notifications .................................................................................... 12
ASSET MANAGEMENT ................................................................................................ 13
4.1. Surface Water Raw Water Storage Capacities ........................................................ 13
4.2. Annual Water Consumption vs Allocation by Source ............................................... 14
4.3. Water Consumption by Locality ............................................................................... 14
4.4. Significant Projects .................................................................................................. 15
REGULATORY COMPLIANCE ................................................................................... 18
5.1. Drinking Water Compliance ..................................................................................... 18
5.2. Wastewater Compliance .......................................................................................... 19
5.3. Backflow Testing ..................................................................................................... 19

Page 3
Engineering & Commercial Infrastructure Monthly Review > February 2017
OVERVIEW
This report is for Water Services activities for February 2017. Significant items in this period include:
• There were no LTIs recorded in February 2017 which extends the period for no LTIs for the
Water Business to 20 months
• Officers attended the Automated Metering Digital Utilities Conference, hosted by the
Queensland Water Directorate, where Mackay Regional Council provided a presentation on
"Implementing AMI Project: Points to Ponder" on 16 February 2017
• Officers attended the quarterly Technical Reference Group hosted by the Queensland Water
Directorate on 17 February 2017
• A Community and Client Reference Group Meeting was held on 23 February 2017 with the
following topics discussed: update on the myh20 project activities for 2017, a review of the
Terms of Reference for the Group and the future of CCRG Meetings. Future meetings will be
held as issues arise as opposed to the regular quarterly meetings which have been held to
date.
• A 375kW electric motor from Pump No 1 at the Nebo Road High Lift Pump Station, weighing
2200kg, was removed for inspection. A Risk Assessment was completed by officers from
Infrastructure Delivery, Water Treatment and a contractor to ensure the pump was removed
safely.
Director Engineering and Commercial Infrastructure

Page 4
Engineering & Commercial Infrastructure Monthly Review > February 2017
SAFETY
1.1. Incident Statistics
The incident statistic details a summary of the Water Services safety incident performance. Water
Services aspires to achieve zero harm with a stretch target of zero injuries.
1.2. Lost Time Injuries
Water Services aspires to achieve zero Lost Time Injuries by improving safety performance by
developing a proactive safety culture and implementing best practice safety management across all
business areas
The table below shows the Lost Time Injuries over previous years
The following incidents were recorded in February 2017:1 x Medical Treatment Injury from Vehicle Incident (No Lost Time was recorded for this injury)2 x First Aid Injuries being Bite/Sting and Exposure to biological factor2 x Near Miss being Vehicle Incident and Single exposure to chemicals
Data is at 28 February 2017
0
1
2
3
4
5
6
7
8
Nu
mb
er
of
Inc
iden
ts
Total Incidents Lost Time Injuries
Total Recordable Injuries All Injuries
No Lost Time Injuries were sustained in February 2017
Data is at 31 January 2017
0
1
2
3
4
5
0
10
20
30
40
50
60
70
80
90
No
of
LT
Is
No
. o
f D
ays L
ost
Lost Time Injuries
Water Total Days Lost Water Total LTIs
LTI Days Lost LTI Days Lost LTI Days Lost LTI Days Lost LTI Days Lost
Administration
Business Services
Planning & Sustainability
Water Network 2 79 4 9 3 71 0 0 0 0
Water Treatment
Infrastructure Delivery
Water Services 2 79 4 9 3 71 0 0 0 0
2016-17Department 2012-13 2013-14 2014-15 2015-16
Page 5
Engineering & Commercial Infrastructure Monthly Review > February 2017
FINANCE
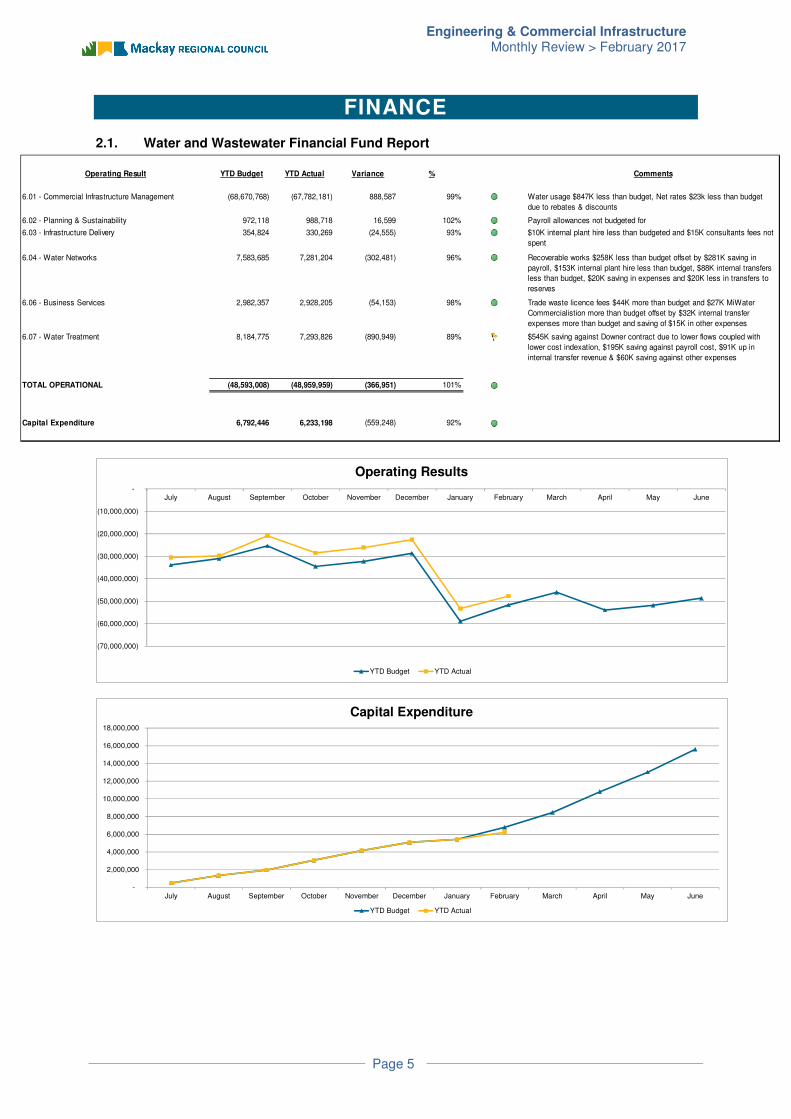
2.1. Water and Wastewater Financial Fund Report
Operating Result YTD Budget YTD Actual Variance %
6.01 - Commercial Infrastructure Management (68,670,768) (67,782,181) 888,587 99%
6.02 - Planning & Sustainability 972,118 988,718 16,599 102%
6.03 - Infrastructure Delivery 354,824 330,269 (24,555) 93%
6.04 - Water Networks 7,583,685 7,281,204 (302,481) 96%
6.06 - Business Services 2,982,357 2,928,205 (54,153) 98%
6.07 - Water Treatment 8,184,775 7,293,826 (890,949) 89%
TOTAL OPERATIONAL (48,593,008) (48,959,959) (366,951) 101%
Capital Expenditure 6,792,446 6,233,198 (559,248) 92%
Comments
Water usage $847K less than budget, Net rates $23k less than budget
due to rebates & discounts
Payroll allowances not budgeted for
$10K internal plant hire less than budgeted and $15K consultants fees not
spent
Recoverable works $258K less than budget offset by $281K saving in
payroll, $153K internal plant hire less than budget, $88K internal transfers
less than budget, $20K saving in expenses and $20K less in transfers to
reserves
Trade waste licence fees $44K more than budget and $27K MiWater
Commercialistion more than budget offset by $32K internal transfer
expenses more than budget and saving of $15K in other expenses
$545K saving against Downer contract due to lower flows coupled with
lower cost indexation, $195K saving against payroll cost, $91K up in
internal transfer revenue & $60K saving against other expenses
(70,000,000)
(60,000,000)
(50,000,000)
(40,000,000)
(30,000,000)
(20,000,000)
(10,000,000)
-July August September October November December January February March April May June
Operating Results
YTD Budget YTD Actual
-
2,000,000
4,000,000
6,000,000
8,000,000
10,000,000
12,000,000
14,000,000
16,000,000
18,000,000
July August September October November December January February March April May June
Capital Expenditure
YTD Budget YTD Actual
Page 6
Engineering & Commercial Infrastructure Monthly Review > February 2017
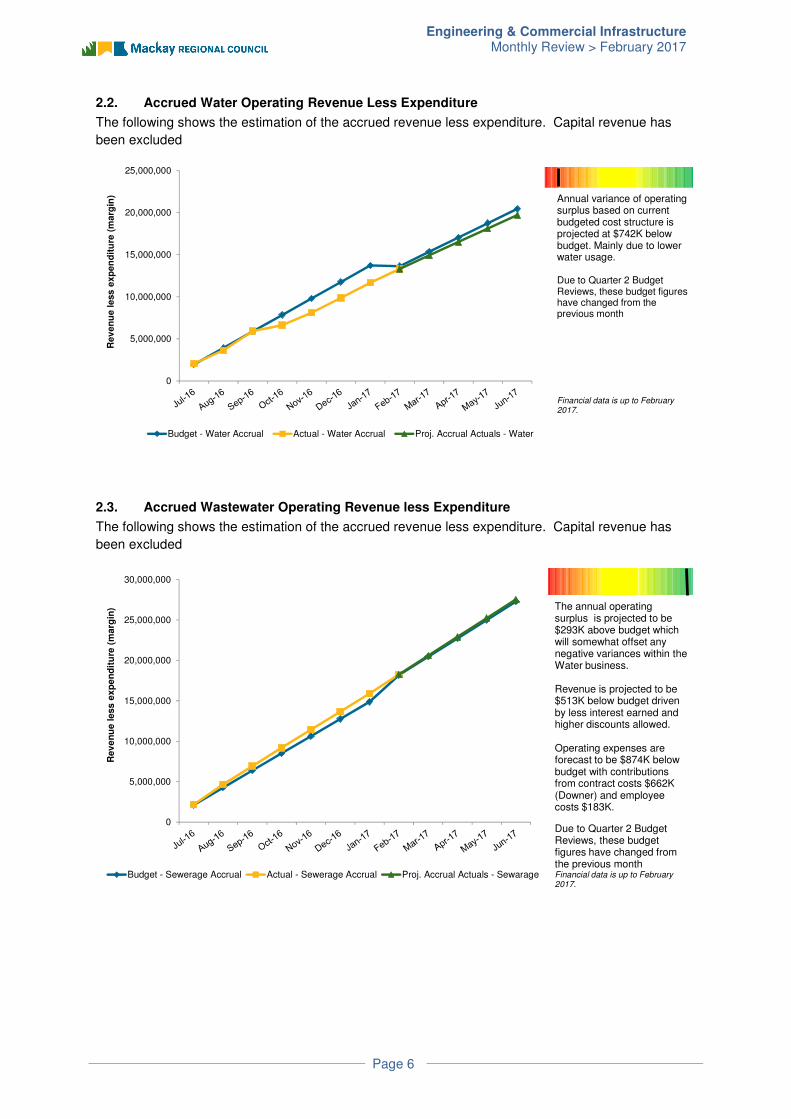
2.2. Accrued Water Operating Revenue Less Expenditure
The following shows the estimation of the accrued revenue less expenditure. Capital revenue has
been excluded
2.3. Accrued Wastewater Operating Revenue less Expenditure
The following shows the estimation of the accrued revenue less expenditure. Capital revenue has
been excluded
Annual variance of operating surplus based on current budgeted cost structure is projected at $742K below budget. Mainly due to lower water usage.
Due to Quarter 2 Budget Reviews, these budget figures have changed from the previous month
Financial data is up to February 2017.
0
5,000,000
10,000,000
15,000,000
20,000,000
25,000,000
Rev
en
ue less e
xp
en
dit
ure
(m
arg
in)
Operational Hours
Budget - Water Accrual Actual - Water Accrual Proj. Accrual Actuals - Water
The annual operating surplus is projected to be $293K above budget which will somewhat offset any negative variances within the Water business.
Revenue is projected to be $513K below budget driven by less interest earned and higher discounts allowed.
Operating expenses are forecast to be $874K below budget with contributions from contract costs $662K (Downer) and employee costs $183K.
Due to Quarter 2 Budget Reviews, these budget figures have changed from the previous monthFinancial data is up to February 2017.
0
5,000,000
10,000,000
15,000,000
20,000,000
25,000,000
30,000,000
Rev
en
ue l
ess
ex
pe
nd
itu
re (
marg
in)
Operational Hours
Budget - Sewerage Accrual Actual - Sewerage Accrual Proj. Accrual Actuals - Sewarage

Page 7
Engineering & Commercial Infrastructure Monthly Review > February 2017
2.4. Capital Expenditure Performance
The following trend provides a high level overview of the capital expenditure to monitor actual
expenditure against forecast expenditure. The forecast expenditure profile is based on the original
Water and Sewerage Capital Program projects budget and delivery schedule.
CUSTOMER SERVICES
3.1. Requests
This chart details the customer requests received and recorded via pathways that relate to the Water
Business. The target is to have 90% of all customer requests closed at any one point in time
.
Capital YTD expenditure actuals resulted in a 40% spend of Budget.
Including committals 65% of total budget has been spent.
Forecast to spent 86% of total budget.
The remaining budget is forecast to be spent in 2017/2018.
Financial data is up to February 2017.
0
2,000,000
4,000,000
6,000,000
8,000,000
10,000,000
12,000,000
14,000,000
16,000,000
18,000,000
20,000,000
Ex
pe
nd
itu
re (
$)
Operational Hours
YTD Actual Capital Expenditure YTD Actual + Committals Capital Expenditure
Forecast Cash Flow Capital Amd Budget
Amd Budget Cash Flow
0%
20%
40%
60%
80%
100%
0
50
100
150
200
250
300
350
400
450
500
% C
lien
t R
eq
uests
Co
mp
lete
d
To
tal C
lien
t R
eq
uests
Monthly Client Requests Received % of total Client Requests Completed
Completion Target %
95% of Client Requests completed in February 2017
Data is at 27 February 2017
Page 8
Engineering & Commercial Infrastructure Monthly Review > February 2017
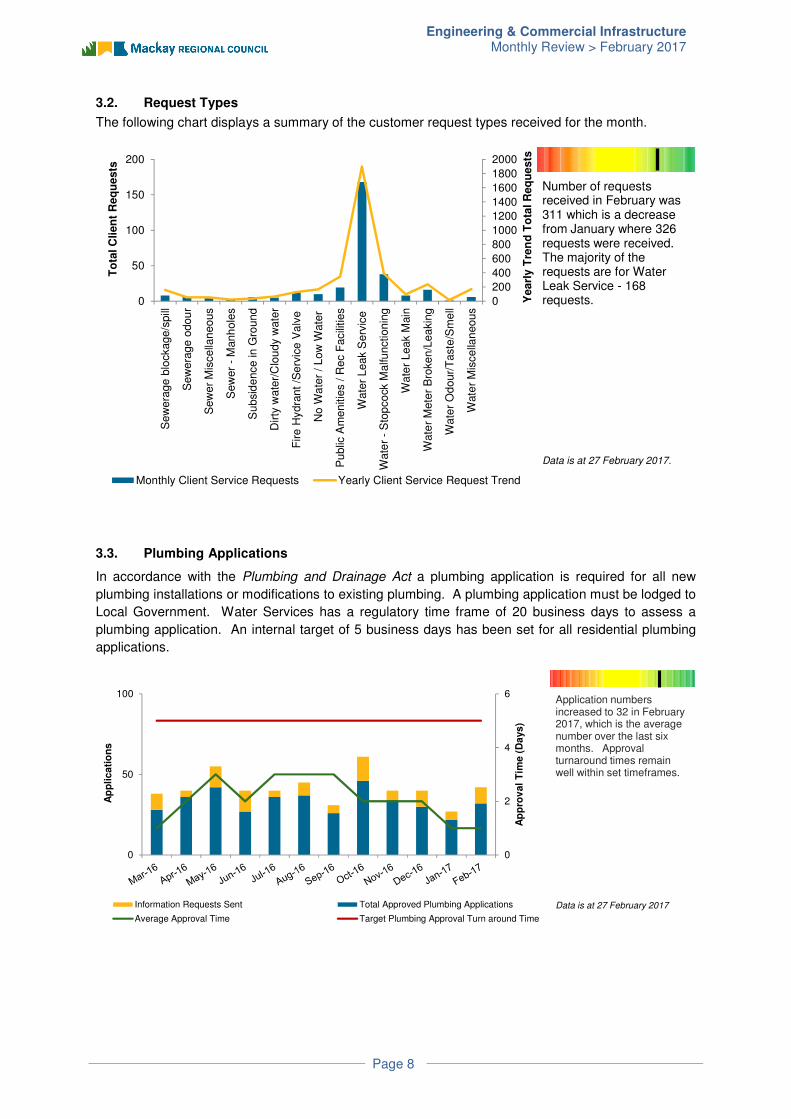
3.2. Request Types
The following chart displays a summary of the customer request types received for the month.
3.3. Plumbing Applications
In accordance with the Plumbing and Drainage Act a plumbing application is required for all new
plumbing installations or modifications to existing plumbing. A plumbing application must be lodged to
Local Government. Water Services has a regulatory time frame of 20 business days to assess a
plumbing application. An internal target of 5 business days has been set for all residential plumbing
applications.
Number of requests received in February was 311 which is a decrease from January where 326 requests were received. The majority of the requests are for Water Leak Service - 168 requests.
Data is at 27 February 2017.
0
200
400
600
800
1000
1200
1400
1600
1800
2000
0
50
100
150
200S
ew
era
ge b
lockage/s
pill
Sew
era
ge o
dou
r
Sew
er
Mis
cella
neous
Sew
er
- M
anh
ole
s
Subsid
ence in G
round
Dirty
wate
r/C
lou
dy w
ate
r
Fire
Hydra
nt
/Se
rvic
e V
alv
e
No W
ate
r / L
ow
Wate
r
Public
Am
en
itie
s / R
ec F
acili
ties
Wate
r Leak S
erv
ice
Wate
r -
Sto
pco
ck M
alfunctionin
g
Wate
r Leak M
ain
Wate
r M
ete
r B
roken
/Lea
kin
g
Wate
r O
dour/
Taste
/Sm
ell
Wate
r M
iscella
neous
Yearl
y T
ren
d T
ota
l R
eq
uests
To
tal C
lien
t R
eq
uests
Monthly Client Service Requests Yearly Client Service Request Trend
Application numbers increased to 32 in February 2017, which is the average number over the last six months. Approval turnaround times remain well within set timeframes.
Data is at 27 February 2017
0
2
4
6
0
50
100
Ap
pro
va
l T
ime (
Da
ys
)
Ap
pli
ca
tio
ns
Information Requests Sent Total Approved Plumbing Applications
Average Approval Time Target Plumbing Approval Turn around Time

Page 9
Engineering & Commercial Infrastructure Monthly Review > February 2017
3.4. Trade Waste Approvals
The program for undertaking trade waste assessment and licensing of all applicable businesses that
discharge trade waste is ongoing. As part of the Trade Waste Assessment process a temporary
Trade Waste Approval is put in place while the formal approval process is undertaken. The table
below summarises the number of Trade Waste Approvals for the Mackay Region.
3.5. Annual Trade Waste Activity
Annual targets are set for the Trade Waste team with respect to licensing Trade Waste Businesses.
The target has been set at 250 new licensed businesses and audits completed by June 2017. The
following chart shows the Actual Approvals, Temporary Approvals and Audits achieved and the
number of the target remaining.
79
125
90 30
125
0% 20% 40% 60% 80% 100%
Target Trade Waste Approvals & Audits Completed
YTD Audits Remaining Audits YTD Approvals
Temporary Approvals Remaining Approvals
11 Approvals issued and11 Audits conducted during February 2017.
The target is 250 combined Approvals and Audits for 2016/2017 financial year
Data is at 27 February 2017
Total Approved
Businesses
Temporary
Approvals In
Place
New Approved
Businesses for
the Month
Mackay South 747 26 7
Mackay North 68 3 2
Sarina 58 0 2
Mirani/Marian 30 1 0
Total 903 30 11
11 new businesses were
identified for the month
of February.
Data is at 27 February 2017
Page 10
Engineering & Commercial Infrastructure Monthly Review > February 2017
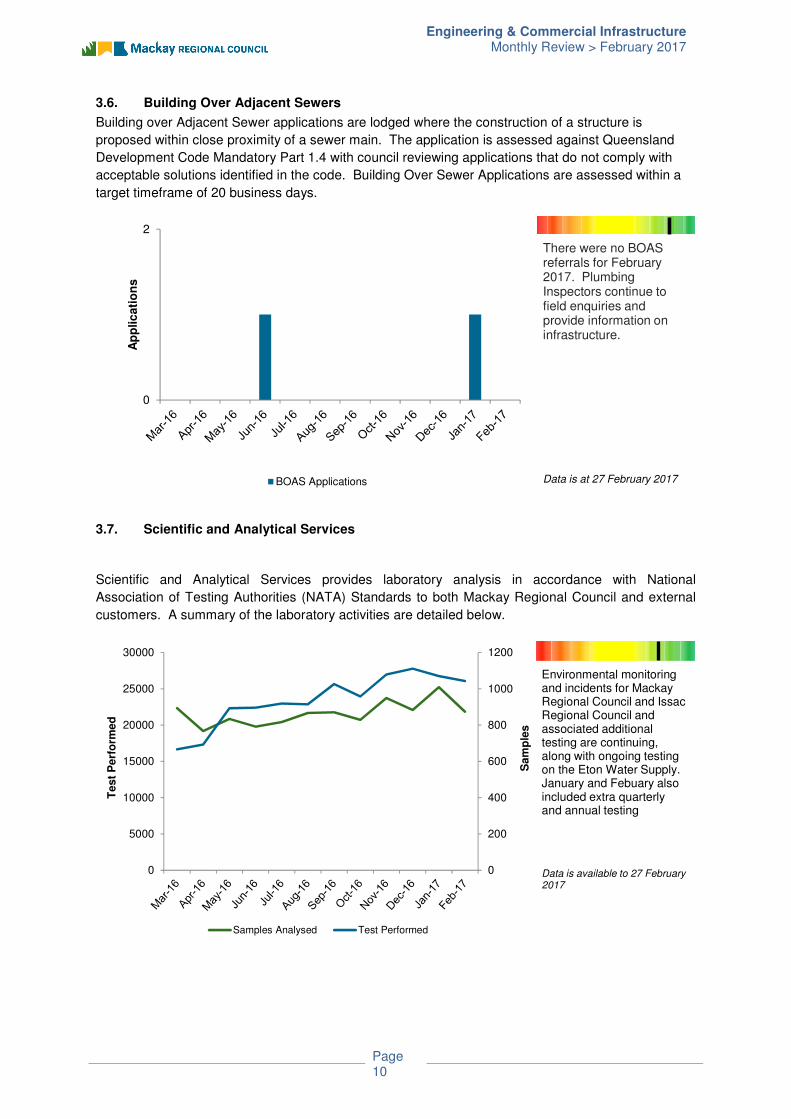
3.6. Building Over Adjacent Sewers
Building over Adjacent Sewer applications are lodged where the construction of a structure is
proposed within close proximity of a sewer main. The application is assessed against Queensland
Development Code Mandatory Part 1.4 with council reviewing applications that do not comply with
acceptable solutions identified in the code. Building Over Sewer Applications are assessed within a
target timeframe of 20 business days.
3.7. Scientific and Analytical Services
Scientific and Analytical Services provides laboratory analysis in accordance with National
Association of Testing Authorities (NATA) Standards to both Mackay Regional Council and external
customers. A summary of the laboratory activities are detailed below.
There were no BOAS referrals for February 2017. PlumbingInspectors continue to field enquiries and provide information on infrastructure.
Data is at 27 February 2017
0
2
Ap
plic
ati
on
s
BOAS Applications
0
5000
10000
15000
20000
25000
30000
0
200
400
600
800
1000
1200
Test
Perf
orm
ed
Sam
ple
s
Samples Analysed Test Performed
Environmental monitoring and incidents for Mackay Regional Council and Issac Regional Council and associated additional testing are continuing, along with ongoing testing on the Eton Water Supply. January and Febuary also included extra quarterly and annual testing
Data is available to 27 February 2017
Page 11
Engineering & Commercial Infrastructure Monthly Review > February 2017
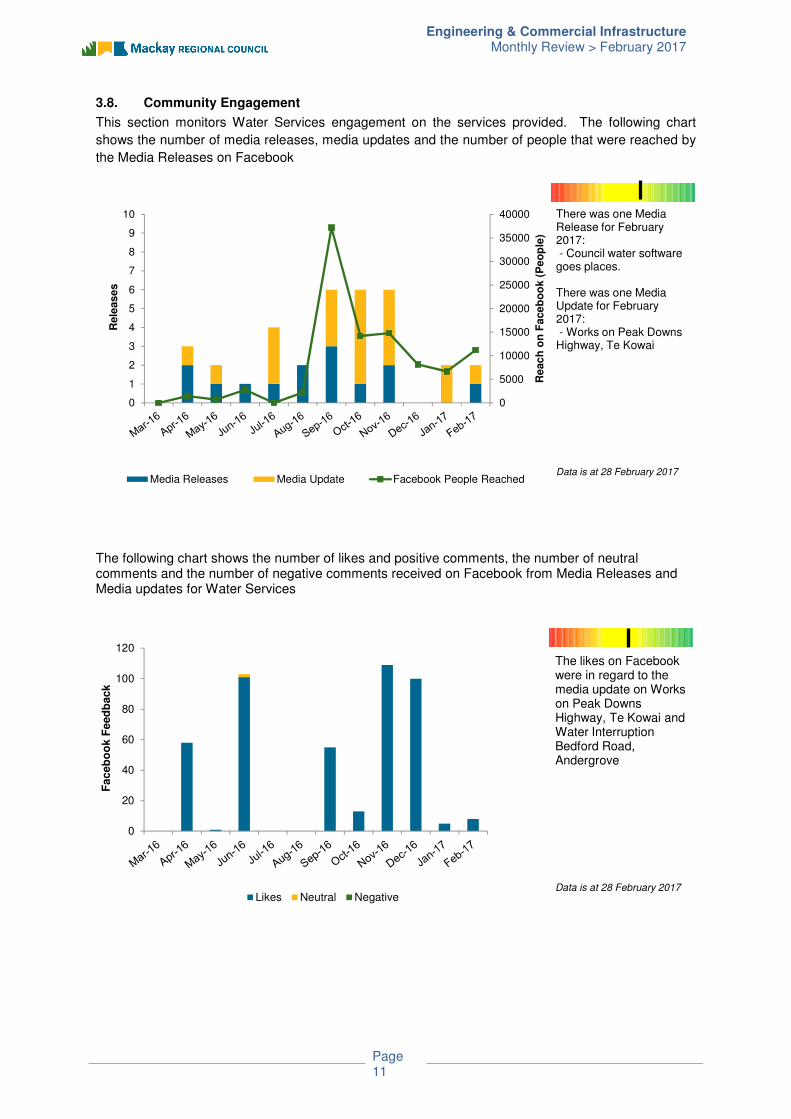
3.8. Community Engagement
This section monitors Water Services engagement on the services provided. The following chart
shows the number of media releases, media updates and the number of people that were reached by
the Media Releases on Facebook
The following chart shows the number of likes and positive comments, the number of neutral comments and the number of negative comments received on Facebook from Media Releases and Media updates for Water Services
There was one Media Release for February 2017:- Council water software goes places.
There was one Media Update for February 2017:- Works on Peak Downs Highway, Te Kowai
Data is at 28 February 2017
0
5000
10000
15000
20000
25000
30000
35000
40000
0
1
2
3
4
5
6
7
8
9
10
Re
ac
h o
n F
ace
bo
ok
(P
eo
ple
)
Rele
as
es
Media Releases Media Update Facebook People Reached
The likes on Facebook were in regard to the media update on Works on Peak Downs Highway, Te Kowai and Water Interruption Bedford Road, Andergrove
Data is at 28 February 2017
0
20
40
60
80
100
120
Fa
ce
bo
ok F
eed
ba
ck
Likes Neutral Negative
Page 12
Engineering & Commercial Infrastructure Monthly Review > February 2017
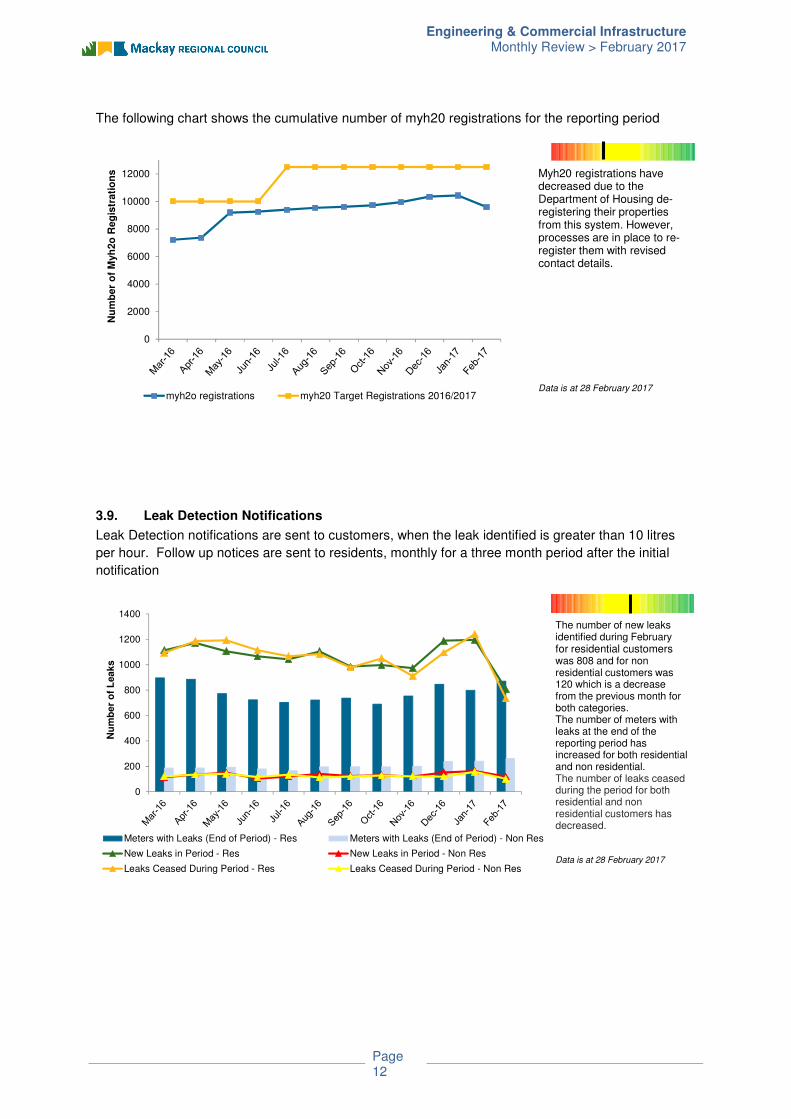
The following chart shows the cumulative number of myh20 registrations for the reporting period
3.9. Leak Detection Notifications
Leak Detection notifications are sent to customers, when the leak identified is greater than 10 litres
per hour. Follow up notices are sent to residents, monthly for a three month period after the initial
notification
Myh20 registrations have decreased due to the Department of Housing de-registering their properties from this system. However, processes are in place to re-register them with revised contact details.
Data is at 28 February 2017
0
2000
4000
6000
8000
10000
12000
Nu
mb
er
of
Myh
2o
Reg
istr
ati
on
s
myh2o registrations myh20 Target Registrations 2016/2017
The number of new leaks identified during February for residential customers was 808 and for non residential customers was 120 which is a decrease from the previous month for both categories.The number of meters with leaks at the end of the reporting period has increased for both residential and non residential. The number of leaks ceased during the period for both residential and non residential customers has decreased.
Data is at 28 February 2017
0
200
400
600
800
1000
1200
1400
Nu
mb
er
of
Lea
ks
Meters with Leaks (End of Period) - Res Meters with Leaks (End of Period) - Non Res
New Leaks in Period - Res New Leaks in Period - Non Res
Leaks Ceased During Period - Res Leaks Ceased During Period - Non Res
Page 13
Engineering & Commercial Infrastructure Monthly Review > February 2017
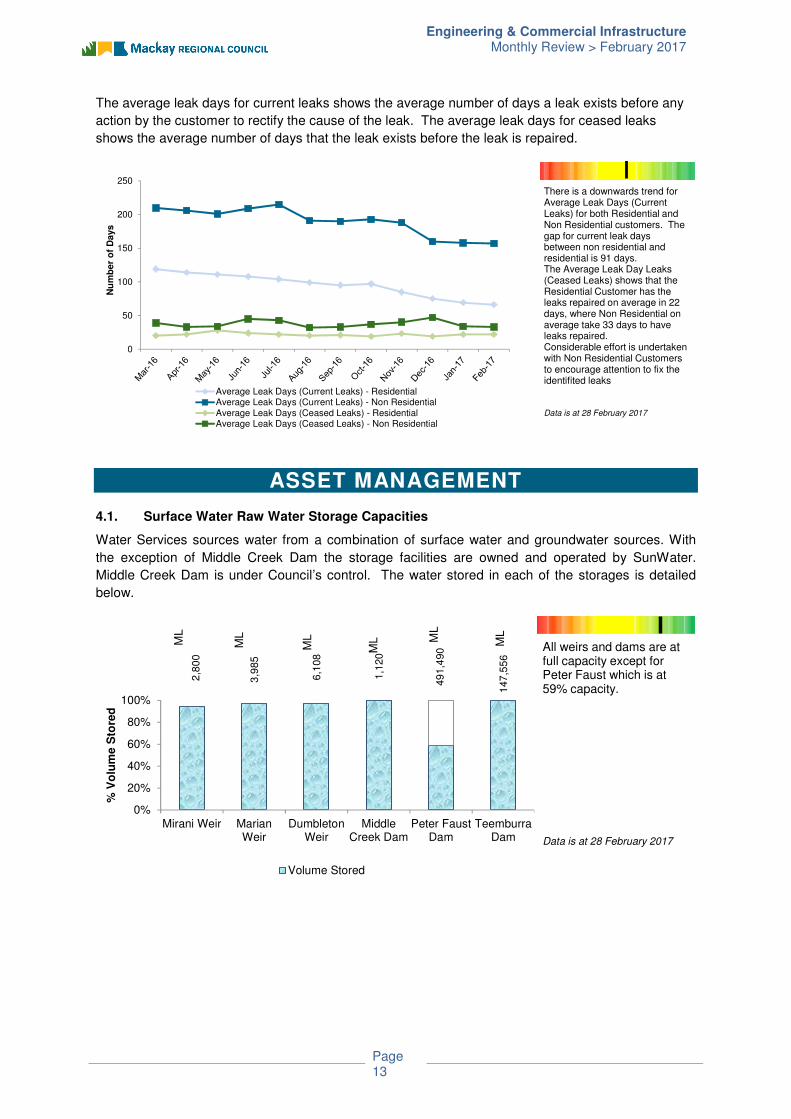
The average leak days for current leaks shows the average number of days a leak exists before any
action by the customer to rectify the cause of the leak. The average leak days for ceased leaks
shows the average number of days that the leak exists before the leak is repaired.
ASSET MANAGEMENT
4.1. Surface Water Raw Water Storage Capacities
Water Services sources water from a combination of surface water and groundwater sources. With
the exception of Middle Creek Dam the storage facilities are owned and operated by SunWater.
Middle Creek Dam is under Council’s control. The water stored in each of the storages is detailed
below.
There is a downwards trend for Average Leak Days (Current Leaks) for both Residential and Non Residential customers. The gap for current leak days between non residential and residential is 91 days. The Average Leak Day Leaks (Ceased Leaks) shows that the Residential Customer has the leaks repaired on average in 22 days, where Non Residential on average take 33 days to have leaks repaired.Considerable effort is undertaken with Non Residential Customers to encourage attention to fix the identifited leaks
Data is at 28 February 2017
0
50
100
150
200
250
Nu
mb
er
of
Da
ys
Average Leak Days (Current Leaks) - ResidentialAverage Leak Days (Current Leaks) - Non ResidentialAverage Leak Days (Ceased Leaks) - ResidentialAverage Leak Days (Ceased Leaks) - Non Residential
2,8
00
3,9
85
6,1
08
1,1
20
49
1,4
90
147
,55
6
0%
20%
40%
60%
80%
100%
Mirani Weir MarianWeir
DumbletonWeir
MiddleCreek Dam
Peter FaustDam
TeemburraDam
% V
olu
me S
tore
d
Volume Stored
ML
ML
ML
ML M
L
ML
All weirs and dams are at full capacity except for Peter Faust which is at 59% capacity.
Data is at 28 February 2017

Page 14
Engineering & Commercial Infrastructure Monthly Review > February 2017
4.2. Annual Water Consumption vs Allocation by Source
Water Services has a water allocation or water license for each water source. The water allocation
and year to date water consumption for each of the water sources is detailed below.
** Calen Water Usage figures are not based on Water Allocation, but show the amount of water usage
for the area to date.
4.3. Water Consumption by Locality
Water Services supplies water to both residential and commercial water customers throughout the
Mackay Region. The average water consumption in each of the three major community centres is
detailed below. The water consumption is presented as litres per equivalent population per day. This
chart provides a summary of water consumption including commercial water use.
186,2005074410012951152527381614315
48.42016000109523630010095
49022
270062
150
35230
4660460
0% 50% 100%
Calen Water Usage **Dumbleton
Nebo Rd BoresPlane CreekSarina Bores
Mirani BoreMarian Bores
Marwood BoresBloomsbury BoreProserpine River
Eton BoresBally Keel BoreKoumala Bores
Armstrong Beach BoreFinch Hatton Bore
Gargett BoresMarian Weir
Wate
r V
olu
me
(M
L)
YTD Water Consumed Allocation
At the current rate of consumption across the water sources, the annual allocations should not be exhausted by the end of the 16/17 FY, with the exception of Marian Weir. ECI management is investigating options to lease/purchase further allocation.
Data is at 28 February 2017
Water consumption for Mackay, Mirani and Sarina in February 2017 has reduced compared to the same time in 2016.
Data is at 28 February 2017
0
50
100
150
200
250
300
350
400
450
500
0
100
200
300
400
500
600
700
Wa
ter
Co
ns
um
pti
on
(l/p
/d)
Rain
fall
(m
m)
Rainfall Sarina L/P/D
Mackay L/P/D Mirani L/P/D
Target Consumption

Page 15
Engineering & Commercial Infrastructure Monthly Review > February 2017
4.4. Significant Projects
Water Services undertakes a range of projects across the water business. Projects take the form of
Capital works projects, planning studies and investigations. Information for the significant projects in
Water Services is provided in the table below and was current as at 28 February 2017. Significant
Projects are assessed on the following criteria: Dollar Amount, Risk and/or Community Interest
Council Project Management Phases 1. Planning (Plan) 2. Design (Des) 3. Procurement (Proc) 4. Construction (Con)
Indicators On Track
Potential Issue
Definite Issue
PROJECT PHASE PHASE %
COMPLETE INDICATORS
ORIGINAL
BUDGET
DETAILS
COMMENTS
Sewerage
Network
Refurbishments
(Relining)
Proc 60% Schedule Scheduled Completion Date:
30/06/2017
Original Budget:
$1,126,583
Tender for relining works has closed and is
currently being evaluated. A substantial portion
of this work is scheduled for completion during
the driest months thus continuing across July,
August with completion in September 2017,
consequently as part of the December budget
review it is proposed the available budget be
adjusted to reflect the expenditure timing.
Budget
Other
Issues/
Risk
Sewerage
Network
Refurbishments
(Manholes)
Con 35% Schedule Scheduled Completion Date:
30/06/2017
Original Budget:
$935,850
Network crews in advanced stages of
completion of inspection of restricted access
manholes (MH) and inspection of buried
manholes with CCTV. Access issues are being
resolved for inspection of few remaining
manholes. Tender for MH relining works with
Calcium Aluminate has been awarded and a
pre-start meeting with the Contractor was
conducted. Contract for MH relining with
epoxy has been awarded, with works
commenced. Quotation for condition
assessment of 600 MH has been retendered
due poor response. Tenders for the same
closes end February.
Budget
Other
Issues/
Risk
Sewage Pump
Station
Resilience
Upgrades
Con 65% Schedule Scheduled Completion Date:
1/09/2017
Original Budget:
$3,874,534
The construction is well under way since 12
September 2016 and despite a number of days
lost to wet weather works remain on program.
The Contractor Roebuck Civil has completed 5
access improvements out of 9, has installed 14
ventpoles out of 28, has factory tested 15
switchboards, installed and commissioned 12
switchboards on site out of 20, has relocated 6
antennas out of 6 and has completed 5 wet
well rehabilitations out of 5.
Budget
Other
Issues/
Risk
Water Main
Replacements -
Roads Driven
Des and
Con
65% Overall Schedule Scheduled Completion Date:
30/06/2017
Original Budget:
$296,237
The 16/17 Capital project includes 3 water
mains (WM) that require relocation prior to
MRC road works. Construction of Curlew St
WM is complete. Physical Works for
Construction of Breen St New Water Main is
complete. Construction of Vincent St is
scheduled to commence in April. Changes in
Civil Projects program has resulted in two
additional WMR projects - Forsyth St
(construction completed) and Holmes Ave
(design nearing completion).
Budget
Other
Issues/
Risk
Page 16
Engineering & Commercial Infrastructure Monthly Review > February 2017
PROJECT PHASE PHASE %
COMPLETE INDICATORS
ORIGINAL
BUDGET
DETAILS
COMMENTS
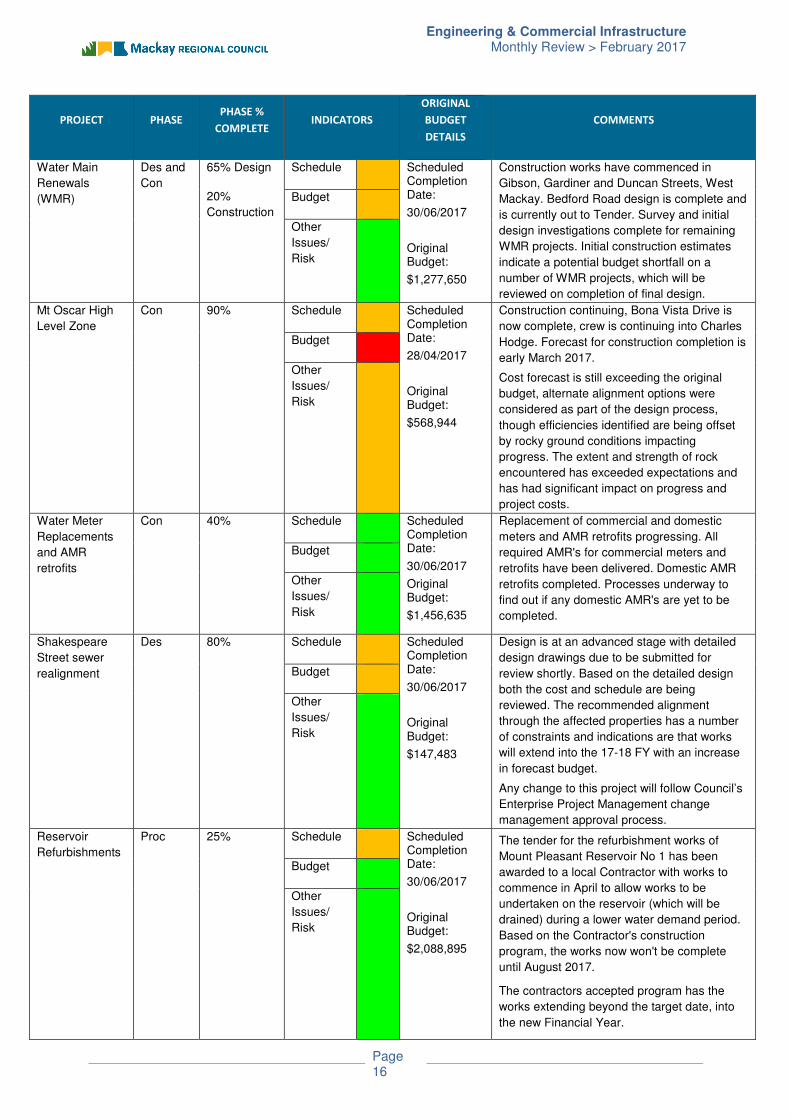
Water Main
Renewals
(WMR)
Des and
Con
65% Design
20%
Construction
Schedule Scheduled Completion Date:
30/06/2017
Original Budget:
$1,277,650
Construction works have commenced in
Gibson, Gardiner and Duncan Streets, West
Mackay. Bedford Road design is complete and
is currently out to Tender. Survey and initial
design investigations complete for remaining
WMR projects. Initial construction estimates
indicate a potential budget shortfall on a
number of WMR projects, which will be
reviewed on completion of final design.
Budget
Other
Issues/
Risk
Mt Oscar High
Level Zone
Con 90% Schedule Scheduled Completion Date:
28/04/2017
Original Budget:
$568,944
Construction continuing, Bona Vista Drive is
now complete, crew is continuing into Charles
Hodge. Forecast for construction completion is
early March 2017.
Cost forecast is still exceeding the original
budget, alternate alignment options were
considered as part of the design process,
though efficiencies identified are being offset
by rocky ground conditions impacting
progress. The extent and strength of rock
encountered has exceeded expectations and
has had significant impact on progress and
project costs.
Budget
Other
Issues/
Risk
Water Meter
Replacements
and AMR
retrofits
Con 40% Schedule Scheduled Completion Date:
30/06/2017
Original Budget:
$1,456,635
Replacement of commercial and domestic
meters and AMR retrofits progressing. All
required AMR's for commercial meters and
retrofits have been delivered. Domestic AMR
retrofits completed. Processes underway to
find out if any domestic AMR's are yet to be
completed.
Budget
Other
Issues/
Risk
Shakespeare
Street sewer
realignment
Des 80% Schedule Scheduled Completion Date:
30/06/2017
Original Budget:
$147,483
Design is at an advanced stage with detailed
design drawings due to be submitted for
review shortly. Based on the detailed design
both the cost and schedule are being
reviewed. The recommended alignment
through the affected properties has a number
of constraints and indications are that works
will extend into the 17-18 FY with an increase
in forecast budget.
Any change to this project will follow Council’s
Enterprise Project Management change
management approval process.
Budget
Other
Issues/
Risk
Reservoir
Refurbishments
Proc 25% Schedule Scheduled Completion Date:
30/06/2017
Original Budget:
$2,088,895
The tender for the refurbishment works of
Mount Pleasant Reservoir No 1 has been
awarded to a local Contractor with works to
commence in April to allow works to be
undertaken on the reservoir (which will be
drained) during a lower water demand period.
Based on the Contractor's construction
program, the works now won't be complete
until August 2017.
The contractors accepted program has the
works extending beyond the target date, into
the new Financial Year.
Budget
Other
Issues/
Risk
Page 17
Engineering & Commercial Infrastructure Monthly Review > February 2017
PROJECT PHASE PHASE %
COMPLETE INDICATORS
ORIGINAL
BUDGET
DETAILS
COMMENTS
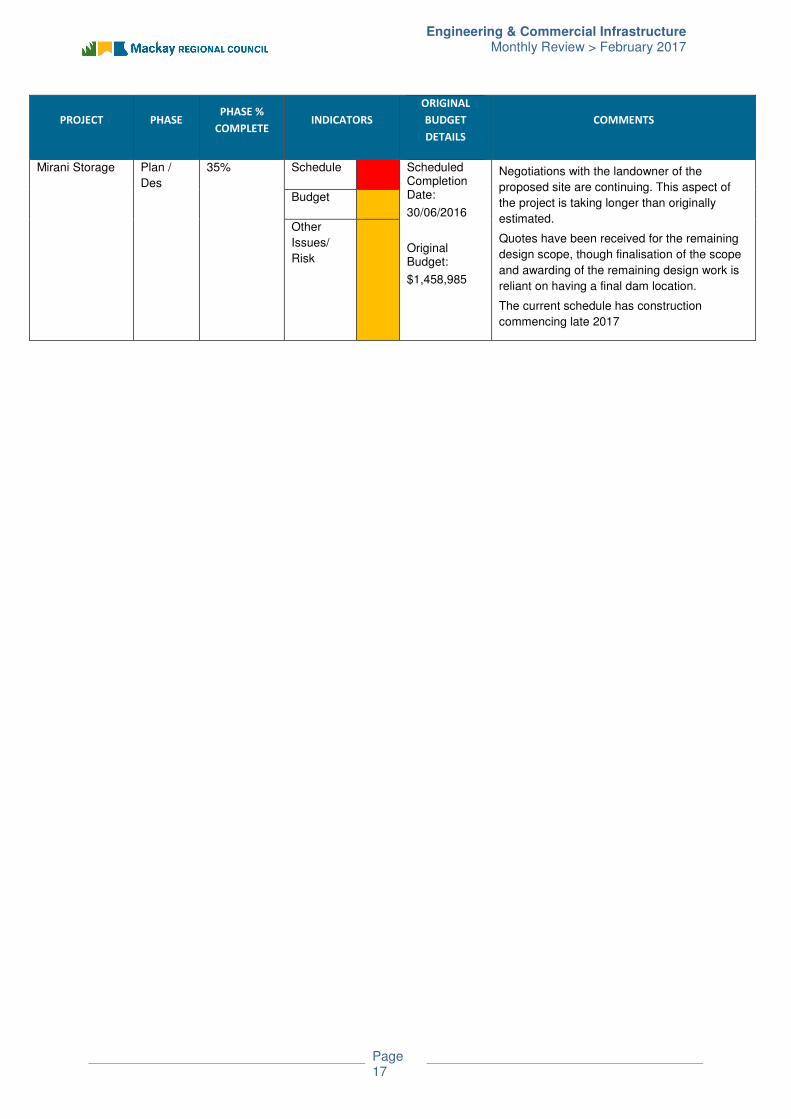
Mirani Storage Plan /
Des
35% Schedule Scheduled Completion Date:
30/06/2016
Original Budget:
$1,458,985
Negotiations with the landowner of the
proposed site are continuing. This aspect of
the project is taking longer than originally
estimated.
Quotes have been received for the remaining
design scope, though finalisation of the scope
and awarding of the remaining design work is
reliant on having a final dam location.
The current schedule has construction
commencing late 2017
Budget
Other
Issues/
Risk
Page 18
Engineering & Commercial Infrastructure Monthly Review > February 2017
REGULATORY COMPLIANCE
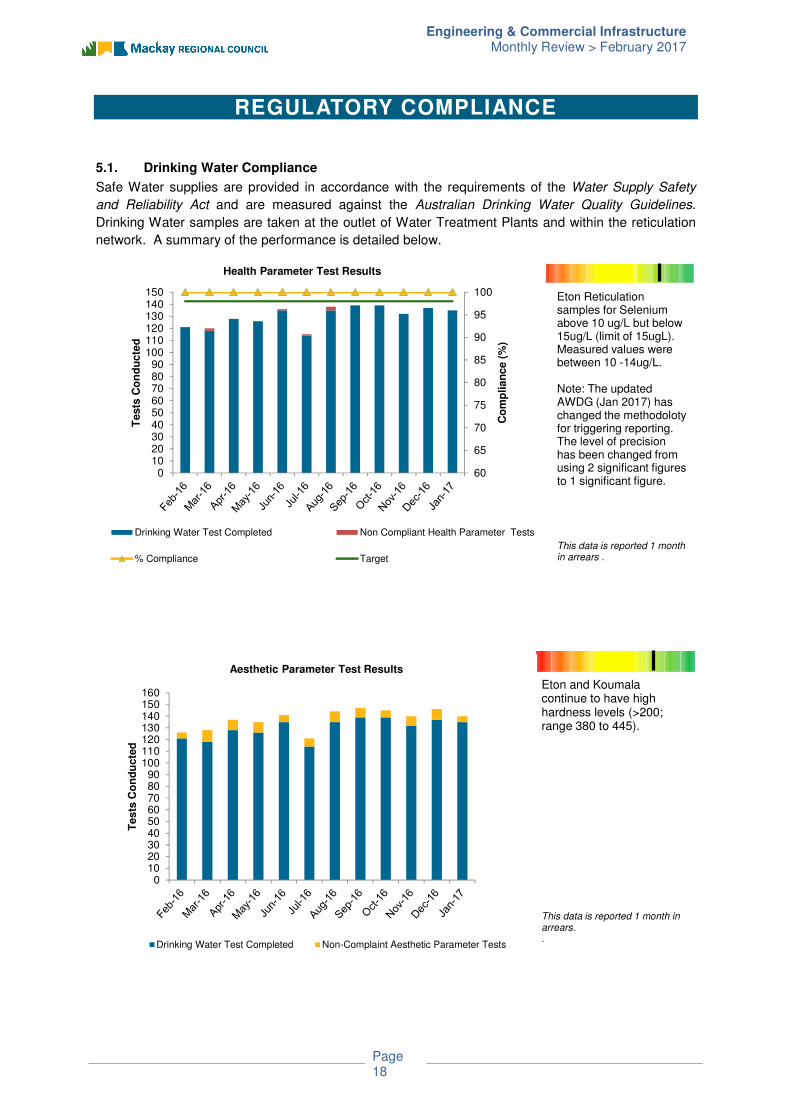
5.1. Drinking Water Compliance
Safe Water supplies are provided in accordance with the requirements of the Water Supply Safety
and Reliability Act and are measured against the Australian Drinking Water Quality Guidelines.
Drinking Water samples are taken at the outlet of Water Treatment Plants and within the reticulation
network. A summary of the performance is detailed below.
Eton Reticulation samples for Selenium above 10 ug/L but below15ug/L (limit of 15ugL). Measured values were between 10 -14ug/L.
Note: The updated AWDG (Jan 2017) has changed the methodoloty for triggering reporting. The level of precision has been changed from using 2 significant figures to 1 significant figure.
This data is reported 1 month in arrears .
60
65
70
75
80
85
90
95
100
0102030405060708090
100110120130140150
Co
mp
lia
nc
e (
%)
Te
sts
Co
nd
uc
ted
Health Parameter Test Results
Drinking Water Test Completed Non Compliant Health Parameter Tests
% Compliance Target
Eton and Koumala continue to have high hardness levels (>200; range 380 to 445).
This data is reported 1 month in arrears..
0102030405060708090
100110120130140150160
Te
sts
Co
nd
uc
ted
Aesthetic Parameter Test Results
Drinking Water Test Completed Non-Complaint Aesthetic Parameter Tests
Page 19
Engineering & Commercial Infrastructure Monthly Review > February 2017
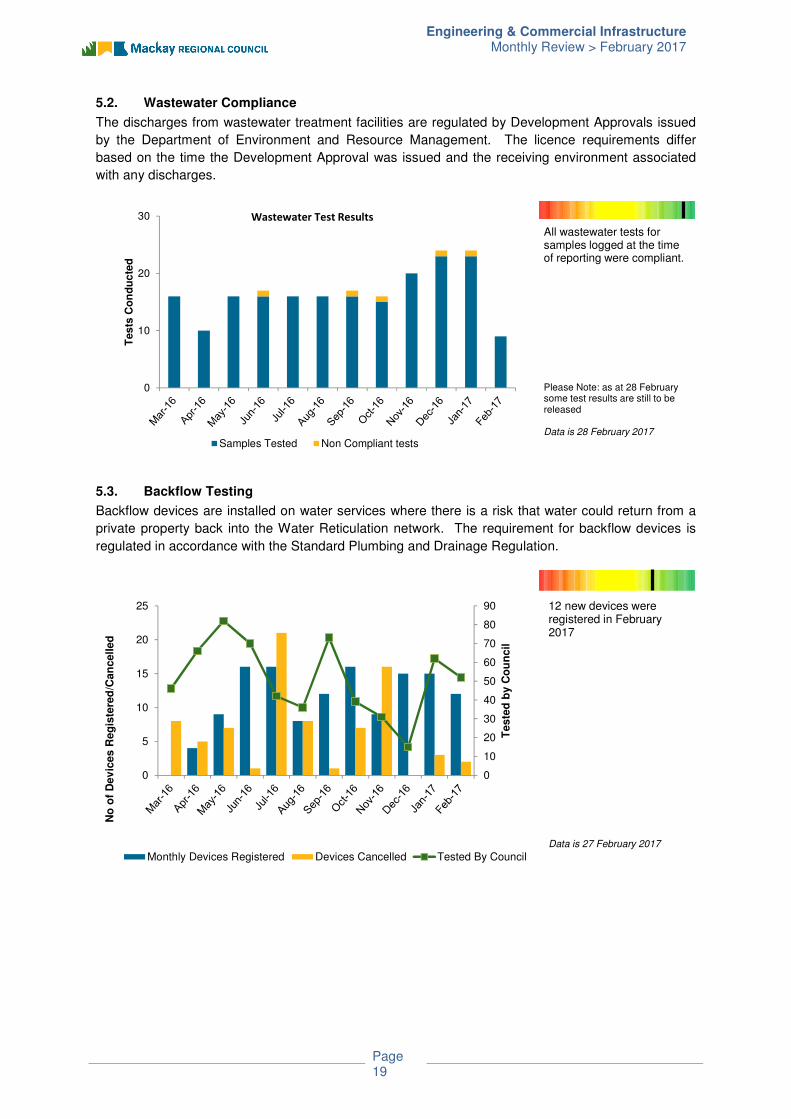
5.2. Wastewater Compliance
The discharges from wastewater treatment facilities are regulated by Development Approvals issued
by the Department of Environment and Resource Management. The licence requirements differ
based on the time the Development Approval was issued and the receiving environment associated
with any discharges.
5.3. Backflow Testing
Backflow devices are installed on water services where there is a risk that water could return from a
private property back into the Water Reticulation network. The requirement for backflow devices is
regulated in accordance with the Standard Plumbing and Drainage Regulation.
All wastewater tests for samples logged at the time of reporting were compliant.
Please Note: as at 28 February some test results are still to be released
Data is 28 February 2017
0
10
20
30
Tes
ts C
on
du
cte
d
Samples Tested Non Compliant tests
Wastewater Test Results
12 new devices were registered in February 2017
Data is 27 February 2017
0
10
20
30
40
50
60
70
80
90
0
5
10
15
20
25
Teste
d b
y C
ou
ncil
No
of
Dev
ices R
eg
iste
red
/Can
celled
Monthly Devices Registered Devices Cancelled Tested By Council
Recommended