1
Enhancing Diversity and At-Risk Species Habitat in Degraded
Prairie Landscapes
Final Report for State Wildlife Grant # T2D6HM01
Chris Helzer, Eastern Nebraska Program Director - The Nature Conservancy
This is the final report for a State Wildlife Grant to The Nature Conservancy through the Nebraska Game
and Parks Commission. This project started in May 2010 and was completed in November 2012. It was
a continuation of our efforts to enhance prairie habitat quality through fire/grazing management and
overseeding/seedling plugs – a project that had earlier been funded by a 2007 State Wildlife Grant.
Results of projects done under this grant were also shared with the public through various posts on the
Prairie Ecologist blog (http://prairieecologist.com). A summary of management recommendations
based on activities under this grant can be found on page 11. In addition, several Appendices at the end
of this document detail methods and provide more detailed data.
Summary of objectives for this project
1. Evaluate and record the impacts of modified patch-burn grazing management on prairies in
which cool-season exotic grasses are dominant and plant diversity is low. Evaluate the response
of butterflies, especially Tier I and Tier II species, to that fire/grazing management.
2. Test the efficacy of two methods of enhancing plant diversity; seed addition and seedling plugs.
3. Improve the plant diversity and habitat quality of at least 1000 acres through a combination of
factors, including patch-burn grazing, overseeding, and seedling plugs.
Deliverables promised
1. Enhanced plant diversity and at-risk species habitat quality on approximately 1,000 acres
2. Data on the responses of plant communities and at-risk butterflies to various fire/grazing
management and restoration strategies
3. Suggested best management practices for enhancing grasslands that are significantly impacted
by invasive grasses.
Summary of activities
- In 2011, we burned 5 units under this grant, for a total of 256 acres. In 2012, we burned 6 units,
for a total of 317 acres. All of these burns were done in conjunction with management plans
that incorporated fire and grazing together to target cool-season exotic grasses and increase
plant diversity and habitat quality.
2
- During each of the years between 2010 and 2012, approximately 1,591 acres were included in
management that integrated prescribed fire, grazing, and rest. Work done to implement fire
and grazing in the 2012 season is also covered under another State Wildlife Grant (T76MH1),
received in 2011, but is mentioned here because there is so much overlap between that
workscope and that of this grant. Invasive species control, through chemical and mechanical
means, was carried out on all of these prairies as well. Major species addressed included
Siberian elm, eastern red cedar, musk and Canada thistle, smooth brome, reed canarygrass,
Kentucky bluegrass, tall wheatgrass, phragmites, and purple loosestrife. Chemical control
consisted mainly of spot spraying or application of chemical via a PVC herbicide wand (for small
trees).
- We overseeded 62 acres of those burned/grazed areas in 2010, 29 acres in 2011, and 62 acres in
2012. Many of those plots – especially in 2010 - were seeded with a variety of seeding rates to
help evaluate the impact of seeding rate on results. Between 2008 and 2012, a total of
approximately 500 acres of burned/grazed prairie were overseeded – funded by State Wildlife
Grants from 2007 and 2010 (see maps in Appendix A).
Our overseeding within the patch-burn grazing system is designed to take advantage of recently
burned areas to get good seed/soil when broadcasting seeds. The subsequent short-term (a
single growing season) intensive grazing then reduces competition from dominant grasses and
gives new seedlings a chance to establish and survive. During 2008 and 2009, we used seeding
rates similar to what we use when establishing new prairie seedings in cropfields (approximately
1-2 lbs PLS of forb seed per acre), but in 2010, 2011, and 2012, we dramatically increased those
rates to see if we could get higher abundances of new forbs. This resulted in fewer acres
seeded, but (hopefully) more dramatic results.
- Between 2010 and 2012, we plugged more than 800 prairie plant seedlings into 7 prairies, and
another several hundred plants into our nursery for seed production. In 2011, we had very poor
germination of seedlings in our greenhouse, so we replaced the transparent panels on the front
of the greenhouse prior to the 2012 season. Production was better in 2012, but many of the
species were not yet mature enough to move into prairies, and are being kept over until the
spring of 2013. The very dry weather in 2012 made it very difficult to assess the success of most
of our seedling transplants in prairies, so our data on that is thin.
- We conducted butterfly surveys throughout the summers of 2010-2012. In 2010, we conducted
transect surveys for all butterfly species, but after finding no at-risk or rare butterfly species
other than regal fritillaries, we focused our transect data collection solely on regal fritillaries in
2011 and 2012. During all three years, we did opportunistic sampling for other butterfly species,
but still found no new at-risk species.
3
Results and Discussion (See Appendices for more details, including methods descriptions and data.)
Overseeding success
Overseeding was done by broadcasting seed - primarily forb seeds of species missing from our prairies -
soon after a spring prescribed burn. Broadcasting was done either by hand or a drop-spreader (e.g. an
EZ-Flow fertilizer spreader) pulled behind an ATV. All seeded sites were under patch-burn grazing
management, so cattle focused intensive grazing on the same burned sites for the remainder of that
first season following the seeding and then grazed other portions of the prairie in subsequent years.
The hope was that the first year grazing would suppress the vigor of the dominant grasses (native and
non-native) sufficiently that seeds would have enough light and available moisture to germinate. The
vigor of suppressed grasses recovers slowly over the year or two post-fire, giving new seedlings a chance
to establish before competition becomes fierce again.
A previous report (Final report for 2007 SWG #T56) presents data from overseeding projects in 2008-
2010. Those data showed that with seeding rates similar to what we use when establishing new prairie
seedings in cropfield, establishment of forbs is possible, but densities of new plants are low. Follow-up
data collection and observations indicate that established plants in those plots have largely survived,
and a few species even seem to be increasing their abundance over time. The severe drought in 2012,
combined with intensive grazing where some of those plots were located made it difficult to get useful
data this year, but we did collect data from the Miller Tract in 2012, and a graph showing those results
can be found in Appendix A.
Between 2010 and 2012, we experimented with much higher seeding rates to see if that would increase
densities of newly established forbs. We used seeding rates of up to 8 times those cropfield seeding
rates and we continued to see higher establishment rates as we increased seeding rates – we haven’t
topped out yet (see Appendix A). This may indicate a very limited number of available spaces for new
seedlings to establish within existing prairie vegetation, and that increasing our seeding rates allows
more of those spaces to receive seeds.
Along those lines, one of the big challenges when attempting to increase the plant diversity of a prairie
is determining the best potential locations for successful establishment of each plant species. Soil
chemistry, texture, and moisture conditions are among the most important factors – in addition to levels
of competition. We can manipulate competition levels to aid in establishment, but the same is not true
with soil conditions. Using seedling plugs is particularly challenging because the relatively low number
of seedlings being planted provides a limited number of chances to get plants into appropriate micro
sites – especially in heterogeneous soils such as the alluvial soils along the Platte River. With
overseeding, the challenge is similar, but because of the high number of seeds, there are many more
opportunities to hit appropriate locations. We’ve seen evidence of this as we’ve increased our seeding
rates. In addition to seeing more plants of each species establish as a result of higher seeding rates,
we’ve also seen an increase in the total number of plant species that appear. We assume that those
higher seeding rates provide more matches between seeds and the conditions they need to germinate
and survive.
4
Ongoing research by Dr. Jean Knops of the University of Nebraska-Lincoln should help us refine our
ability to predict success of both seedling additions and overseeding projects. He and his students are
helping us to look at correlations between plant species occurrences and soil conditions (among other
things). We hope those results will help us refine our ability to correctly predict where efforts to add
missing plant species have the best chance of success.
In 2011, we did a small experiment with shallow tillage (2-3 inches deep) of several small areas within
one of our degraded remnant prairies. Seeding on top of those tilled areas resulted in very high
establishment rates of new forbs. This contrasted with efforts a few years earlier in which we did some
light disking and seeding on several sites and saw no increases in establishment rates between disked
and burned areas. Because of the 2011 results, we rented a large tractor-mounted tiller in 2012 and
tilled some plots of approximately 20 x 60 foot in size following a burn. Those tilled areas were seeded
at the same time, and with the same seeding rate, as the surrounding burned areas, and we left control
portions of each type unseeded. Unfortunately, because of the drought conditions in 2012, we saw
almost no establishment in either the burned or tilled plots, so the value of tilling is still unknown.
Others have reported early success (Carol Grygiel in S Dakota) with this method, but because our results
have been inconsistent, we want to experiment more before recommending the practice. Surprisingly,
though our seed addition results have been inconsistent, we have seen very good recovery of the pre-
existing vegetation with both the shallow tilling and disking we’ve done. Within a few years, there
appears to be no long-lasting impacts of the tillage on the plant species that were there beforehand.
However, it’s important to point out that we have only quantified that observationally, and have not
done explicit pre- and post-surveys of the plant community. If others experiment with this, we would
strongly recommend using small plots or strips – as we have done – rather than tilling or disking large
areas of prairie.
Based on our overseeding experiences dating back to 1998, the most important factor that determines
seeding success is soil moisture – driven by precipitation. Seeding rate, management of the site, and
other factors can’t override a lack of moisture, and we see almost no establishment from seedings done
in drought years. This is frustrating, of course, because it’s hard to predict whether or not growing
conditions will be favorable until after seed is harvested and planted.
Seedling additions
Between 2010 and 2012, we plugged more than 800 prairie plant seedlings of 10 species into 7 prairies.
We typically put the seedlings in groups of 5-7 plants to facilitate their ability to attract pollinators (and
to make them easier to find later). In most cases, seedlings were moved out in April and May
(sometimes early June) and watered only on the day they were transplanted.
Species added to prairies included:
- Rosinweed
- Butterfly milkweed

5
- Woolly sedge
- Fox sedge
- Lake sedge
- Crawe’s sedge
- Maximilian sunflower
- Purple coneflower
- Foxglove (Agalinus)
- Leadplant
- Woolly locoweed
Wetland sedges were transplanted into wetland swales in restored prairies. We marked plants in order
to track survival, but had a very difficult time finding the same plants the following year. Still, we think
survival was very good, based on the number of sedge plants we have seen in subsequent years.
Wetland plugs have a great chance of survival, in some ways, relative to those moved into mesic sites,
because of the higher soil moisture.
We had hoped to evaluate the success of the mesic plant transplants in the summer of 2012, but the
very dry weather made that difficult because nearly everything was dormant by mid-summer, and we
were not able to look at success.
Several hundred plants (11 species) were transplanted into our nursery beds for seed production. These
were mainly species for which we either have inconsistent seed harvest years or that we need more
seed harvest sites for. Those species included:
- Sensitive briar
- Rosinweed
- Compass plant
- Sideoats grama
- Slender wheatgrass
- Lance-leaved gayfeather
- Prairie larkspur
- Junegrass
- Pale poppy mallow
- Prairie cinquefoil
- Rocky mountain bee plant
We’ve been able to maintain healthy nursery beds of nearly every species we’ve tried. Being able to
keep the plants watered, of course, makes a big difference. Our seed harvest from nursery species has
become very important in terms of filling out our overall annual seed mixtures. Because of the work
involved in maintaining nursery beds (watering, weeding, etc.) we have to be judicious about the
number of species we put in the nursery. To maximize the value of the nursery, we have eliminated
beds of species for which we can dependably harvest seed from the wild, and have focused on species
for which wild harvest is more difficult.
6
We also moved a couple hundred violet (Viola sororia) plants from remnant prairies into restored
prairies. Survival of those plants was about 50% - much higher and more effective than trying to harvest
seeds from wild populations, grow them into seedlings in the greenhouse (takes at least two years) and
then transplanting (with low survival). Violets are a particular priority for us because they are the sole
larval host plant for regal fritillaries, yet our restored prairies have few violets. Once established, the
species spreads readily – we just have to get them started.
However, seedling additions to prairies have met with mixed success. One of the difficulties is that it
can be hard to predict where individual plants will survive. Especially in alluvial soils, finding microsites
appropriate for each prairie plant species (especially when we know very little about their requirements)
is difficult. In most case, overseeding is a more efficient means for us to introduce new plants because
we can broadcast large numbers of seeds and have a better chance of hitting appropriate locations for
each species. Of course, one reason overseeding makes sense for us is that we are set up well for
harvesting our own seeds, greatly decreasing the cost. If we were buying seed, overseeding would be
much more risky, and might not be worth the cost. In that case, seedling plugs might be worth a try, but
we would want to provide more care (repeated watering, for example). If enhancing prairie diversity is
a real priority for a landowner or land management entity, our strong recommendation would be to
invest in the capacity needed to harvest seed from priority species and overseed at high rates. (more on
this below under Management Recommendations)
Floristic Quality Analysis
Changes in the floristic quality of prairies were assessed with a plotwise method (see Appendix B) that
involved data collection from approximately 100 1m2 plots per site per year. Floristic quality and plant
species richness was calculated within each plot and then averaged across the site. Those averages, and
accompanying standard deviations, allowed us to compare sites over time.
To date, plotwise floristic quality assessment does not allow us to effectively measure results of
overseeding efforts because the sampling plots are too scattered to pick up the relatively few new
plants that have established from seedings. Results from the most recent overseedings, with higher
seeding rates, should be picked up more readily in future years, especially as we continue to seed more
acres at those higher seeding rates. However, even without seeing the impacts of overseeding, we have
been able to track changes in floristic quality and small-scale plant species richness.
Appendix B shows data from both remnant (unplowed) and restored (converted cropfield) prairies.
There is a consistent trend in restored prairies, in which floristic quality increases during the early years
of establishment and then levels off at some point. Interestingly, the number of years before floristic
quality varies considerably between sites, even when comparing sites seeded in the same year. The
pattern fits well with expectations that early weedy vegetation would be replaced over time with a more
perennial-dominated plant community. However, the stability of the eventual floristic quality level is
encouraging because it shows (so far) that our management is able to maintain the plant species and
species diversity achieved through high-diversity seedings.
7
The longest annual data set we have shows that a 1995 seeding has maintained its high floristic quality
through the 18th year of its existence. In that same prairie, two large grazing exclosures have been
compared with the rest of the site, which has been managed with patch-burn grazing since 2002. The
exclosures (burned only) are significantly lower in both mean floristic quality and plant species richness
than the burned/grazed areas. In 2013, we plan to incorporate those exclosures into patch-burn grazing
management and see whether or not they increase in floristic quality as a result.
In remnant prairies, there has been a consistent trend of increasing floristic quality over the last several
years. There was only one exception to that trend - a sandhills prairie that decreased between sampling
periods in 2002 and 2010. We will be sampling that site more frequently in the future to see whether or
not there is an actual downward trend. Apart from the sandhills prairie, most remnant prairies are
degraded remnants which are missing many conservative wildflower species and dominated by grasses
– particularly Kentucky bluegrass. Those degraded sites have been increasing in floristic quality mainly
as a result of increased frequency in native grass, sedge, and rush species, along with a few wildflower
species. In general, conservative wildflowers have not been increasing in frequency in those sites;
probably because there are few populations from which they can spread. These prairies are now being
overseeded, and those seeded areas appear to be diversifying nicely. More details on the approach
being taken with Kentucky bluegrass control and data on the results can be found here:
http://prairieecologist.com/2012/11/28/dealing-with-a-pervasive-invasive-kentucky-bluegrass-in-
prairies/
We have put numerous blog posts on the PrairieEcologist.com site that have incorporated results of
plotwise floristic quality sampling from our prairies. A few examples include:
http://prairieecologist.com/2011/11/14/trying-to-figure-out-what-we-did-right/
http://prairieecologist.com/2011/10/11/a-measure-of-ecological-resilience-in-a-restored-
reconstructed-prairie/
Despite consistent trends showing increasing floristic quality in remnants and stable floristic quality in
restored prairies, we are finding some warning signs that are causing us to tweak our fire/grazing
management. In particular, there are several plant species that seem never to survive a season
ungrazed, whether they are in the burned or unburned portion of our patch-burn grazed prairies. One
of those is sweet clover (Melilotus spp), an exotic legume that we are glad to see grazed intensively each
year. However, other species that are grazed annually include common and showy milkweeds (Asclepias
syriaca and A. speciosa), entire-leaf rosinweed (Silphium integrifolium), and Canada milkvetch
(Astragalus canadensis). In one quick evaluation, I looked at 150 milkweed plants in a particular
restored prairie. Of those plants, 83% of those in the burned portion had their flowers nipped off, and
57% of those in the unburned did. As the season wore on, the percentages rose, and I didn’t see any
seed pods by the fall. In exclosures and roadsides nearby, milkweed species are common and produce
numerous seed pods. Rosinweed and Canada milkvetch are both grazed pretty hard (leaves and stems)
for most of the season, though grazing intensity is less in unburned areas and under lighter stocking
8
rates. However, even under light stocking rates, the plants rarely flower, and when they do, they
produce few and small flowers.
During the last two years, we’ve started building large temporary exclosures within some of our grazed
prairies, using electric fence. In other sites, we’ve incorporated an entire year of no grazing into our
patch-burn grazing regime, and plan to rest those prairies every 2-4 years, depending upon the site. So
far (this work is being partially funded by another State Wildlife Grant) we are seeing strong blooming by
rosinweed, milkvetch, and milkweeds in those exclosures. It will be interesting to see whether or not we
can pick up changes in their frequency through our plotwise floristic quality sampling efforts as a result
of the exclosures. Regardless, for these three species – and likely others – periodic rest from grazing
appears to be important. (see Management Recommendations below)
Impacts on Rare Butterflies
Comprehensive butterfly species surveys were conducted along twenty two 200m transects in 2010. All
butterfly species observed were recorded, along with their activity type (nectaring, flying, basking, etc.)
Any nectaring activity was noted, along with the plant species visited. The transects covered both
restored and remnant prairies, as well as the full range of habitat conditions found within patch-burn
grazing (e.g. this year’s burn, last year’s burn, unburned). In addition to the transect surveys,
opportunistic sampling was conducted throughout 2010-2012 to search for rare or at-risk butterfly
species. No at-risk or rare butterflies were found other than regal fritillaries, so after the 2010 season,
we focused solely on regal fritillaries in our transects in order to collect the best data we could on that
species. (Opportunistic sampling for other butterflies continued through all three years.)
No rare butterfly species were seen in the Platte River prairies during the summer of 2010 – inside or
outside of transects. We found a total of 23 butterfly species through all sampling efforts. Of those 23
species, 19 were found in remnant prairies, and 18 were found in restored prairie. In 2010, the most
abundant species seen were orange sulphurs, followed by regal fritillaries, which were apparently
having a good year throughout much of the Midwest. Orange sulphurs did not appear to be correlated
with habitat structure, but regal fritillary observations were strongly correlated with unburned/ungrazed
portions of prairies during late June and early July.
Species richness was not particularly high at any site. The highest number of butterfly species seen
within a 200m transect was 7 and there didn’t appear to be a particular habitat type (restored or
remnant prairie) or management result (burned/unburned, grazed/ungrazed) that correlated with
species richness. A few species showed preferences to certain site types, but the majority were not
seen often enough to establish patterns. Eastern tailed blue butterflies were much more abundant in
restored prairies than remnant prairies – perhaps because of their preference for legumes as larval host
plants. Sachems and common checkered found mostly in remnants (11 of 12 sachems, 9 of 13 skippers).
Painted ladies were only found in two prairies (one restored and one remnant).
9
Butterfly nectaring was seen on a wide variety of plant species, but hoary vervain (Verbena stricta) was,
by far, the most used nectar plant by butterflies in general (see graphs in Appendix C). This is a plant
species that is generally considered a pasture weed because it is not palatable to cattle and thrives in
heavily grazed areas. However, it is a native prairie wildflower, and appears to be of great value to
butterflies.
We focused most of our data collection effort on regal fritillary butterflies because of their status as an
at-risk species and their abundance in our prairies. Those surveys were conducted repeatedly during
each summer along 300m transects (see Appendix C for maps showing those transect locations and
additional descriptions of methods). There were two overwhelming lessons learned from that work.
1. The number of regal fritillaries produced in our Platte River Prairies is primarily tied to two factors:
violets and thatch. During the spring, when adults are first emerging from their chrysalises, butterfly
abundance is highest in degraded remnant (unplowed) prairies that have few showy native wildflower
species, but lots of common blue violets (Viola sororia). While they don’t have much to excite a prairie
botanist, these prairies sure produce a lot of regal fritillaries. We don’t find many regals in recently
burned portions of these prairies – only in portions that have built up some thatch.
2. After regals emerge and mate in those thatchy violet-rich prairies, they spread out into more flowery
sites to feed. In our Platte River Prairies, those feeding sites tend to be restored (reconstructed) prairies
located around and between those degraded remnants. Those restored prairies have significantly fewer
violets than remnant prairies, but lots of the favorite nectar flowers for regals, including hoary vervain
(Verbena stricta), milkweeds (Asclepias spp.), wild bergamot (Monarda fistulosa), and thistles (Cirsium
and Carduus spp.). Interestingly, while we don’t see regals emerging from recently burned prairie, some
of the most-used summer nectaring sites are our most recently burned sites.
Providing both degraded remnant prairie habitat with lots of violets (for larval habitat) and restored
prairie with lots of nectar flower species appears to be a good mixture for regal fritillaries. Remnant and
restored prairies seem to complement each other in terms of the resources they provide. Over time, we
hope to improve the nectar flower diversity in remnants and the abundance of violets in restored
prairie, but for now having both prairie types near each other seems to be sufficient.
We were hoping to gather data on the oviposition (egg-laying) locations of regal fritillaries, but were
unable to do so because of the very low numbers of regal fritillaries found during oviposition (late
summer and early fall). One of our concerns is that we may be luring regal females out of flower-poor
but violet-rich remnant prairies into flower-rich, violet-poor prairies during oviposition. We were unable
10
to pick up enough samples along our transects to compare the relative use of the two prairie habitat
types.
Methods and additional data, including graphs and tables, can be found in Appendix C. In addition,
several blog posts were published in the Prairie Ecologist blog regarding the data we collected on
butterflies during this project. Links to those posts are below:
Response of regal fritillaries to Patch-Burn Grazing habitats:
http://prairieecologist.com/2012/11/13/regal-fritillary-butterflies-in-burned-and-grazed-prairie/
Summary of 2010-11 data on Regal Fritillaries: http://prairieecologist.com/2011/12/14/regal-fritillary-
butterflies-in-the-platte-river-prairies-2011/
Nectaring observations for all butterfly species from 2010: http://prairieecologist.com/2011/01/25/the-
importance-of-weedy-flowers-for-butterflies/
11
Management Recommendations
In general, we are seeing positive results from our patch-burn grazing management of both restored and
remnant prairies. We are careful not to use the same exact burn units repeatedly, and instead burn
whichever portion of each prairie is the most thatchy each year. We feel this helps prevent potential
negative impacts from using the same boundaries each year, such as changes in plant community
because of repeatedly mowing firebreaks in the same places, or encroachment of shrubs or other
species along edges. In addition, we want to avoid any kind of predictable repetitive management
system that favors some species (plant or animal) over others, so we try to shake up the season of fire,
grazing stocking rates, and percentage of the units burned – in addition to location of burn units – as
much as possible to avoid that repetition. We set stocking rates annually (in the fall), based mostly on
two things: 1) Evaluation of grazing impacts from the previous couple of years, and 2) Precipitation
levels during the previous year (we can’t predict next year’s rainfall, but we can compensate for this
year’s).
Invasive grasses
Most of our remnant prairies have degraded plant communities that are dominated by grasses,
especially Kentucky bluegrass and smooth brome. We are able to manage against bluegrass and brome,
through early intensive grazing and late spring burns, and shift the vegetative community to one more
dominated by native warm-season grasses. However, while that gives us some gains in plant diversity,
in some ways it is just exchanging one set of dominant grasses for another. By keeping cattle in the
pasture through the summer – albeit at sometimes lower stocking rates – we can suppress warm-season
grasses as well, allowing wildflowers (including those we overseed into the site) a chance to grow
without strong competition from grasses of any species. We are careful not to repeat treatments that
specifically target spring grasses for very many seasons in a row because we have a number of native
sedges, cool-season grasses, and spring wildflowers that are important components of prairies, and we
don’t want to manage too intensively against them. For more information on the approach we take
with Kentucky bluegrass control, and data showing the results, you can look at this blog post:
http://prairieecologist.com/2012/11/28/dealing-with-a-pervasive-invasive-kentucky-bluegrass-in-
prairies/
Pollinators
In the last several years, we have focused more on pollinators, their importance to prairie ecosystems,
and their responses to management. Through this grant-funded project, we looked closely at butterflies
– especially regal fritillaries – but we have also been collecting data on bees, and thinking about impacts
of management on them. Both butterflies and bees, of course, rely on nectar sources for much of the
season. A major difference between them, though, is that bees are tied to a nest site, while butterflies
can roam widely in search of food. Most bee species can not forage further than ¼ mile from their nest
(much less for some species), which means that management can have significant impacts on bees if
large blocks of habitat are denuded of flowers all at once, through haying, burning, or intensive grazing.
Determining how to use this information to design management treatments for such regimes as patch-
12
burn grazing is something we’re still working on, but it seems likely that several smaller burn patches
may be better than a single large one, when that is a possibility.
Fortunately, the most commonly used flower species for butterflies in our prairies is hoary vervain
(Verbena stricta), which can be very abundant even in intensively grazed sites. It is the most visited
nectar plant species for regal fritillary butterflies, but also for the larger community of butterflies.
Commonly dismissed (and sometimes sprayed) by many private landowners as a pasture weed, this
plant provides extremely important resources for butterflies. It is most abundant in prairies that are
disturbed through grazing because it is non-palatable to cattle and can spread quickly by seed in
weakened grasslands. It subsequently declines quickly as grass vigor increases. Other important nectar
plants for butterflies include milkweeds, thistles (native and non-native), and wild bergamot. Butterflies
tend to be fairly generalist in habitat in terms of which kinds of flowers they nectar from, but many bee
species are more specialized. Plant species such as purple prairie clover are particularly attractive
numerous bee species, but bee diversity also relies on having the plant species that each specialist bee
relies on for food.
Encouraging plant diversity, as well as abundant flowering of each species, is an important management
goal for both bees and butterflies. When designing management strategies, it’s important to consider
not only long-term opportunities for plant species to flower (incorporating periodic intensive grazing for
hoary vervain, as an example), but also spreading those management treatments across the landscape
so that there are multiple management units available for pollinators to choose from at any one time.
As mentioned earlier, the scale of those management treatments is important as well. For example,
intensive grazing can be beneficial in terms of favoring hoary vervain, but a bee species that relies on
prairie clovers may not be able to find sufficient nectaring opportunities in a large block of intensively
grazed prairie. Ensuring that management blocks containing abundant prairie clover (and other plant
species) within a reasonable distance of each other is an important consideration.
Grazing Exclosures
On the subject of encouraging plant diversity, we’re beginning to find that complete rest from grazing is
important for some plant species. Milkweeds, for example, are rarely allowed to bloom and produce
seed in prairies where we have even light grazing stocking rates. Rosinweed and Canada milkvetch are
also prone to repeated grazing, even in unburned portions of patch-burn grazed pastures. We are
beginning to incorporate large “moving window” temporary exclosures (with electric fence) into some
patch-burn grazed prairies, and years of complete rest for other prairies. The temporary exclosures are
moved each year, so that every part of the prairie will get a year of rest over time. It is easy to see
differences between grazed areas and adjacent exclosures in terms of the vigor and blooming
abundance of the above plant species, even after just a single year of grazing exclusion. Without that
grazing exclusion, these plants would like gradually disappear from many of our prairies because they
would cumulatively lose vigor year after year, without being able to complete their growth cycle
periodically. We assume that there are other plant species, as well as animal species, that also benefit
from this kind of periodic complete rest.
13
Overseeding and Seedling Plugs
During the period of this grant, we overseeded both restored and remnant prairies, but focused largely
on degraded restored prairies that are missing many wildflower (forb) species. We have had good luck
broadcast seeding immediately after both early and late spring burns in patch-burn grazed prairies. We
have not seen any patterns that indicate that earlier seedings are more successful. However, seeding
rate is very important. So far, the more seed we broadcast, the more plants establish, even with
seeding rates up to 8 gallons of rough-cleaned forb seed/acre – which is 8 times what we use in
cropfield seedings. Focusing on smaller areas with more seed appears to be the best option for
increasing the plant diversity of these degraded sites.
Seedling plugs have been successful in some situations – particularly in terms of getting wetland sedge
species established in restored wetlands. We have found that most prairie plants are easily grown in
greenhouse situations (with some exceptions) but that some take more than a year to germinate, and
then perhaps a full year or more to grow large enough to transplant. When growing native plants in a
greenhouse, it pays to be patient and not discard pots that haven’t germinated after the first several
months. Holding them, and continuing to water them periodically, as long as a full year (allowing them
to freeze in the winter), often leads to eventual germination.
The downsides of seedlings are that they can take a lot of time and infrastructure to grow, and success
in mesic prairie transplants is mixed at best. We only watered plants at the time of initial transplant, so
success could be improved with repeated waterings, but that becomes even more time intensive. In
addition, finding appropriate sites for seedlings of various species can be more challenging than it might
seem. At least in our alluvial soils, it seems that some plants – especially those that are rare enough that
we’re trying to increase populations – are pretty picky about microsite habitats. It might make sense to
focus seedling transplants around small existing populations because it’s likely that the microhabitat is
appropriate nearby. On the other hand, it seems beneficial to create new populations as well as expand
current ones. In that vein, we tried to plant groups of plants (5-8 or more in any location) to establish
populations that would attract pollinators and facilitate cross-pollination more effectively than a single
plant.
In general, our experience is showing us that overseeding is a cheaper and more efficient way for us to
increase the abundance of most plant species. Even though most seeds don’t turn into new plants, high
seedings rates mean that there is a good chance of getting at least some of each species planted into
locations where they can establish. Exceptions to the generalization that seeding is better than
seedlings include violets and wetland sedges. We have found that harvesting seed from violets is very
time consuming and they are slow to grow to mature seedlings. Because we have very abundant
populations of violets in our remnant prairies, we have had good luck digging and transplanting bare-
root plants of violets from remnants to restored prairies where violets are rare. We are attempting the
same technique with an upland sedge (Carex heliophila) as well, because it makes few seeds, and we
have not been able to get it to germinate in the greenhouse. The tiny size of the plants, however, has
made it difficult to see whether or not our transplants have survived so far. We hope to see populations

14
developing over time in transplant areas so we can see if our work has paid off. Wetland sedges
certainly transplant well, and high survival rates can make that strategy worthwhile.
Of course, one big reason it’s cheaper in our case is that we have existing capacity for large-scale seed
harvest. We would recommend that if enhancement of degraded prairies is a high priority for a
landowner or land management entity, they should invest in building seed harvest capacity. That
doesn’t necessarily mean large investments in equipment or people, though a pull-behind seed stripper,
for example, can be a nice way to harvest large amounts of seed quickly. More information on seed
harvest techniques and equipment needs can be found here:
http://prairienebraska.files.wordpress.com/2011/01/restoration-manual.pdf
15
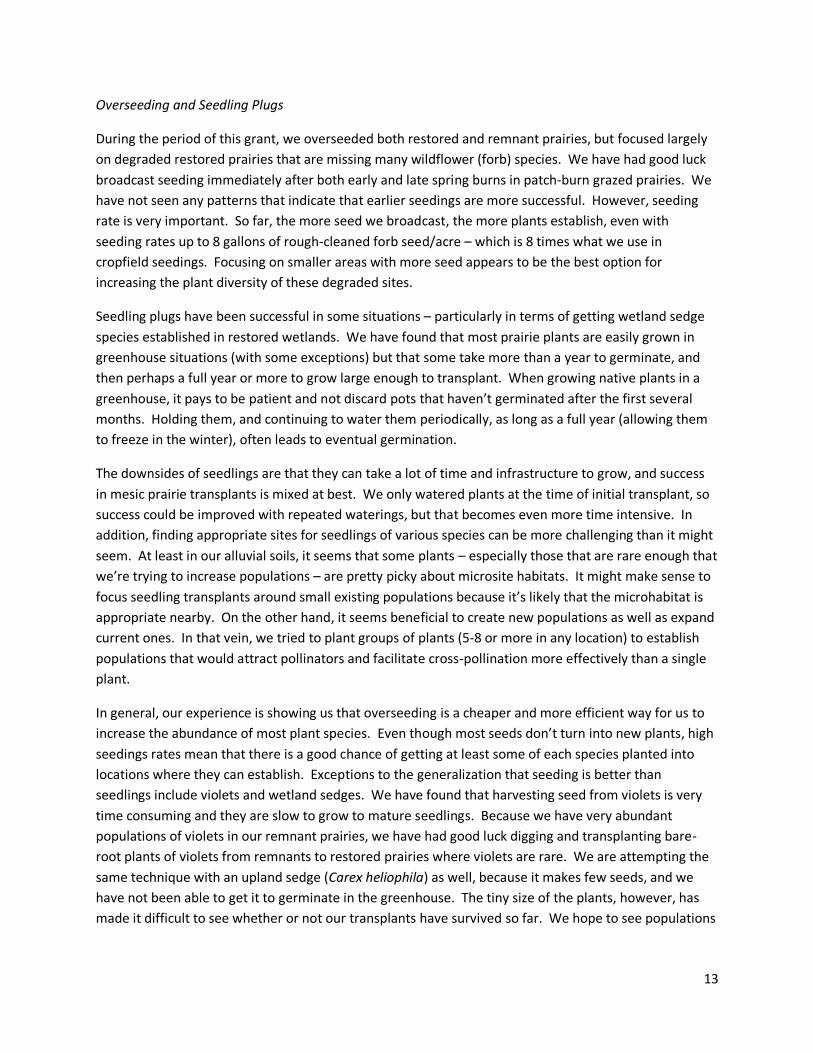
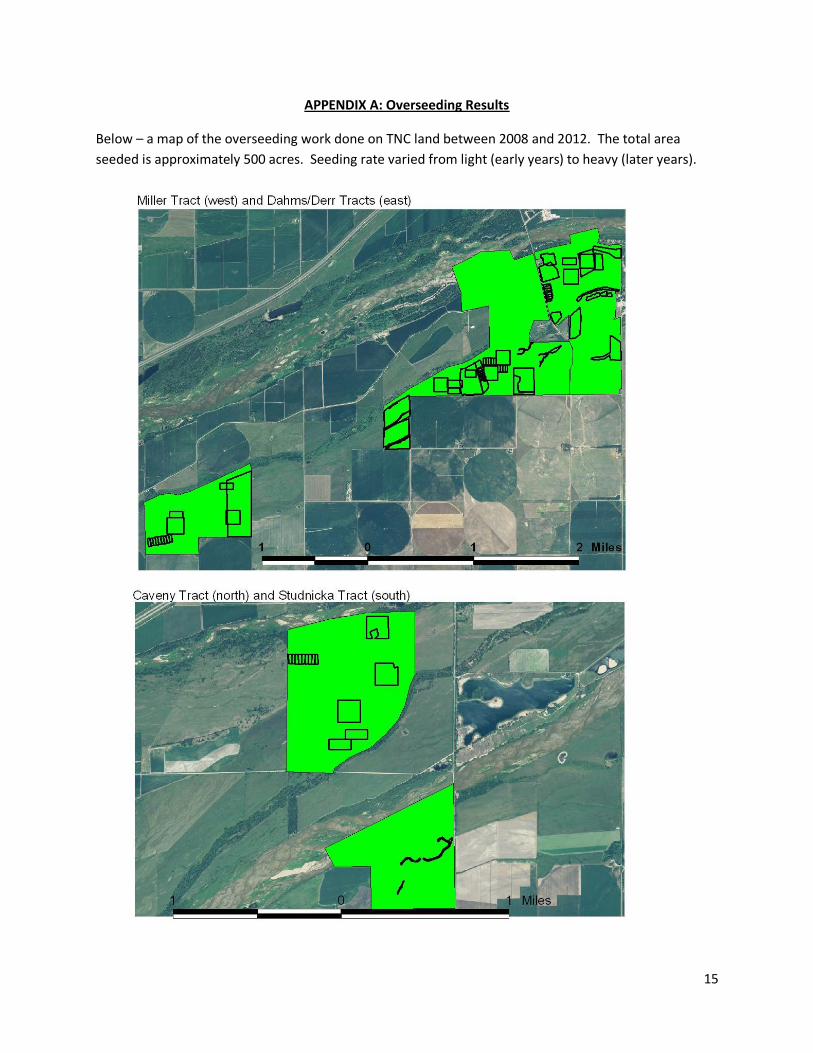
APPENDIX A: Overseeding Results
Below – a map of the overseeding work done on TNC land between 2008 and 2012. The total area
seeded is approximately 500 acres. Seeding rate varied from light (early years) to heavy (later years).
16
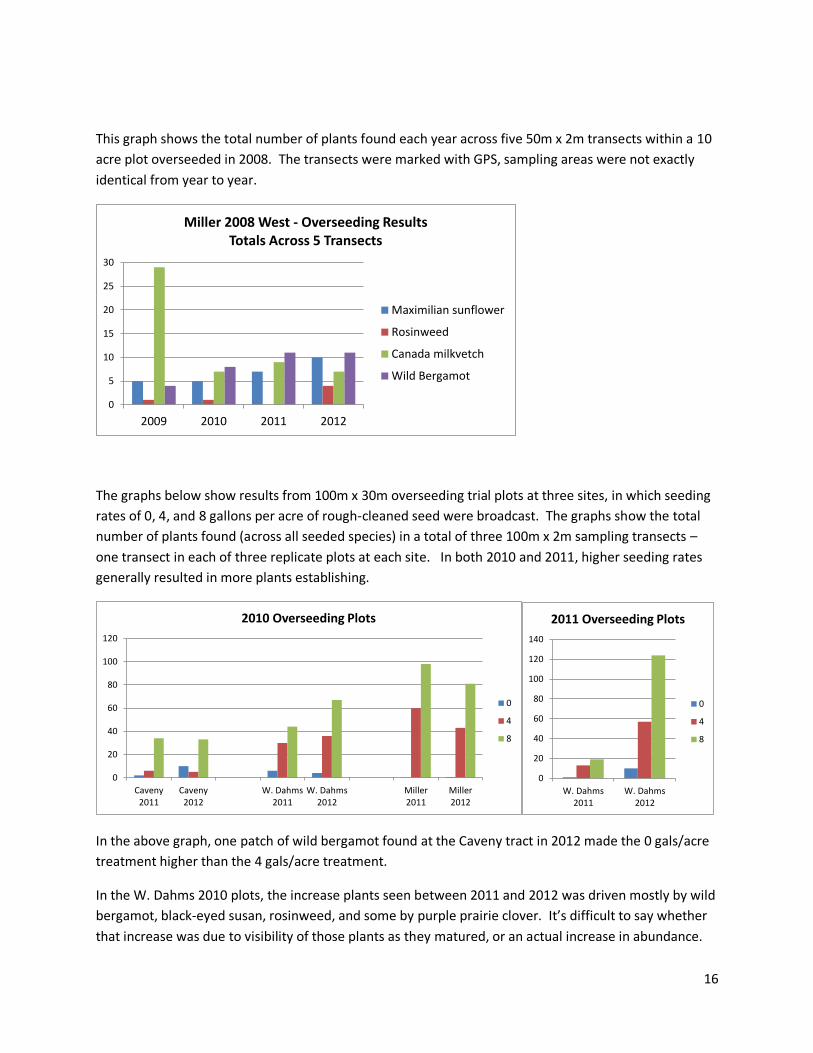
This graph shows the total number of plants found each year across five 50m x 2m transects within a 10
acre plot overseeded in 2008. The transects were marked with GPS, sampling areas were not exactly
identical from year to year.
The graphs below show results from 100m x 30m overseeding trial plots at three sites, in which seeding
rates of 0, 4, and 8 gallons per acre of rough-cleaned seed were broadcast. The graphs show the total
number of plants found (across all seeded species) in a total of three 100m x 2m sampling transects –
one transect in each of three replicate plots at each site. In both 2010 and 2011, higher seeding rates
generally resulted in more plants establishing.
In the above graph, one patch of wild bergamot found at the Caveny tract in 2012 made the 0 gals/acre
treatment higher than the 4 gals/acre treatment.
In the W. Dahms 2010 plots, the increase plants seen between 2011 and 2012 was driven mostly by wild
bergamot, black-eyed susan, rosinweed, and some by purple prairie clover. It’s difficult to say whether
that increase was due to visibility of those plants as they matured, or an actual increase in abundance.
0
5
10
15
20
25
30
2009 2010 2011 2012
Miller 2008 West - Overseeding ResultsTotals Across 5 Transects
Maximilian sunflower
Rosinweed
Canada milkvetch
Wild Bergamot
0
20
40
60
80
100
120
Caveny2011
Caveny2012
W. Dahms2011
W. Dahms2012
Miller2011
Miller2012
2010 Overseeding Plots
0
4
8
0
20
40
60
80
100
120
140
W. Dahms2011
W. Dahms2012
2011 Overseeding Plots
0
4
8

17
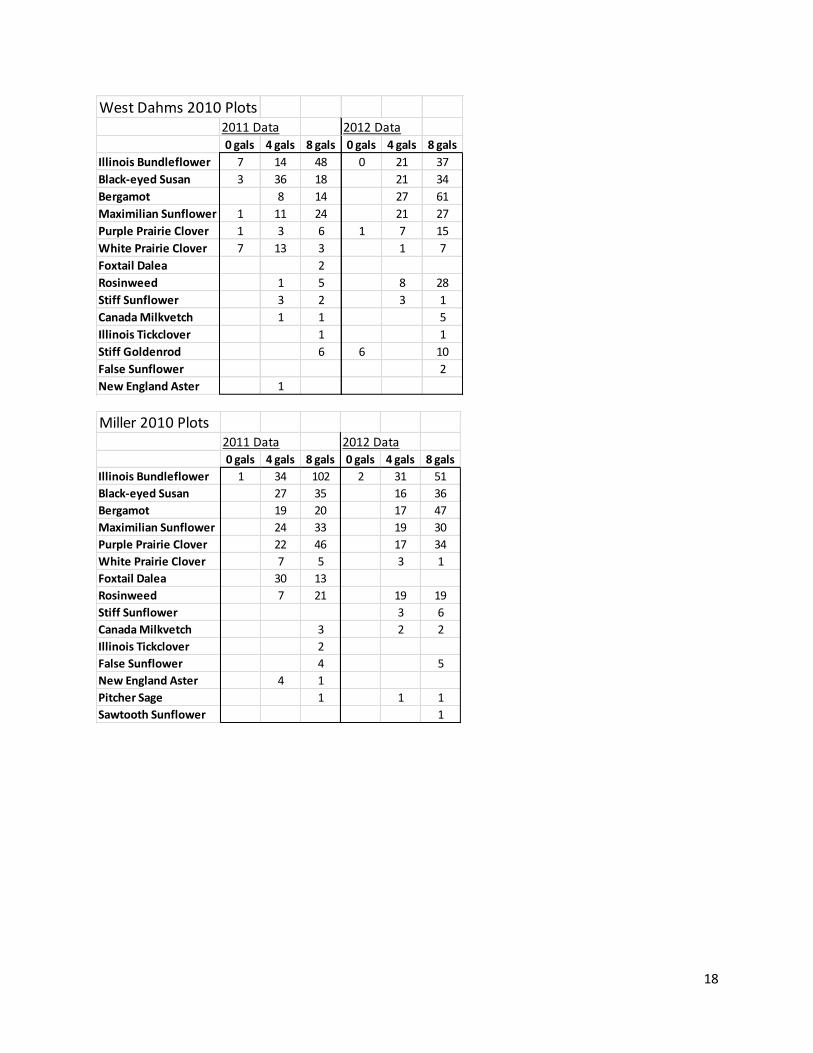
At the Miller tract, the number of plants in the 2010 plots decreased between 2011 and 2012, but that
was driven largely by two species; Illinois bundleflower and foxtail dalea. The foxtail dalea drop off was
likely because it is an annual plant that germinated less well in 2012 because of lower light conditions as
vegetation recovered.
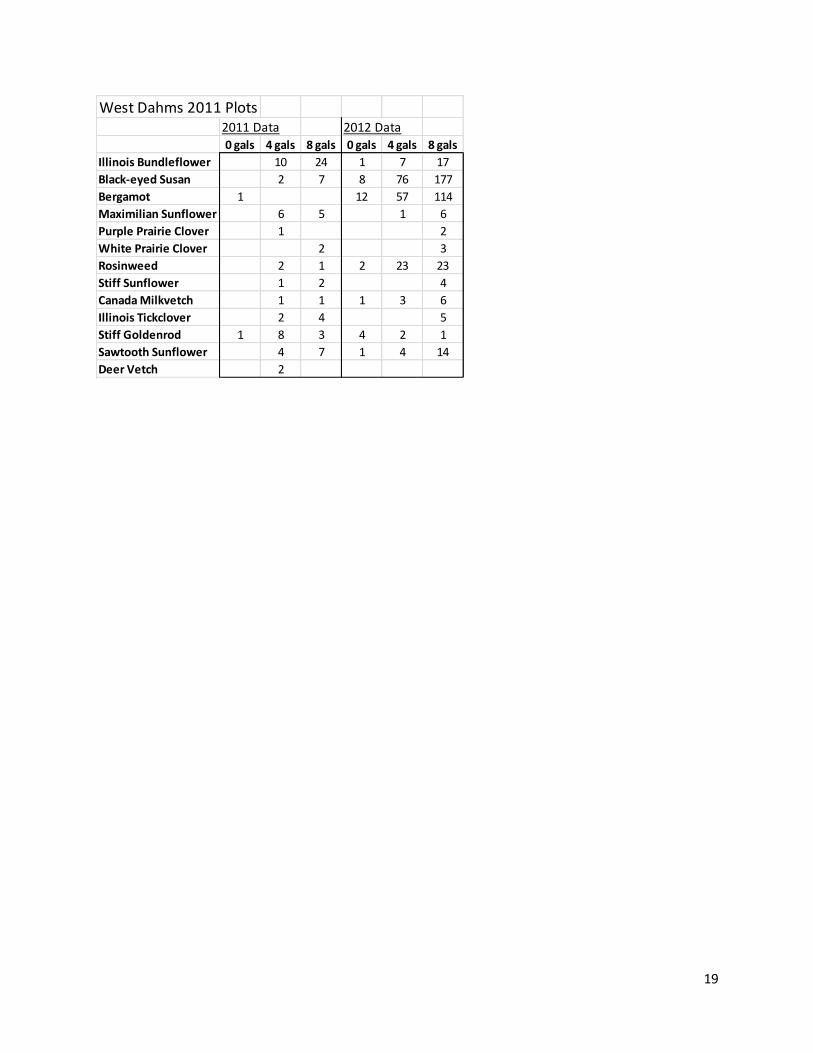
The data from the W. Dahms 2011 seeding show a dramatic increase between 2011 and 2012, but that
is most likely due to sampling in 2011 being the first growing season, at which time it is difficult to see
many of the new plants – and because some likely didn’t germinate until late in the 2011 season.
The four tables below show detailed establishment data from the sites overseeded in 2010 and 2011. In
each table, the total number of plants found within each of the treatments is a total from three 100m x
2m transects (one sampling transect from each of three 100m x 30m seeding plots per treatment ). It is
interesting to note the differences in the plant species that established well between the various sites.
For example, Illinois bundleflower established strongly at West Dahms and Miller in 2010, but hardly at
all at Caveny in the same year, and minimally at West Dahms in 2011. While there was variation
between sites and years, however, establishment of all species was generally higher at higher seeding
rates, and the number of established species also increased with seeding rate.
Caveny N 2010 Plots2011 Data 2012 Data0 gals 4 gals 8 gals 0 gals 4 gals 8 gals
Illinois Bundleflower 4 2
Black-eyed Susan 13 28 1 3 15
Bergamot 1 3 47 23 10 139
Maximilian Sunflower 1
Purple Prairie Clover 1 1 1 4
White Prairie Clover 3 7 4
Rosinweed 1 2 1 1 5
Stiff Sunflower 2
Canada Milkvetch 5
Illinois Tickclover 2 4 6
Stiff Goldenrod 1
False Sunflower 2
18
West Dahms 2010 Plots2011 Data 2012 Data0 gals 4 gals 8 gals 0 gals 4 gals 8 gals
Illinois Bundleflower 7 14 48 0 21 37
Black-eyed Susan 3 36 18 21 34
Bergamot 8 14 27 61
Maximilian Sunflower 1 11 24 21 27
Purple Prairie Clover 1 3 6 1 7 15
White Prairie Clover 7 13 3 1 7
Foxtail Dalea 2
Rosinweed 1 5 8 28
Stiff Sunflower 3 2 3 1
Canada Milkvetch 1 1 5
Illinois Tickclover 1 1
Stiff Goldenrod 6 6 10
False Sunflower 2
New England Aster 1
Miller 2010 Plots2011 Data 2012 Data
0 gals 4 gals 8 gals 0 gals 4 gals 8 gals
Illinois Bundleflower 1 34 102 2 31 51
Black-eyed Susan 27 35 16 36
Bergamot 19 20 17 47
Maximilian Sunflower 24 33 19 30
Purple Prairie Clover 22 46 17 34
White Prairie Clover 7 5 3 1
Foxtail Dalea 30 13
Rosinweed 7 21 19 19
Stiff Sunflower 3 6
Canada Milkvetch 3 2 2
Illinois Tickclover 2
False Sunflower 4 5
New England Aster 4 1
Pitcher Sage 1 1 1
Sawtooth Sunflower 1
19
West Dahms 2011 Plots2011 Data 2012 Data
0 gals 4 gals 8 gals 0 gals 4 gals 8 gals
Illinois Bundleflower 10 24 1 7 17
Black-eyed Susan 2 7 8 76 177
Bergamot 1 12 57 114
Maximilian Sunflower 6 5 1 6
Purple Prairie Clover 1 2
White Prairie Clover 2 3
Rosinweed 2 1 2 23 23
Stiff Sunflower 1 2 4
Canada Milkvetch 1 1 1 3 6
Illinois Tickclover 2 4 5
Stiff Goldenrod 1 8 3 4 2 1
Sawtooth Sunflower 4 7 1 4 14
Deer Vetch 2
20
APPENDIX B: Impacts of Management on Prairie Communities
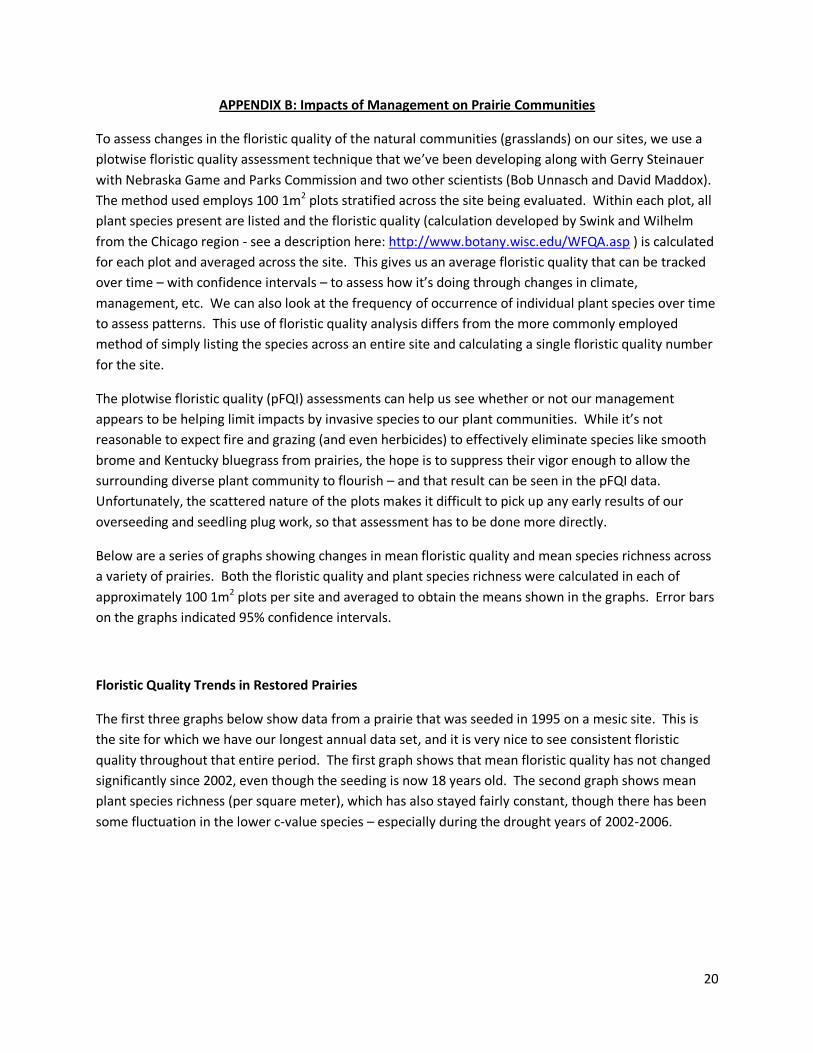
To assess changes in the floristic quality of the natural communities (grasslands) on our sites, we use a
plotwise floristic quality assessment technique that we’ve been developing along with Gerry Steinauer
with Nebraska Game and Parks Commission and two other scientists (Bob Unnasch and David Maddox).
The method used employs 100 1m2 plots stratified across the site being evaluated. Within each plot, all
plant species present are listed and the floristic quality (calculation developed by Swink and Wilhelm
from the Chicago region - see a description here: http://www.botany.wisc.edu/WFQA.asp ) is calculated
for each plot and averaged across the site. This gives us an average floristic quality that can be tracked
over time – with confidence intervals – to assess how it’s doing through changes in climate,
management, etc. We can also look at the frequency of occurrence of individual plant species over time
to assess patterns. This use of floristic quality analysis differs from the more commonly employed
method of simply listing the species across an entire site and calculating a single floristic quality number
for the site.
The plotwise floristic quality (pFQI) assessments can help us see whether or not our management
appears to be helping limit impacts by invasive species to our plant communities. While it’s not
reasonable to expect fire and grazing (and even herbicides) to effectively eliminate species like smooth
brome and Kentucky bluegrass from prairies, the hope is to suppress their vigor enough to allow the
surrounding diverse plant community to flourish – and that result can be seen in the pFQI data.
Unfortunately, the scattered nature of the plots makes it difficult to pick up any early results of our
overseeding and seedling plug work, so that assessment has to be done more directly.
Below are a series of graphs showing changes in mean floristic quality and mean species richness across
a variety of prairies. Both the floristic quality and plant species richness were calculated in each of
approximately 100 1m2 plots per site and averaged to obtain the means shown in the graphs. Error bars
on the graphs indicated 95% confidence intervals.
Floristic Quality Trends in Restored Prairies
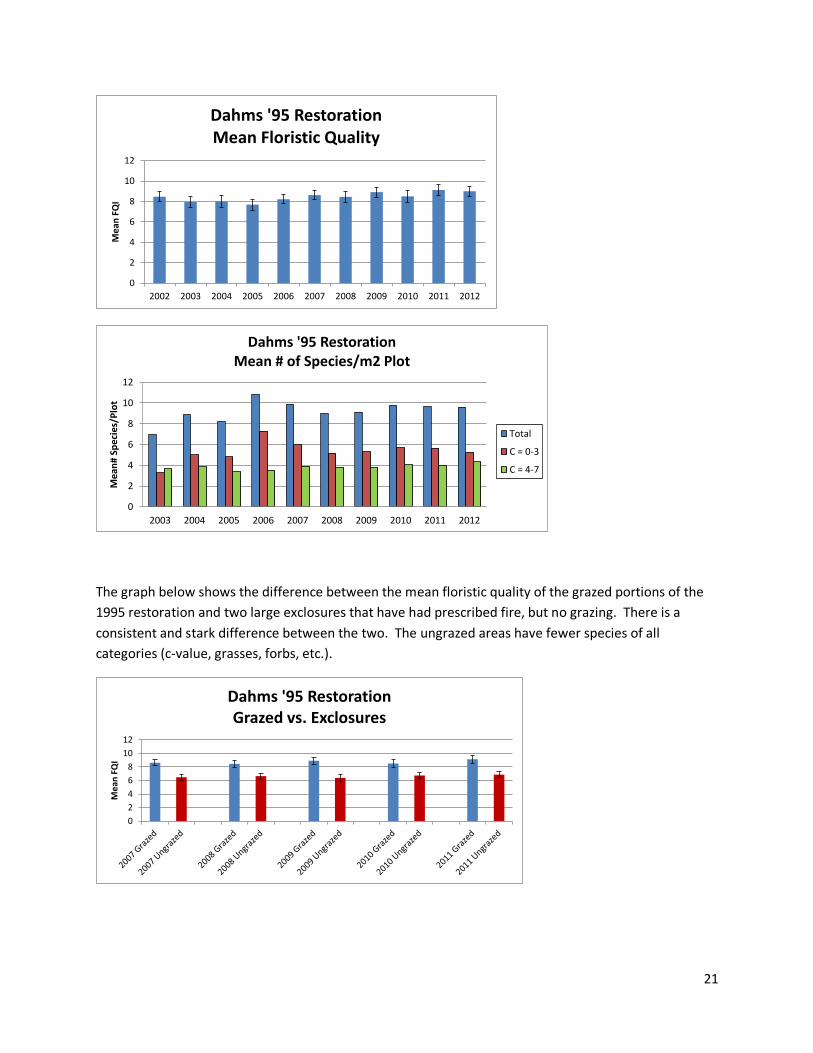
The first three graphs below show data from a prairie that was seeded in 1995 on a mesic site. This is
the site for which we have our longest annual data set, and it is very nice to see consistent floristic
quality throughout that entire period. The first graph shows that mean floristic quality has not changed
significantly since 2002, even though the seeding is now 18 years old. The second graph shows mean
plant species richness (per square meter), which has also stayed fairly constant, though there has been
some fluctuation in the lower c-value species – especially during the drought years of 2002-2006.
21
The graph below shows the difference between the mean floristic quality of the grazed portions of the
1995 restoration and two large exclosures that have had prescribed fire, but no grazing. There is a
consistent and stark difference between the two. The ungrazed areas have fewer species of all
categories (c-value, grasses, forbs, etc.).
0
2
4
6
8
10
12
2002 2003 2004 2005 2006 2007 2008 2009 2010 2011 2012
Me
an F
QI
Dahms '95 RestorationMean Floristic Quality
0
2
4
6
8
10
12
2003 2004 2005 2006 2007 2008 2009 2010 2011 2012
Mea
n#
Spec
ies/
Plo
t
Dahms '95 RestorationMean # of Species/m2 Plot
Total
C = 0-3
C = 4-7
0
2
4
6
8
10
12
Me
an F
QI
Dahms '95 RestorationGrazed vs. Exclosures
22
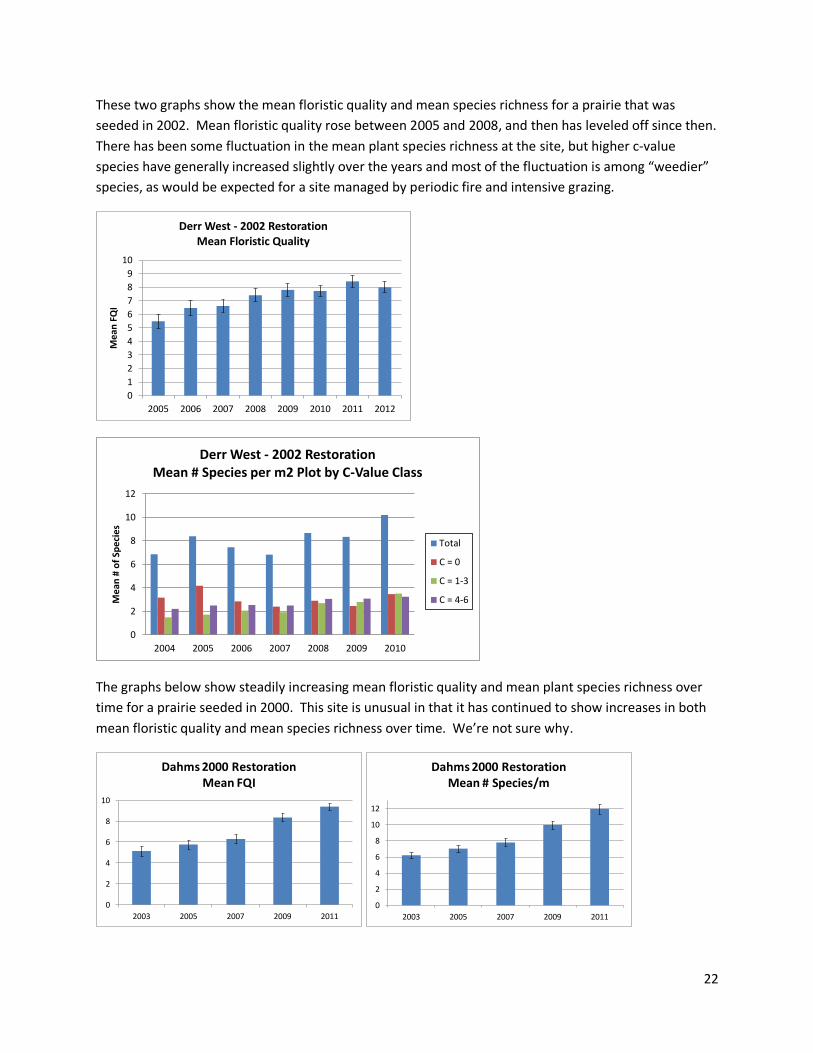
These two graphs show the mean floristic quality and mean species richness for a prairie that was
seeded in 2002. Mean floristic quality rose between 2005 and 2008, and then has leveled off since then.
There has been some fluctuation in the mean plant species richness at the site, but higher c-value
species have generally increased slightly over the years and most of the fluctuation is among “weedier”
species, as would be expected for a site managed by periodic fire and intensive grazing.
The graphs below show steadily increasing mean floristic quality and mean plant species richness over
time for a prairie seeded in 2000. This site is unusual in that it has continued to show increases in both
mean floristic quality and mean species richness over time. We’re not sure why.
0
1
2
3
4
5
6
7
8
9
10
2005 2006 2007 2008 2009 2010 2011 2012
Mea
n F
QI
Derr West - 2002 RestorationMean Floristic Quality
0
2
4
6
8
10
12
2004 2005 2006 2007 2008 2009 2010
Me
an #
of
Spe
cie
s
Derr West - 2002 RestorationMean # Species per m2 Plot by C-Value Class
Total
C = 0
C = 1-3
C = 4-6
0
2
4
6
8
10
2003 2005 2007 2009 2011
Dahms 2000 RestorationMean FQI
0
2
4
6
8
10
12
2003 2005 2007 2009 2011
Dahms 2000 RestorationMean # Species/m
23
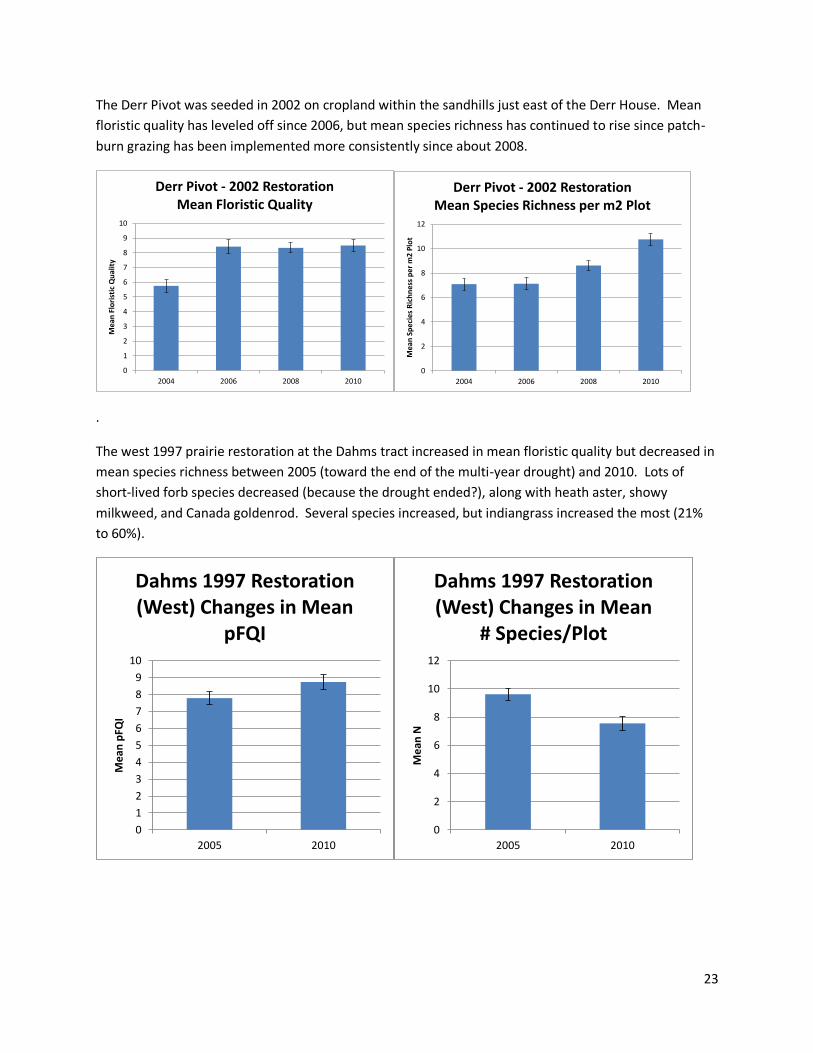
The Derr Pivot was seeded in 2002 on cropland within the sandhills just east of the Derr House. Mean
floristic quality has leveled off since 2006, but mean species richness has continued to rise since patch-
burn grazing has been implemented more consistently since about 2008.
.
The west 1997 prairie restoration at the Dahms tract increased in mean floristic quality but decreased in
mean species richness between 2005 (toward the end of the multi-year drought) and 2010. Lots of
short-lived forb species decreased (because the drought ended?), along with heath aster, showy
milkweed, and Canada goldenrod. Several species increased, but indiangrass increased the most (21%
to 60%).
0
1
2
3
4
5
6
7
8
9
10
2004 2006 2008 2010
Me
an F
lori
stic
Qu
alit
y
Derr Pivot - 2002 RestorationMean Floristic Quality
0
2
4
6
8
10
12
2004 2006 2008 2010
Me
an S
pe
cie
s R
ich
ne
ss p
er
m2
Plo
t
Derr Pivot - 2002 RestorationMean Species Richness per m2 Plot
0
1
2
3
4
5
6
7
8
9
10
2005 2010
Me
an p
FQI
Dahms 1997 Restoration (West) Changes in Mean
pFQI
0
2
4
6
8
10
12
2005 2010
Me
an N
Dahms 1997 Restoration (West) Changes in Mean
# Species/Plot
24
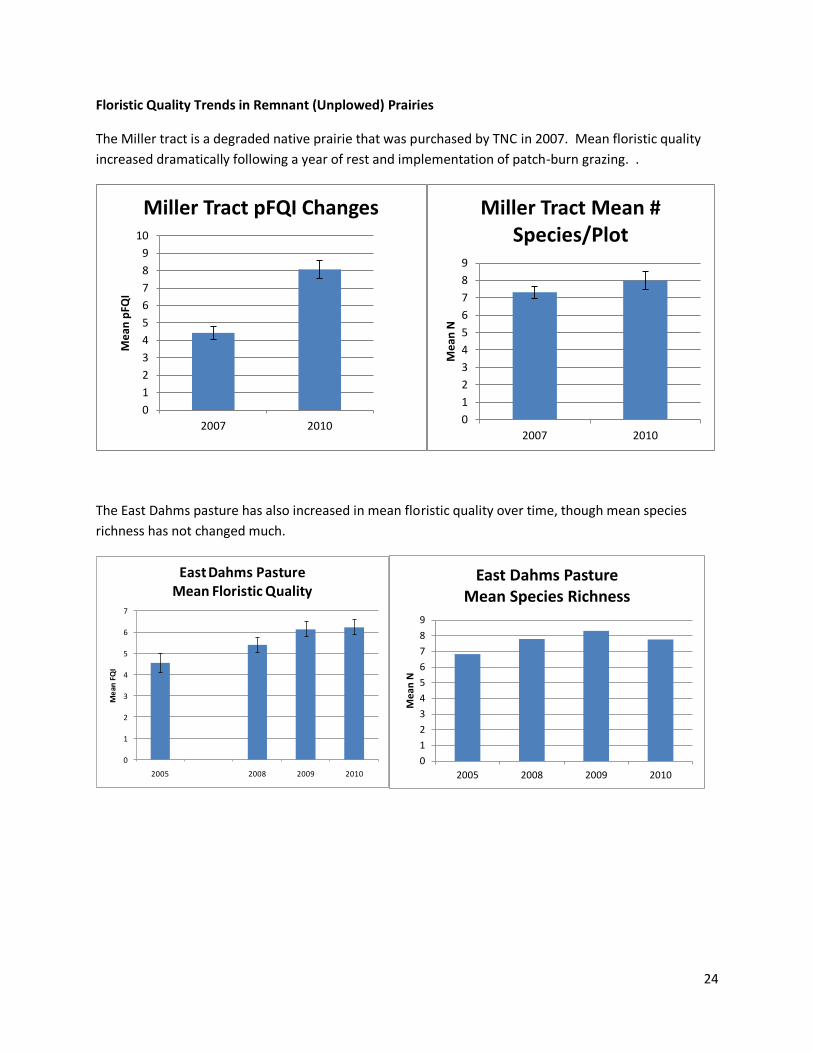
Floristic Quality Trends in Remnant (Unplowed) Prairies
The Miller tract is a degraded native prairie that was purchased by TNC in 2007. Mean floristic quality
increased dramatically following a year of rest and implementation of patch-burn grazing. .
The East Dahms pasture has also increased in mean floristic quality over time, though mean species
richness has not changed much.
0
1
2
3
4
5
6
7
8
9
10
2007 2010
Me
an p
FQI
Miller Tract pFQI Changes
0
1
2
3
4
5
6
7
8
9
2007 2010M
ean
N
Miller Tract Mean # Species/Plot
0
1
2
3
4
5
6
7
2005 2008 2009 2010
Me
an F
QI
East Dahms Pasture Mean Floristic Quality
0
1
2
3
4
5
6
7
8
9
2005 2008 2009 2010
Me
an N
East Dahms PastureMean Species Richness
25
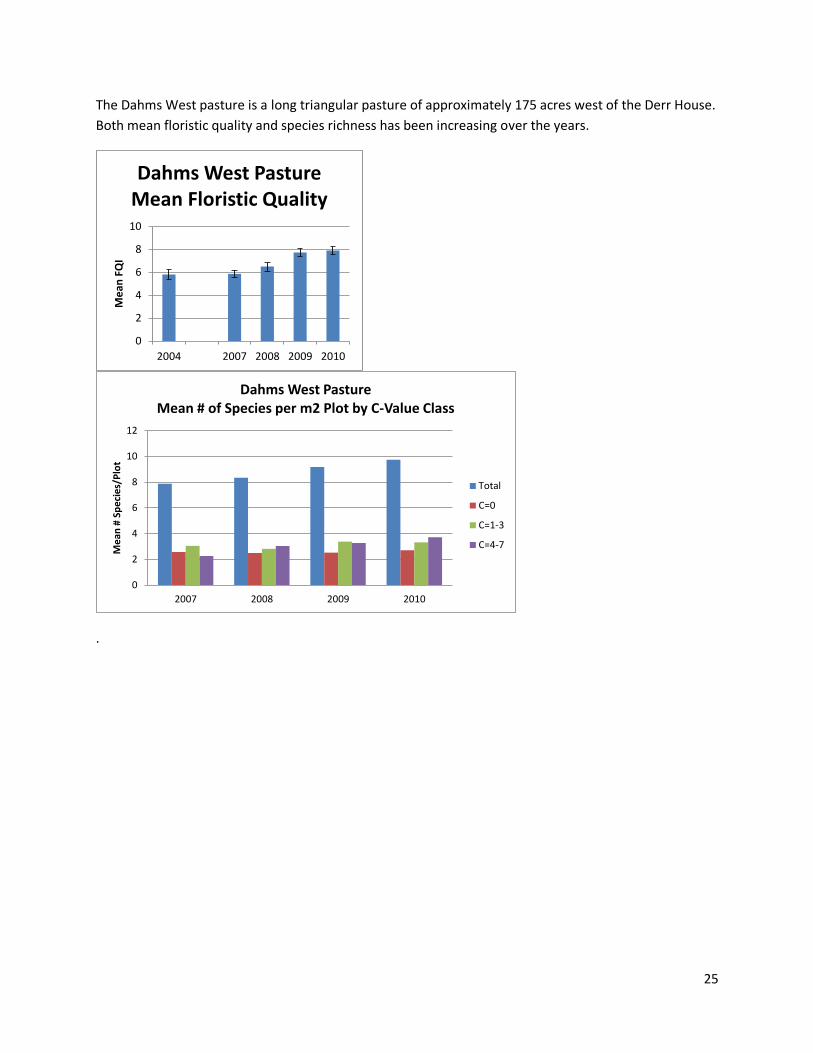
The Dahms West pasture is a long triangular pasture of approximately 175 acres west of the Derr House.
Both mean floristic quality and species richness has been increasing over the years.
.
0
2
4
6
8
10
2004 2007 2008 2009 2010
Me
an F
QI
Dahms West PastureMean Floristic Quality
0
2
4
6
8
10
12
2007 2008 2009 2010
Me
an #
Sp
eci
es/
Plo
t
Dahms West PastureMean # of Species per m2 Plot by C-Value Class
Total
C=0
C=1-3
C=4-7
26
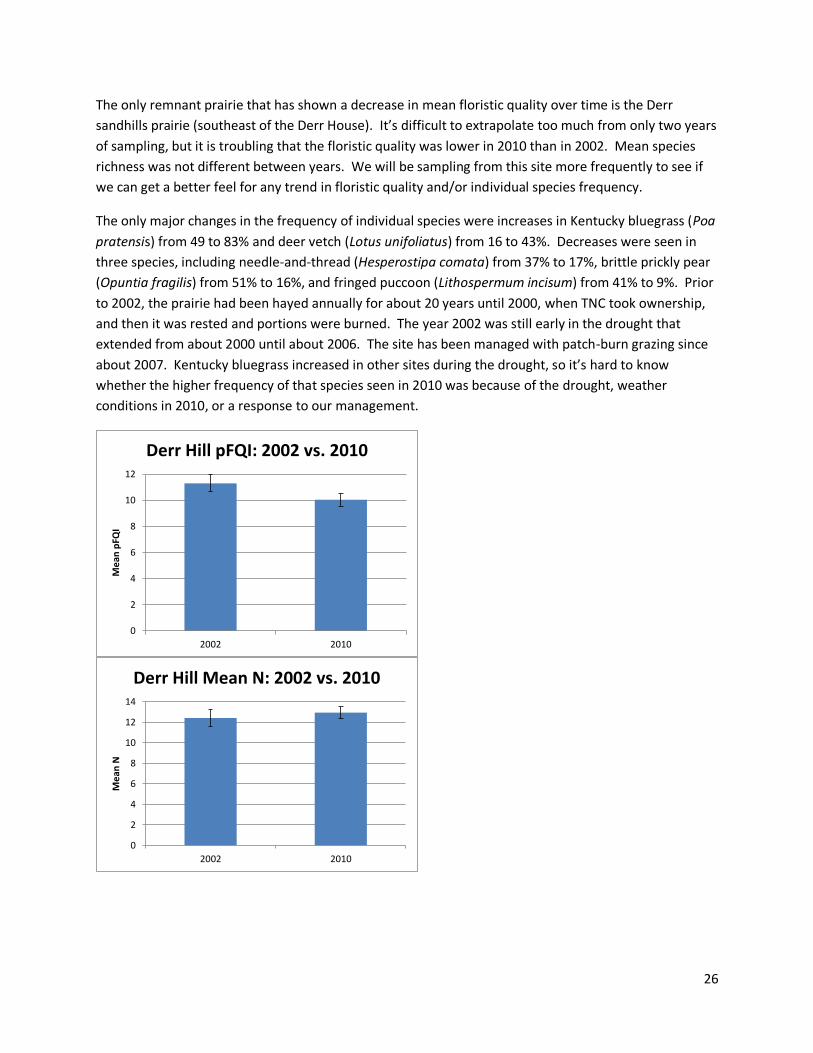
The only remnant prairie that has shown a decrease in mean floristic quality over time is the Derr
sandhills prairie (southeast of the Derr House). It’s difficult to extrapolate too much from only two years
of sampling, but it is troubling that the floristic quality was lower in 2010 than in 2002. Mean species
richness was not different between years. We will be sampling from this site more frequently to see if
we can get a better feel for any trend in floristic quality and/or individual species frequency.
The only major changes in the frequency of individual species were increases in Kentucky bluegrass (Poa
pratensis) from 49 to 83% and deer vetch (Lotus unifoliatus) from 16 to 43%. Decreases were seen in
three species, including needle-and-thread (Hesperostipa comata) from 37% to 17%, brittle prickly pear
(Opuntia fragilis) from 51% to 16%, and fringed puccoon (Lithospermum incisum) from 41% to 9%. Prior
to 2002, the prairie had been hayed annually for about 20 years until 2000, when TNC took ownership,
and then it was rested and portions were burned. The year 2002 was still early in the drought that
extended from about 2000 until about 2006. The site has been managed with patch-burn grazing since
about 2007. Kentucky bluegrass increased in other sites during the drought, so it’s hard to know
whether the higher frequency of that species seen in 2010 was because of the drought, weather
conditions in 2010, or a response to our management.
0
2
4
6
8
10
12
2002 2010
Me
an p
FQI
Derr Hill pFQI: 2002 vs. 2010
0
2
4
6
8
10
12
14
2002 2010
Me
an N
Derr Hill Mean N: 2002 vs. 2010
27
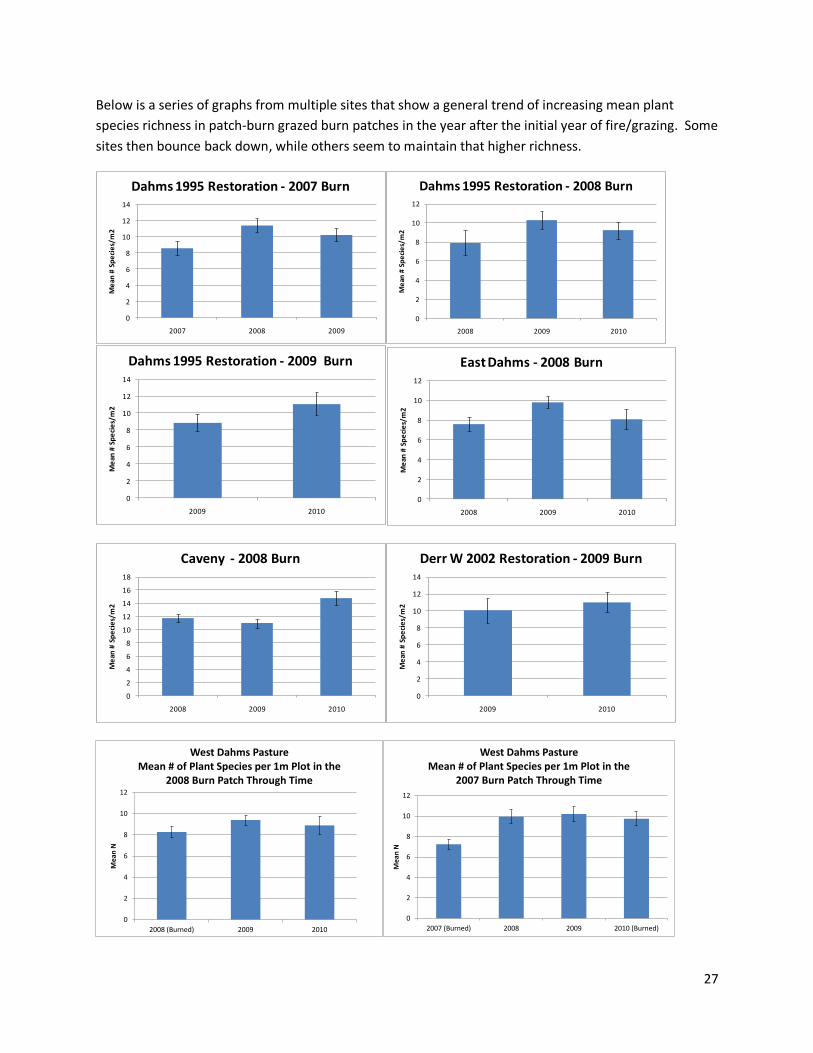
Below is a series of graphs from multiple sites that show a general trend of increasing mean plant
species richness in patch-burn grazed burn patches in the year after the initial year of fire/grazing. Some
sites then bounce back down, while others seem to maintain that higher richness.
0
2
4
6
8
10
12
14
2007 2008 2009
Me
an #
Sp
eci
es/
m2
Dahms 1995 Restoration - 2007 Burn
0
2
4
6
8
10
12
2008 2009 2010
Me
an #
Sp
eci
es/
m2
Dahms 1995 Restoration - 2008 Burn
0
2
4
6
8
10
12
14
2009 2010
Me
an #
Sp
eci
es/
m2
Dahms 1995 Restoration - 2009 Burn
0
2
4
6
8
10
12
2008 2009 2010
Me
an #
Sp
eci
es/
m2
East Dahms - 2008 Burn
0
2
4
6
8
10
12
14
16
18
2008 2009 2010
Me
an #
Sp
eci
es/
m2
Caveny - 2008 Burn
0
2
4
6
8
10
12
14
2009 2010
Me
an #
Sp
eci
es/
m2
Derr W 2002 Restoration - 2009 Burn
0
2
4
6
8
10
12
2008 (Burned) 2009 2010
Mea
n N
West Dahms PastureMean # of Plant Species per 1m Plot in the
2008 Burn Patch Through Time
0
2
4
6
8
10
12
2007 (Burned) 2008 2009 2010 (Burned)
Mea
n N
West Dahms PastureMean # of Plant Species per 1m Plot in the
2007 Burn Patch Through Time

28
APPENDIX C: Impacts of Prairie Restoration and Management on At-Risk Butterfly Species
Methods
Butterfly survey methods were adapted from those used by Dr. Ray Moranz of Iowa State (and
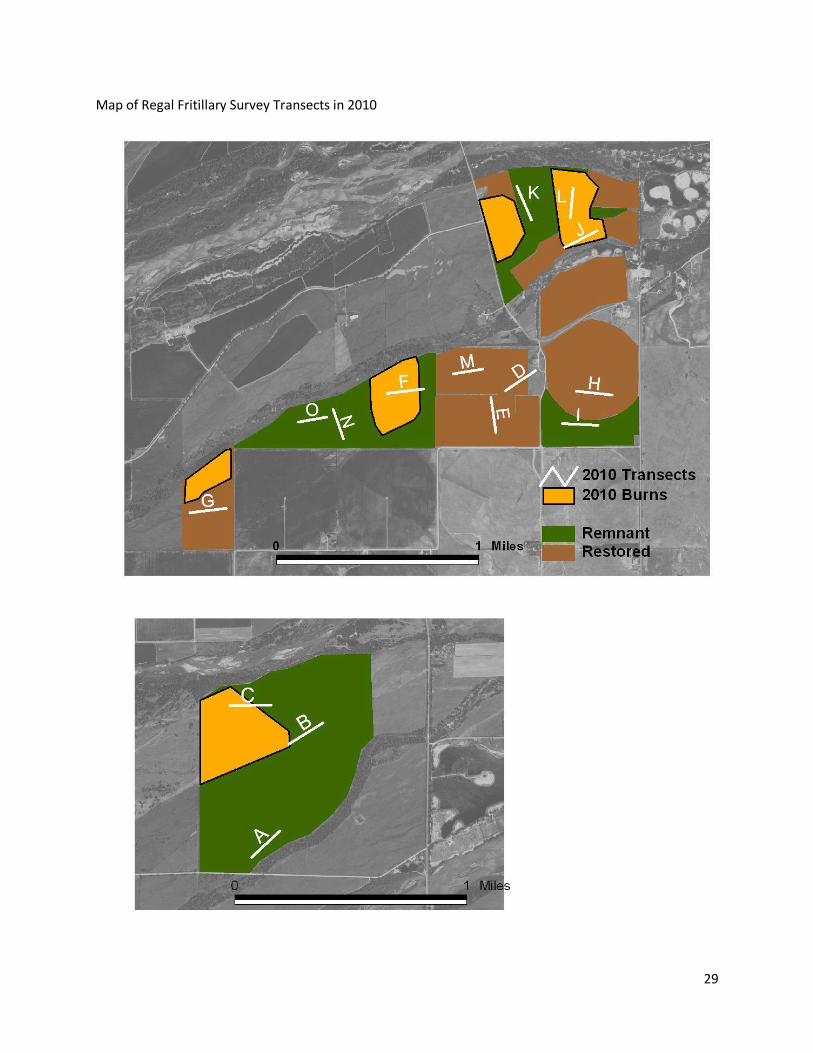
Oklahoma State) University. Observers walked permanently marked (by GPS) transects of 300 meters in
length. Any butterflies observed were noted, along with their perpendicular distance from the transect
(though we have not used those measures in our analysis). In addition, any information about behavior
(flying, basking, nectaring, etc) were noted, and if nectaring, the flower species was recorded. Nectar
flower abundance was also recorded along the same transects, following each butterfly survey
conducted. The number of blossoms of each flower species within 1 meter of the transect line (on each
side) was recorded for each 100m segment of the transect.
Butterfly surveys were conducted between 10am and 4pm, when weather was above 70 degrees
Fahrenheit and wind speeds were 15-20mph or less. During 2010, we had some transects and observers
focused only on regal fritillaries, to ensure that we collected sufficient data on that species, and a
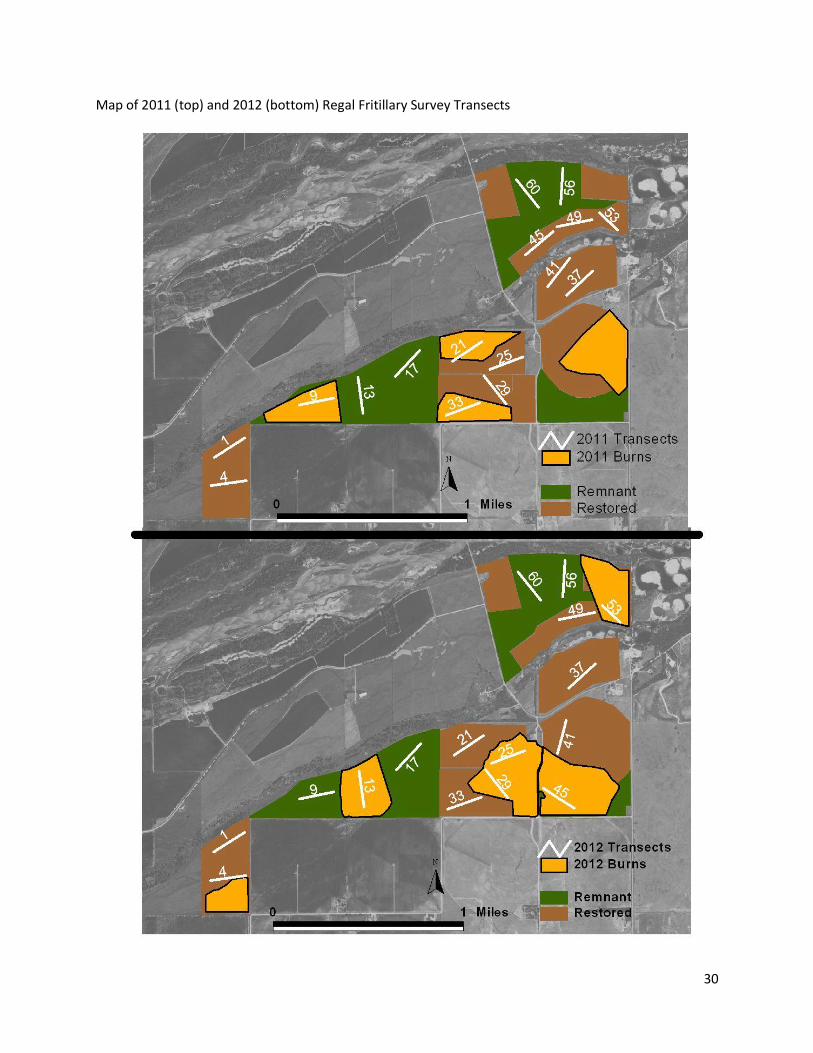
separate set of transects laid out for surveying all butterfly species. In 2011 and 2012, we added more
transects to the regal fritillary effort and abandoned the all butterfly transects because we were not
observing any rare or at-risk species apart from regals. Transect locations shifted some from year to
year as we tried to ensure that we were collecting data that represented a variety of burned/unburned
areas and restored/remnant locations. In all three years, Chris Helzer conducted frequent observational
surveys of butterflies throughout the season to look for other rare or at-risk species, but none were
found. All survey data will be shared with Ray Moranz for incorporation into his larger data set on
butterflies and regal fritillaries (and patch-burn grazing) from Oklahoma, Iowa, and Missouri – and for
possible publication.
29
Map of Regal Fritillary Survey Transects in 2010
30
Map of 2011 (top) and 2012 (bottom) Regal Fritillary Survey Transects

31
Butterfly Species Seen During 2010-2012
23 species seen in all Sites 18 Species in Restorations 19 Species in Remnants
Black Swallowtail Black Swallowtail Bronze Copper
Bronze Copper Bronze Copper Buckeye
Buckeye Buckeye Checkered White
Checkered White Common Checkered Skipper Common Checkered Skipper
Common Checkered Skipper Eastern Tailed Blue Common Sootywing Skipper
Eastern Tailed Blue Gray Copper Eastern Tailed Blue
Gorgone's Checkerspot Gray Hairstreak Gorgone's Checkerspot
Gray Copper Little Yellow Gray Hairstreak
Gray Hairstreak Melissa Blue Least Skipper
Least Skipper Monarch Monarch
Little Yellow Orange Sulphur Orange Sulphur
Melissa Blue Painted Lady Painted Lady
Monarch Pearly Crescent Pearly Crescent
Orange Sulphur Red Admiral Peck's Skipper
Painted Lady Regal Fritillary Red Admiral
Pearly Crescent Sachem Regal Fritillary
Peck's Skipper Variegated Fritillary Sachem
Red Admiral Viceroy Tawny-edged Skipper
Regal Fritillary Variegated Fritillary
Sachem
Tawny-edged Skipper
Variegated Fritillary
Viceroy
32
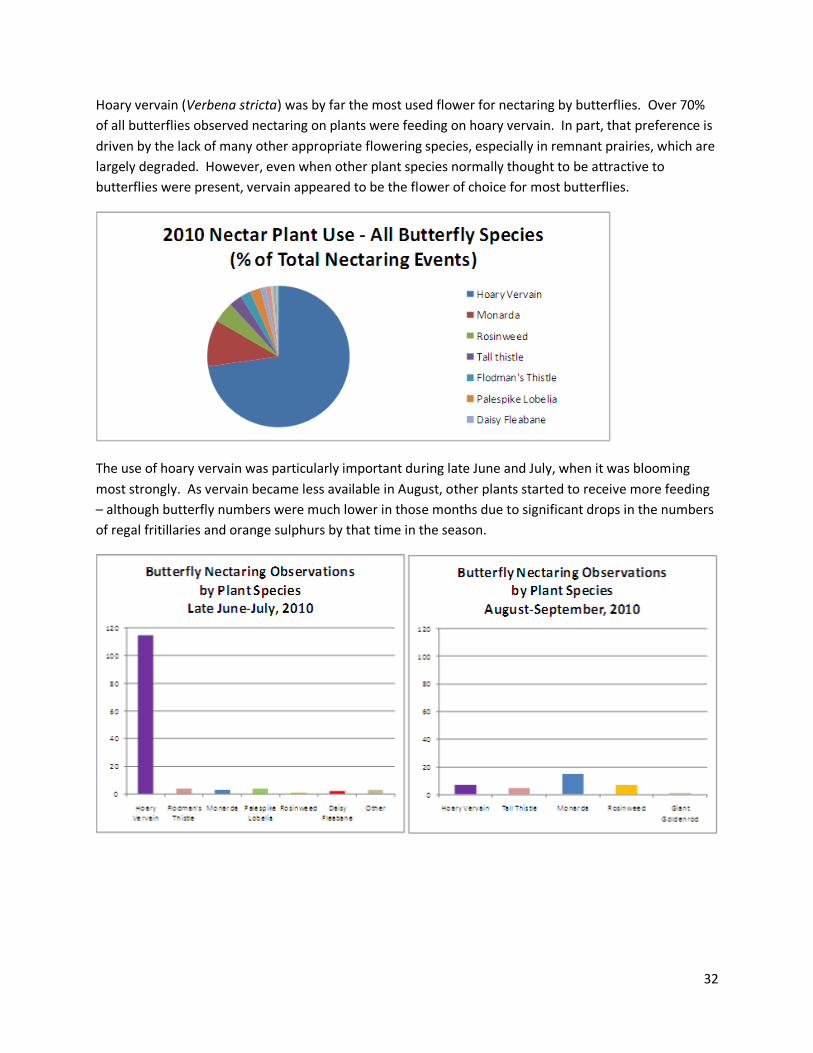
Hoary vervain (Verbena stricta) was by far the most used flower for nectaring by butterflies. Over 70%
of all butterflies observed nectaring on plants were feeding on hoary vervain. In part, that preference is
driven by the lack of many other appropriate flowering species, especially in remnant prairies, which are
largely degraded. However, even when other plant species normally thought to be attractive to
butterflies were present, vervain appeared to be the flower of choice for most butterflies.
The use of hoary vervain was particularly important during late June and July, when it was blooming
most strongly. As vervain became less available in August, other plants started to receive more feeding
– although butterfly numbers were much lower in those months due to significant drops in the numbers
of regal fritillaries and orange sulphurs by that time in the season.
33
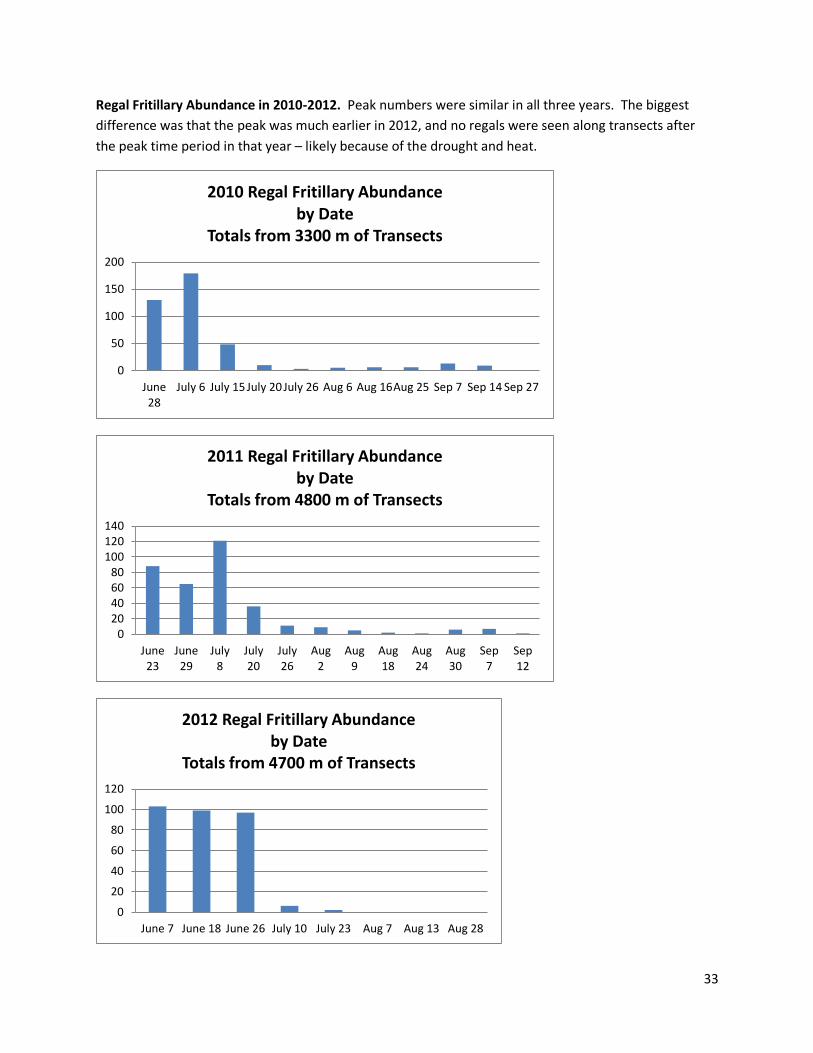
Regal Fritillary Abundance in 2010-2012. Peak numbers were similar in all three years. The biggest
difference was that the peak was much earlier in 2012, and no regals were seen along transects after
the peak time period in that year – likely because of the drought and heat.
0
50
100
150
200
June28
July 6 July 15 July 20 July 26 Aug 6 Aug 16Aug 25 Sep 7 Sep 14 Sep 27
2010 Regal Fritillary Abundanceby Date
Totals from 3300 m of Transects
020406080
100120140
June23
June29
July8
July20
July26
Aug2
Aug9
Aug18
Aug24
Aug30
Sep7
Sep12
2011 Regal Fritillary Abundanceby Date
Totals from 4800 m of Transects
0
20
40
60
80
100
120
June 7 June 18 June 26 July 10 July 23 Aug 7 Aug 13 Aug 28
2012 Regal Fritillary Abundanceby Date
Totals from 4700 m of Transects
34
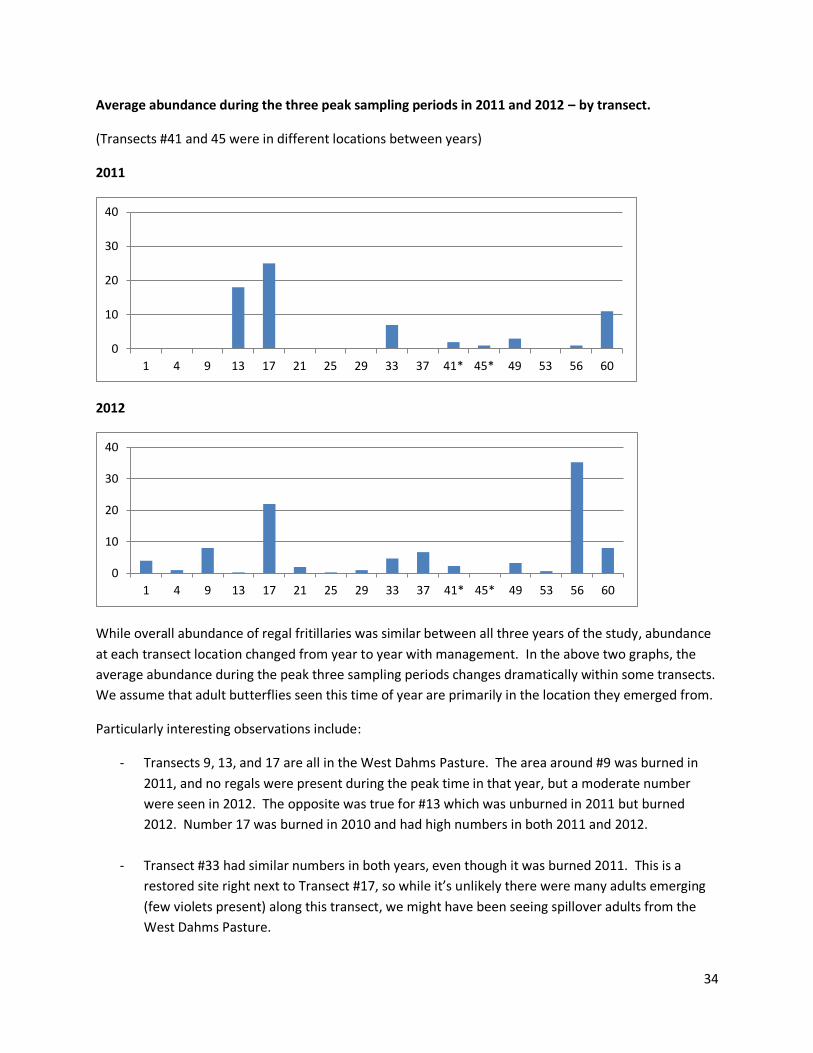
Average abundance during the three peak sampling periods in 2011 and 2012 – by transect.
(Transects #41 and 45 were in different locations between years)
2011
2012
While overall abundance of regal fritillaries was similar between all three years of the study, abundance
at each transect location changed from year to year with management. In the above two graphs, the
average abundance during the peak three sampling periods changes dramatically within some transects.
We assume that adult butterflies seen this time of year are primarily in the location they emerged from.
Particularly interesting observations include:
- Transects 9, 13, and 17 are all in the West Dahms Pasture. The area around #9 was burned in
2011, and no regals were present during the peak time in that year, but a moderate number
were seen in 2012. The opposite was true for #13 which was unburned in 2011 but burned
2012. Number 17 was burned in 2010 and had high numbers in both 2011 and 2012.
- Transect #33 had similar numbers in both years, even though it was burned 2011. This is a
restored site right next to Transect #17, so while it’s unlikely there were many adults emerging
(few violets present) along this transect, we might have been seeing spillover adults from the
West Dahms Pasture.
0
10
20
30
40
1 4 9 13 17 21 25 29 33 37 41* 45* 49 53 56 60
0
10
20
30
40
1 4 9 13 17 21 25 29 33 37 41* 45* 49 53 56 60

35
- Transect # 37 is a restored site that was not burned during the study, but was grazed only in
2011 (pretty hard). There were no adults seen during the peak periods of 2011 but a moderate
number in 2012 when it was idled. It’s hard to say if intensive grazing influenced regal numbers,
but it’s worth noting and trying to watch when we have future opportunities.
- The most dramatic difference between years was in Transect #56, which had very few regals in
2011 but the highest number of any transect in 2012. This remnant prairie area was burned in
2010, and grazed pretty hard that year. Other sites have shown pretty good numbers of adults
during the peak of the year following a burn (see above comments about the West Dahms
Pasture) but at this site it took two years for the numbers to come back up. No explanation is
apparent at this point.
As listed in the Results Section more data and discussion can be found in the following blog post links:
Response of regal fritillaries to Patch-Burn Grazing habitats:
http://prairieecologist.com/2012/11/13/regal-fritillary-butterflies-in-burned-and-grazed-prairie/
Summary of 2010-11 data on Regal Fritillaries: http://prairieecologist.com/2011/12/14/regal-fritillary-
butterflies-in-the-platte-river-prairies-2011/
Nectaring observations for all butterfly species from 2010: http://prairieecologist.com/2011/01/25/the-
importance-of-weedy-flowers-for-butterflies/
Recommended