Nancy Messonnier, M.D. Chief, Meningitis and Vaccine Preventable Diseases Branch
Epidemiology of Meningococcal Disease
Division of Bacterial Diseases National Center for Immunization and Respiratory Diseases
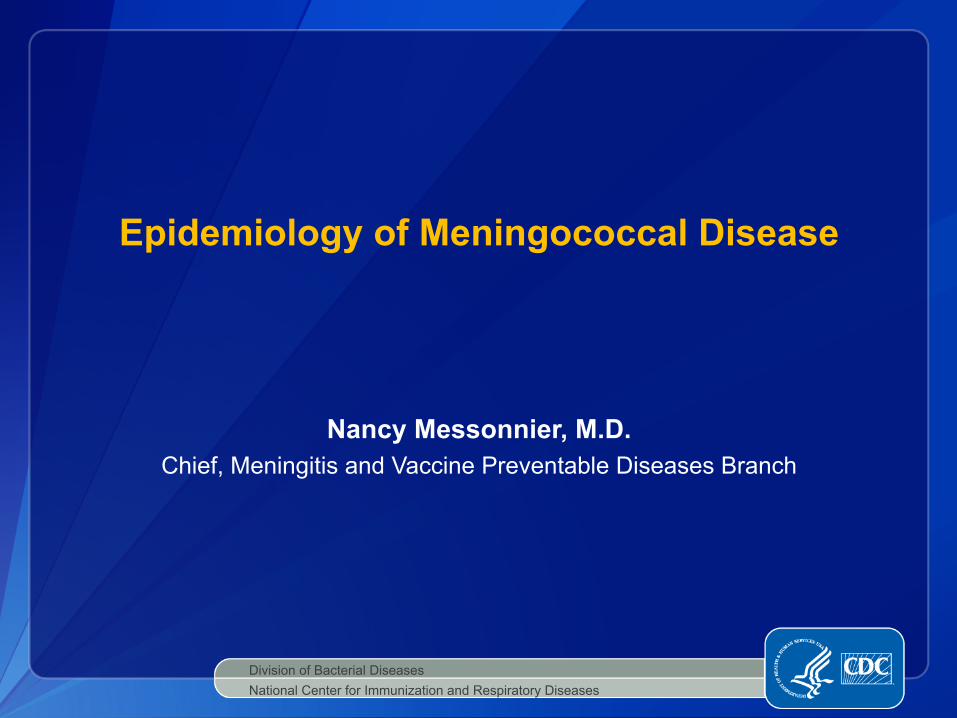
The “Meningitis Belt” of sub-Saharan Africa*
*“Meningitis belt” defined by Lapeyssonnie in 1963 Redefined by Greenwood in 1987
430 million at risk
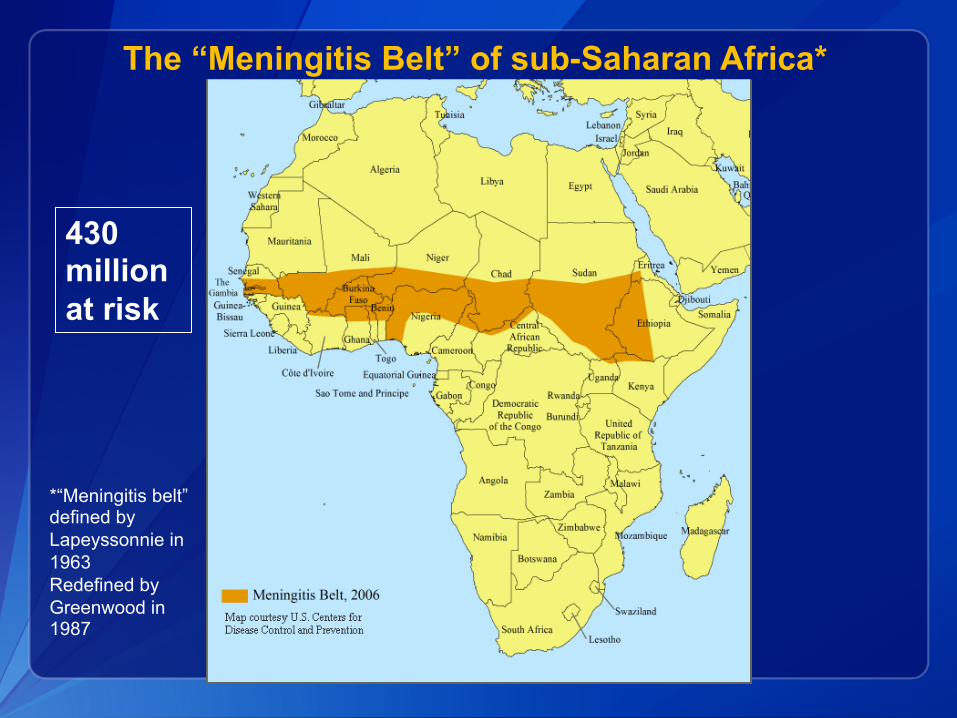
Epidemic Meningitis Cases and Case-Fatality Rates – AFRO Region, 1965-2006*
*Meningitis in the Africa Region, 1965 – 2006, WHO/AFR, October 2006
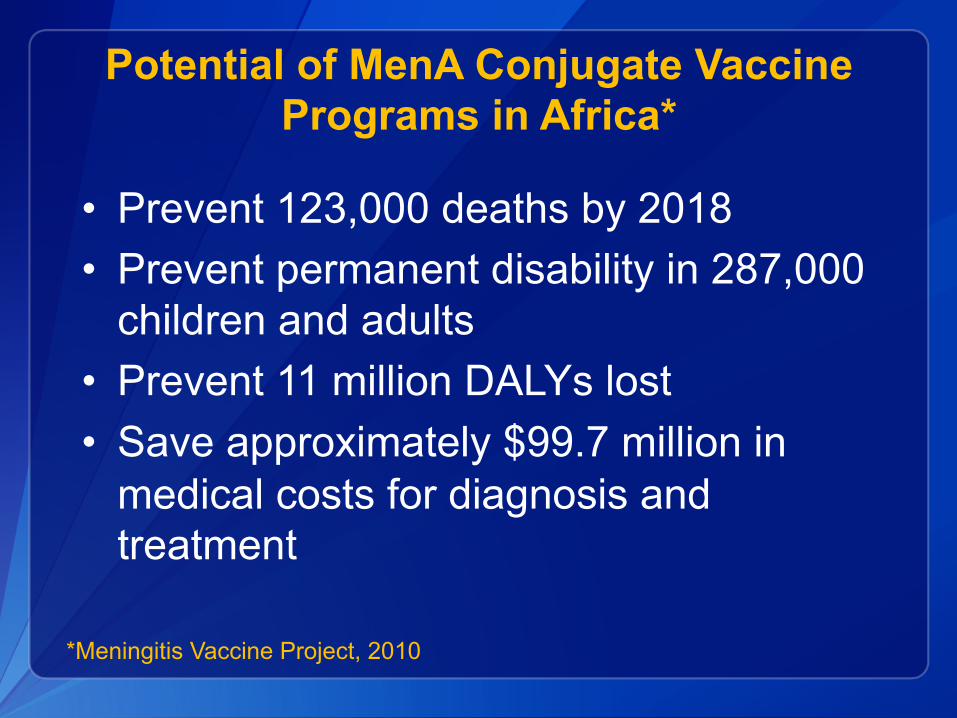
Potential of MenA Conjugate Vaccine Programs in Africa*
• Prevent 123,000 deaths by 2018 • Prevent permanent disability in 287,000
children and adults • Prevent 11 million DALYs lost • Save approximately $99.7 million in
medical costs for diagnosis and treatment
*Meningitis Vaccine Project, 2010
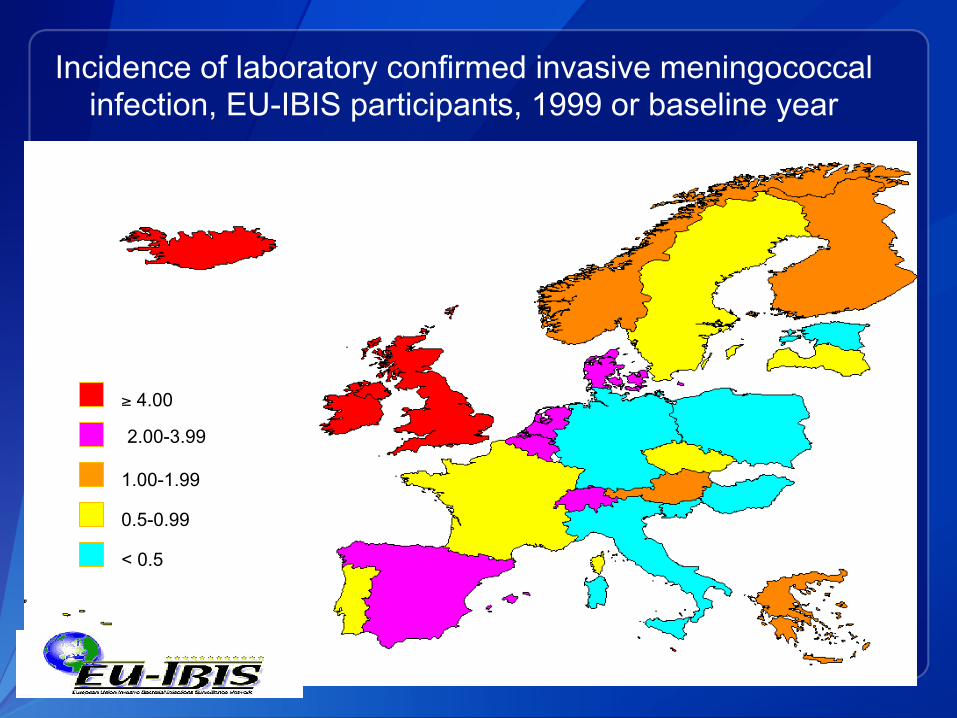
Incidence of laboratory confirmed invasive meningococcal infection, EU-IBIS participants, 1999 or baseline year
Incidence per 100,000
≥ 4.00
2.00-3.99
1.00-1.99
0.5-0.99
< 0.5
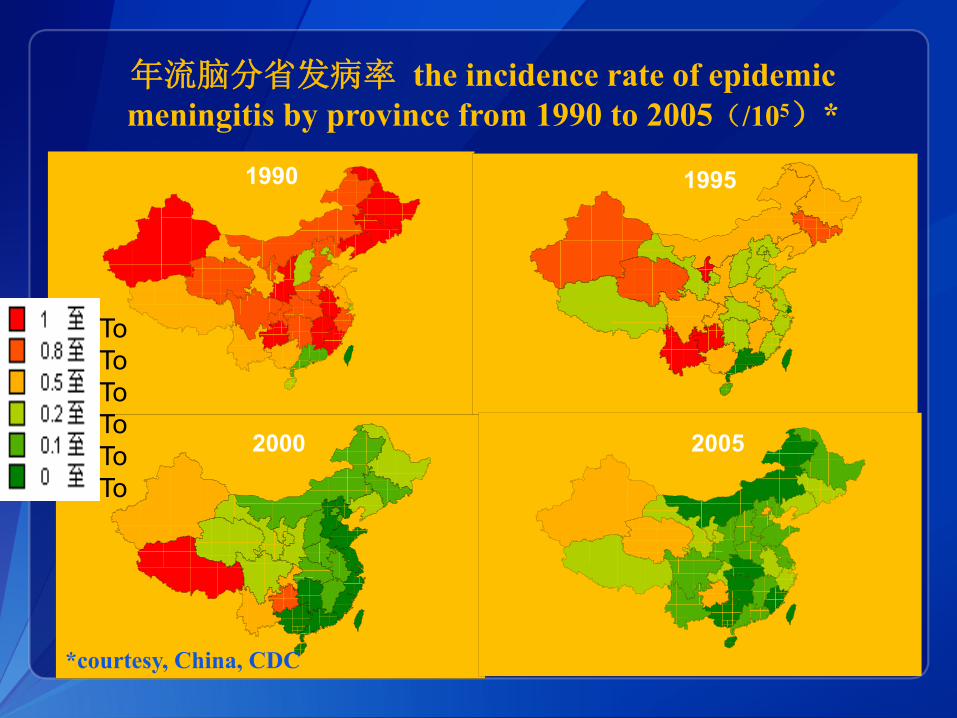
年流脑分省发病率 the incidence rate of epidemic meningitis by province from 1990 to 2005(/105)*�
1990 1995
2000 2005
To To To To To To
2005
*courtesy, China, CDC
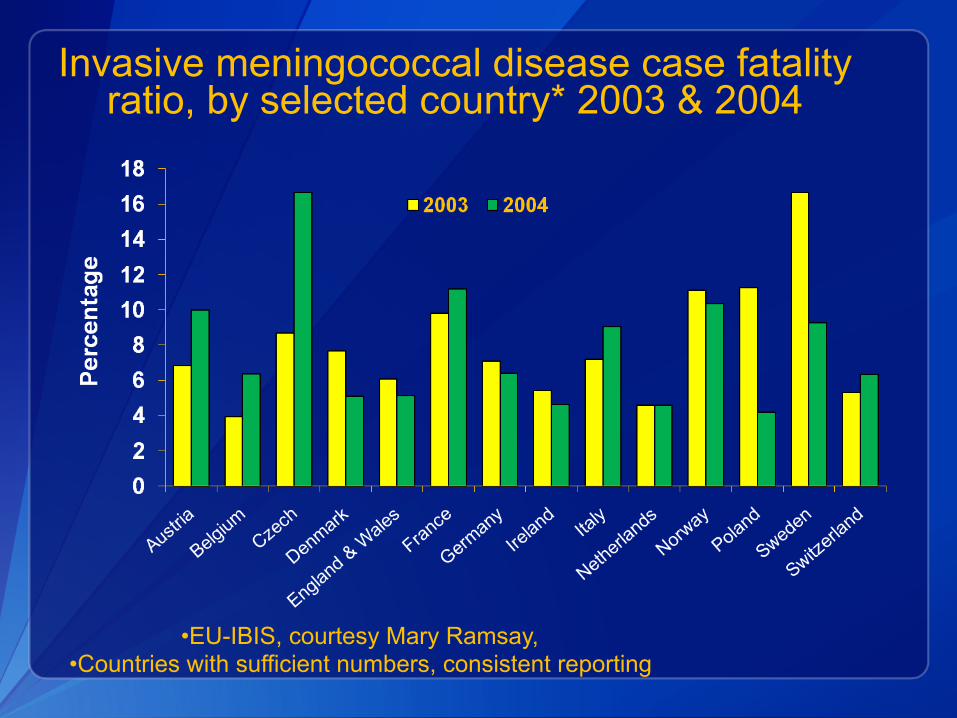
Invasive meningococcal disease case fatality ratio, by selected country* 2003 & 2004
• EU-IBIS, courtesy Mary Ramsay, • Countries with sufficient numbers, consistent reporting
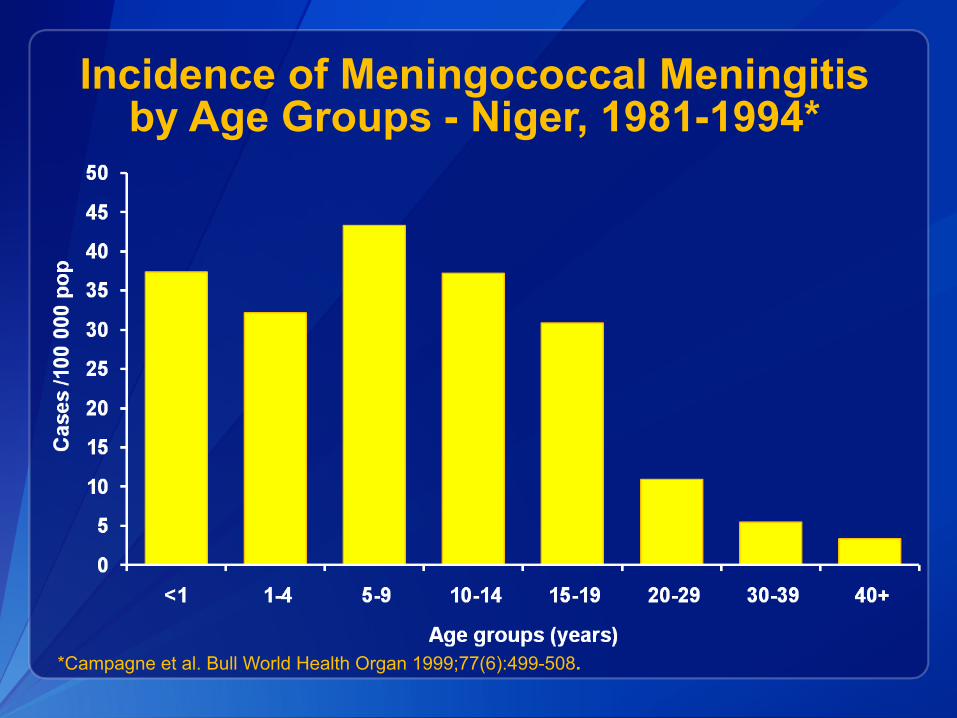
Incidence of Meningococcal Meningitis by Age Groups - Niger, 1981-1994*
*Campagne et al. Bull World Health Organ 1999;77(6):499-508.
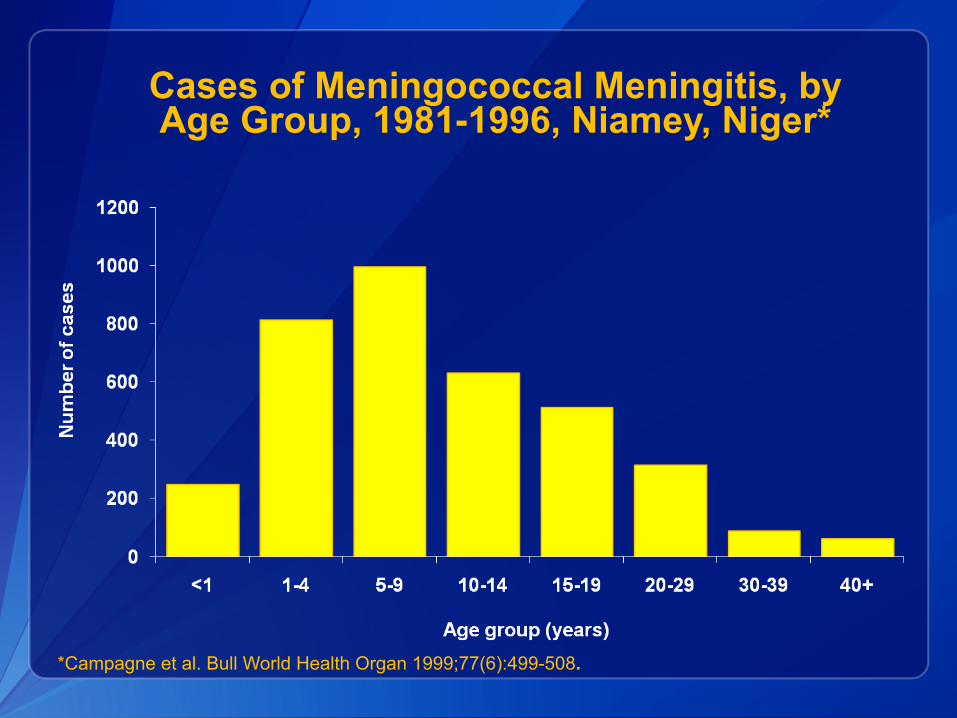
Cases of Meningococcal Meningitis, by Age Group, 1981-1996, Niamey, Niger*
*Campagne et al. Bull World Health Organ 1999;77(6):499-508.
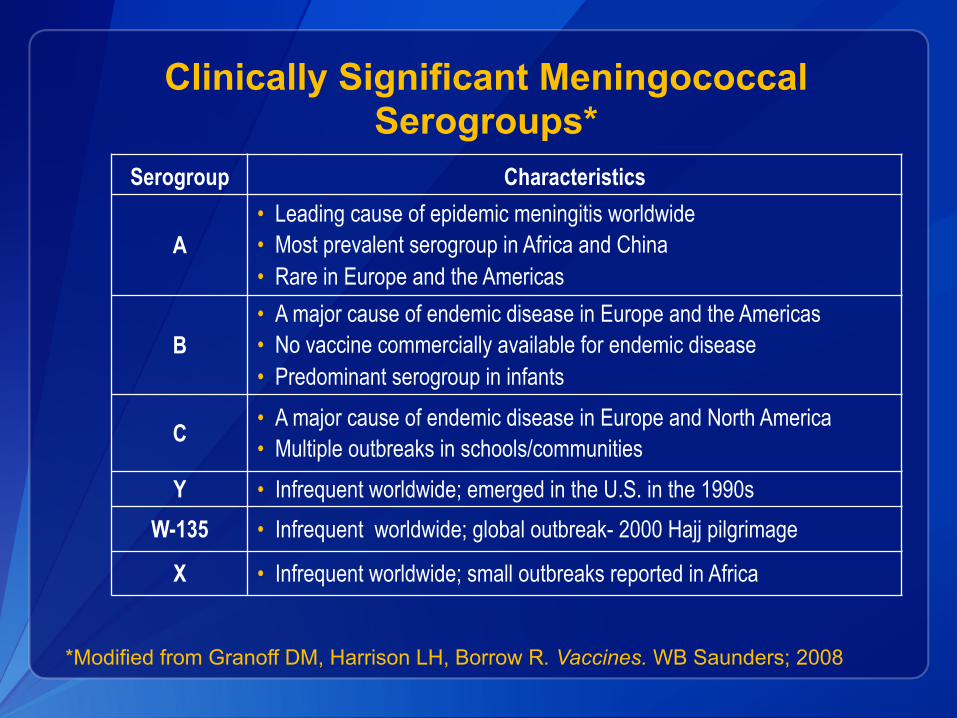
Clinically Significant Meningococcal Serogroups*
Serogroup Characteristics
A • Leading cause of epidemic meningitis worldwide • Most prevalent serogroup in Africa and China • Rare in Europe and the Americas
B • A major cause of endemic disease in Europe and the Americas • No vaccine commercially available for endemic disease • Predominant serogroup in infants
C • A major cause of endemic disease in Europe and North America • Multiple outbreaks in schools/communities
Y • Infrequent worldwide; emerged in the U.S. in the 1990s W-135 • Infrequent worldwide; global outbreak- 2000 Hajj pilgrimage
X • Infrequent worldwide; small outbreaks reported in Africa
*Modified from Granoff DM, Harrison LH, Borrow R. Vaccines. WB Saunders; 2008
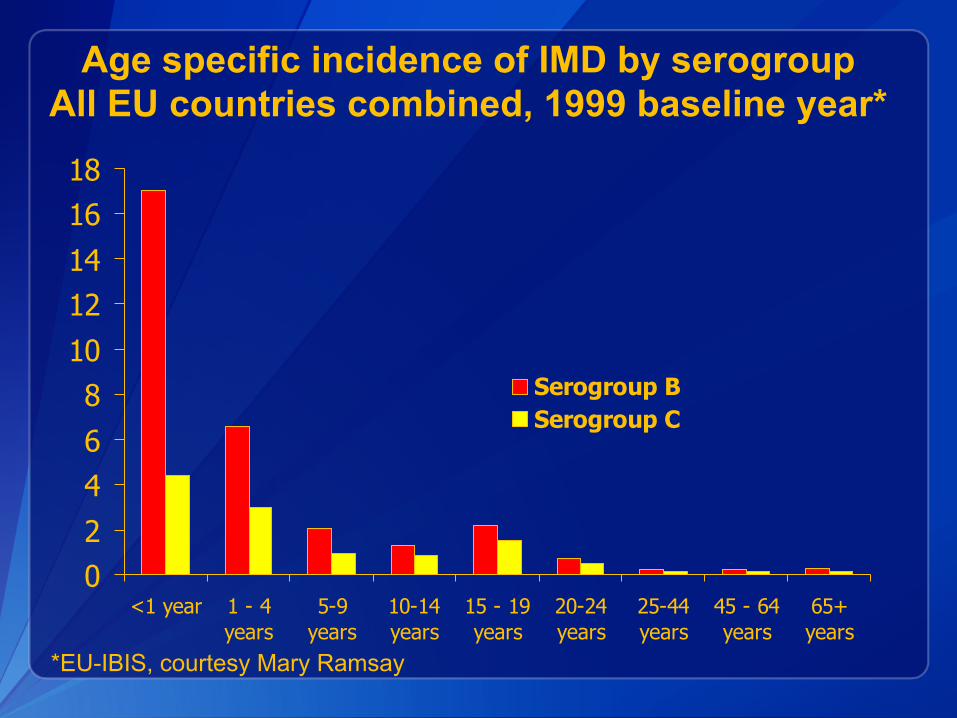
Age specific incidence of IMD by serogroup All EU countries combined, 1999 baseline year*
02468
1012141618
<1 year 1 - 4years
5-9years
10-14years
15 - 19years
20-24years
25-44years
45 - 64years
65+years
Serogroup BSerogroup C
*EU-IBIS, courtesy Mary Ramsay
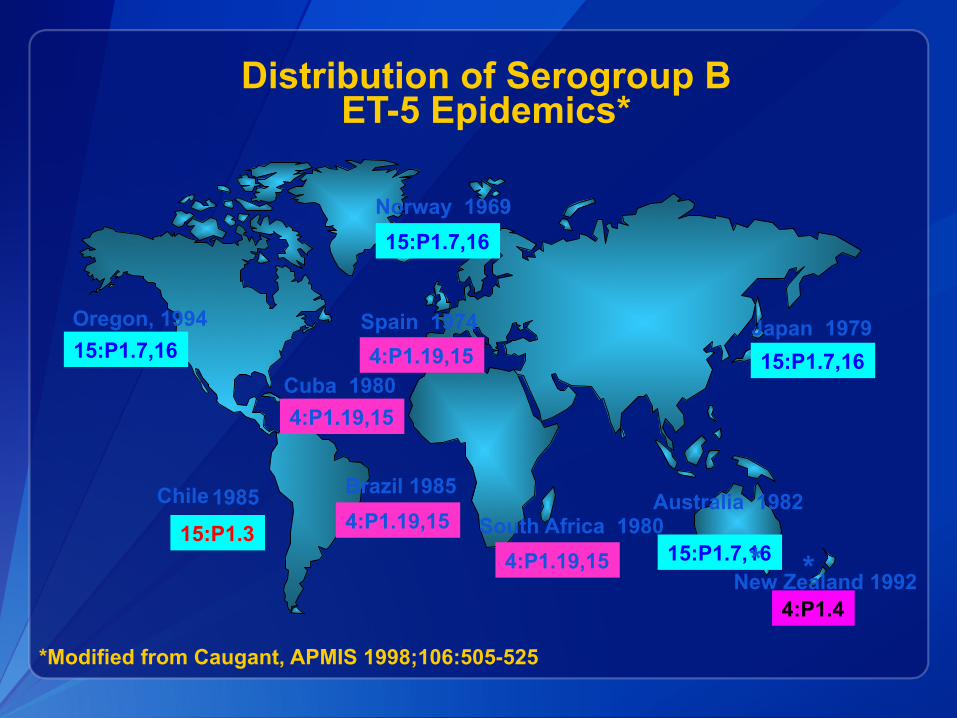
*Modified from Caugant, APMIS 1998;106:505-525
1985
15:P1.7,16
15:P1.7,16
4:P1.19,15 15:P1.7,16
4:P1.19,15
15:P1.3 4:P1.19,15
4:P1.19,15 15:P1.7,16 * *
Oregon, 1994
Chile Brazil 1985
South Africa 1980
Cuba 1980
Spain 1974
Norway 1969
Japan 1979
Australia 1982
Distribution of Serogroup B ET-5 Epidemics*
New Zealand 1992 4:P1.4
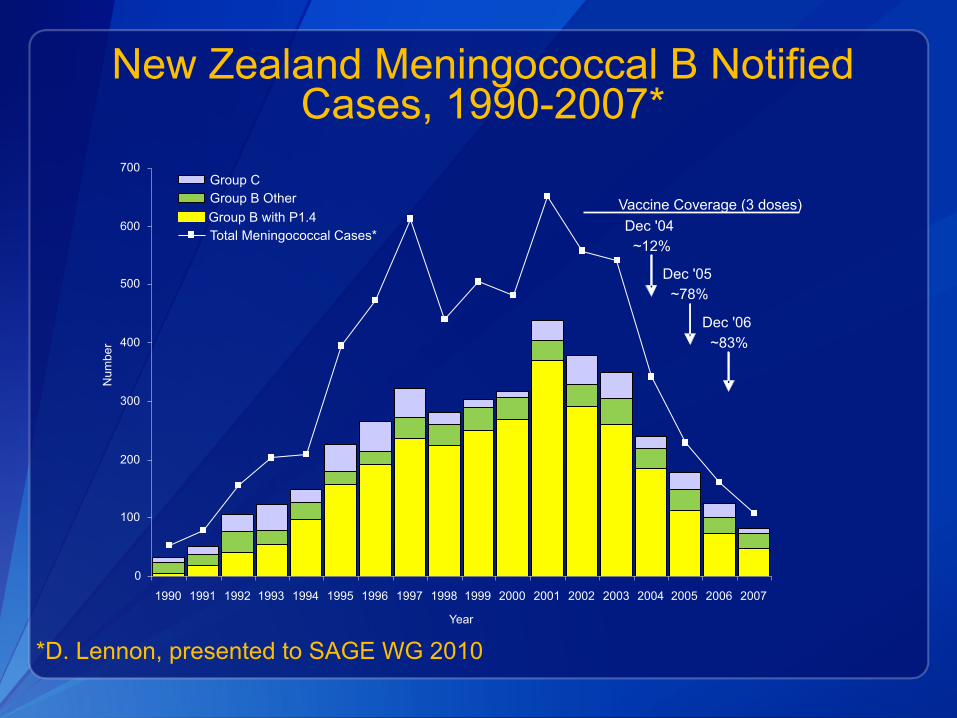
Dec '04 ~12%
Dec '05 ~78%
Dec '06 ~83%
Vaccine Coverage (3 doses)
0
100
200
300
400
500
600
700
1990 1991 1992 1993 1994 1995 1996 1997 1998 1999 2000 2001 2002 2003 2004 2005 2006 2007 Year
Num
ber
Group C Group B Other Group B with P1.4 Total Meningococcal Cases*
New Zealand Meningococcal B Notified Cases, 1990-2007*
*D. Lennon, presented to SAGE WG 2010
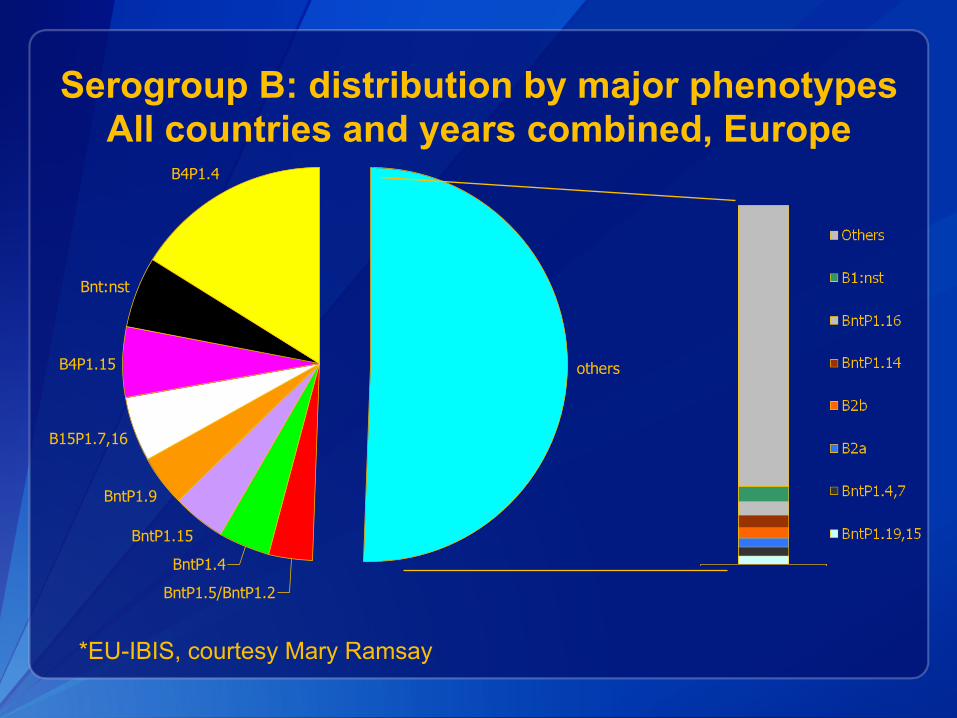
Serogroup B: distribution by major phenotypes All countries and years combined, Europe
others
BntP1.5/BntP1.2
BntP1.4
BntP1.15
BntP1.9
B15P1.7,16
B4P1.15
Bnt:nst
B4P1.4
*EU-IBIS, courtesy Mary Ramsay
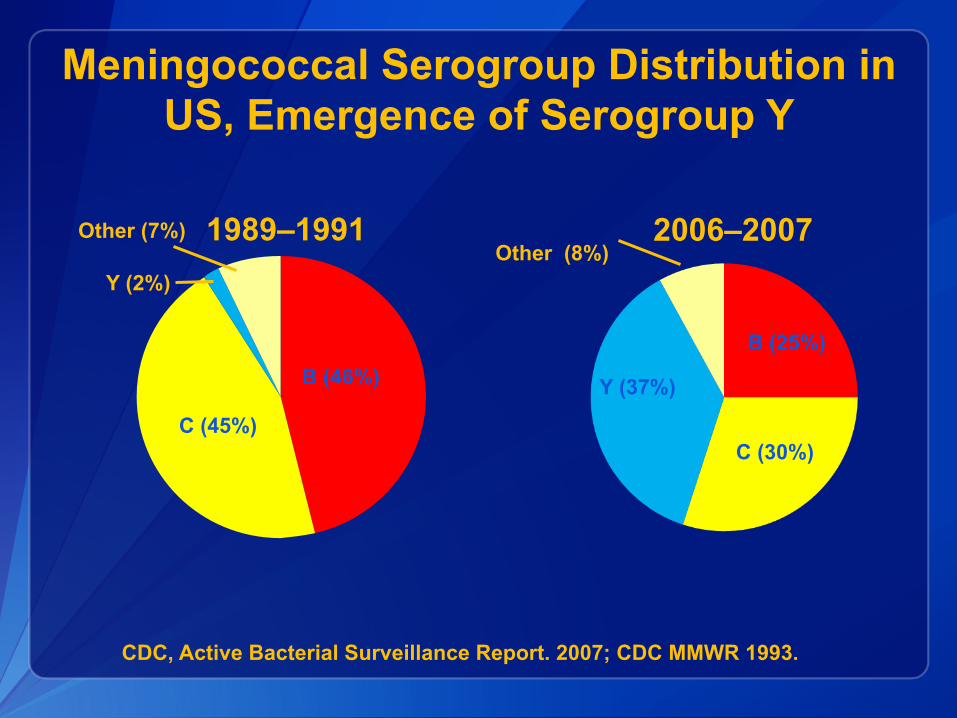
2006–2007 1989–1991
B (46%)
C (45%)
Y (2%)
Other (7%)
B (25%)
C (30%)
Y (37%)
Other (8%)
Meningococcal Serogroup Distribution in US, Emergence of Serogroup Y
CDC, Active Bacterial Surveillance Report. 2007; CDC MMWR 1993.
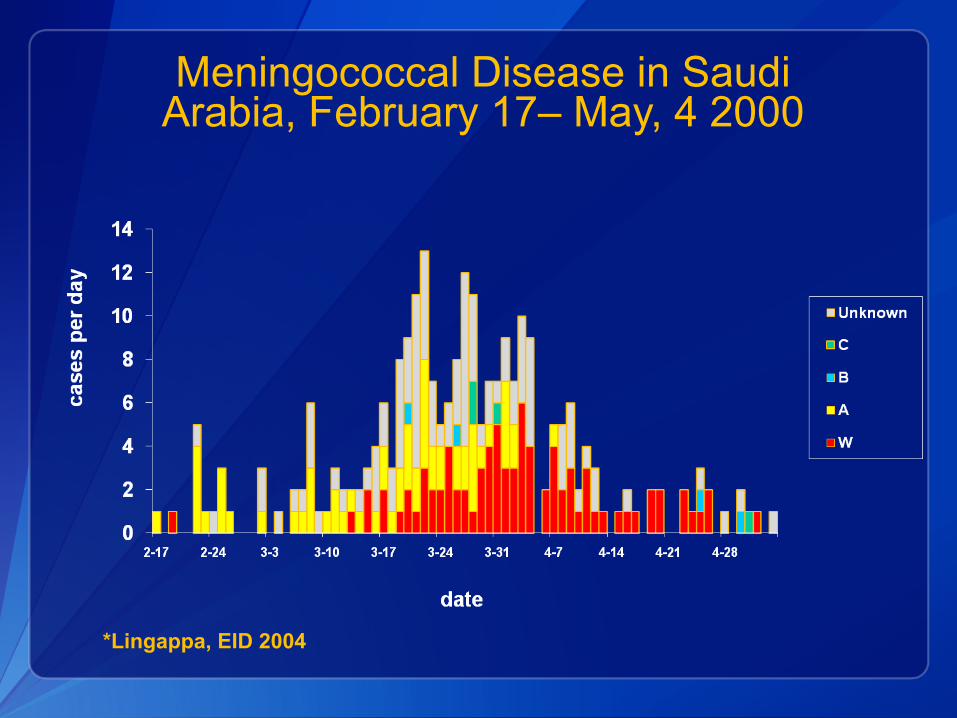
Meningococcal Disease in Saudi Arabia, February 17– May, 4 2000
*Lingappa, EID 2004
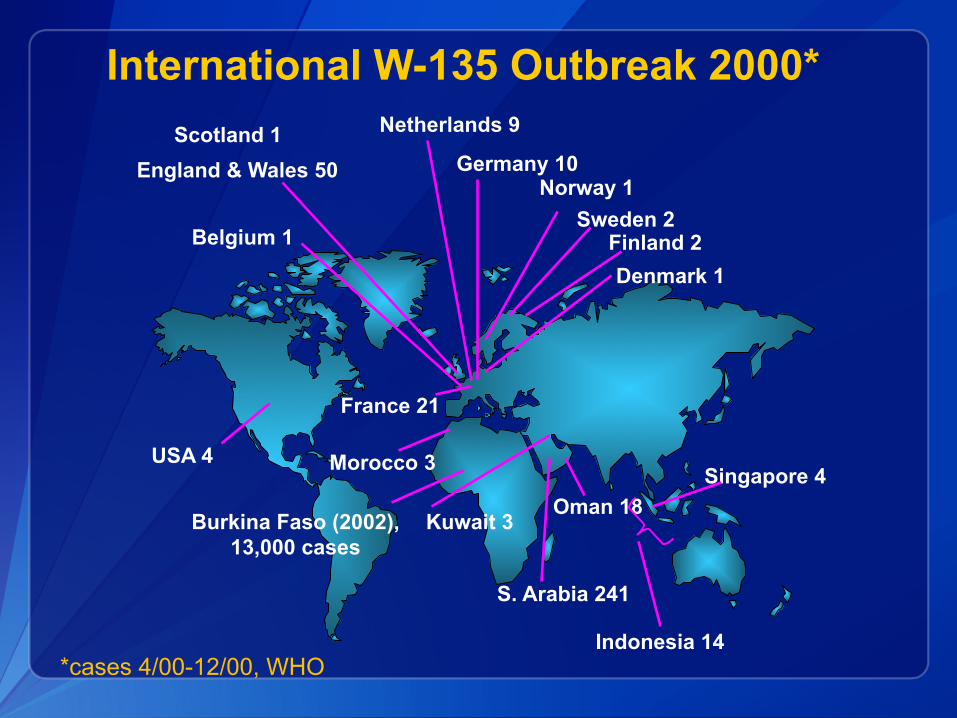
France 21
Finland 2
S. Arabia 241
Singapore 4 USA 4
Indonesia 14
Morocco 3
Sweden 2 Norway 1
Germany 10
Denmark 1
Netherlands 9 Scotland 1
Belgium 1
England & Wales 50
Kuwait 3 Oman 18
International W-135 Outbreak 2000*
*cases 4/00-12/00, WHO
Burkina Faso (2002), 13,000 cases
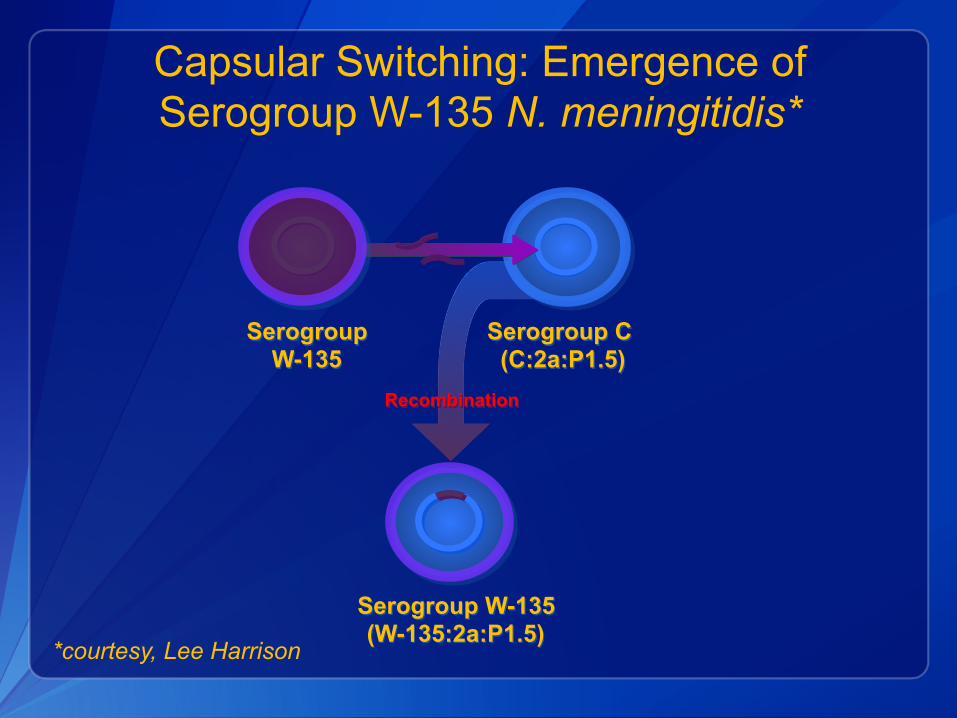
Capsular Switching: Emergence of Serogroup W-135 N. meningitidis*
Serogroup C (C:2a:P1.5)
Serogroup W-135 (W-135:2a:P1.5)
Serogroup W-135
Recombination
*courtesy, Lee Harrison
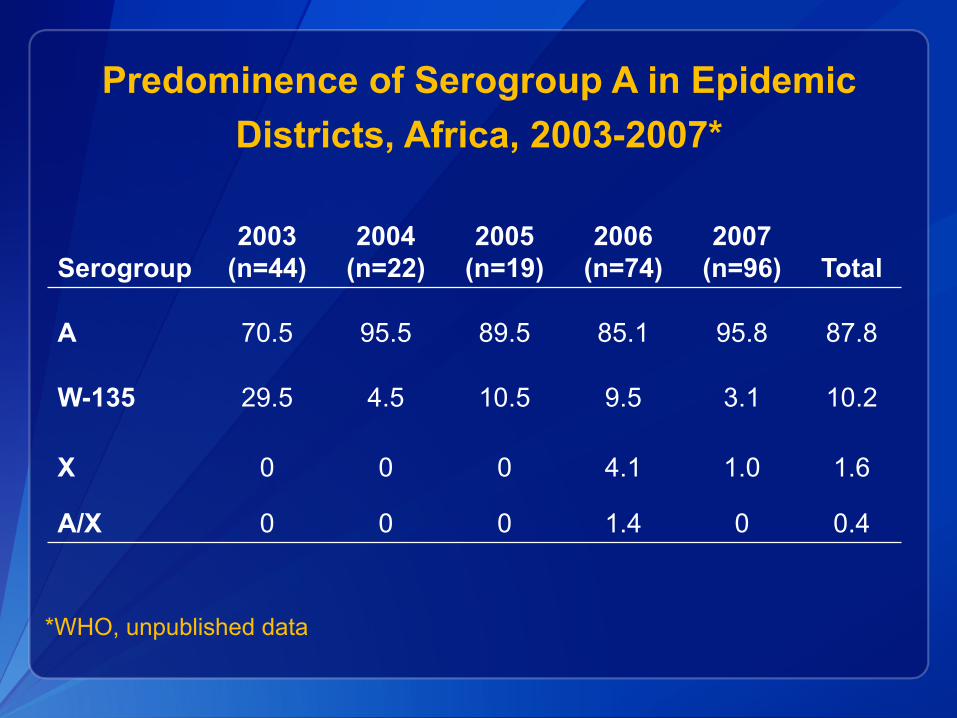
Predominence of Serogroup A in Epidemic Districts, Africa, 2003-2007*
Serogroup 2003
(n=44) 2004
(n=22) 2005
(n=19) 2006
(n=74) 2007
(n=96) Total
A 70.5 95.5 89.5 85.1 95.8 87.8
W-135 29.5 4.5 10.5 9.5 3.1 10.2
X 0 0 0 4.1 1.0 1.6
A/X 0 0 0 1.4 0 0.4
*WHO, unpublished data
Epidemiology of Meningococcal Disease Summary
• Epidemiology of disease varies by region • Case fatality ratio high globally • Burden and impact of disease in Africa
“Meningitis Belt” substantial • Analysis limited by lack of laboratory-
based serogroup surveillance
Recommended