ERCOT Long-Term Demandand Energy Forecasting
February 20, 2007Bill Bojorquez

ERCOT uses three primary load forecasts Long Term Mid-Term Short Term
Each forecast has its own specific application, purpose and methodology
ERCOT Load Forecasts
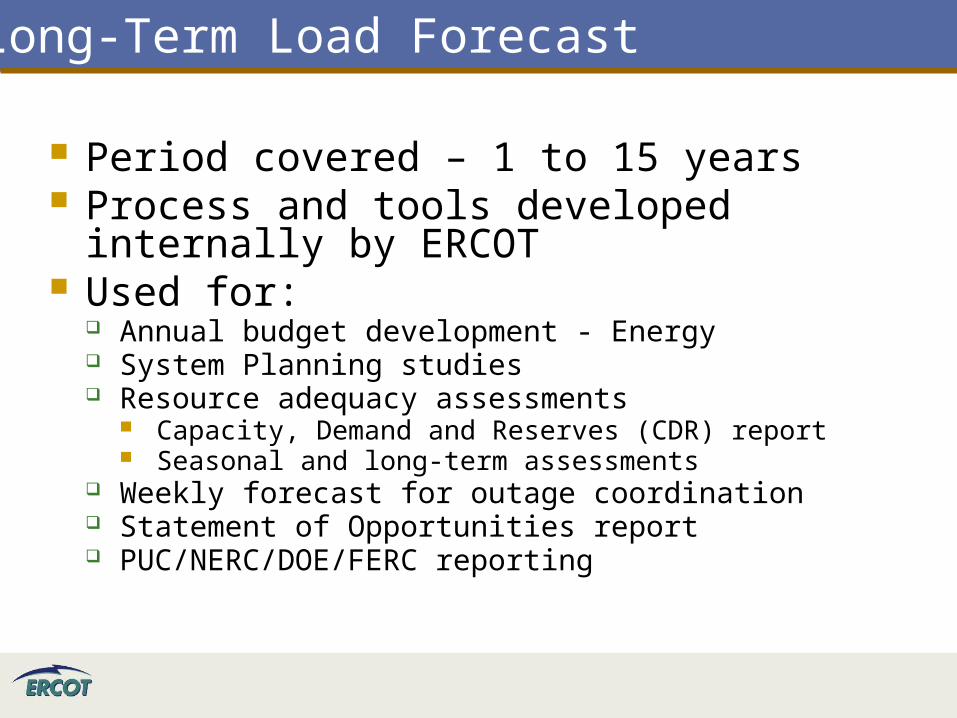
Period covered – 1 to 15 years Process and tools developed internally
by ERCOT Used for:
Annual budget development - Energy System Planning studies Resource adequacy assessments
Capacity, Demand and Reserves (CDR) report Seasonal and long-term assessments
Weekly forecast for outage coordination Statement of Opportunities report PUC/NERC/DOE/FERC reporting
Long-Term Load Forecast
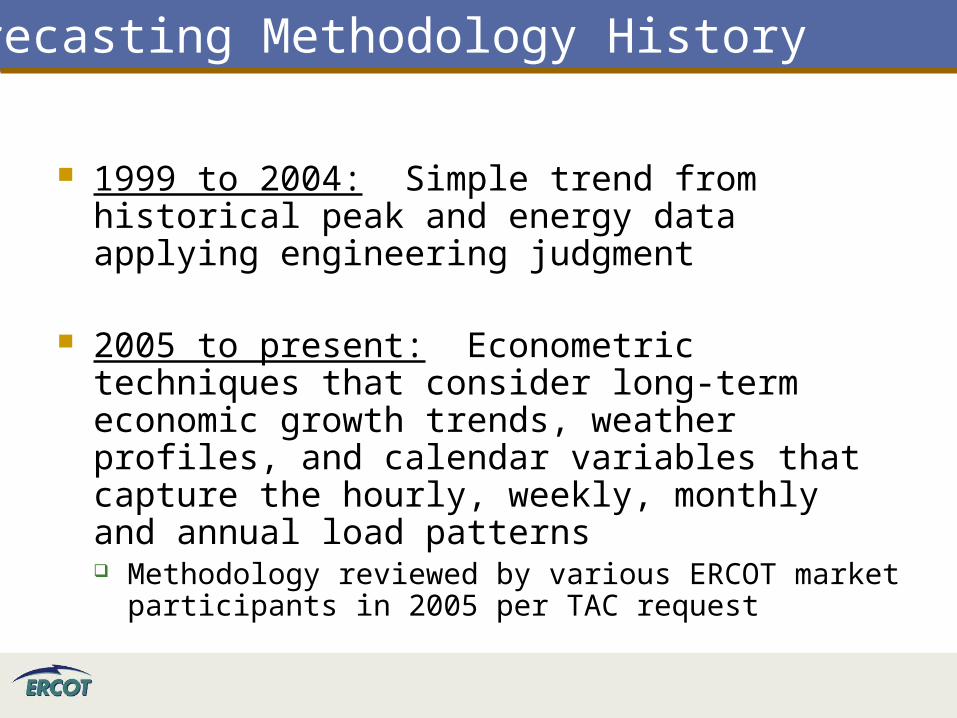
1999 to 2004: Simple trend from historical peak and energy data applying engineering judgment
2005 to present: Econometric techniques
that consider long-term economic growth trends, weather profiles, and calendar variables that capture the hourly, weekly, monthly and annual load patterns Methodology reviewed by various ERCOT market
participants in 2005 per TAC request
Forecasting Methodology History
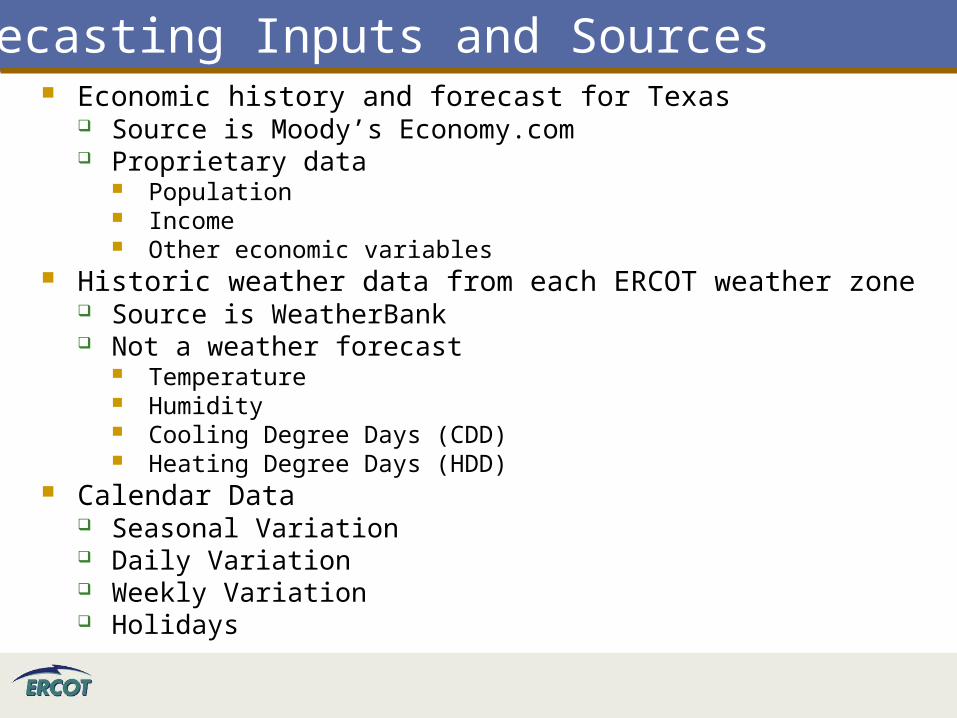
Economic history and forecast for Texas Source is Moody’s Economy.com Proprietary data
Population Income Other economic variables
Historic weather data from each ERCOT weather zone Source is WeatherBank Not a weather forecast
Temperature Humidity Cooling Degree Days (CDD) Heating Degree Days (HDD)
Calendar Data Seasonal Variation Daily Variation Weekly Variation Holidays
Forecasting Inputs and Sources
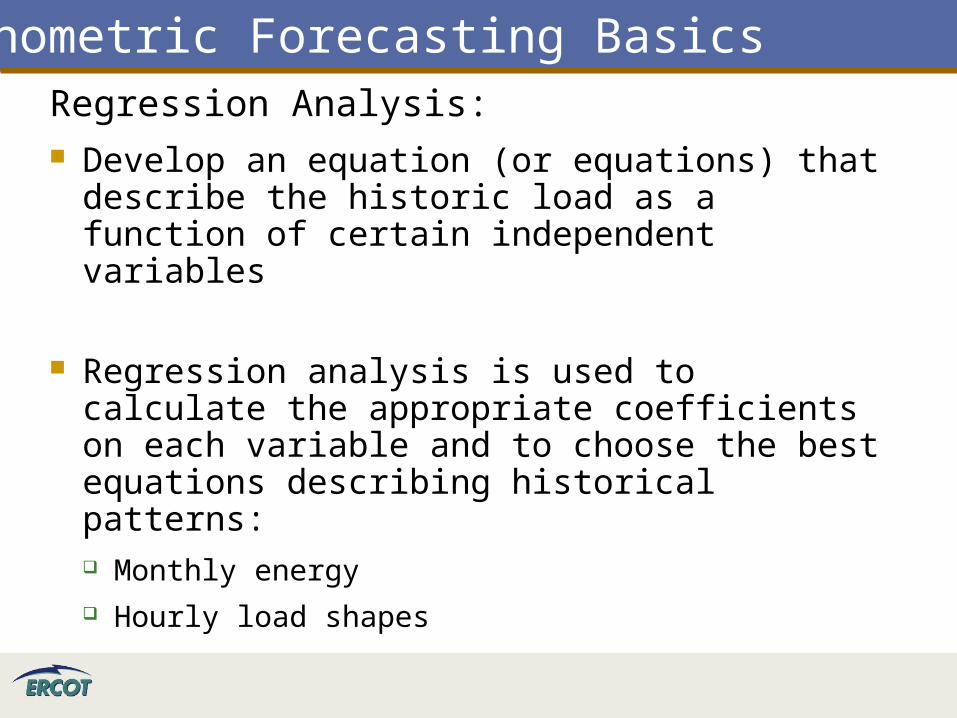
Regression Analysis: Develop an equation (or equations) that
describe the historic load as a function of certain independent variables
Regression analysis is used to calculate the appropriate coefficients on each variable and to choose the best equations describing historical patterns: Monthly energy Hourly load shapes
Econometric Forecasting Basics
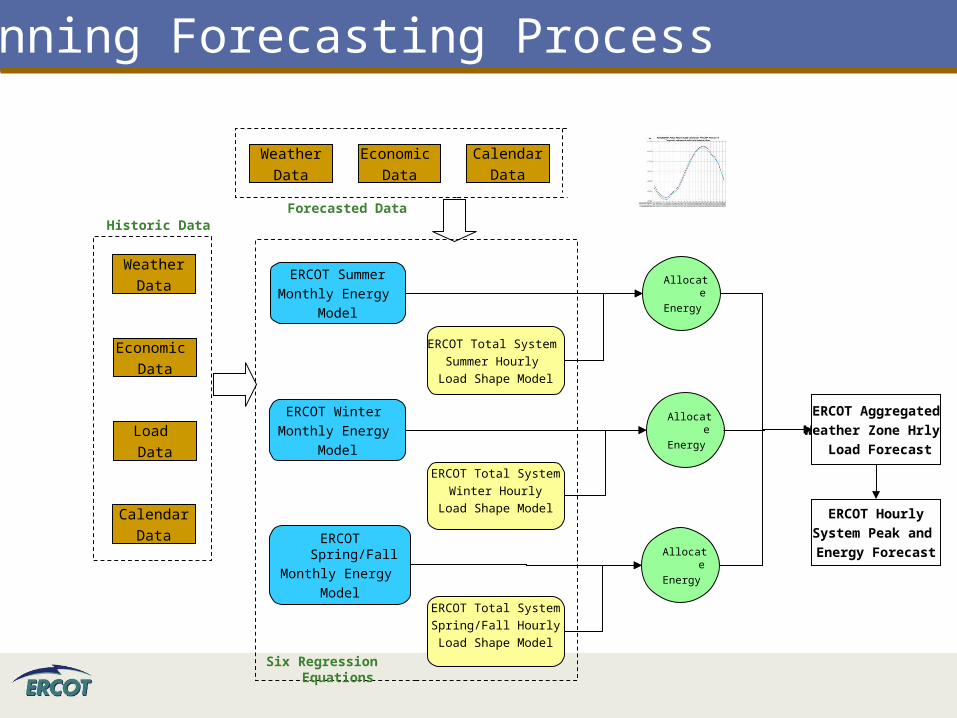
ERCOT Aggregated
Weather Zone Hrly
Load Forecast
Allocate
Energy
Allocate
Energy
Allocate
Energy
ERCOT Hourly
System Peak and
Energy Forecast
Calendar
Data
Economic
Data
Weather
Data
Calendar
Data
Forecasted Data
ERCOT Total System
Summer Hourly
Load Shape Model
ERCOT Total System
Winter Hourly
Load Shape Model
ERCOT Total System
Spring/Fall Hourly
Load Shape Model
ERCOT Winter
Monthly Energy
Model
ERCOT Spring/Fall
Monthly Energy
Model
ERCOT Summer
Monthly Energy
Model
Six Regression Equations
Load
Data
Economic
Data
Weather
Data
Calendar
Data
Historic Data
Planning Forecasting Process
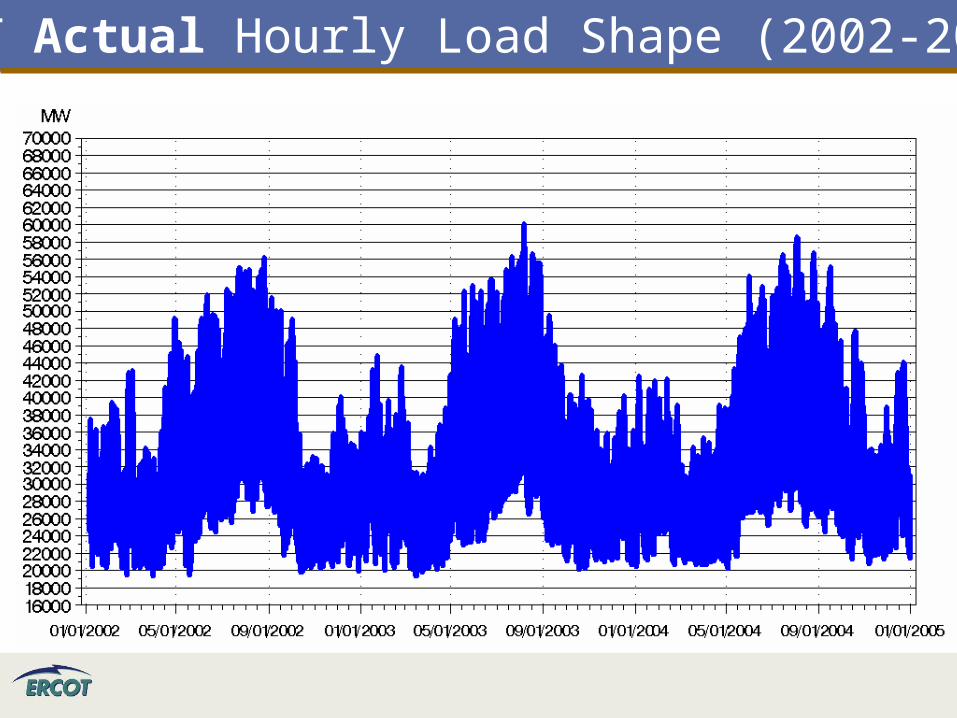
ERCOT Actual Hourly Load Shape (2002-2005)
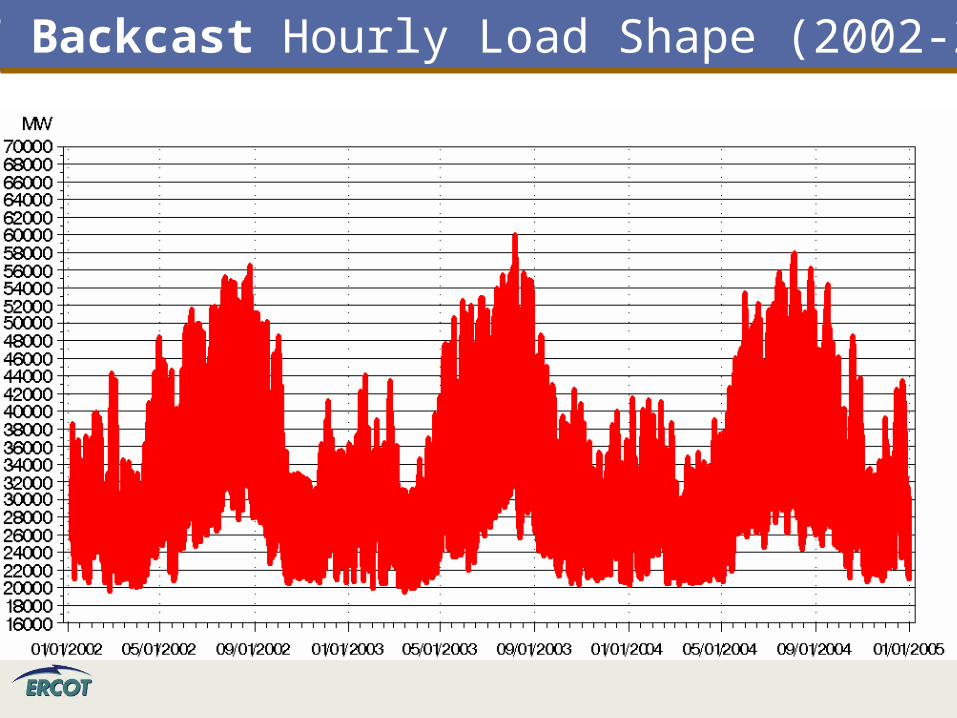
ERCOT Backcast Hourly Load Shape (2002-2005)
ERCOT Backcast Hourly Load Shape (2002-2005)
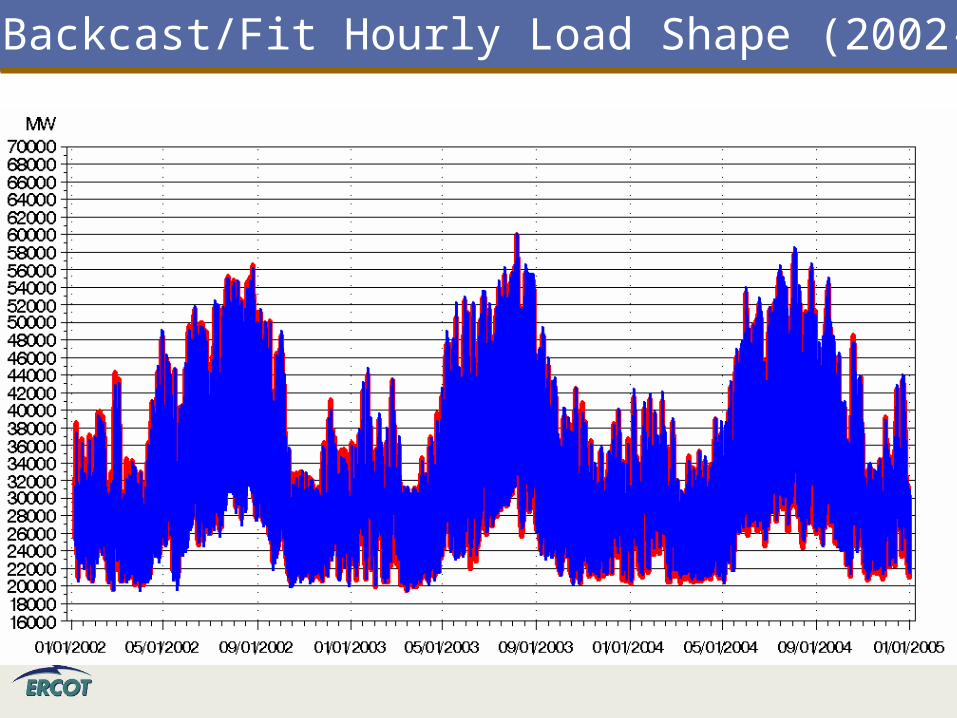
ERCOT Backcast/Fit Hourly Load Shape (2002-2005)
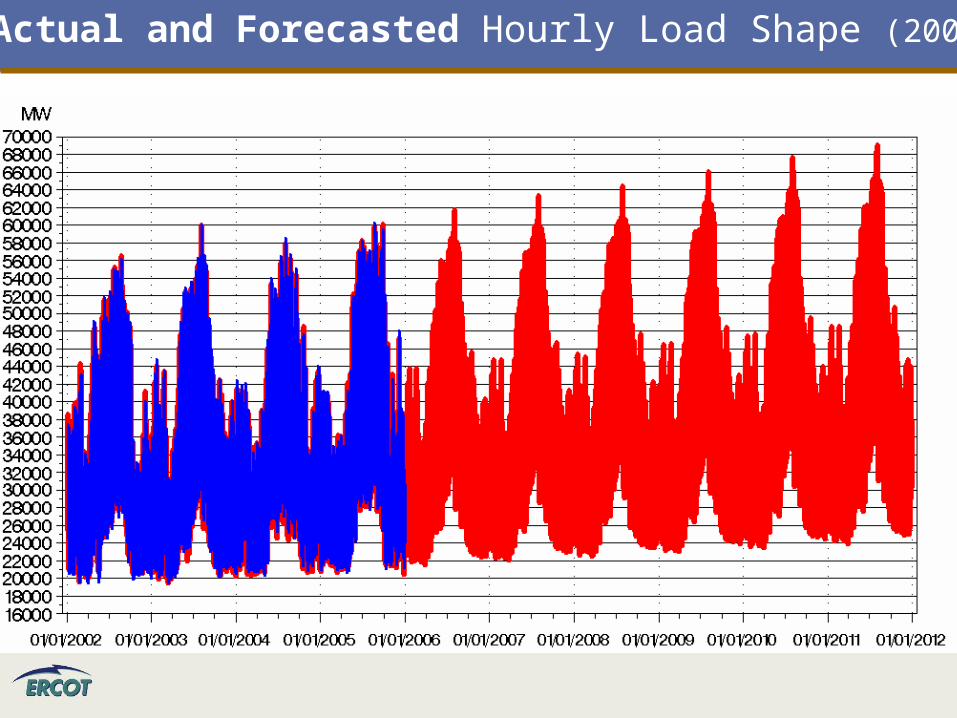
ERCOT Actual and Forecasted Hourly Load Shape (2002-2012)
40,000
45,000
50,000
55,000
60,000
65,000MW
Actual Forecast
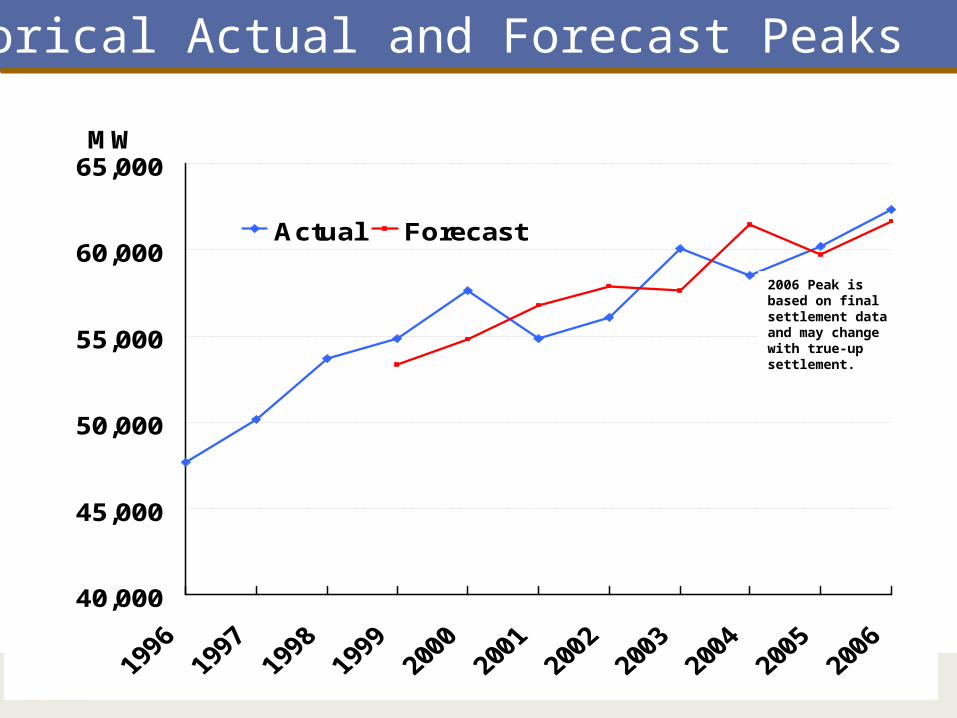
2006 Peak is based on final settlement data and may change with true-up settlement.
Historical Actual and Forecast Peaks
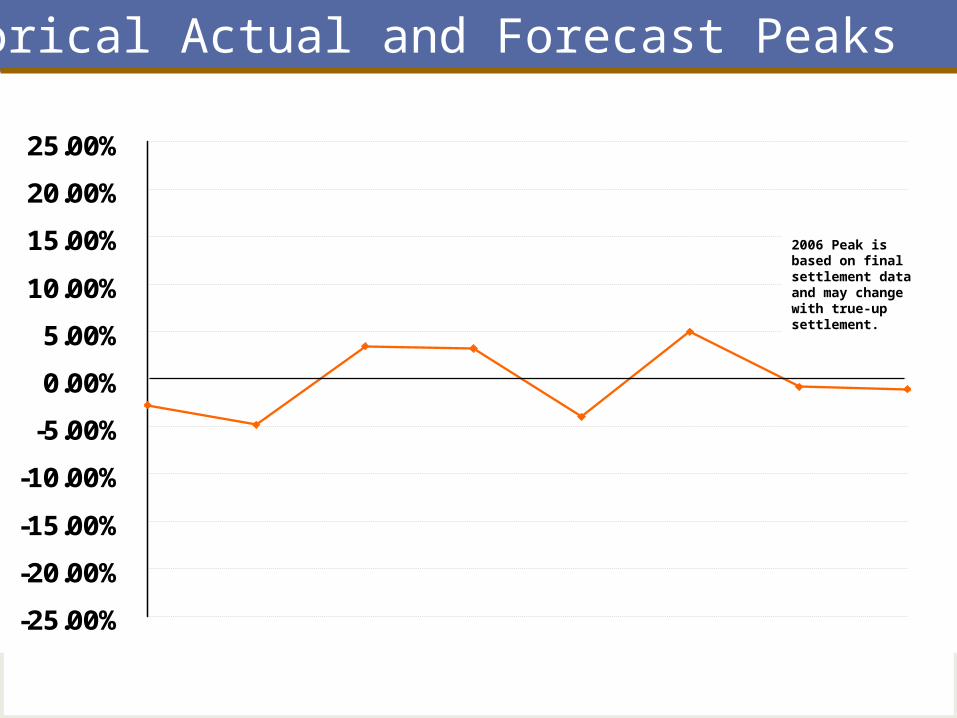
-25.00%
-20.00%
-15.00%
-10.00%
-5.00%
0.00%
5.00%
10.00%
15.00%
20.00%
25.00%
Over forecasted
Under forecasted
1999 2000 2001 2002 2003 20052004 2006
2006 Peak is based on final settlement data and may change with true-up settlement.
Historical Actual and Forecast Peaks
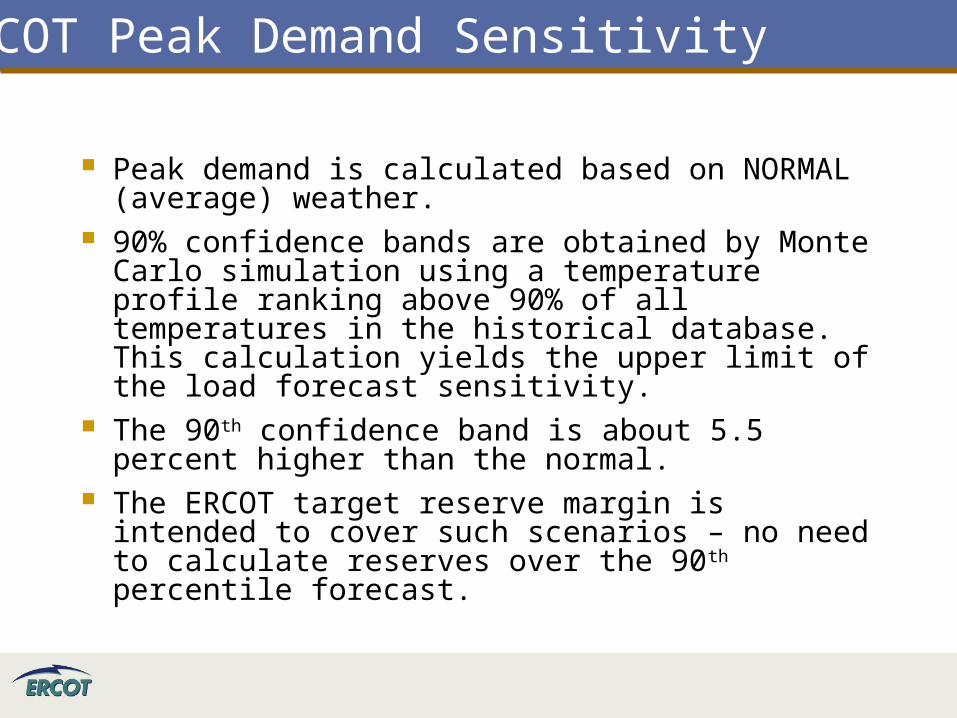
Peak demand is calculated based on NORMAL (average) weather.
90% confidence bands are obtained by Monte Carlo simulation using a temperature profile ranking above 90% of all temperatures in the historical database. This calculation yields the upper limit of the load forecast sensitivity.
The 90th confidence band is about 5.5 percent higher than the normal.
The ERCOT target reserve margin is intended to cover such scenarios – no need to calculate reserves over the 90th percentile forecast.
ERCOT Peak Demand Sensitivity
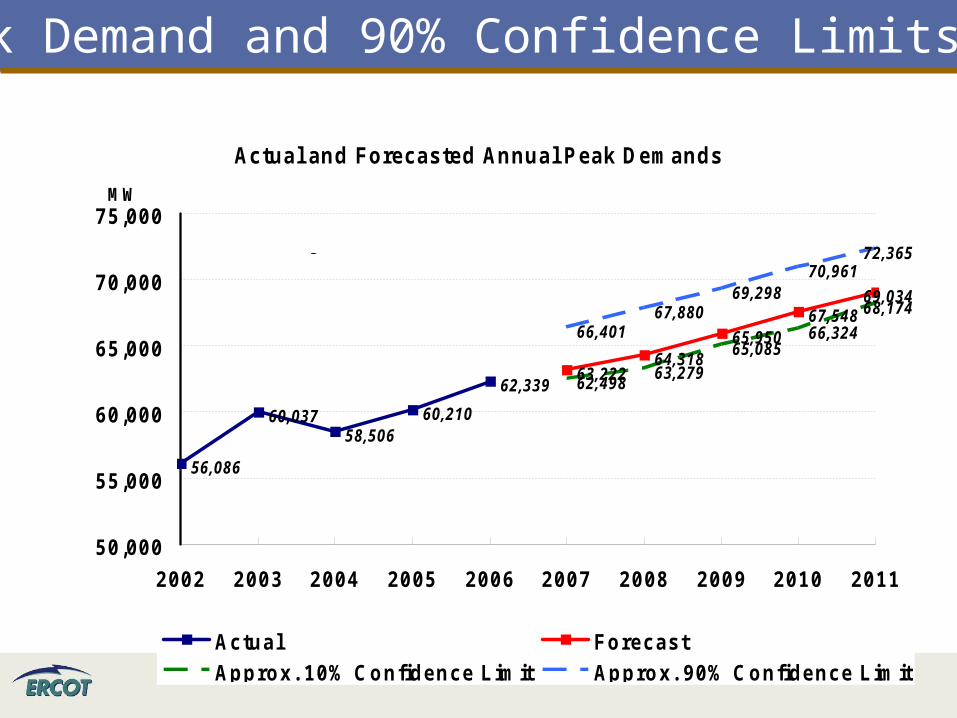
Actual and Forecasted Annual Peak Demands
56,086
60,03758,506
60,210
63,22264,318
65,95067,548
69,034
62,49863,279
65,08566,324
68,174
66,40167,880
69,29870,961
72,365
62,339
50 ,000
55 ,000
60 ,000
65 ,000
70 ,000
75 ,000
2002 2003 2004 2005 2006 2007 2008 2009 2010 2011
M W
Actu a l F o recas t
Ap p ro x . 10% C o n fid en ce L im it Ap p ro x . 90% C o n fid en ce L im it
2.29% Av g. G rowth
Peak Demand and 90% Confidence Limits
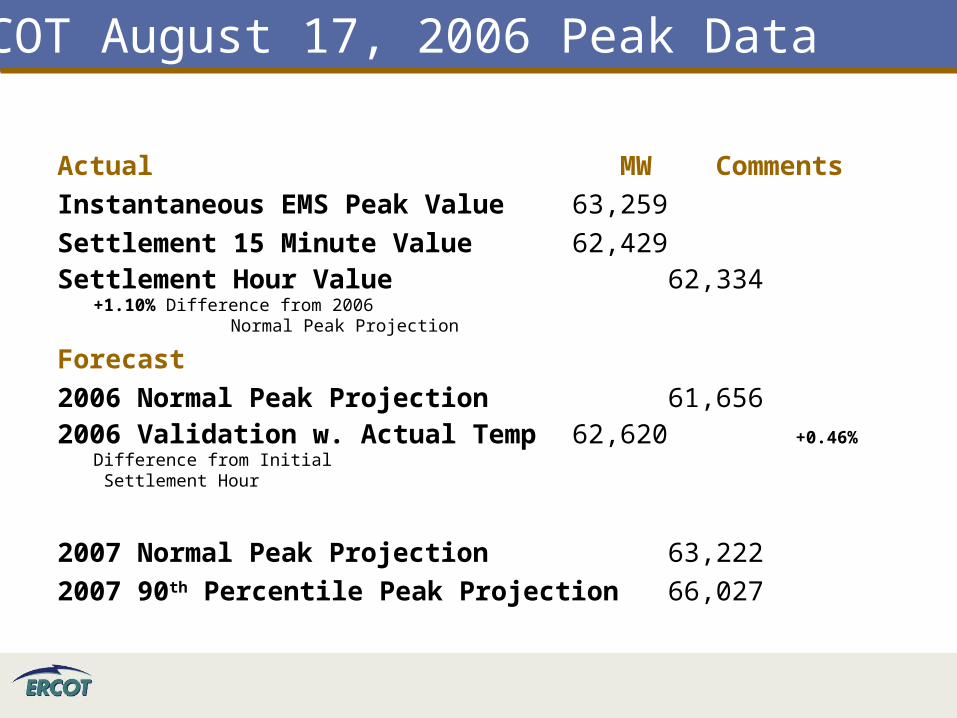
Actual MW Comments
Instantaneous EMS Peak Value 63,259
Settlement 15 Minute Value 62,429Settlement Hour Value 62,334 +1.10% Difference from
2006 Normal Peak Projection
Forecast
2006 Normal Peak Projection 61,6562006 Validation w. Actual Temp 62,620 +0.46% Difference from Initial
Settlement Hour
2007 Normal Peak Projection 63,222
2007 90th Percentile Peak Projection 66,027
ERCOT August 17, 2006 Peak Data
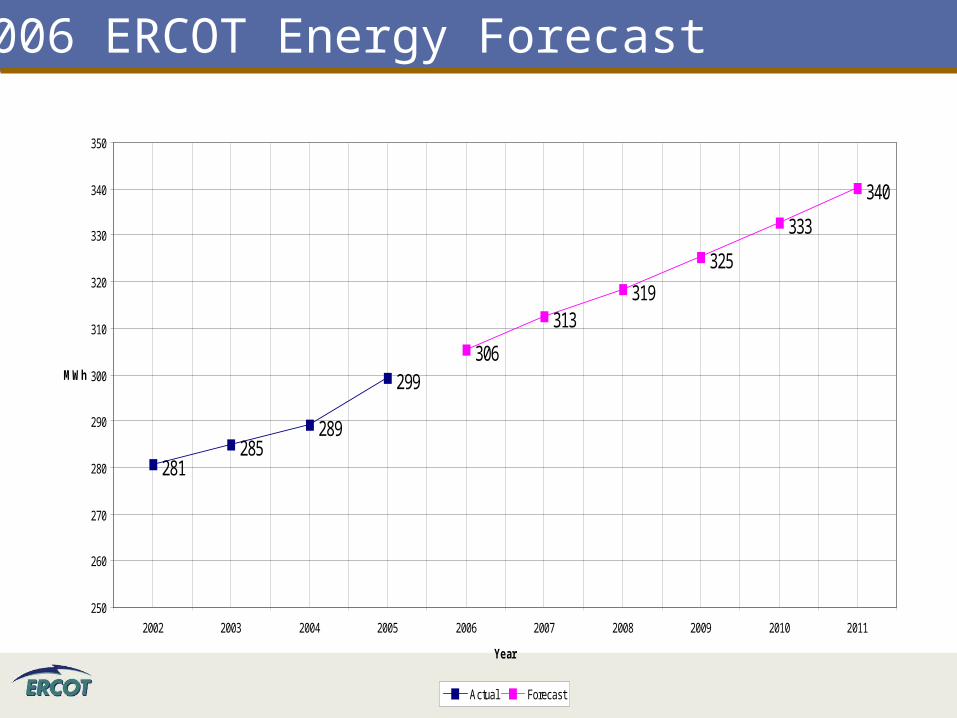
281285
289
299306
313319
325
333
340
250
260
270
280
290
300
310
320
330
340
350
2002 2003 2004 2005 2006 2007 2008 2009 2010 2011
Year
MWh
Actual Forecast
2.17% Avg. Growth
2006 ERCOT Energy Forecast
Historical and Forecasted Annual Energy
Historical and Forecasted Annual Energy

Questions?
Recommended