ETHANOL FROM CORN: CLEAN RENEWABLE FUEL FOR THE
FUTURE, OR DRAIN ON OUR RESOURCES AND POCKETS?
TAD W. PATZEK�, S-M. ANTI��, R. CAMPOS��, K. W. HA��, J. LEE��,B. LI��, J. PADNICK�� and S.-A. YEE��
Department of Civil and Environmental Engineering, University of California 437 Davis Hall, Berkeley,
CA 94720;
(�author for correspondence, e-mail: [email protected]; tel.: 510 642 3801)
(��Students in the Spring 2003 CE24 Freshman Seminar offered at U.C. Berkeley by the Civil
and Environmental Engineering Department)
(Received 18 June 2003; accepted 29 May 2004)
Abstract. It is shown here that one burns 1 gallon of gasoline equivalent in fossil fuels to pro-duce 1 gallon of gasoline equivalent as ethanol from corn. When this corn ethanol is burned asa gasoline additive or fuel, its use amounts to burning the same amount of fuel twice to drive acar once. Therefore, the fuel efficiency of those cars that burn corn ethanol is halved. The wide-spread use of corn ethanol will cause manifold damage to air, surface water, soil and aquifers.The overall energy balance of corn conversion to ethanol demonstrates that 65% of the inputenergy is lost during the conversion. Carbon dioxide sequestration by corn is nullified when cornethanol is burned, and there will be additional carbon dioxide, nitrous oxides, and sulfur oxideemissions from the fossil fuels used to produce the ethanol.
Key words: carbon dioxide, corn, energy balance, ethanol, fuel, nitrate, oxygenate, pollution, sequestration.
1. Background
Previous government policies, the Alternative Motor Fuels Act of 1988 (AMFA, 1988),
and the Clean Air Act Amendments (EPA, 2003a) of 1990, have mandated the use of
oxygenates in gasoline in the designated areas of the country, as well as the use of alter-
native fuels, hoping to improve air quality and reduce greenhouse gas emissions. Never-
theless, in 2001, 130 billion gallons of gasoline were burned in the U.S. (EIA, 2003).
Consequently, a quarter of all greenhouse gas emissions and up to three quarters of
chemicals that pollute the air, causing smog and health problems, come from motor
vehicles (EPA, 2003b). Ethanol is seen by some as the answer to these concerns, provid-
ing an environmentally sustainable way of reducing emissions when burning gasoline
and helping to decrease oil consumption in the U.S. The recently passed Energy Policy
Act of 2003, requires states to use 5 billion gallons of ethanol per year by 2012. But
would this legislation, and such a strong emphasis on ethanol, actually benefit us and
the environment? The short answer is no, and this paper explains why.
Readers should send their comments on this paper to: [email protected] within 3 months of pub-
lication of this issue.
Environment, Development and Sustainability (2005) 7: 319–336 � Springer 2005
DOI 10.1007/s10668-004-7317-4
2. Gasoline and additives
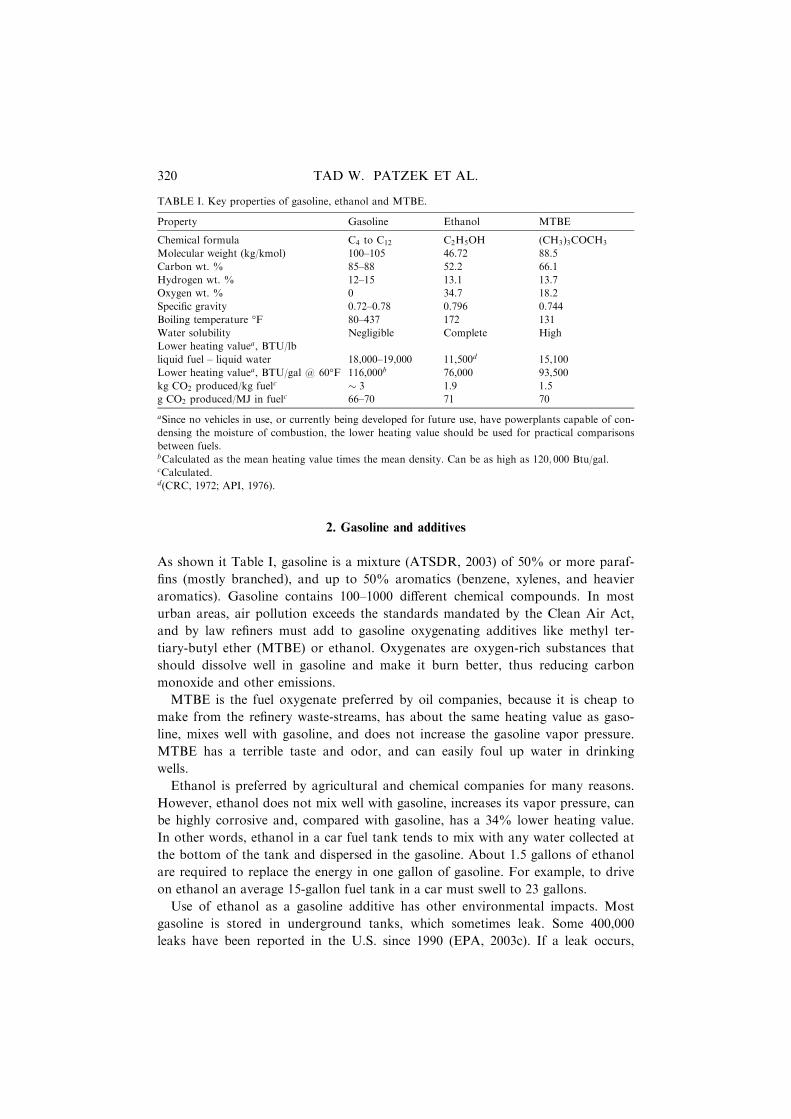
As shown it Table I, gasoline is a mixture (ATSDR, 2003) of 50% or more paraf-
fins (mostly branched), and up to 50% aromatics (benzene, xylenes, and heavier
aromatics). Gasoline contains 100–1000 different chemical compounds. In most
urban areas, air pollution exceeds the standards mandated by the Clean Air Act,
and by law refiners must add to gasoline oxygenating additives like methyl ter-
tiary-butyl ether (MTBE) or ethanol. Oxygenates are oxygen-rich substances that
should dissolve well in gasoline and make it burn better, thus reducing carbon
monoxide and other emissions.
MTBE is the fuel oxygenate preferred by oil companies, because it is cheap to
make from the refinery waste-streams, has about the same heating value as gaso-
line, mixes well with gasoline, and does not increase the gasoline vapor pressure.
MTBE has a terrible taste and odor, and can easily foul up water in drinking
wells.
Ethanol is preferred by agricultural and chemical companies for many reasons.
However, ethanol does not mix well with gasoline, increases its vapor pressure, can
be highly corrosive and, compared with gasoline, has a 34% lower heating value.
In other words, ethanol in a car fuel tank tends to mix with any water collected at
the bottom of the tank and dispersed in the gasoline. About 1.5 gallons of ethanol
are required to replace the energy in one gallon of gasoline. For example, to drive
on ethanol an average 15-gallon fuel tank in a car must swell to 23 gallons.
Use of ethanol as a gasoline additive has other environmental impacts. Most
gasoline is stored in underground tanks, which sometimes leak. Some 400,000
leaks have been reported in the U.S. since 1990 (EPA, 2003c). If a leak occurs,
TABLE I. Key properties of gasoline, ethanol and MTBE.
Property Gasoline Ethanol MTBE
Chemical formula C4 to C12 C2H5OH (CH3)3COCH3
Molecular weight (kg/kmol) 100–105 46.72 88.5
Carbon wt. % 85–88 52.2 66.1
Hydrogen wt. % 12–15 13.1 13.7
Oxygen wt. % 0 34.7 18.2
Specific gravity 0.72–0.78 0.796 0.744
Boiling temperature �F 80–437 172 131
Water solubility Negligible Complete High
Lower heating valuea, BTU/lb
liquid fuel – liquid water 18,000–19,000 11,500d 15,100
Lower heating valuea, BTU/gal @ 60�F 116,000b 76,000 93,500
kg CO2 produced/kg fuelc � 3 1.9 1.5
g CO2 produced/MJ in fuelc 66–70 71 70
aSince no vehicles in use, or currently being developed for future use, have powerplants capable of con-
densing the moisture of combustion, the lower heating value should be used for practical comparisons
between fuels.bCalculated as the mean heating value times the mean density. Can be as high as 120; 000 Btu/gal.cCalculated.d(CRC, 1972; API, 1976).
320 TAD W. PATZEK ET AL.
ethanol and gasoline contaminate soil and dissolve into groundwater. Ethanol is
liked so much by the soil bacteria that they will metabolize it before anything else,
including gasoline hydrocarbons (Powers et al., 2001). When these bacteria no
longer consume gasoline components, the subsurface plumes of gasoline spread
farther, and can poison more water wells. Hence, presence of ethanol in ground-
water may exacerbate problems (Rice et al., 1999) with the existing soil pollution.
3. Real problems with ethanol
It takes a lot of energy from methane, oil, and coal to produce corn, and even
more fossil energy to convert the corn feedstock into ethanol (Pimentel, 1991,
2001, 2003; Keeney and DeLuca, 1992). In 2001, corn in the U.S. was harvested
from roughly 70 million acres with an average yield of 135 bushels per acre
(1 bushel of corn is defined as 56 pounds of corn kernels with 15% of moisture
content, equivalent to an 8-gallon bucket), for a total of 9 billion bushels (USDA,
2003). To produce this corn, farmers applied 9 billion pounds of nitrogen fertil-
izer, 3 billion pounds of phosphate fertilizer, and 4 billion pounds of potash
(USDA, 2003). In Kentucky alone, with corn on 1.2 million acres, 2.7 million
pounds of pesticides and herbicides were applied (KASS, 2002).
When one analyzes the energy inputs to corn production in the U.S., such as
fertilizer, pesticides and herbicides, machinery, fuel, irrigation, drying, and trans-
portation, only 3.65 times more energy can be gained from corn than was used to
produce it (Pimentel, 2003). In other words, to produce from corn the amount of
energy equivalent to 3.65 gallons of gasoline, one has to burn 1 gallon of gasoline
equivalent in fossil fuels1. Conversion of corn to ethanol by fermentation and dis-
tillation requires even more fossil energy. In the end, about 2.66 gallons of ethanol
are obtained2 (Shapouri et al., 2002) from one bushel of corn. During the corn
conversion process, more fossil energy is used, and additional environmental pol-
lution from the waste streams, water, gases and solids, is generated.
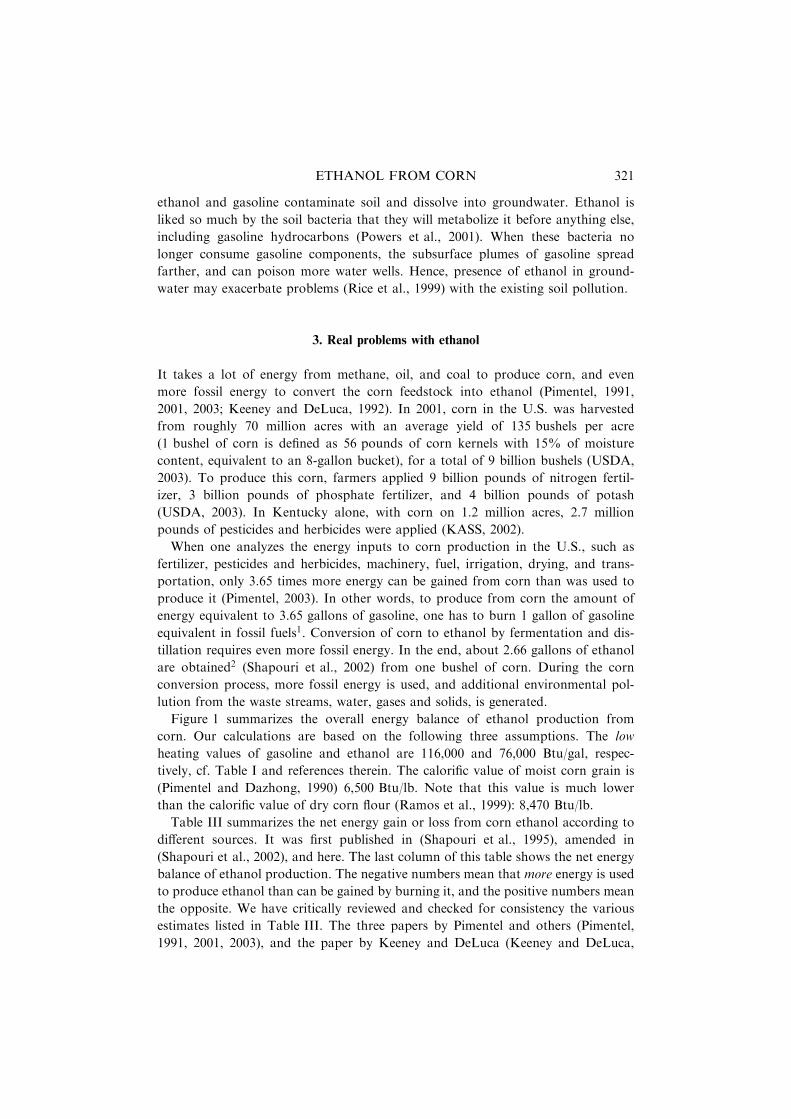
Figure 1 summarizes the overall energy balance of ethanol production from
corn. Our calculations are based on the following three assumptions. The low
heating values of gasoline and ethanol are 116,000 and 76,000 Btu/gal, respec-
tively, cf. Table I and references therein. The calorific value of moist corn grain is
(Pimentel and Dazhong, 1990) 6,500 Btu/lb. Note that this value is much lower
than the calorific value of dry corn flour (Ramos et al., 1999): 8,470 Btu/lb.
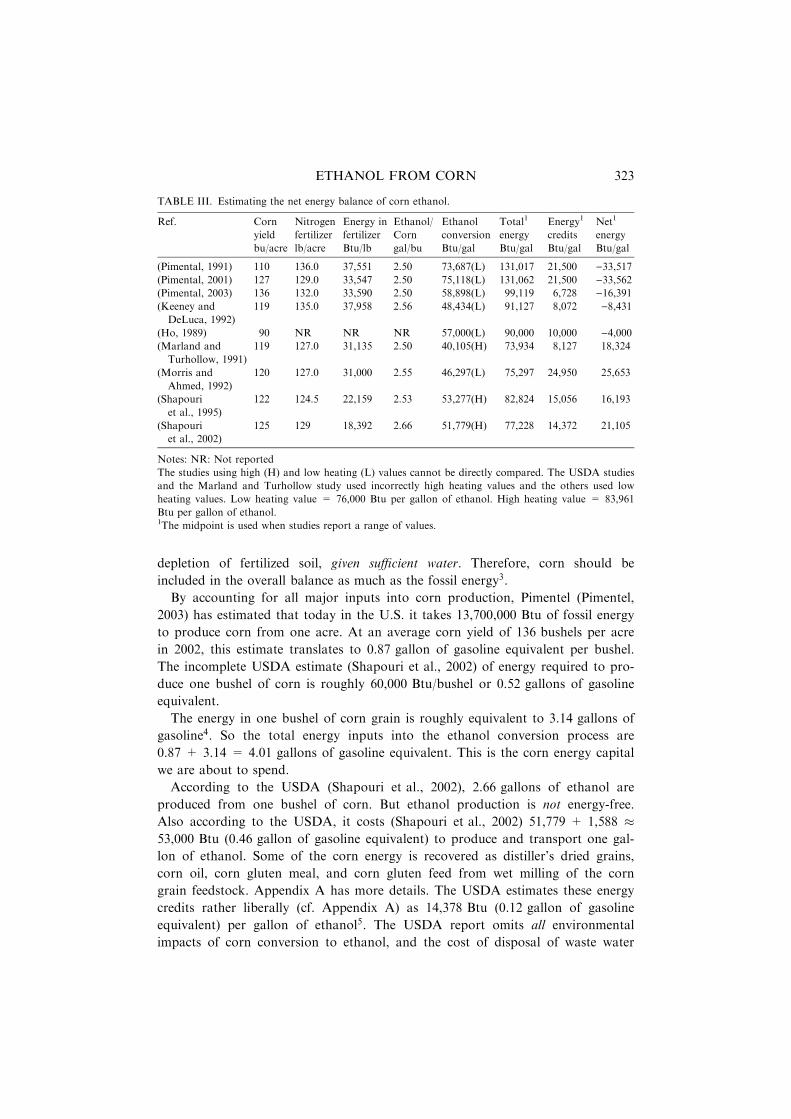
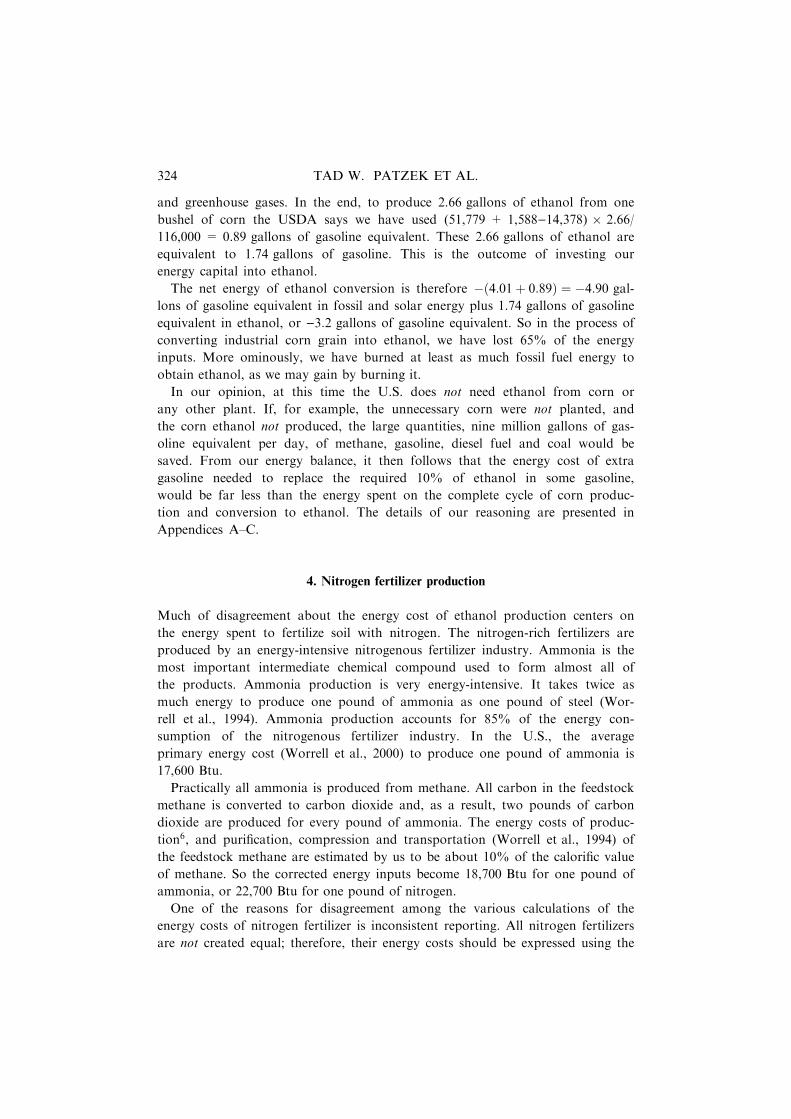
Table III summarizes the net energy gain or loss from corn ethanol according to
different sources. It was first published in (Shapouri et al., 1995), amended in
(Shapouri et al., 2002), and here. The last column of this table shows the net energy
balance of ethanol production. The negative numbers mean that more energy is used
to produce ethanol than can be gained by burning it, and the positive numbers mean
the opposite. We have critically reviewed and checked for consistency the various
estimates listed in Table III. The three papers by Pimentel and others (Pimentel,
1991, 2001, 2003), and the paper by Keeney and DeLuca (Keeney and DeLuca,
321ETHANOL FROM CORN
1992) report negative net energy for ethanol. The conference paper by Ho (Ho,
1989) is not quite complete, but it also estimates the net ethanol energy to be nega-
tive. All others, most notably the USDA, report net energy gain from ethanol. We
have found Pimentel’s numbers to be consistent and reliable. The USDA uses the
unjustified high heating value for ethanol and omits some of the energy inputs. The
2002 USDA report builds upon the 1997 Argonne National Laboratory Report
(Wang et al., 1997), which is analyzed in more detail in Appendix A.
In all prior analyses, the issue of the solar energy locked in the corn feedstock
was put aside. For the reasons explained in Appendix C, the rate of energy
accumulation in corn is controlled not by the solar energy flux, but by the rate of
EnergyInputs
OutputsEnergy
A B 1 bushel of corn
Ethanol
0 0.87 1.76 4.90
Cumulative gallons of gasoline equivalent
Fossil Soil + Water + Sun
Fossil
EnergyLoss
Figure 1. Energy balance of ethanol production from 1 bushel of corn. All energy components are ex-
pressed as gallons of gasoline equivalent. Bar A is the fossil energy spent on growing corn, and bar B is the
fossil energy of corn conversion to ethanol. The energy stored in corn is controlled by the availability of
soil water and aqueous nutrients (the solar energy is inexhaustible). Therefore, the corn bar represents the
energy inputs from the environment, which in return is degraded by the corn. The Sun acts as a catalyst, it
facilitates the energy sequestration, but remains unchanged by it. For details, see Appendix C.
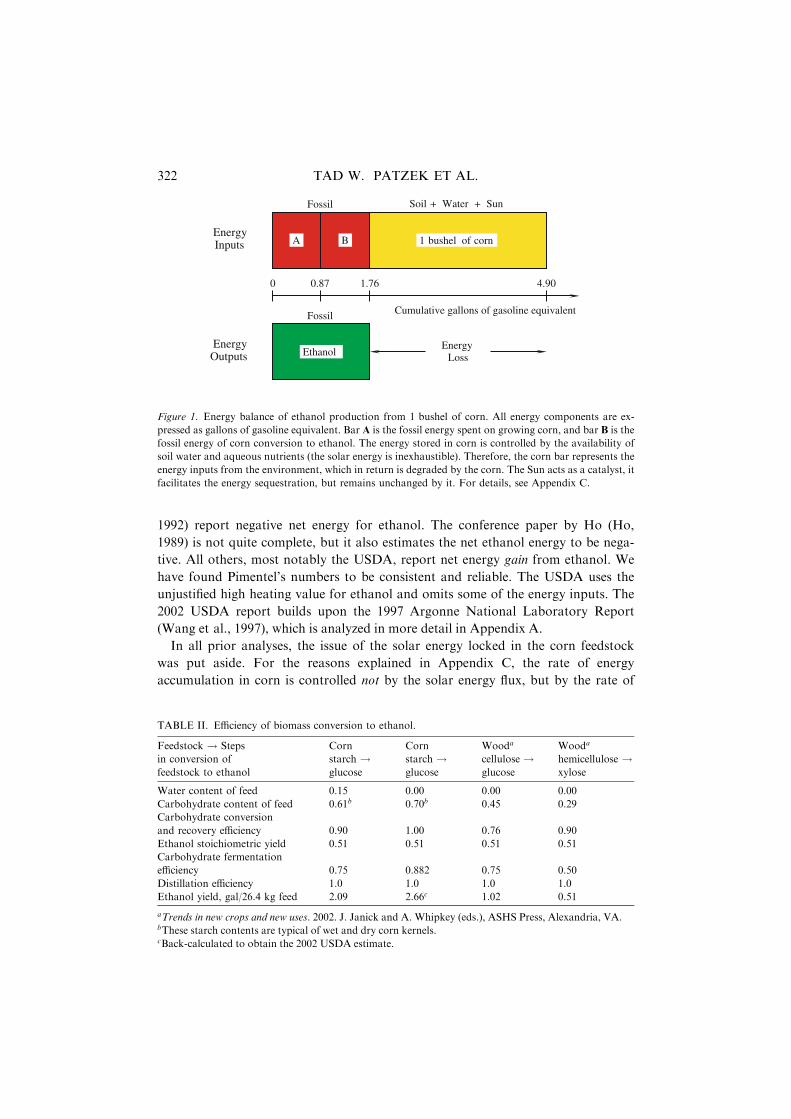
TABLE II. Efficiency of biomass conversion to ethanol.
Feedstock ! Steps
in conversion of
feedstock to ethanol
Corn
starch !glucose
Corn
starch !glucose
Wooda
cellulose !glucose
Wooda
hemicellulose !xylose
Water content of feed 0.15 0.00 0.00 0.00
Carbohydrate content of feed 0.61b 0.70b 0.45 0.29
Carbohydrate conversion
and recovery efficiency 0.90 1.00 0.76 0.90
Ethanol stoichiometric yield 0.51 0.51 0.51 0.51
Carbohydrate fermentation
efficiency 0.75 0.882 0.75 0.50
Distillation efficiency 1.0 1.0 1.0 1.0
Ethanol yield, gal/26.4 kg feed 2.09 2.66c 1.02 0.51
aTrends in new crops and new uses. 2002. J. Janick and A. Whipkey (eds.), ASHS Press, Alexandria, VA.bThese starch contents are typical of wet and dry corn kernels.cBack-calculated to obtain the 2002 USDA estimate.
322 TAD W. PATZEK ET AL.
depletion of fertilized soil, given sufficient water. Therefore, corn should be
included in the overall balance as much as the fossil energy3.
By accounting for all major inputs into corn production, Pimentel (Pimentel,
2003) has estimated that today in the U.S. it takes 13,700,000 Btu of fossil energy
to produce corn from one acre. At an average corn yield of 136 bushels per acre
in 2002, this estimate translates to 0.87 gallon of gasoline equivalent per bushel.
The incomplete USDA estimate (Shapouri et al., 2002) of energy required to pro-
duce one bushel of corn is roughly 60,000 Btu/bushel or 0.52 gallons of gasoline
equivalent.
The energy in one bushel of corn grain is roughly equivalent to 3.14 gallons of
gasoline4. So the total energy inputs into the ethanol conversion process are
0.87 + 3.14 = 4.01 gallons of gasoline equivalent. This is the corn energy capital
we are about to spend.
According to the USDA (Shapouri et al., 2002), 2.66 gallons of ethanol are
produced from one bushel of corn. But ethanol production is not energy-free.
Also according to the USDA, it costs (Shapouri et al., 2002) 51,779 + 1,588 �53,000 Btu (0.46 gallon of gasoline equivalent) to produce and transport one gal-
lon of ethanol. Some of the corn energy is recovered as distiller’s dried grains,
corn oil, corn gluten meal, and corn gluten feed from wet milling of the corn
grain feedstock. Appendix A has more details. The USDA estimates these energy
credits rather liberally (cf. Appendix A) as 14,378 Btu (0.12 gallon of gasoline
equivalent) per gallon of ethanol5. The USDA report omits all environmental
impacts of corn conversion to ethanol, and the cost of disposal of waste water
TABLE III. Estimating the net energy balance of corn ethanol.
Ref. Corn
yield
bu/acre
Nitrogen
fertilizer
lb/acre
Energy in
fertilizer
Btu/lb
Ethanol/
Corn
gal/bu
Ethanol
conversion
Btu/gal
Total1
energy
Btu/gal
Energy1
credits
Btu/gal
Net1
energy
Btu/gal
(Pimental, 1991) 110 136.0 37,551 2.50 73,687(L) 131,017 21,500 )33,517(Pimental, 2001) 127 129.0 33,547 2.50 75,118(L) 131,062 21,500 )33,562(Pimental, 2003) 136 132.0 33,590 2.50 58,898(L) 99,119 6,728 )16,391(Keeney and
DeLuca, 1992)
119 135.0 37,958 2.56 48,434(L) 91,127 8,072 )8,431
(Ho, 1989) 90 NR NR NR 57,000(L) 90,000 10,000 )4,000(Marland and
Turhollow, 1991)
119 127.0 31,135 2.50 40,105(H) 73,934 8,127 18,324
(Morris and
Ahmed, 1992)
120 127.0 31,000 2.55 46,297(L) 75,297 24,950 25,653
(Shapouri
et al., 1995)
122 124.5 22,159 2.53 53,277(H) 82,824 15,056 16,193
(Shapouri
et al., 2002)
125 129 18,392 2.66 51,779(H) 77,228 14,372 21,105
Notes: NR: Not reported
The studies using high (H) and low heating (L) values cannot be directly compared. The USDA studies
and the Marland and Turhollow study used incorrectly high heating values and the others used low
heating values. Low heating value = 76,000 Btu per gallon of ethanol. High heating value = 83,961
Btu per gallon of ethanol.1The midpoint is used when studies report a range of values.
323ETHANOL FROM CORN
and greenhouse gases. In the end, to produce 2.66 gallons of ethanol from one
bushel of corn the USDA says we have used (51,779 + 1,588)14,378) � 2.66/
116,000 = 0.89 gallons of gasoline equivalent. These 2.66 gallons of ethanol are
equivalent to 1.74 gallons of gasoline. This is the outcome of investing our
energy capital into ethanol.
The net energy of ethanol conversion is therefore �ð4:01þ 0:89Þ ¼ �4:90 gal-
lons of gasoline equivalent in fossil and solar energy plus 1.74 gallons of gasoline
equivalent in ethanol, or )3:2 gallons of gasoline equivalent. So in the process of
converting industrial corn grain into ethanol, we have lost 65% of the energy
inputs. More ominously, we have burned at least as much fossil fuel energy to
obtain ethanol, as we may gain by burning it.
In our opinion, at this time the U.S. does not need ethanol from corn or
any other plant. If, for example, the unnecessary corn were not planted, and
the corn ethanol not produced, the large quantities, nine million gallons of gas-
oline equivalent per day, of methane, gasoline, diesel fuel and coal would be
saved. From our energy balance, it then follows that the energy cost of extra
gasoline needed to replace the required 10% of ethanol in some gasoline,
would be far less than the energy spent on the complete cycle of corn produc-
tion and conversion to ethanol. The details of our reasoning are presented in
Appendices A–C.
4. Nitrogen fertilizer production
Much of disagreement about the energy cost of ethanol production centers on
the energy spent to fertilize soil with nitrogen. The nitrogen-rich fertilizers are
produced by an energy-intensive nitrogenous fertilizer industry. Ammonia is the
most important intermediate chemical compound used to form almost all of
the products. Ammonia production is very energy-intensive. It takes twice as
much energy to produce one pound of ammonia as one pound of steel (Wor-
rell et al., 1994). Ammonia production accounts for 85% of the energy con-
sumption of the nitrogenous fertilizer industry. In the U.S., the average
primary energy cost (Worrell et al., 2000) to produce one pound of ammonia is
17,600 Btu.
Practically all ammonia is produced from methane. All carbon in the feedstock
methane is converted to carbon dioxide and, as a result, two pounds of carbon
dioxide are produced for every pound of ammonia. The energy costs of produc-
tion6, and purification, compression and transportation (Worrell et al., 1994) of
the feedstock methane are estimated by us to be about 10% of the calorific value
of methane. So the corrected energy inputs become 18,700 Btu for one pound of
ammonia, or 22,700 Btu for one pound of nitrogen.
One of the reasons for disagreement among the various calculations of the
energy costs of nitrogen fertilizer is inconsistent reporting. All nitrogen fertilizers
are not created equal; therefore, their energy costs should be expressed using the
324 TAD W. PATZEK ET AL.
common reference: nitrogen content. For example, ammonia contains 14/17 of
nitrogen, therefore the energy cost of 18,700 Btu/lb of ammonia is equal to 17/
14 � 18,700 = 22,700 Btu/lb of nitrogen in the ammonia.
Ammonia is used as feedstock to produce urea, nitric acid and ammonium
nitrate. For example, the primary energy needed to produce urea is 28,800 Btu/lb
of nitrogen in urea fertilizer (Worrell et al., 1994). Finally the fertilizer must be
packaged, transported to the distribution points, and to farms. Let us add another
10% energy penalty for all these activities. Now the energy inputs total
31,700 Btu/lb of nitrogen in urea. It is not clear if the energy of applying the
nitrogen fertilizers in the field was taken into account in all the calculations pre-
sented in Table III. If it were not (it was included by Prof. Pimentel (Pimentel,
1991, 1996, 2003), then the energy cost of fertilizer would go up again. In sum-
mary, our estimate of the total energy per pound of nitrogen fertilizer is close to
the latest Pimentel number (Pimentel, 2003), rather than to the 2002 USDA
(Shapouri et al., 2002) number.
5. Environmental impacts of ethanol production
Modern corn hybrids are the greediest of plants demanding more nitrogen fertil-
izer and pesticide than any other food crop (Pollan, 2002). In the U.S., corn pro-
duction erodes soil about 18 times faster (Pimentel, 1996) than it can be reformed.
As a result, the soil is being heavily mined by the intensive corn agriculture. In
irrigated acreage, groundwater is being mined much faster than the recharge rate,
and midwestern states will face soon (Egan, 2001; USGS, 2003; NPGCD, 2003) a
severe water shortage. In 1990, irrigation was responsible for about 96% of the
20 km3 of water withdrawn from the gigantic Ogallala aquifer (Rosenberg et al.,
1999) that underlies the High Plains states. In addition, ethanol production
requires huge amounts of water: 35 gallons per bushel of corn (Pimentel, 2003).
Ethanol production from corn causes environmental degradation from global
warming gas emissions, fertilizer and herbicide run off, and waste water from the
production process.
Ethanol-in-gasoline seriously pollutes the air. The reactivity of the combined
exhaust and evaporative emissions using the ethanol-blended reformulated gaso-
line is estimated to be about 17% larger than those using the MTBE-blended
reformulated gasoline (NRC, 1999). Ethanol does reduce the carbon monoxide
emissions, but increases those of nitrogen oxides (NOx), acetaldehyde, and per-
oxy-acetyl-nitrate (PAN) (Rice et al., 1999). Finally, all the energy contained in
corn-ethanol comes from fossil fuels, with their own emissions. In Appendix B it
is shown that carbon dioxide sequestration by corn disappears when ethanol is
produced from it, and there is no difference between the corn ethanol fuel and
gasoline in CO2 emissions.
In addition, because of its corrosive properties, ethanol cannot be transported
by the existing U.S. pipeline network. Therefore, transportation by train and truck
325ETHANOL FROM CORN
will be the two main alternatives, which will further increase vehicle emissions
associated with ethanol use. Ethanol will be blended into gasoline at bulk termi-
nals. The ethanol-containing-gasoline (E10) will then be trucked to the individual
gas stations, just as it is today. The only difference will be the E10’s somewhat
lower energy content and higher price7.
6. Conclusions
The rate of sequestration of the unlimited solar energy as organic plant matter is
controlled by the availability of water in soil, and the minerals dissolved in this
water. For the reasons explained in Appendix C, water and soil nutrients are finite
and easily degradable. Therefore, we have chosen to include the energy stored in
the harvested corn kernels in the overall energy balance of corn conversion to eth-
anol. With this assumption, 65% of the energy inputs are lost during the entire
cycle of corn production and conversion to ethanol.
In addition, as much fossil energy is used to produce corn ethanol as can be
gained from it: one burns roughly one gallon of gasoline equivalent in fossil fuels
to produce 1.5 gallons of ethanol from corn. When this ethanol is burned as fuel,
it generates the same carbon dioxide emissions as gasoline (Appendix B), and
increases emissions of nitrogen oxides. At the same time, vast quantities of farm
land are degraded, aquifers are depleted and contaminated, rivers, and the Gulf of
Mexico are polluted with fertilizer and pesticide run-off.
The often-quoted government studies in support of ethanol production from
corn, especially the 1997 Argonne National Laboratory Report, seem to be flawed.
In fact, our analysis (Appendix A) of the Argonne report, a predecessor to the
2002 USDA report, reveals that the energy costs of corn farming and ethanol pro-
duction calculated here are supported by the data, but not the conclusions, in
both these reports.
The stated goal of adding ethanol from corn to gasoline was to help in cleaning
the air we breath and lessen the U.S. dependance on foreign oil. The opposite is
achieved. Air is more polluted, and almost as much oil and more methane are
burned as without the corn ethanol. At the same time, additional health hazards
are created by the agricultural chemicals, fertilizers, pesticides and herbicides, and
by the waste water streams.
The government-mandated goal of 5 billion gallons of ethanol per year (13.7
million gallons per day) by 2012 will be achieved with 2 billion bushels of corn, or
over 20% of the current U.S. production. The production of this limited volume
of ethanol will require the U.S. to burn an additional 9 million gallons of gasoline
equivalent per day.
It would be beneficial to the U.S., and the world, if an independent scientific
panel analyzed the complex issues surrounding corn and its products, their rela-
tionship to other energy sources, and their social and environmental impacts.
326 TAD W. PATZEK ET AL.
Appendix A: Partial analysis of the argonne national laboratory report8
The debate on the total energy inputs of corn conversion to ethanol has become
politically charged and acrimonious9. Therefore, I felt that it is worthwhile to
scrutinize the 1997 Argonne National Laboratory report (Wang et al., 1997),
which is the predecessor of the 2002 USDA report (Shapouri et al., 2002). To my
knowledge, the 1997 Argonne report was also endorsed by the U.S. EPA, and
used to justify the EPA’s support for the increased reliance on corn ethanol in the
2003 Energy Policy Act.
The 1997 Argonne report was commissioned and paid for by the Illinois
Department of Commerce and Community Affairs, an organization in charge of
promoting ethanol production to provide ‘a huge boost ($4.5 billion) to the agri-
cultural sector in the Midwest10.’ The report’s purpose was to analyze the energy
inputs to ethanol production from corn and estimate their environmental impacts.
The study focused on Illinois (IL), Iowa (IO), Nebraska (NE) and Minnesota
(MN), which collectively produce about half of the U.S. corn and about 95% of
the U.S. ethanol. In his endorsement letter, the Governor of Illinois stressed that
‘the study survived a rigorous review process.’
In the Executive Summary, on page i, the authors state: ‘A weighted energy
intensity for corn farming of less than 20,000 Btu/bushel was calculated for the
four-state analysis, a value that should be considered conservative.’ On page ii,
they state that ‘‘Ongoing and future efficiency improvements from retrofits and
advanced new plant designs should bring average process11 energy requirements
well under 35,000 Btu/gallon for all mills.’’ Below, I analyze both these statements
in some detail. The authors also state that ‘‘dry mills are not economically sustain-
able absent ethanol production,. . .’’ and ‘‘Co-product energy use attribution
remains the single key factor in estimating ethanol’s relative benefits, because this
value can range from 0 to 50% depending on the attribution method chosen12.’’
On page 7 of the Argonne report, Table III-2, it turns out that the weighted
energy intensity of about 20,000 Btu/bushel, exactly 19,176 Btu/bushel, accounts
only for the authors’ estimate of the fossil fuels used directly in corn farming.
These fuels are: diesel fuel and equipment, gasoline equipment, LPG (liquified
petroleum gas) equipment, electricity, natural gas, custom work diesel, and haul-
ing. Before analyzing Table III-2, let us use IL and NE as examples, and analyze
their corn farming practices, summarized in Tables III-1 and III-3. In 1996, IL
planted corn on 11 million acres and achieved corn yield of 132 bushels/acre. NE
planted 8.5 million acres and achieved a higher yield of 141 bushels/acre of corn.
The overall fertilizer use in lb/acre was, IL: 168(N), 68(P), 97(K), and NE:
150(N), 29(P), 10(K). Thus, IL used 1.8 times more fertilizer per acre, and
achieved a lower yield than NE, but the total crop volumes were comparable.
With this background information, one would expect the fuel intensity of corn
growing to be also comparable, but higher in IL than in NE. In this context,
Table III-2 offers a surprise. The reported fuel use in IL, 12,603 Btu/bushel, is
three times lower than that in NE, 39,693 Btu/bushel! How could this be? Then we
327ETHANOL FROM CORN
find out that eight major entries in Table III-2 were essentially guesses. So, for
example, IL and IA had identical diesel equipment fuel use of 3,954 Btu/gal, but
NE reported 17,792 Btu/bushel, i.e., 4.5 times more! IL and NE reported identical
use of gasoline equipment, 3,554 Btu/bushel, while IA and MN both reported
2,665 Btu/bushel. Then, MN and NE used exactly the same amount of LPG fuel,
2,585 Btu/bushel. Finally, IL reported use of 437 Btu/bushel in natural gas (an
unreasonably low number), NE 11,716 Btu/bushel (27 times more), and the other
two states did not report any natural gas use. So the weighted estimate of natural
gas use that entered the final Argonne calculation was only 2,759 Btu/bushel. In
summary, Table III-2 in the Argonne report, which contains the main fossil fuel
requirements of corn farming, seems to be somewhat contrived. In fact, I suspect
that the NE fossil fuel energy inputs are closer to reality than the IL inputs.
To their estimate of energy-intensity of corn farming, the authors apparently
forgot to add the costs of nitrogen, phosphate and potash fertilizers, whose appli-
cation rates are listed in Table III-3 of their report. A short calculation, using the
specific fertilizer energy intensities on page 8, yields another 25,000 Btu/bushel. In
the Argonne study, the specific energy of producing nitrogen fertilizer is
21,000 Btu/pound of nitrogen. The Argonne estimate is substantially lower than
the ones proposed by us. On page 8, the authors claim that ‘‘. . .there has been a
substantial improvement since the early 1980s, with net energy intensity13 being
reduced by up to 40 percent on average.’’ It may be so, but Dr. Ernst Worrell
(Worrell et al., 1994, 2000), tells us that (1) the U.S. nitrogen fertilizer plants are
in general relatively old and not very efficient; (2) the engineers often do not know
their plant efficiency; and (3) the capital costs for a new greenfield ammonia plant
are estimated at $300 per ton annual capacity, and the profit margins in fertilizer
plants are so thin14 that no new investments are forthcoming.
The authors also forgot to add the energy cost of pesticides and herbicides. From
their Tables III-4 and III-5, these costs are 2,200 and 160 Btu/bushel, respectively.
So far the energy intensity of corn production is 19,176+25,010+
2,173 + 156 = 46,500 Btu/bushel, and not the 20,000 Btu/bushel in the Executive
Summary.
Corn, fertilizers, pesticides, herbicides, diesel fuel, gasoline, LPG, coal, etc., must
all be transported. The authors estimate that 50/50 transport by barge and rail costs
294,940 Btu/ton of corn or 8,300 Btu/bushel. On page 13, they further estimate the
truck energy intensity to be 100,000–220,000 Btu/ton of corn, depending on the
truck weight. With a 50/50 split, transport by truck adds another 4,600 Btu/bushel.
So far we have accumulated 46,500 + 8,300 + 4,600 = 59,400 Btu/bushel of corn.
Finally, apparently, in IL, IA, MN and NE no energy is spent on the irrigation
of corn fields, and the authors side-step this issue altogether. If there were some
irrigation15 in these four states, it might add another (Pimentel, 2003) 3,500 Btu/
bushel of corn in energy expenditures. Please note that the water-related energy
expenditures are relatively small.
The total energy cost of producing corn is not 20,000, but 63,000 Btu/bushel of
corn, or 0.54 gallons of gasoline equivalent. I remind the Reader, that by missing
328 TAD W. PATZEK ET AL.
some of the energy inputs16, and by underestimating the fuel and nitrogen fertil-
izer costs, the 20,000 Btu/bushel Argonne estimate, corrected here to 63,000 Btu/
bushel, is still too low17. A more appropriate estimate of the total energy cost of
growing corn is our 0.87 gallons of gasoline equivalent per bushel of corn.
Now, let us focus on the energy cost of corn conversion to ethanol by wet mill-
ing. In this process, the water-soaked corn kernels are ground, their fiber and
germs are separated from starch, the starch is hydrolyzed enzymatically to glucose,
the glucose is fermented to an industrial beer, and the beer is distilled and dehy-
drated to obtain ethanol. These complex wet milling operations require massive
amounts of heat, mostly from burning coal18, and huge amounts of process water
(35 gallons per bushel of corn (Pimentel, 2003)).
The energy costs of corn conversion to ethanol, listed in Table III-9, are 48,862,
46,380, 54,977, 51,000–53,000, 53,089, 45,000–50,000, 40,000–50,000 Btu/gallon of
ethanol, depending on the study. There is also one unverified number, 34,000 Btu/
gallon, based on an oral communication from someone by the name C. Reeder,
who apparently worked at Archer Daniels Midland (ADM) Corn Processing,
Decatour, IL. Then, on page 17, the authors talk about the benefits of conversion
from coal fuel to methane and cogeneration, and state: ‘‘In general, a reduction of
10% in energy use is readily achieved by cogeneration systems19. With this reduc-
tion rate, if all plants employ cogeneration systems20, the total energy consump-
tion in ethanol plants would be . . .40,300 Btu/gal for wet milling plants. In our
base case analysis, we assume that . . .100% of wet milling plants employ cogene-
ration systems. . .’’
Let us parse these statements. The arithmetic mean of all entries in Table III-
9, including the arbitrary number from ADM, is 47,800 Btu/gal. The authors
then take 0.9 � 47,800 = 43,000 Btu/gal as the number they will use to justify
the energy benefits of ethanol production. Note that the said 43,000 Btu/gal
becomes 40,300 in the Argonne report by a simple reversal of digits, a nice sav-
ings of 7% of the energy inputs. In my estimate, I will omit the outlier from a
source with an obvious conflict of interest, and use the mean of all other studies,
50,000 Btu/gal, also discounting the cogeneration savings as based on hearsay.
These 50,000 Btu/gal of ethanol, translate into 1.15 gallon of gasoline equivalent
per bushel of corn. Instead, the authors use in their Executive Summary the sin-
gle, undocumented outlier from ADM, �35,000 Btu/bushel, to represent the typ-
ical energy costs of corn conversion to ethanol. In fact, the subsequent 2002
USDA report, (Shapouri et al., 2002), uses 51,779 Btu/gal as the typical energy
of the conversion.
Now we must add the ethanol transportation costs and subtract energy credits.
The Argonne report is silent on the energy intensity of ethanol transportation
from ethanol plants to distribution centers and end-users. To first order, we can
use the just calculated transportation energy intensity by rail, barge and truck,
8,300 + 4,600 = 12,900 Btu/bushel of corn and divide it by the factor of
2.66 gallons of ethanol/bushel. The approximate result is 4,800 Btu/gal of ethanol,
three times as much as the 1,588 Btu/gal calculated in the USDA report.
329ETHANOL FROM CORN
I agree with the Argonne report that dry milling of corn is uneconomical given
its only byproduct, dried distiller’s grain (DDG), is a low quality cattle feed that
would never be able to compete with soybean, and is worth only 6,700 Btu/gal
(Pimentel, 2003) in energy credits. A wet milling plant, in contrast, can produce
starch, glucose, and high-fructose corn syrup (HFCS), one of the most pervasive
and harmful human food additives in the U.S. history (Pollan, 2002; Elliott et al.,
2002). Because HFCS competes with ethanol for the starch and glucose, it gets no
credit from ethanol production.
For a wet milling plant, the Argonne report assigns roughly 70% of the total
energy outlays to ethanol production (see Footnote 12), and 30% to byproducts:
corn gluten meal and germ. Corn gluten meal has the same value as a cattle
feed as DDG. The protein content of the gluten is about 45%. Soybean meal
that corn gluten is substituted for contains about 50% protein. As observed by
Prof. Pimentel (Pimentel, 2003), the corn protein resulting from the processing
of corn for ethanol production is replacing soybean meal. Thus, we should calcu-
late the benefits of corn protein based on its replacement of soybean protein. Soy-
bean protein requires significantly less energy to produce than corn protein
because the nitrogen fertilizer can be omitted in production. Soybeans will sup-
ply their own protein by nitrogen fixation without nitrogen fertilizer. Corn oil
can be further extracted from corn germ by using solvents. The two byproducts
are obtained after grinding (germ) and washing (gluten) corn kernels to separate
starch.
It is hard to imagine that the drying process and energy content of corn glu-
ten and germ should be given 30% of the entire energy required to produce
anhydrous ethanol. Bulk of this energy is spent on distilling (up to three times)
the corn beer, and dehydrating the 95% ethanol obtained in the distillation to
99.8%. It is also inconsistent for Argonne to say that DDG in dry milling is
uneconomical without ethanol, but the functionally identical corn gluten meal
should get a huge energy credit. I will therefore assign the same energy intensity
to the byproducts of wet milling as to those of dry milling, 6,700 Btu/gall of
ethanol. But corn gluten meal must be transported from the ethanol plant back
to farms. I will use the same estimate of the ethanol transportation costs,
4,800 Btu/gal, and multiply it by 0.3 to adjust for the gluten volume, obtaining
1,440 Btu/gal.
Finally, the corrected energy intensity of corn conversion to ethanol in the Argo-
nne report should be (50,000 + 4,800�6,700 + 1,440) � 2.66/116,000 = 1.14 gal-
lons of gasoline equivalent. If one adds the two corrected Argonne estimates of the
fossil energy costs of producing 2.66 gallons of ethanol from one bushel of corn,
namely, 0.54 gallon to grow the corn, and 1.14 gallons to convert it to ethanol, one
obtains 1.68 gallons of gasoline equivalent per 2.66 gallons of ethanol, or 1.74 gal-
lons of gasoline equivalent as ethanol. Thus, the corrected Argonne estimate of the
energy inputs of corn conversion to ethanol and our estimate are almost identical. Now
remember, to estimate the conversion energy of corn to ethanol, we have used the
2002 USDA numbers (Shapouri et al., 2002), which are based in large part on the
330 TAD W. PATZEK ET AL.
approach and data in the 1997 Argonne report. A more appropriate combination of
the energy inputs, would be to add 0.87 gallon of gasoline equivalent for corn pro-
duction and 1.14 gallons of gasoline equivalent for corn conversion, obtaining the
energy requirement of 2 gallons of gasoline equivalent to produce ethanol from one
bushel of corn. The last estimate is very close to those by Pimentel (Pimentel, 1996,
2001, 2003).
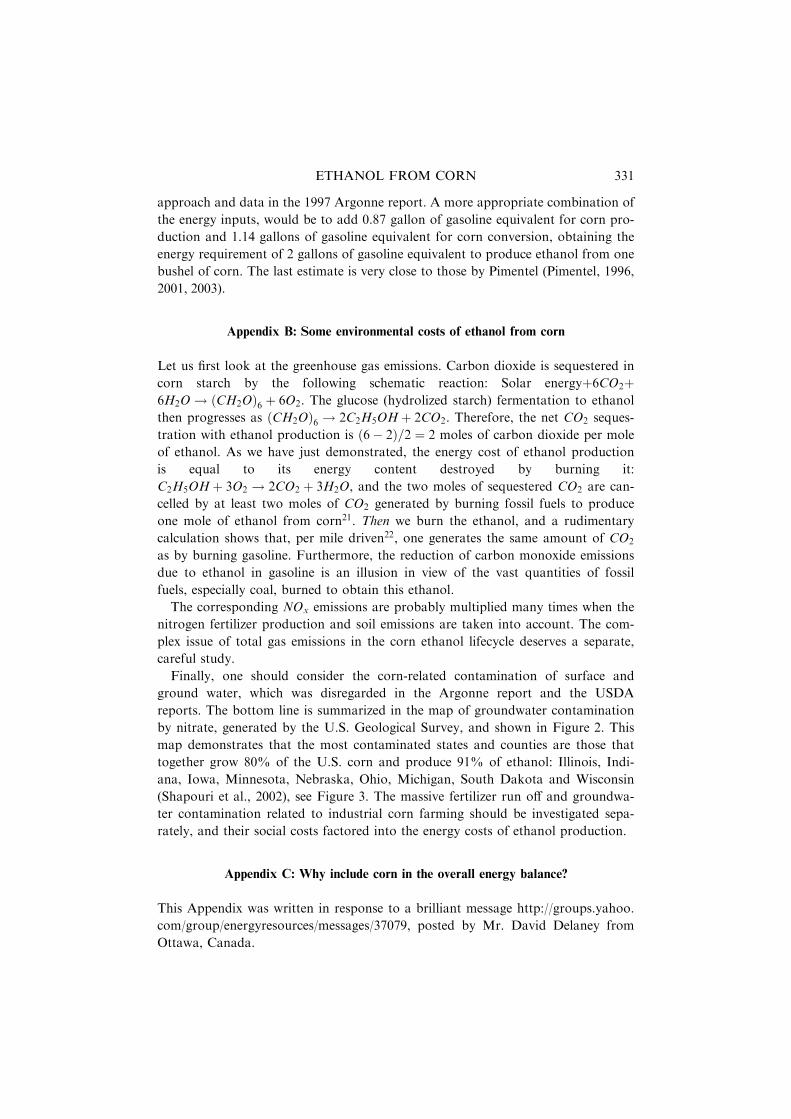
Appendix B: Some environmental costs of ethanol from corn
Let us first look at the greenhouse gas emissions. Carbon dioxide is sequestered in
corn starch by the following schematic reaction: Solar energyþ6CO2þ6H2O! ðCH2OÞ6 þ 6O2. The glucose (hydrolized starch) fermentation to ethanol
then progresses as ðCH2OÞ6 ! 2C2H5OHþ 2CO2. Therefore, the net CO2 seques-
tration with ethanol production is ð6� 2Þ=2 ¼ 2 moles of carbon dioxide per mole
of ethanol. As we have just demonstrated, the energy cost of ethanol production
is equal to its energy content destroyed by burning it:
C2H5OHþ 3O2 ! 2CO2 þ 3H2O, and the two moles of sequestered CO2 are can-
celled by at least two moles of CO2 generated by burning fossil fuels to produce
one mole of ethanol from corn21. Then we burn the ethanol, and a rudimentary
calculation shows that, per mile driven22, one generates the same amount of CO2
as by burning gasoline. Furthermore, the reduction of carbon monoxide emissions
due to ethanol in gasoline is an illusion in view of the vast quantities of fossil
fuels, especially coal, burned to obtain this ethanol.
The corresponding NOx emissions are probably multiplied many times when the
nitrogen fertilizer production and soil emissions are taken into account. The com-
plex issue of total gas emissions in the corn ethanol lifecycle deserves a separate,
careful study.
Finally, one should consider the corn-related contamination of surface and
ground water, which was disregarded in the Argonne report and the USDA
reports. The bottom line is summarized in the map of groundwater contamination
by nitrate, generated by the U.S. Geological Survey, and shown in Figure 2. This
map demonstrates that the most contaminated states and counties are those that
together grow 80% of the U.S. corn and produce 91% of ethanol: Illinois, Indi-
ana, Iowa, Minnesota, Nebraska, Ohio, Michigan, South Dakota and Wisconsin
(Shapouri et al., 2002), see Figure 3. The massive fertilizer run off and groundwa-
ter contamination related to industrial corn farming should be investigated sepa-
rately, and their social costs factored into the energy costs of ethanol production.
Appendix C: Why include corn in the overall energy balance?
This Appendix was written in response to a brilliant message http://groups.yahoo.
com/group/energyresources/messages/37079, posted by Mr. David Delaney from
Ottawa, Canada.
331ETHANOL FROM CORN
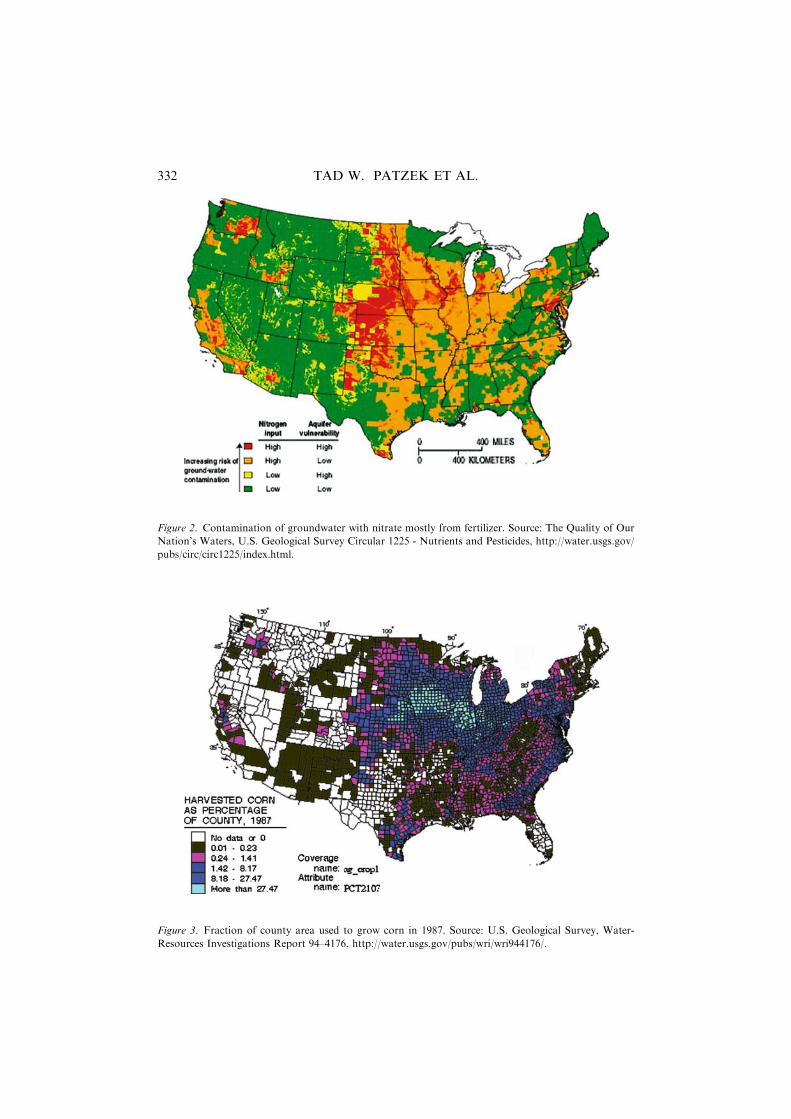
Figure 2. Contamination of groundwater with nitrate mostly from fertilizer. Source: The Quality of Our
Nation’s Waters, U.S. Geological Survey Circular 1225 - Nutrients and Pesticides, http://water.usgs.gov/
pubs/circ/circ1225/index.html.
Figure 3. Fraction of county area used to grow corn in 1987. Source: U.S. Geological Survey, Water-
Resources Investigations Report 94–4176, http://water.usgs.gov/pubs/wri/wri944176/.
332 TAD W. PATZEK ET AL.
Mr. Delaney’s key argument is: ‘‘The (Berkeley) paper treats the chemical
energy of the corn as virtual gasoline. It includes this virtual gasoline as energy
invested in the resulting ethanol. As a result, it always takes more energy in the
form of actual plus virtual gasoline to create a quantity of ethanol than is con-
tained in the ethanol. The paper concludes that this result shows that producing
ethanol from corn wastes energy. [In this note I take no position with respect to
the truth of the conclusion–it is the argument I am refuting.]. . .’’
My answer to Mr. Delaney is as follows. Corn is incipient gasoline. Let us con-
sider naturally growing corn that takes in only sun energy, precipitation as irriga-
tion, and the aqueous natural fertilizers from soil. Current solar energy alone is
not enough! Corn will not grow on concrete, or in bone-dry, nutrient-free sand.
Therefore, we always invest more into corn than mere solar energy. But water and
the soil nutrients are accumulated at different time scales than the annual corn
cycle. Therein lays the eventual demise of all plant-to-fossil-energy schemes,
including Mr. Delaney’s magic ‘‘ethanol plant,’’ or corn.
Given enough time, tens of millions of years, and the right conditions, our corn
will become crude oil (Hunt, 1996). Thus, nature will convert the corn free of
charge to more of something more energetic than ethanol. Then our distant
descendants might discover the converted corn, produce it, and refine to gasoline.
This is the absolutely optimal outcome for the Earth, but not for us.
Our civilization does not have time. Instead, using the ancient solar energy
in methane, coal and crude oil, we accelerate the incredibly slow natural pro-
cesses of energy sequestration and conversion, and strive to obtain a human-
made fossil fuel in annual cycles. But there is a price to pay. To make corn
grow fast, we apply plenty of fertilizers, and use up a lot of energy in ways
described so well by Prof. Pimentel and analyzed briefly in this paper. So we
act irreversibly on a time scale of human life: we deplete soil and mine ground-
water, and we also create an environmental mess: polluted rivers, aquifers, shal-
low seas, air, etc., which have their own restoration time scales, energy
requirements, and costs.
At this point, I would like to point back to Appendix B and remind the
Reader that the photosynthesis reaction can be written schematically as: Solar
Energy + Water + CO2 ! Glucose + Oxygen. Since both the solar energy
and CO2 are ‘‘inexhaustible,’’ it is the water (and the mineral nutrients dis-
solved in it, given appropriate soil) that limits the chemical energy accumula-
tion in corn. From this point of view, the sun acts as a chemical catalyst, it
facilitates the accumulation, but remains unchanged by it. Therefore, inclusion
of the calorific value of corn kernels in the energy inputs of the corn-to-ethanol
cycle serves a useful purpose.
I do not want the Reader to leave with an impression that other fossil energy
generation schemes, most notably the recovery and processing of crude oil and
natural gas, are free of conversion inefficiencies. When these inefficiencies are
taken into account, the net energy in gasoline, calculated by us as 116,000 Btu/
gal will decrease, sometimes dramatically. For example, all oil recovery schemes
333ETHANOL FROM CORN
which ‘‘melt’’ heavy crude oil with steam generated by burning fossil fuels, will
also suffer from an unfavorable net energy23 balance. It is well known that most
of the potentially recoverable oil in the Western Hemisphere, in Venezuela, Can-
ada and the U.S., is locked in the heavy and ultra-heavy (tar) crude oil depos-
its.
Acknowledgments
We thank Prof. David Pimentel of Cornell for the critique and several reviews of
the evolving manuscript, and kind words of encouragement. We thank Prof.
Clayton J. Radke of U.C. Berkeley and Mr. Matthew Small of the U.S. EPA for
their critique of the manuscript and suggestions of numerous improvements. Prof.
Radke’s persistent scepticism has sharpened our arguments immeasurably. Finally
we would like to thank Mr. Steve Shaffer of the California Department of Food
and Agriculture for his critique and arguments, which have been included in the
manuscript.
Notes
1 The calorific values of different fuels: natural gas, diesel, heating oil and coal, are expressed in terms
of the calorific value of gasoline.2 Most other sources report the yield of 2–2.5 gallons of ethanol per bushel, see Tables II and III.3 Mr. D. Delaney, http://groups.yahoo.com/group/energyresources/message/-36970, disagrees and
states that ‘The chemical energy of the corn comes entirely from the sun, and is not ‘‘invested’’ in
the corn at all. Energy is invested if it would remain available for human disposal if the project (in
this case growing the corn and making ethanol) were not implemented at all.’ Others in the same
discussion thread agree with our position, see Mr. Jack Dingler, Message 36,963, and many others.4 Based on the calorific value of corn kernels defined in the assumptions above.5 30% of the energy intensity of corn conversion to ethanol, see Appendix A.6 No one accounts for the energy cost of offshore platforms, and of drilling, operating and cleaning
deep gas wells.7 The higher ethanol-gasoline price is hidden from the consumer because of the federal and state
subsidies in excess of 53 cents/gallon of ethanol (Kheshgi et al., 2000) on top of the corn-grower
subsidies. Without these heavy subsidies, ethanol would not be competitive.8 This following three appendices were written by T. W. Patzek after the CE24 Freshman Seminar
had ended.9 The following excerpt is from the article, ‘‘Measure to Boost Production Of Ethanol Advances on
Hill,’’ by Peter Behr, which appeared in The Washington Post, June 3, 2003. ‘‘. . .The Renewable
Fuels Association says Pimentel’s data is out of date and inaccurate and his conclusions wrong. And
it adds a personal jab.’’ ‘‘Dr. Pimentel is out-of-the-mainstream on many issues,’’ RFA says. Studies
from the Energy and Agriculture Departments and the Argonne National Laboratory demonstrate
that ethanol production creates significantly more energy than it uses, RFA says. ‘‘The new data
suggests the amount of energy needed to produce ethanol is about 30 percent less than the value of
ethanol as a fuel,’’ Early adds.10 The words of Governor Jim Edgar, in his endorsement letter.11 Of corn conversion to ethanol, TWP.12 In plain English, an estimate of the energy costs of ethanol production can be cut in half by attribut-
ing some of the corn conversion costs to other by-products and processes.
334 TAD W. PATZEK ET AL.
13 Of nitrogen fertilizer production, TWP14 With the price of methane doubling in 2003, these margins grew even thinner.15 As Mr. S. Shaffer of the California Department of Food and Agriculture points out, some 90% of
the corn grown in the U.S. is rain-fed.16 Such as manufacturing and amortization of field machinery, tractors, trucks, irrigation systems and
pumps, corn silos, buildings, roads, fertilizer plants, herbicide and pesticide plants, methane gas
infrastructure, barges, railroads, environmental damage control, etc. (Pimentel, 2003).17 If the contrived mean fuel energy intensity of 19,176 Btu/bushel were replaced with the NE data, the
Argonne estimate would jump to 0.71 gallon of gasoline equivalent per bushel.18 According to Table III-8 in the Argonne report coal’s share of the total energy costs of ethanol pro-
duction is 80% now, and in the near future.19 This 10% reduction was apparently disclosed to the authors by Dr. Michael S. Graboski, but there
is no published corroboration.20 Currently, they do not, TWP.21 For example, three moles of CO2 are generated per two moles of N2 during production of ammonia
from methane: 3CH4 þ 2N2 þ 3O2 ! 4NH3 þ 3CO2. The shift to CO2 is never complete, and CO
and N2O are also generated. The remaining CO2 is generated by burning coal, gasoline, methane,
propane, and diesel fuel.22 See the bottom row in Table I.23 Net energy analysis seeks to compare the amount of energy delivered to society by a technology to
the total energy required to find, extract, process, deliver, and otherwise upgrade that energy to a
socially useful form.
References
AMFA: 1988, The Alternative Motor Fuels Act of 1988 (AMFA) is a federal statute (Public Law 100–
494) that encourages the development and widespread use of methanol, ethanol, and natural gas as
transportation fuels by consumers and the production of methanol, ethanol, and natural gas powered
vehicles.
API: July 1976, ‘Alcohols: A Technical Assessment of Their Application as Motor Fuels’. API Publica-
tion No. 4261, Washington, D.C.
ATSDR: 2003, ‘Agency for Toxic Substances and Discease Registry – Toxicological Profile Information
Sheet’. WWW. http://www.epa.gov/oar/caa/contents.html.
CRC: 1972, Handbook of Chemistry and Physics. Cleveland, OH: Praeger.
Egan, T.: 2001, ‘Near Vast Bodies of Water, Land Lies Parched’. New York Times, August 12.
EIA: 2003, ‘U.S. DOE – Energy Information Agency: Annual Energy Review 2001-Petroleum’.
WWW.http://www.atsdr.cdc.gov/toxprofiles/tp72–c3.pdf.
Elliott, S.S., Keim, N.L., Stern, J.S., Teff, K. and Havel, P.J.: 2002, ‘Fructose, weight gain, and the
insulin resistance syndrome’, American Journal of Clinical Nutrition 76, 911–22.
EPA: 2003a, Clean Air Act as amended in 1990. http://www.epa.gov/oar/caa/contents.html.
EPA: 2003b, U.S. EPA, Global Warming-Publications. http://yosemite.epa.gov/oar/globalwarming.nsf/
content/Resource Center Publications GHGEmissions.html.
EPA: 2003c, U.S. Environmental Protection Agency, Corrective Action Measures Archive, Data on
number of active and closed tanks, releases reported, cleanups initiated and completed, and emer-
gency responses, http://www.epa.gov/oust/cat/camarchv.htm.
Ho, S.P.: 1989, ‘Global Warming Impact of Ethanol Versus Gasoline’. In: National Conference, Clean
Air Issues and America’s Motor Fuel Business. Washington, D.C.
Hunt, J.M.: 1996, Petroleum Geochemistry and Geology. 2nd edn. New York: W.H.Freeman & Co.
KASS: 2002. WWW.Kentucky Agricultural Statistics Service.
Keeney, D.R. and DeLuca, T.H.: 1992, ‘Biomass as an Energy Source for the Midwestern U.S.’. Ameri-
can Journal of Alternative Agriculture 7, 137–143.
Kheshgi, H.S., Prince, R.C. and Marland, G.: 2000, ‘The Potential of Biomass Fuels in the Context of
Global Climate Change: Focus on Transportation Fuels’, Annual Review Energy and the Environment
25, 199–244.
335ETHANOL FROM CORN
Marland, G. and Turhollow, A.F.: 1991, ‘CO2 Emissions From the Production and Combustion of
Fuel Ethanol From Corn’. Report, Oak Ridge National Laboratory, Atmospheric and Climate
Research Division, Oak Ridge, Tennessee.
Morris, D. and Ahmed, I.: 1992, ‘How Much Energy Does it take to Make a Gallon of Ethanol?’.
Monograph (8 pages), Institute for Local Self-Reliance, Washington, D.C.
NPGCD: 2003, North Plains Groundwater Conservation District (NPGCD). http://www.npwd.org/
Ogallala.htm: The Ogallala Aquifer within the boundaries of the NPGCD is declining at an average
of 1.74 feet per year.
NRC: 1999, Ozone-Forming Potential of Reformulated Gasoline. Washington, D.C, National Academy
Press. National Research Concil Committee.
Pimentel, D.: 1991, ‘Ethanol Fuels: Energy Security, Economics, and the Environment’, Journal of
Agricultural and Environmental Ethics 4, 1–13. Bioscience TX537.A25.
Pimentel, D.: 1996, Food, Energy, and Society. Niwot, CO, University Press of Colorado.
Pimentel, D.: 2001, Encyclopedia of Physical Science and Technology, Chapt. The limits of biomass ener-
gy.3rd edn. New York, Academic Press.
Pimentel, D.: 2003, ‘Ethanol Fuels: Energy Balance, Economics, and Environmental Impacts are Nega-
tive’, Natural Resources and Research 12(2), 127–134.
Pimentel, D. and Dazhong, W.: 1990, Agroecology, Chapt. Technological changes in energy use in U.S.
agricultural production, New York, McGraw Hill, pp. 147–164.
Pollan, M.: 2002, ‘Industrial Corn – Destroying Our Health & Environment’. New York Times, July
18th, Op Ed.
Powers, S.E., Hunt, C.S., Heermann, S.E., Corseuil, H.X., Rice, D.W. and Alvarez, P.J.J.: 2001, ‘The
Transport and Fate of Ethanol and BTEX in Groundwater Contaminated by Gasohol’, Critical
Reviews in Environment Science and Technology 31, 79–123.
Ramos, A.J., Munoz, J., Marin, J.S., Sanchis, V., and Magan, N.: 1999, ‘Calorific losses in maize in
relation to colonisation by isolates of Aspergillus Ochraceus under different environmental condi-
tions’, Journal of Cereal Science 29, 177–183.
Rice, D.W. et al.: 1999, ‘Health and Environmental Assessment of the Use of Ethanol as a Fuel Oxy-
genate – Report to the California Environmental Policy Council in Response to Executive Order D-
5-99’. UCRL-AR-135949, Air Resources Board, Lawrence Livermore National Laboratory, CA.
Rosenberg, N.J., Epstein, D.J., Wang, D., Vail, L., Srinivasan, R. and Arnold, J.G.: 1999, ‘Possible
impacts of global warming on the hydrology of the Ogallala aquifer’, Climatic Change 42, 677–692.
Shapouri, H., Duffield, J.A. and Graboski M.S.: 1995, ‘Estimating the Net Energy Balance of Corn
Ethanol’. Agricultural Economic Report No. 721, U.S. Department of Agriculture, Economic
Research Service, Office of Energy and New Uses, Washington, D.C.
Shapouri, H., Duffield, J.A. and Wang, M.: 2002, ‘The Energy Balance of Corn Ethanol: An Update’.
Agricultural Economic Report No. 814, U.S. Department of Agriculture, Economic Research Ser-
vice, Office of the Chief Economist, Office of Energy Policy and New Uses, Washington, D.C.
USDA: 2003, WWW. U.S. Department of Agriculture. http://www.nass.usda.gov:81/ipedb/.
USGS: 2003, ‘Water-level changes 1980–1997, and saturated thickness, 1996–97, in the High Plains
Aquifer’. U.S. Geological Survey. http://www-ne.cr.usgs.gov/highplains/hp97�web�report/fs-124–99.htm.
Wang, M., Saricks, C. and Wu, M.: 1997, ‘Fuel-cycle fossil energy use and greenhouse gas emissions of
fuel ethanol produced from U.S. Midwest corn’. Report sponsored by the Illinois Department of
Commerce and Community Affairs, Argonne National Laboratory, Center for Transportation
Research, Argonne, IL 60439.
Worrell, E., Pylipsen, D. and Martin, N.: 2000, ‘Energy use and energy intensity of the U.S. chemical
industry’. Report LBNL-44314, Energy Analysis Department, Environmental Energy Technologies
Division, LBNL, Berkeley, CA 94720.
Worrell, E., van Heijningen, R.J.J., de Castro, J.F.M., Hazeewinkel, J.H.O., de Beer, J.G., Fauu,
A.P.C. and Vringer, K.: 1994, ‘New gross energy-requirement figures for materials production’,
Energy 19, 627–640.
336 TAD W. PATZEK ET AL.
Recommended