Munich Personal RePEc Archive
EU-China Economic Relations:
Interactions and Barriers
Lu, Zheng and Yan, Tianqin and Deng, Xiang
School of Economics, Sichuan University, P.R.China, College of
Foreign Languages and Cultures, Sichuan University, P.R.China,
School of Economics, Sichuan University, P.R.China
10 May 2012
Online at https://mpra.ub.uni-muenchen.de/83419/
MPRA Paper No. 83419, posted 22 Dec 2017 04:40 UTC
EU-China Economic Relations: Interactions and Barriers
Zheng Lu†
School of Economics, Sichuan University, Chengdu, China
Department of Economics, Sabanci University, Istanbul, Turkey
Abstract
EU-China economic interactions became more and more frequent in the past decades,
nowadays EU and China are main trade partner for each other. This paper analyzed
EU-China economic interactions from three dimensions: bilateral governmental
interactions, trade and investment flows as well as barriers to trade and investment.
Findings show that EU-China close relationship is particularly based on goods trade
especially on intra-industrial trade of manufacturing industrial products, and trade
imbalance is arising from trade in Machinery and Transport Equipment and Other
Manufactured Goods (e.g., Clothing and clothing accessories); This paper also found
that there exist a myriad of trade and investment barriers to EU-China interactions,
including both tariff and non-tariff obstacles. Therefore, this paper argued that if EU
and China want to handle the trade imbalance efficiently, they must improve
composition of trade in goods, while essentially, it requires lessening or eliminating
EU-China trade barriers which hampered trade composition improvement.
Key words: EU-China Relations, Trade, Trade Barriers, FDI
JEL codes: F13; F59;
1. Introduction
China‟s development in the past decades has caused fierce attention from all over the
world. As a country who has more than 1.3 billion population, its annual average
economic growth is over 10% (real GDP growth) in the past 30 years, from 1980s to
2000s. Undoubtedly, China‟s economic boom particularly gains from his Reform and
Opening-up policies starting in the end of 1970s. In the third plenary session of 11th
central committee of CCP held in 1978, Chinese government decided to quit the idea
†Zheng Lu, School of Economics, Sichuan University, Chengdu, China. E-mail: [email protected]. This paper is revised and improved based on a presentation in the course The Political Economics of European Integration instructed by Prof. Bahri Yılmaz, Faculty of Arts and Social Sciences, Sabanci University, Turkey. I am grateful to the comments and advices from Prof. Bahri Yılmaz.

of “economy subject to politics” and transformed to reform the economic system as
well as to open the “Country‟s Gate” to the world, since then, promoting economy
development became the core task of government. Opening-up policy firstly applied
to eastern coastal regions in 1980s and then enlarged to entire country in the early of
1990s, yet CCP proposed to give up Planned Economic System partially and try to
build Socialist Market Economic System in 1992. Easily government and enterprises
found that China hold strong advantage of labor force comparative with other
countries, thus export-oriented strategy became the prior tactic of economic
development under the condition of insufficient domestic demand.
Finally, exports became one of the three driven factors (consume, investment and
export) of China‟s economic growth in the past decades. Proportion of total exports
and imports to GDP and of total exports to GDP were just 12.54% and 5.97% in 1980,
and then they increased to 29.78% and 15.99% in 1990, and 39.58% and 20.80% in
2000. In 2006, these two proportions reached the highest points, 65.17% and 35.87%.
Since the global financial crisis exploding in 2007, China‟s exports trade was affected
significantly by the global economic crisis, the proportion of total exports and imports
to GDP and proportion of total exports to GDP reduced in recent years, but they still
stood at 50.28% and 26.68% in 2010. Moreover, government also launched many
preferential policies, such as income tax exemption or reduction, for attracting foreign
capitals to invest in China. Actual utilized FDI was only $3.49bn in 1990, and
increased to $40.72bn in 2000, it reached $105.74bn in 20101. These facts adequately
proved that international economic and trade interactions are exactly very important to
China‟s economic development.
Nowadays China has been the second exports economy and third imports
economy in the world. And, as the largest exporter and importer in the world, EU has
been an important export destination and source of imports and FDI of China. By
March 2004, European Union (EU) became the largest trade partner of China and
China turn to the second largest trade partner of EU (Dai, 2006). Actually, Since
European Economic Community (EEC) and China established diplomatic relations in
1975, EU-China economic and trade relations became more and more close. EU
commission stated EU-China relations as “Closer Partner, Growing Responsibilities”,
although competition from China especially in some manufacturing sectors raised
serious challenges (EU Commission, 2006). However, China‟s huge market is 1All data in this paragraph come from or calculated based on the data from National Bureau of Statistics of China.(2011). China Statistical Yearbook 2011. Beijing: China Statistics Press.
undoubtedly an attractiveness to European companies, trading with China can create
jobs and promote EU‟s economic growth, competition from China can impel
European companies to manage cost and reinforce their comparative advantages, for
example on technology and innovation capability, this implies EU actually can not
only keep competitiveness but also gain a lot from trading with China. Based on the
same logic perspective, evidently China also can gain from trading with EU including
investment and technology transfers. Therefore, it is uncontroversial to conclude that
EU-China economic and trade interactions are a progress of reciprocity and mutual
benefit.
Nevertheless, one of the preconditions for EU and China maximizing benefits
from trade and economic partnership is that both sides must open their market and
ensure fair competition (Lorca-Susino, 2006), namely must reduce exchange cost as
far as possible. But in fact, there exist a myriad of trade barriers between EU and
China, especially non-tariff obstacles, which are main factors of high EU-China
economic exchange cost. China‟s market is not open entirely, and also it is reported
that protectionism is on the rise in Europe (Ashton, 2009). Generally China is treated
as manufacturing economy based on the competitive advantage of cheap labor and
land (Dai, 2006), this advantage makes China can produce merchandises with much
more lower cost, and at the same time, Chinese government also support export
through subsidy, exchange regulation and some other policies, yet some industries are
still not open to foreign investment. EU sets some barriers to trade and investment,
and also keeps some restriction on sensitive products, the main instruments are
technical barrier to trade (TBT) and anti-dumping measures (Brülhart & Matthews,
2007).
This paper will briefly investigate the overview of EU-China economic relations
through introducing the status quo and barriers of EU-China trade and investment.
The first section will introduce the bilateral governmental interactions, the second
section will analyzes the status quo of EU-China trade and investment, and it will
mainly focus on the industrial structure of EU-China trade. The third section will
discuss various trade and investment barriers to EU-China through some cases. And
the final part is the conclusions and remarks.
2. EU-China Bilateral Governmental Interactions
China and EEC established diplomatic relations in 1975, and in 1985, EEC and China
launched the first trade and economic cooperation agreement, “Agreement on Trade
and Economic Cooperation Between European Economic Community and the
People‟s Republic of China”, which involved trade cooperation and economic
cooperation, and also established EC-China Joint Committee to manage the
cooperation relationship (Council of EC & Government of P. R. China, 1985). Trade
cooperation targets on creating favorable conditions for bilateral trade and grants each
other most-favored nation treatment, such as lower customs duties and charges,
simplifying regulation, procedures and formalities, and so on. This bilateral agreement
continues to be the main legal framework of EU-China trade and economic relations
(Griese, 2006), and it is updated on 9th EU-China Summit held in Helsinki in 2006.
After 1985 agreement, the scale of EU-China trade increased sharply especially in
1990s2. In terms of statistical data, EU‟s exports to China was only €1.9bn and just
ranked No.24 in EU‟s exports partners in 1980, exports value increased to €5.8bn and
China ranked No.13 in 1990. While in 1998, the value increased to €17.4bn, and
China became the fourth largest exports trade partner. On the imports side, value of
EU‟s imports from China was only €2.0bn and China ranked No.22 in EU‟s imports
partners in 1980, then imports value increased to €10.4bn and China rose to No.5. In
1998, EU‟s imports from China reached €42.0bn and China became the third largest
imports trade partner of EU3.
Table 1. EU-China Key Governmental Interactions
Year Actions
1975 Established diplomatic relations between China and EEC.
1985 Agreement on Trade and Economic Cooperation between European Economic
Community and the People‟s Republic of China.
1998 EU-China Summit (annually, the 14
th Summit was held in Feb. 2012).
EU Communication [COM(1998)181] : Building a comprehensive partnership with China.
2001
EU Communication [COM(2001)265 final]: further enhancement of engagement with China; China is both part of the problem and the solution to all major issues of international and regional concern.
Established a Comprehensive Partnership formally coming with the China‟s WTO accession.
2003 Comprehensive Strategic Partnership. EU Commission [COM(2003)533final]: A maturing partnership-shared interests and
2Trade between EU and China grew slowly in the latter half of the 1980s due to the political instability. 3Data in this paragraph is from European Communities.(2002). External and Intra-European Union
Trade-Statistical Yearbook: Data 1958-2001. Luxembourg: Office for Official Publications of the European Communities, p.30-31.
challenges in EU-China relations.
2006
On 9th
EU-China Summit (Helsinki), decided to start negotiation on a PCA (EU-China Partnership & Cooperation Agreement), PCA will cover both political and economic dimension of EU-China relations.
And, also involve an upgrade of Trade and Economic Cooperation Agreement launched in 1985.
2008
High Level Economic and Trade Dialogue (HED, annually, 1st meeting was held on
25 April in Beijing). HED provides a tool to address issues of mutual concern in the areas of investment,
market access and intellectual property rights protection, as well as other issues related to trade.
Source: Author‟s depiction.
In 1990s, China‟s economy reform and development reflected new changes,
especially China started to transform from a centrally-planned and largely closed
economy towards an increasingly market-driven economy after 1992, in when CCP
proposed and tried to build Socialist Market Economic System (EU Commission,
1998). EU commission stated that, on the one hand, China has made considerable
efforts to reform and develop market economy as well as became more and more
responsible in foreign policy. On the other hand, EU also worried about whether
China can continue to reform in post-Deng Xiaoping era and handle the shock from
Asian financial crisis exploded in 1997. Thus EU think it is necessary to amend its
approach to China based on new assessments (Smith & Xie, 2010), and then EU
commission launched a new approach named “Building a Comprehensive Partnership
with China” in March 19984. The new policy mainly aimed EU-China partnership at
engaging China further in the international community through an upgraded political
dialogue, supporting China‟s transition to an open society, and integrating China
further in the world economy by promoting China more fully into the world trading
system and supporting China‟s economic and social reform (EU Commission, 1998).
Yet On 2 April 1998, the 1st EU-China Summit was held in London and it was pinned
down as an interaction and communication mechanism which is held annually. This
summit built an efficient plate for discussing bilateral political and economic
interactions as well as some other joint concerns.
On 15 May 2001, EU published updated policies “Strategy Towards China:
4Actually, in July, 1995, European Commission published its first Communication "A Long-term Policy for China-Europe Relations" which made a detail policy framework and measures involving all dimensions such as political, trade, investment, economic cooperation, science and technology cooperation, and so on(EU Commission, 1995). Moreover, the agreement on scientific and technological cooperation of EU-China was signed in the end of this year.
Implementation of the 1998 Communication and Future Steps for a More Effective
EU Policy” in consideration of China‟s forthcoming accession to WTO(EU
Commission, 2001). Obviously, this strategy included two parts, the first one was to
evaluate the implementation outcomes of building comprehensive partnership with
China, and the second one is to supplement policies based on new situation. Coming
with China‟s accession to WTO on 11 December 2001, the comprehensive partnership
was established formally. After two years, EU Commission published the policy paper
“A maturing partnership-shared interests and challenges in EU-China relations”,
which stated that “EU and China have an ever-greater interest to work together as
strategic partner to safeguard and promote sustainable development, peace and
stability”(EU Commission, 2003). This approach especially focuses on support
sectoral cooperation through strengthening or launching sectoral dialogues. On 9th
EU-China Summit (Helsinki, 9 September, 2006), EU and China decided to start open
negotiation on a PCA (EU-China Partnership & Cooperation Agreement), PCA will
cover both political and economic dimension of EU-China relations, 9th EU-China
Summit also involved an upgrade of “Trade and Economic Cooperation Agreement”
launched in 1985. In 2008, EU-China 1st High Level Economic and Trade
Dialogue(HED) was held in Beijing, it was claimed that HED provides a tool to
address issues of mutual concern in the areas of investment, market access and
intellectual property rights protection, as well as other issues related to trade.
3. EU-China Trade and Investment Interactions
3.1 EU-China Goods Trade Flows
Following previous rough discussion of the evolution of EU-China interactions, both
EU and China treat each other as an important economic partner, and they are
attempting to build a high level partnership through frequent and stable negotiation or
dialogue mechanism. Frequent dialogues and political interactions played a significant
role on EU-China trade relations. As mentioned previously, China has been the No.1
export partner and No.2 import partner of EU, trade scale enlarged over 4 times in the
past ten years, obviously both EU and China gained a lot of benefits from bilateral
trading. In 1999, EU-27 exported €19.66bn goods to China and imported €52.60bn
goods from China. While by 2010, EU‟s exports to China increased to €113.25bn, and
imports from China rose to €282.51bn.
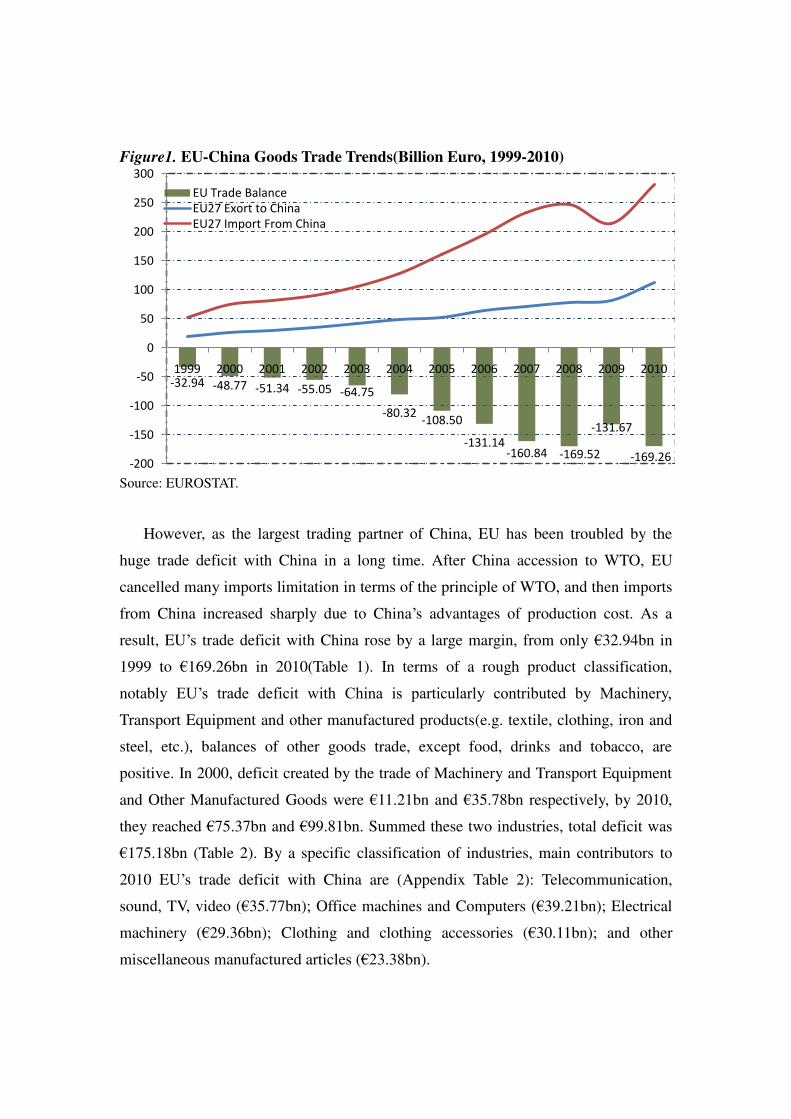
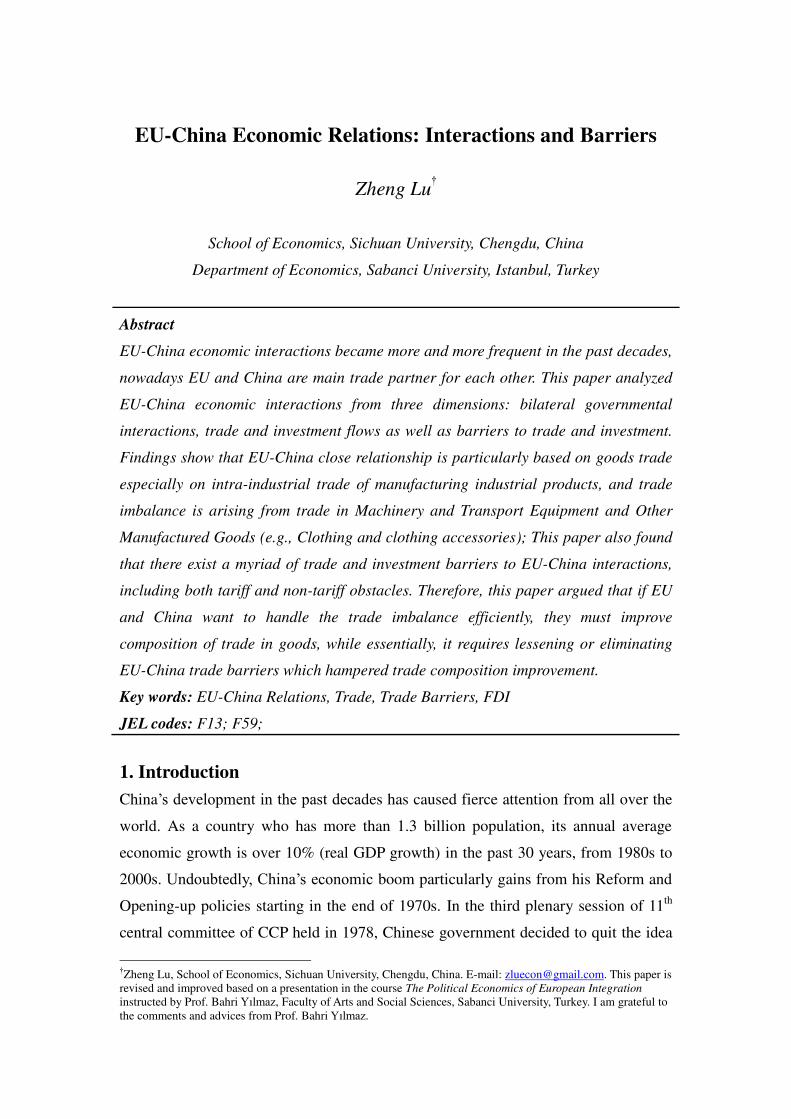
Figure1. EU-China Goods Trade Trends(Billion Euro, 1999-2010)
Source: EUROSTAT.
However, as the largest trading partner of China, EU has been troubled by the
huge trade deficit with China in a long time. After China accession to WTO, EU
cancelled many imports limitation in terms of the principle of WTO, and then imports
from China increased sharply due to China‟s advantages of production cost. As a
result, EU‟s trade deficit with China rose by a large margin, from only €32.94bn in
1999 to €169.26bn in 2010(Table 1). In terms of a rough product classification,
notably EU‟s trade deficit with China is particularly contributed by Machinery,
Transport Equipment and other manufactured products(e.g. textile, clothing, iron and
steel, etc.), balances of other goods trade, except food, drinks and tobacco, are
positive. In 2000, deficit created by the trade of Machinery and Transport Equipment
and Other Manufactured Goods were €11.21bn and €35.78bn respectively, by 2010,
they reached €75.37bn and €99.81bn. Summed these two industries, total deficit was
€175.18bn (Table 2). By a specific classification of industries, main contributors to
2010 EU‟s trade deficit with China are (Appendix Table 2): Telecommunication,
sound, TV, video (€35.77bn); Office machines and Computers (€39.21bn); Electrical
machinery (€29.36bn); Clothing and clothing accessories (€30.11bn); and other
miscellaneous manufactured articles (€23.38bn).
-32.94 -48.77 -51.34 -55.05 -64.75
-80.32 -108.50
-131.14 -160.84 -169.52
-131.67
-169.26 -200
-150
-100
-50
0
50
100
150
200
250
300
1999 2000 2001 2002 2003 2004 2005 2006 2007 2008 2009 2010
EU Trade Balance
EU27 Exort to China
EU27 Import From China
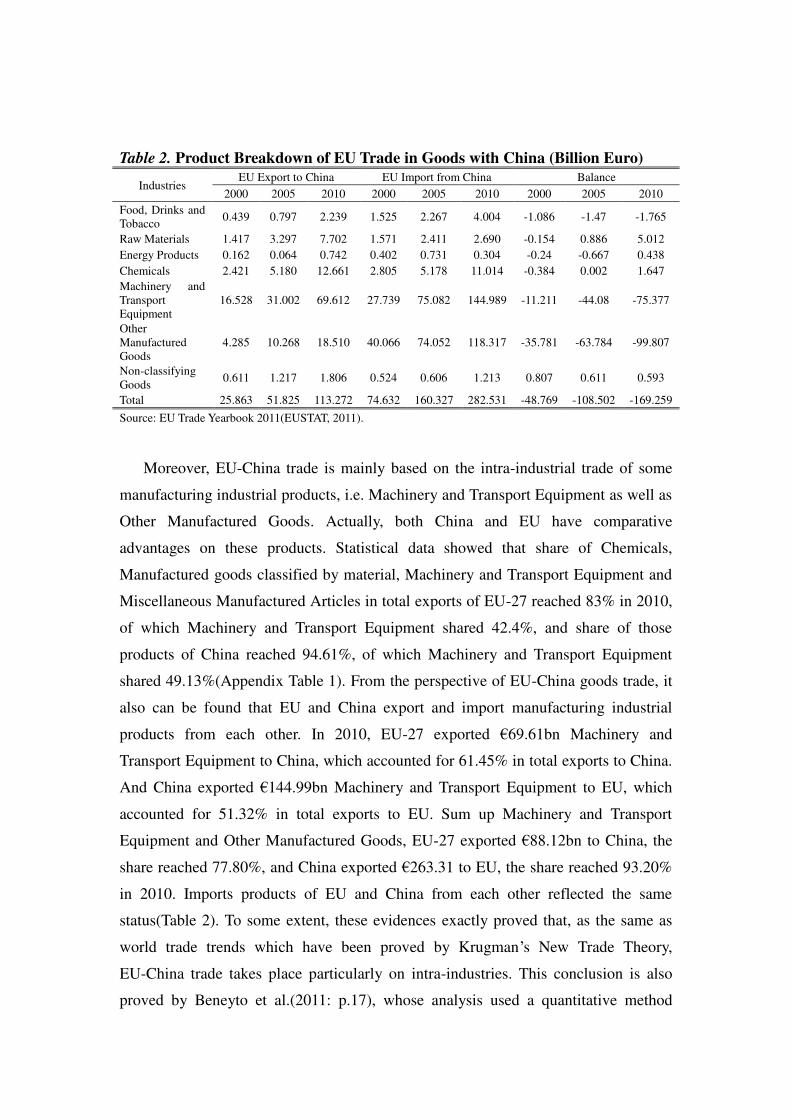
Table 2. Product Breakdown of EU Trade in Goods with China (Billion Euro)
Industries EU Export to China EU Import from China Balance
2000 2005 2010 2000 2005 2010 2000 2005 2010
Food, Drinks and Tobacco
0.439 0.797 2.239 1.525 2.267 4.004 -1.086 -1.47 -1.765
Raw Materials 1.417 3.297 7.702 1.571 2.411 2.690 -0.154 0.886 5.012
Energy Products 0.162 0.064 0.742 0.402 0.731 0.304 -0.24 -0.667 0.438
Chemicals 2.421 5.180 12.661 2.805 5.178 11.014 -0.384 0.002 1.647
Machinery and Transport Equipment
16.528 31.002 69.612 27.739 75.082 144.989 -11.211 -44.08 -75.377
Other Manufactured Goods
4.285 10.268 18.510 40.066 74.052 118.317 -35.781 -63.784 -99.807
Non-classifying Goods
0.611 1.217 1.806 0.524 0.606 1.213 0.807 0.611 0.593
Total 25.863 51.825 113.272 74.632 160.327 282.531 -48.769 -108.502 -169.259
Source: EU Trade Yearbook 2011(EUSTAT, 2011).
Moreover, EU-China trade is mainly based on the intra-industrial trade of some
manufacturing industrial products, i.e. Machinery and Transport Equipment as well as
Other Manufactured Goods. Actually, both China and EU have comparative
advantages on these products. Statistical data showed that share of Chemicals,
Manufactured goods classified by material, Machinery and Transport Equipment and
Miscellaneous Manufactured Articles in total exports of EU-27 reached 83% in 2010,
of which Machinery and Transport Equipment shared 42.4%, and share of those
products of China reached 94.61%, of which Machinery and Transport Equipment
shared 49.13%(Appendix Table 1). From the perspective of EU-China goods trade, it
also can be found that EU and China export and import manufacturing industrial
products from each other. In 2010, EU-27 exported €69.61bn Machinery and
Transport Equipment to China, which accounted for 61.45% in total exports to China.
And China exported €144.99bn Machinery and Transport Equipment to EU, which
accounted for 51.32% in total exports to EU. Sum up Machinery and Transport
Equipment and Other Manufactured Goods, EU-27 exported €88.12bn to China, the
share reached 77.80%, and China exported €263.31 to EU, the share reached 93.20%
in 2010. Imports products of EU and China from each other reflected the same
status(Table 2). To some extent, these evidences exactly proved that, as the same as
world trade trends which have been proved by Krugman‟s New Trade Theory,
EU-China trade takes place particularly on intra-industries. This conclusion is also
proved by Beneyto et al.(2011: p.17), whose analysis used a quantitative method

based on EU‟s member state trade with China, calculation showed Intra-Industrial
Global Trade Index with China of selected EU member states increased dramatically
from 1995 to 2009.
3.2 EU-China Services Trade and Capital Flows
Other dimensions related to economic relations are services trade and capital mobility.
Comparative with trade in goods, scale of services trade and FDI flows between EU
and China are much smaller. In 2010, EU-China commercial services export trade was
only €22.3bn and the balance was positive. FDI flows from EU to China was €6.5bn
in 2009, only accounting for 5.39% of China‟s total inward FDI, yet accumulative
value was €63.6bn, sharing 6.71% of total values. China‟s inward FDI are mainly
from abroad Chinese countries or regions, over half of FDI are from Hong Kong,
Taiwan and Singapore, and their total shares reached 54.81% in 2009. Some free ports,
for example, British Virgin Islands (BVI), are also the main source of China‟s FDI, in
2009, 12.01% of China‟s inward FDI are from BVI5. Actually, BVI has many
companies which is built by Chinese businessman or institutions, it is said that more
than 25% of companies registered in BVI are related to China. Some Mainland
Chinese are willing to register companies in international free ports, because it is easy
to register and also can get benefit from tax avoidance, and then, if they go back to
invest in China, they can enjoy the preferential policy of supporting FDI (income tax
exemption or reduction, as for investing in industries which is in the official
encourage list, income tax will be exempted in the first three years and half income
tax will be levied in the subsequent two years). Anyway, goods trade is the leading
role of EU-China economic and trade relations rather than capital mobility and
services trade.
Table 3. EU-China Economic and Trade Indicators (Billion Euro)
Dimensions EU27 to China China to EU27 Balance
2008 2009 2010 2008 2009 2010 2008 2009 2010
Trade in Goods 78.4 82.4 113.3 247.9 214.1 282.5 -169.5 -131.8 -169.3
Trade in services 20.2 19.1 22.3 15.2 13.6 16.3 5.0 5.4 6.0
FDI Flows 6.9 6.5 7.1 -0.4 0.1 0.7 6.9 6.5 6.4
Stocks 54.7 63.6 75.1 5.6 5.6 6.7 49.1 57.9 68.4
5Proportion of China‟s FDI composition in this paragraph are calculated by author based on the data from Ministry of Commerce of China.(2010). China Commercial Yearbook 2010. Beijing: China Commerce and Trade Press.

Notes: Services is commercial services; Source: EUROSTAT (NewCronos).
4. Trade and Investment Barriers between EU and China
4.1 Attitude Determines Action
China‟s market is important to EU‟s products, and EU also would like to gain
deserved benefits from the economic boom of China, thus general speaking, EU‟s
attitude of economic interactions to China tends to be more liberal. But in fact, EU‟s
decision is based on the common actions of member states, those states who play a
leading role was the common decision maker to a great extent.
Figure 2. EU Member States Attitudes to China
Sources: Fox & Godement (2009, p.4).
EU member states can be divided into four types in term of their attitudes to China
(Fox & Godement, 2009: p.4): Type-A is assertive industrialists, such as Czech,
Poland and Germany. These kinds of countries tend to pressure China on both
economic and politic dimensions, and support using protective measures to threaten
China‟s trade barriers; Type-B is called ideological free-traders, representative
countries like Netherlands, Sweden Denmark and UK. They tend to pressure China on
politics in order to promote China reduce barriers rather than restrict trade directly,
and they also claim that EU should focus on the point of benefiting from China‟s
growth rather than being threatened by Chinese cheap products; Type-C is
accommodating mercantilists which are the largest group, including such as Finland,
Italy, Spain, Greece, Romania and so on. They claim that keeping good political
relationship with China will create commercial benefits, so economic considerations
must dominate the relationships, but they also treat protective measures as an useful
tool. The last type is European followers, they don‟t consider the relationship with
China to be the core of their foreign policies and are not willing to take part in
actively in the debate of issues that China is not a key EU priority. So this type of
states prefers to follow EU‟s policies rather than lead policies decision. In terms of the
idea of Fox and Godement(2009), most of EU active member states held an attitude of
maintaining political dialogue and treating protective measures as an useful trade
instrument. Therefore, if more conservative states play a leading role in the process of
decision making, the common external trade policy could be more protective
especially facing a huge trade deficit with China. Actually, EU maintains common
protective measures against external countries including both tariffs and non-tariff
barriers (Mullally, O‟Brien & Stephenson, 2005: p.8).
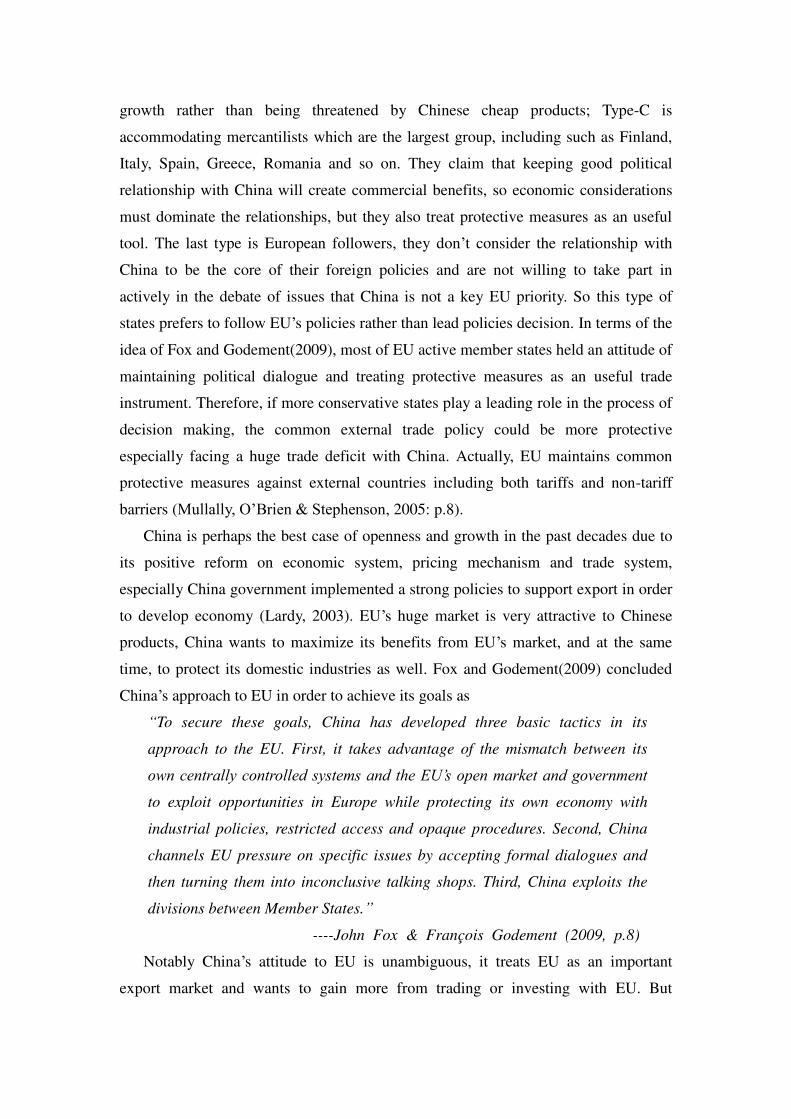
China is perhaps the best case of openness and growth in the past decades due to
its positive reform on economic system, pricing mechanism and trade system,
especially China government implemented a strong policies to support export in order
to develop economy (Lardy, 2003). EU‟s huge market is very attractive to Chinese
products, China wants to maximize its benefits from EU‟s market, and at the same
time, to protect its domestic industries as well. Fox and Godement(2009) concluded
China‟s approach to EU in order to achieve its goals as
“To secure these goals, China has developed three basic tactics in its
approach to the EU. First, it takes advantage of the mismatch between its
own centrally controlled systems and the EU’s open market and government to exploit opportunities in Europe while protecting its own economy with
industrial policies, restricted access and opaque procedures. Second, China
channels EU pressure on specific issues by accepting formal dialogues and
then turning them into inconclusive talking shops. Third, China exploits the
divisions between Member States.”
----John Fox & François Godement (2009, p.8)
Notably China‟s attitude to EU is unambiguous, it treats EU as an important
export market and wants to gain more from trading or investing with EU. But
meanwhile, it also tries to keep its comparative advantages through making use of
various promoting or protective measures. Specially, China emphasizes its identity of
being a underdeveloped country and being a market economy country in order to
enjoy the preferential supports from EU as well as promote EU to eliminate those
restrictions specially exerting on central-controlled economy country.
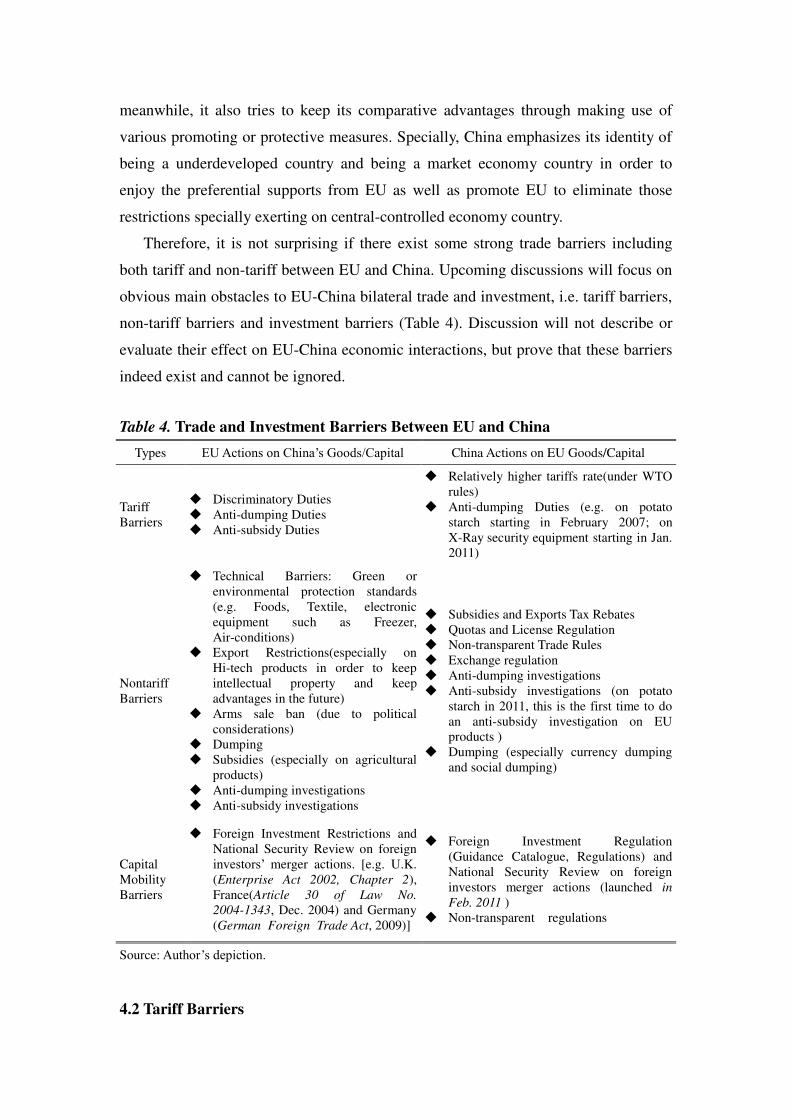
Therefore, it is not surprising if there exist some strong trade barriers including
both tariff and non-tariff between EU and China. Upcoming discussions will focus on
obvious main obstacles to EU-China bilateral trade and investment, i.e. tariff barriers,
non-tariff barriers and investment barriers (Table 4). Discussion will not describe or
evaluate their effect on EU-China economic interactions, but prove that these barriers
indeed exist and cannot be ignored.
Table 4. Trade and Investment Barriers Between EU and China
Types EU Actions on China‟s Goods/Capital China Actions on EU Goods/Capital
Tariff Barriers
Discriminatory Duties Anti-dumping Duties Anti-subsidy Duties
Relatively higher tariffs rate(under WTO rules)
Anti-dumping Duties (e.g. on potato starch starting in February 2007; on X-Ray security equipment starting in Jan. 2011)
Nontariff Barriers
Technical Barriers: Green or environmental protection standards (e.g. Foods, Textile, electronic equipment such as Freezer, Air-conditions)
Export Restrictions(especially on Hi-tech products in order to keep intellectual property and keep advantages in the future)
Arms sale ban (due to political considerations)
Dumping Subsidies (especially on agricultural
products) Anti-dumping investigations Anti-subsidy investigations
Subsidies and Exports Tax Rebates Quotas and License Regulation Non-transparent Trade Rules Exchange regulation Anti-dumping investigations Anti-subsidy investigations (on potato
starch in 2011, this is the first time to do an anti-subsidy investigation on EU products )
Dumping (especially currency dumping and social dumping)
Capital Mobility Barriers
Foreign Investment Restrictions and National Security Review on foreign investors‟ merger actions. [e.g. U.K. (Enterprise Act 2002, Chapter 2), France(Article 30 of Law No.
2004-1343, Dec. 2004) and Germany (German Foreign Trade Act, 2009)]
Foreign Investment Regulation (Guidance Catalogue, Regulations) and National Security Review on foreign investors merger actions (launched in
Feb. 2011 ) Non-transparent regulations
Source: Author‟s depiction.
4.2 Tariff Barriers
Coming with globalization trends, every country has realized the importance of free
trading, both developed and developing countries have been reducing their import
tariff rate recent decades, thus the importance of tariff barriers has declined or it is not
a key obstacle to free trading in the future. In terms of a measurement, EU-15 average
tariff rate on import goods from external countries was 1.54% by 2002 (Global Britain,
2004). Towards to China‟s import tariff rate, China actually began to reduce after
implementing opening-up policy and it dropped sharply in 1990s in order to access to
WTO, the average import tariff rate stood at a very high level, more than 50% in 1982,
it reduced to 40% in 1993, and then dropped to 15.3% in 2001(Lardy, 2003;
SCIO,2011). After accession to WTO, China continued to reduce the tariff rate
according to the commitment, average tariff rate decreased to 9.9% in 2005 and 9.8%
in 2010(SCIO, 2011).
Therefore, Ashton (2009) argued that trade and investment barriers between EU
and China are not those arising from tariffs already, but those caused by non-tariffs
fields, such as various rules and standards. However, it seems inaccurate to claim that
there are no tariff barriers to EU-China trading. In fact, tariff is still treated as a useful
instrument by both EU and China. Generally EU imposes a higher tariff on products,
especially on basic goods (such as foods and textile, which developing country have
an advantage) from developing countries than on products from developed countries.
Mullally, O‟Brien & Stephenson(2005) found that rich countries(GDP per capita is
more than £15000 a year) just faced an average 1.6% tariff imposed by EU, middle
income countries were imposed an average 2.9% tariff, while poor countries(GDP per
capita is less than £5000 a year) were imposed an highest tariff rate, 5% on average.
Imposing discriminatory duties on products from different income countries implies
China is suffering a higher trade defense from EU than other rich countries.
A frequently-used approach of EU to China is to levy anti-dumping duties on
products importing from China. Taking the anti-dumping duty on China‟s ceramic
tiles as an example, after one year investigation(from April 2009 to March 2010), EU
decided to impose a provisional anti-dumping duty on imports of ceramic tiles
originating in China, this highest duty rate reached 73%(EU Commission, 2011a). On
12 September, EU published a definitive anti-dumping duty rate, the highest one
reached 69.7% (EU Council, 2011a). EU stated that China‟s ceramic tiles products
exactly sold as a lower price in EU than that in China domestic market and products
of EU‟s companies and finally injured EU‟s related industries. Nevertheless, a
research report stated that export prices from China are highly differentiated and most
of Chinese exporters sold at a higher price than those companies of many EU member
states, and China‟s products only shared 6.5% in EU market, while EU producers
shared 90%, thus EU‟s anti-dumping measures are inappropriate (Kasteng, 2012).
As for anti-subsidy duties EU imposing on China‟s products, there are some cases
too. On 6 May 2011, EU commission published the first anti-subsidy tariffs against
imports from China after 15 months investigation, EU stated that Chinese government
subsidized coated fine paper industry by giving cheap loans, cheap land and some
preferential tax policies which are illegal under WTO rules, then EU decided to
impose anti-subsidy duties on coated fine paper from China with duties ranging from
4% to 12%(EU Council, 2011b). At the same time, EU also decided to impose
anti-dumping duties on coated fine paper with duties ranging from 20% to 39.1% (EU
Council, 2011c). This implies that EU imposes both anti-dumping and anti-subsidy
duties on the same product (coated fine paper) imported from China. Of course, EU‟s
action caused a protest from China, Chinese government argued that imposing both
anti-dumping and anti-subsidy duties on the same product is a double remedial
behavior to EU industry and it goes against the WTO rules.
As a response to EU‟s actions, Chinese government launched some anti-dumping
and anti-subsidy measures on EU‟s products and has begun to impose anti-dumping
duties and anti-subsidy duties on some products imported from EU as well. For
example, on 6 February 2007, China started to impose anti-dumping duties on potato
starch imported from EU with duration of 5 years. China decided to recheck and still
levy anti-dumping duties during rechecking period; And on 23 January 2011, Chinese
government decided to impose anti-dumping duties on X-Ray security equipment
imported from EU with duties ranging from 33.5% to 71.8%. On 16 September 2011,
China decided to impose anti-subsidy duty on potato starch from EU after with a duty
ranging between 7.5% to 12.4%, it is also the first time to impose anti-subsidy duty on
EU product, and in fact, on 19 April 2011, China has began to impose anti-dumping
duty on the same product from EU with duty ranging from 12.6% to 56.7%. Moreover,
as mentioned previously, China‟s import tariff rate is still higher relatively, although it
will continue to decrease in terms of the commitment to WTO rules, it is also can be
treated as a tariff barriers to trading.
In sum, although there are some other kind of anti-dumping measures, such as
warranting deposit, price commitment during the investigation, some rules and
standards, EU and China governments still treat imposing duties as an important
remedial measure and exert on goods trade frequently in order to protect domestic
industries or as a reaction to anti-dumping or anti-subsidy measures from opposite
side. Therefore, tariffs, including normal duty as well as anti-dumping and
anti-subsidy duties are still the barrier to EU-China trade, which exactly cause profit
loss of consumers as the conclusion has been proved by classical trade theory.
4.3 Non-Tariff Barriers
Non-tariff barriers refer to the barriers such as import quotas, subsidies, rules,
standards and regulations, which a country or a region who uses a common external
trade policy used in order to protect domestic industries, Non-tariff barrier has been a
most preferable and popular measure used by governments in modern world.
Naturally, EU and China government also prefer to exert non-tariff barriers on each
other‟s trade and investment.
Subsidy measure is mainly exploited by EU on agriculture through the framework
of Common Agricultural Policy (CAP). CAP targets to promote European agriculture
sector development more productive and stable through some support measures such
as direct payment, market price intervention, production quotas and so on. EU budgets
a lot annually for supporting and protecting agricultural development. For example, it
is embraces approximately 90% of EU‟s agricultural output, and about half of EU‟s
budget was paid to agriculture sector in 2001(Wickman, 2003: p.3), and about 46%
and 47% of all community expenditure in 2005 and 2006(National Audit Office,
2008). OECD‟s report indicated that 35% of EU farmers‟ revenue was from
government‟s subsidies in 2003, while the figure of Australian and New Zealand were
only 5%(von Reppert-Bismarch, 2004). In terms of the new framework, CAP
spending share of total EU budget will decreased to 32% in 2013(EUROPA, 2007).
Although CAP expenditure reflected a descending trend, it doesn‟t imply that the
direct subsidy measure will be forgone. According to “CAP towards 2020”, direct
payment will still be used to support agriculture producers who, EU argued, “face
very economic and natural conditions across the EU which advocates for an equitable
distribution of direct aids”(EU Commission, 2010). CAP subsidies to farmers caused
negative effect to EU consumers as well as foreign countries. EU consumers have to
pay 80%-100% more for food than those in free-market regime, and because of the
high import tariff and export subsidies of EU, agriculture sector of developing
countries also was shocked obviously(Wickman, 2003: p.3). Some studies argued that
CAP subsidies actually failed to protect farmers‟ income which fell 70% between
1995 and 2000, and the main beneficiaries were input suppliers and big landowners
(Mullally, O‟Brien & Stephenson, 2005: p.11).
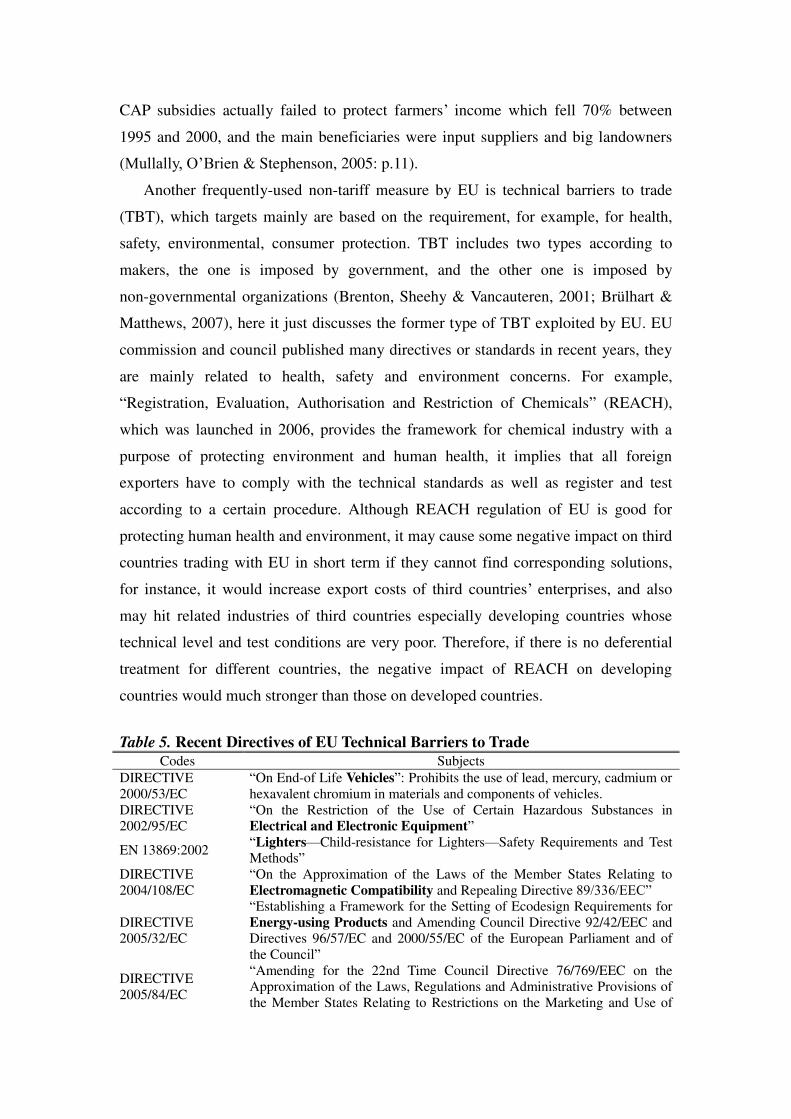
Another frequently-used non-tariff measure by EU is technical barriers to trade
(TBT), which targets mainly are based on the requirement, for example, for health,
safety, environmental, consumer protection. TBT includes two types according to
makers, the one is imposed by government, and the other one is imposed by
non-governmental organizations (Brenton, Sheehy & Vancauteren, 2001; Brülhart &
Matthews, 2007), here it just discusses the former type of TBT exploited by EU. EU
commission and council published many directives or standards in recent years, they
are mainly related to health, safety and environment concerns. For example,
“Registration, Evaluation, Authorisation and Restriction of Chemicals” (REACH),
which was launched in 2006, provides the framework for chemical industry with a
purpose of protecting environment and human health, it implies that all foreign
exporters have to comply with the technical standards as well as register and test
according to a certain procedure. Although REACH regulation of EU is good for
protecting human health and environment, it may cause some negative impact on third
countries trading with EU in short term if they cannot find corresponding solutions,
for instance, it would increase export costs of third countries‟ enterprises, and also
may hit related industries of third countries especially developing countries whose
technical level and test conditions are very poor. Therefore, if there is no deferential
treatment for different countries, the negative impact of REACH on developing
countries would much stronger than those on developed countries.
Table 5. Recent Directives of EU Technical Barriers to Trade
Codes Subjects
DIRECTIVE 2000/53/EC
“On End-of Life Vehicles”: Prohibits the use of lead, mercury, cadmium or hexavalent chromium in materials and components of vehicles.
DIRECTIVE 2002/95/EC
“On the Restriction of the Use of Certain Hazardous Substances in Electrical and Electronic Equipment”
EN 13869:2002 “Lighters—Child-resistance for Lighters—Safety Requirements and Test Methods”
DIRECTIVE 2004/108/EC
“On the Approximation of the Laws of the Member States Relating to Electromagnetic Compatibility and Repealing Directive 89/336/EEC”
DIRECTIVE 2005/32/EC
“Establishing a Framework for the Setting of Ecodesign Requirements for Energy-using Products and Amending Council Directive 92/42/EEC and Directives 96/57/EC and 2000/55/EC of the European Parliament and of the Council”
DIRECTIVE 2005/84/EC
“Amending for the 22nd Time Council Directive 76/769/EEC on the Approximation of the Laws, Regulations and Administrative Provisions of the Member States Relating to Restrictions on the Marketing and Use of
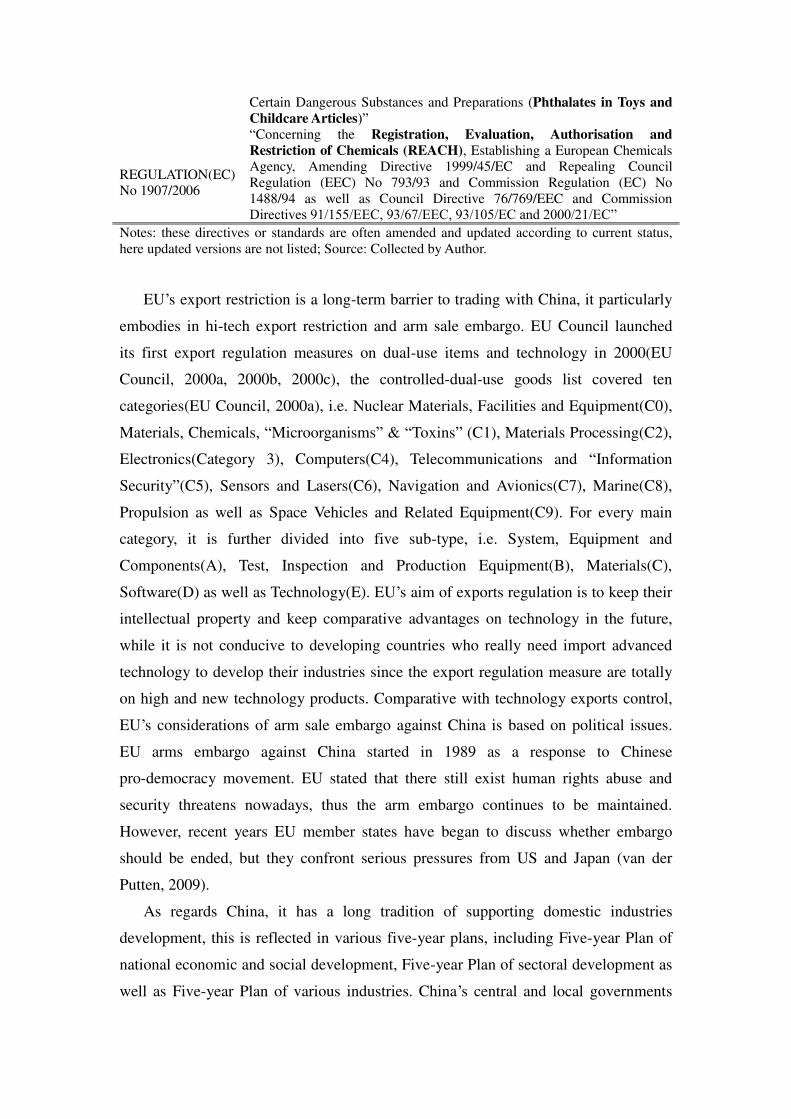
Certain Dangerous Substances and Preparations (Phthalates in Toys and
Childcare Articles)”
REGULATION(EC) No 1907/2006
“Concerning the Registration, Evaluation, Authorisation and
Restriction of Chemicals (REACH), Establishing a European Chemicals Agency, Amending Directive 1999/45/EC and Repealing Council Regulation (EEC) No 793/93 and Commission Regulation (EC) No 1488/94 as well as Council Directive 76/769/EEC and Commission Directives 91/155/EEC, 93/67/EEC, 93/105/EC and 2000/21/EC”
Notes: these directives or standards are often amended and updated according to current status, here updated versions are not listed; Source: Collected by Author.
EU‟s export restriction is a long-term barrier to trading with China, it particularly
embodies in hi-tech export restriction and arm sale embargo. EU Council launched
its first export regulation measures on dual-use items and technology in 2000(EU
Council, 2000a, 2000b, 2000c), the controlled-dual-use goods list covered ten
categories(EU Council, 2000a), i.e. Nuclear Materials, Facilities and Equipment(C0),
Materials, Chemicals, “Microorganisms” & “Toxins” (C1), Materials Processing(C2),
Electronics(Category 3), Computers(C4), Telecommunications and “Information
Security”(C5), Sensors and Lasers(C6), Navigation and Avionics(C7), Marine(C8),
Propulsion as well as Space Vehicles and Related Equipment(C9). For every main
category, it is further divided into five sub-type, i.e. System, Equipment and
Components(A), Test, Inspection and Production Equipment(B), Materials(C),
Software(D) as well as Technology(E). EU‟s aim of exports regulation is to keep their
intellectual property and keep comparative advantages on technology in the future,
while it is not conducive to developing countries who really need import advanced
technology to develop their industries since the export regulation measure are totally
on high and new technology products. Comparative with technology exports control,
EU‟s considerations of arm sale embargo against China is based on political issues.
EU arms embargo against China started in 1989 as a response to Chinese
pro-democracy movement. EU stated that there still exist human rights abuse and
security threatens nowadays, thus the arm embargo continues to be maintained.
However, recent years EU member states have began to discuss whether embargo
should be ended, but they confront serious pressures from US and Japan (van der
Putten, 2009).
As regards China, it has a long tradition of supporting domestic industries
development, this is reflected in various five-year plans, including Five-year Plan of
national economic and social development, Five-year Plan of sectoral development as
well as Five-year Plan of various industries. China‟s central and local governments
tend to pay subsidies in order to reduce the financial costs of enterprises, for example,
if some high and new technology industries are in the encouraging category of
government, central and local budget will arrange corresponding special subsidies to
enterprises, scope embodies such as loan interest subsidy, technology update and
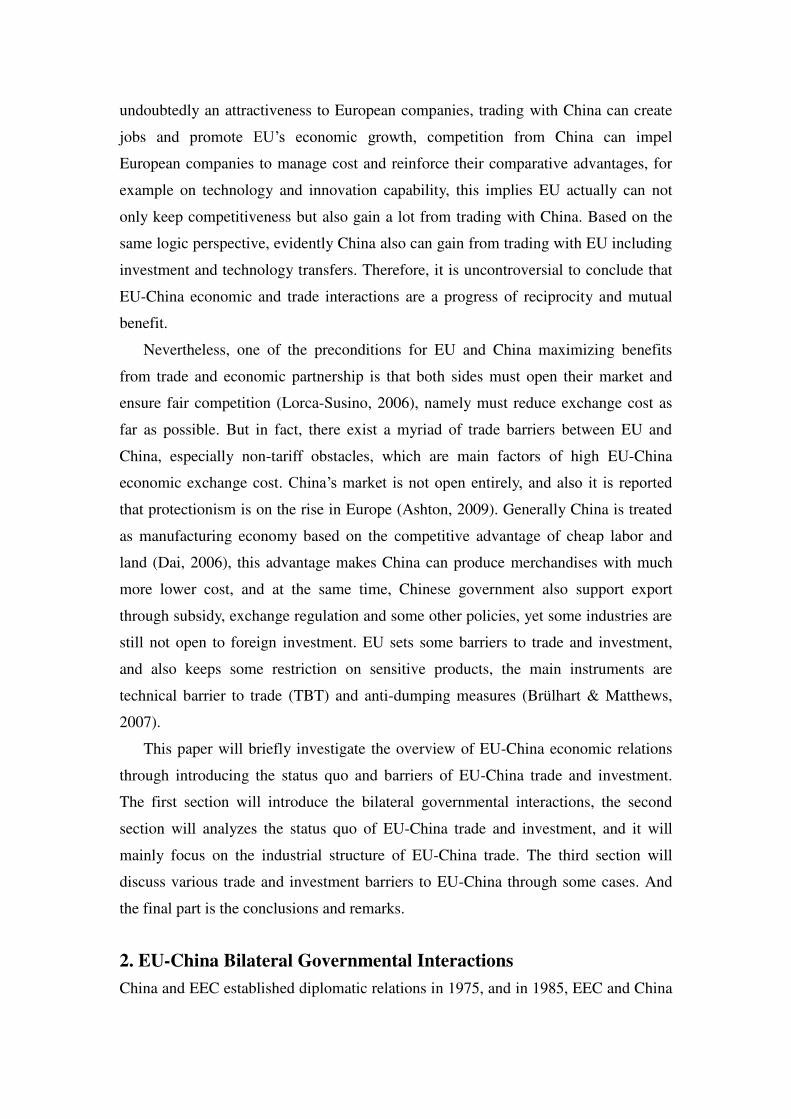
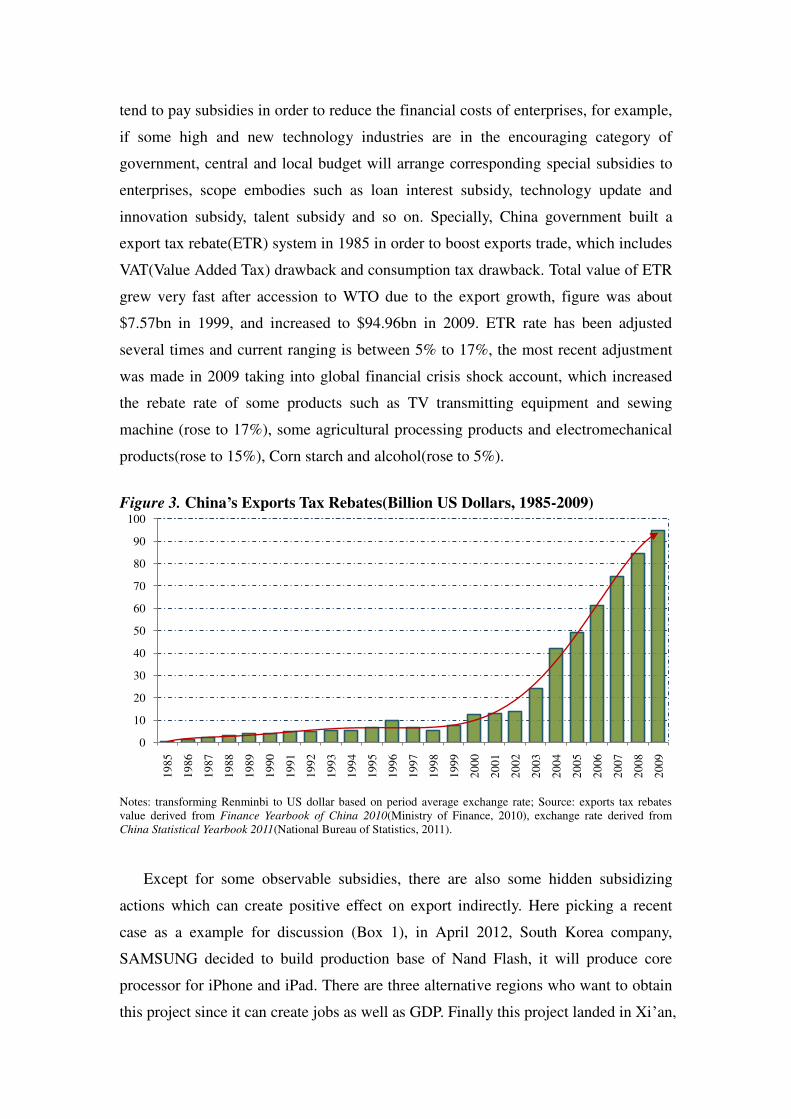
innovation subsidy, talent subsidy and so on. Specially, China government built a
export tax rebate(ETR) system in 1985 in order to boost exports trade, which includes
VAT(Value Added Tax) drawback and consumption tax drawback. Total value of ETR
grew very fast after accession to WTO due to the export growth, figure was about
$7.57bn in 1999, and increased to $94.96bn in 2009. ETR rate has been adjusted
several times and current ranging is between 5% to 17%, the most recent adjustment
was made in 2009 taking into global financial crisis shock account, which increased
the rebate rate of some products such as TV transmitting equipment and sewing
machine (rose to 17%), some agricultural processing products and electromechanical
products(rose to 15%), Corn starch and alcohol(rose to 5%).
Figure 3. China’s Exports Tax Rebates(Billion US Dollars, 1985-2009)
Notes: transforming Renminbi to US dollar based on period average exchange rate; Source: exports tax rebates value derived from Finance Yearbook of China 2010(Ministry of Finance, 2010), exchange rate derived from China Statistical Yearbook 2011(National Bureau of Statistics, 2011).
Except for some observable subsidies, there are also some hidden subsidizing
actions which can create positive effect on export indirectly. Here picking a recent
case as a example for discussion (Box 1), in April 2012, South Korea company,
SAMSUNG decided to build production base of Nand Flash, it will produce core
processor for iPhone and iPad. There are three alternative regions who want to obtain
this project since it can create jobs as well as GDP. Finally this project landed in Xi‟an,
0
10
20
30
40
50
60
70
80
90
100
19
85
19
86
19
87
19
88
19
89
19
90
19
91
19
92
19
93
19
94
19
95
19
96
19
97
19
98
19
99
20
00
20
01
20
02
20
03
20
04
20
05
20
06
20
07
20
08
20
09
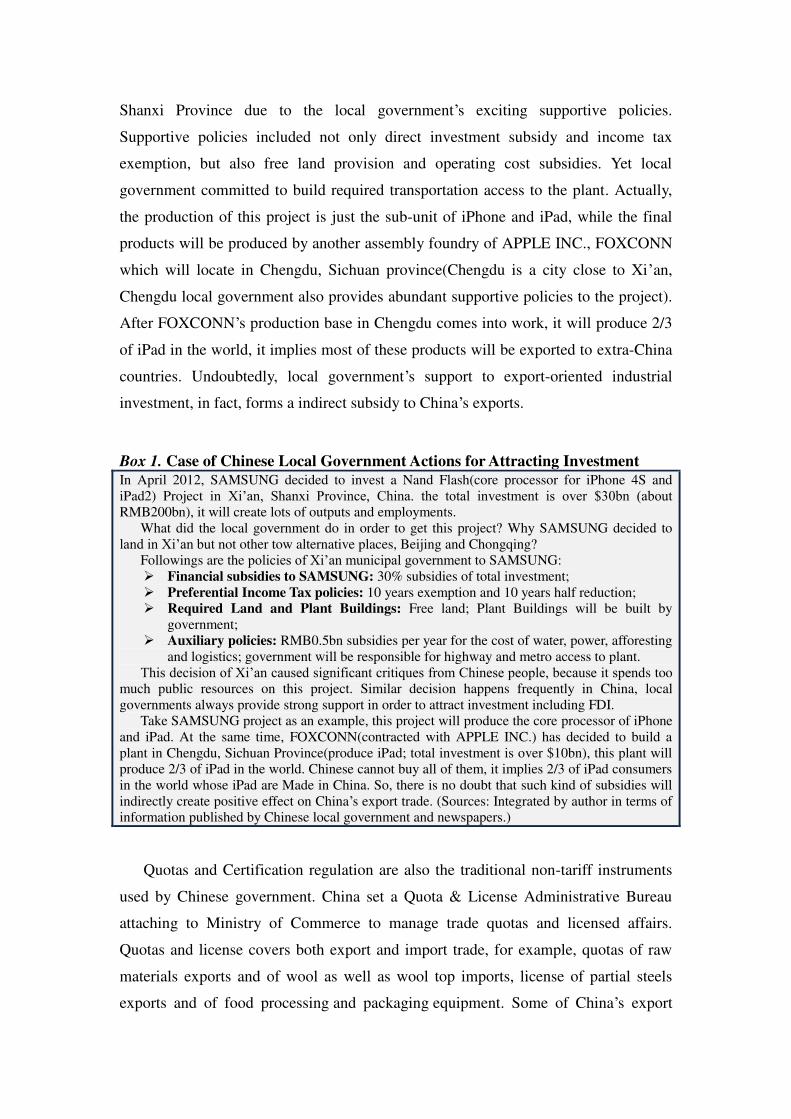
Shanxi Province due to the local government‟s exciting supportive policies.
Supportive policies included not only direct investment subsidy and income tax
exemption, but also free land provision and operating cost subsidies. Yet local
government committed to build required transportation access to the plant. Actually,
the production of this project is just the sub-unit of iPhone and iPad, while the final
products will be produced by another assembly foundry of APPLE INC., FOXCONN
which will locate in Chengdu, Sichuan province(Chengdu is a city close to Xi‟an,
Chengdu local government also provides abundant supportive policies to the project).
After FOXCONN‟s production base in Chengdu comes into work, it will produce 2/3
of iPad in the world, it implies most of these products will be exported to extra-China
countries. Undoubtedly, local government‟s support to export-oriented industrial
investment, in fact, forms a indirect subsidy to China‟s exports.
Quotas and Certification regulation are also the traditional non-tariff instruments
used by Chinese government. China set a Quota & License Administrative Bureau
attaching to Ministry of Commerce to manage trade quotas and licensed affairs.
Quotas and license covers both export and import trade, for example, quotas of raw
materials exports and of wool as well as wool top imports, license of partial steels
exports and of food processing and packaging equipment. Some of China‟s export
Box 1. Case of Chinese Local Government Actions for Attracting Investment
In April 2012, SAMSUNG decided to invest a Nand Flash(core processor for iPhone 4S and iPad2) Project in Xi‟an, Shanxi Province, China. the total investment is over $30bn (about RMB200bn), it will create lots of outputs and employments.
What did the local government do in order to get this project? Why SAMSUNG decided to land in Xi‟an but not other tow alternative places, Beijing and Chongqing?
Followings are the policies of Xi‟an municipal government to SAMSUNG: Financial subsidies to SAMSUNG: 30% subsidies of total investment; Preferential Income Tax policies: 10 years exemption and 10 years half reduction; Required Land and Plant Buildings: Free land; Plant Buildings will be built by
government; Auxiliary policies: RMB0.5bn subsidies per year for the cost of water, power, afforesting
and logistics; government will be responsible for highway and metro access to plant. This decision of Xi‟an caused significant critiques from Chinese people, because it spends too
much public resources on this project. Similar decision happens frequently in China, local governments always provide strong support in order to attract investment including FDI.
Take SAMSUNG project as an example, this project will produce the core processor of iPhone and iPad. At the same time, FOXCONN(contracted with APPLE INC.) has decided to build a plant in Chengdu, Sichuan Province(produce iPad; total investment is over $10bn), this plant will produce 2/3 of iPad in the world. Chinese cannot buy all of them, it implies 2/3 of iPad consumers in the world whose iPad are Made in China. So, there is no doubt that such kind of subsidies will indirectly create positive effect on China‟s export trade. (Sources: Integrated by author in terms of information published by Chinese local government and newspapers.)

restriction through quotas and license especially on material products caused protests
from other import countries. For example, in 2009, EU, US and Mexico appealed to
WTO on China‟s license regulation to some raw material products such as bauxite,
coke, spar, magnesium, manganese, silicon metal and zinc, finally WTO confirmed
that these license actions violated the WTO rules. In January 2011, WTO confirmed
Chinese quotas and export duties on some raw materials products are illegal as well
(EU Commission, 2012).
Yet China‟s exchange regulation creates import and export effect. China‟s
exchange rate system is Managed Floating Rate System, which make Chinese
government can intervene in exchange market if it is required. Therefore, Renminbi
can maintain a higher value to exchange US dollar through governmental controlling,
it implies value of Renminbi is much lower than that of other currencies, which will
promote exports and restrict imports. Chinese enterprises and government benefit
from the Managed Floating Rate System directly, but it is not conducive to other
countries exporters. So, exchange regulation is always criticized, and other countries
have been pressuring Chinese government to lessen regulation and let Renminbi
appreciating. Transparency is also one of the main principles according to WTO
provisions. Non-transparency laws and regulations can create trade barriers especially
to imports. After accession to WTO, China have made a big efforts to reform and
improve its administrative transparency in terms of its commitment to WTO, for
example, publishing regulations, establishing Sanitary and Phytosanitary
Measure(SPS) system, as well as related laws and standards(Biuković, 2010).
However, some research stated that there still exist some non-transparency regulations
especially in the sector of industry investment (Kraft, 2010; EU Commission, 2011b,
2012).
Additionally, here it treats anti-dumping and anti-subsidy investigations
corresponding to dumping and subsidy as the non-tariff barriers to trade as well.
Actually, dumping is always created by some supportive policies such as various
subsidies and tax exemption which finally reduced the production cost of enterprises.
EU‟s agricultural policies and China‟s industrial policies or exchange regulation make
their products can sale much cheaper in abroad. As a response to dumping, both EU
and China start to exploit anti-dumping and anti-subsidy investigations on each
other‟s products. If they confirm that a certain product exists dumping and impose
duties on this product, then imposing anti-dumping or anti-subsidy duties further
become tariff barriers. Anti-dumping and anti-subsidy investigation can be treated as
non-tariff barriers too, government can pressure on exporters through investigations
even if dumping action may not true. Moreover, they also may be used as retaliatory
measures. For example, as discussed previously, EU started its anti-subsidy
investigation on coated fine paper from China in the early of 2010 and finally decided
to impose anti-subsidy duties On 6 May 2011(EU Council, 2011b), which is the first
time that EU impose anti-subsidy duties on Chinese product. Subsequently, on 30
August 2010, China government started the first anti-subsidy investigation on potato
starch from EU and finally decided to impose anti-subsidy duty on 16 September
2011. It is worth noting that EU impose both anti-dumping duty and anti-subsidy duty
on the same product, at the beginning, Chinese government argued that it violated the
WTO rules, while finally China government started to impose both anti-dumping and
anti-subsidy duties on the same product as well. These interactions indicated that
China‟s action could be a retaliatory response to EU‟s action. In 2012, EU launched
anti-subsidy investigations on several products from China and also caused the protest
from Chinese government, if EU finally confirms to impose, probably China will
respond as the same actions.
4.4 Investment Barriers
Cross-border investment has developed rapidly in the past decades. In order to
promote capital flowing across board, developed countries, who have a strong
advantage on capital, have been making considerable efforts to prevent developing
countries from foreign invest investment(FDI) restrictions. Actually, from the
historical perspective, now-developed countries systematically restricted foreign
investment for protecting domestic industries through various measures, such as limits
on ownerships, technology transfer, local procurement, mergers and acquisitions
regulations and so on. Only when domestic industries got strong and competitive
enough, now-developed countries started to lessen their regulation on FDI(Chang,
2004). Therefore, generally developing countries have stronger restrictions on foreign
investment than developed countries.
However, developed countries still restricted FDI in some sensitive sectors in
terms of their concerns of national safety or public interest. EU member states mainly
exert reviews on some merger and acquisition (M&A) related to national safety or
public interest, namely they tend to intervene in FDI market through the National
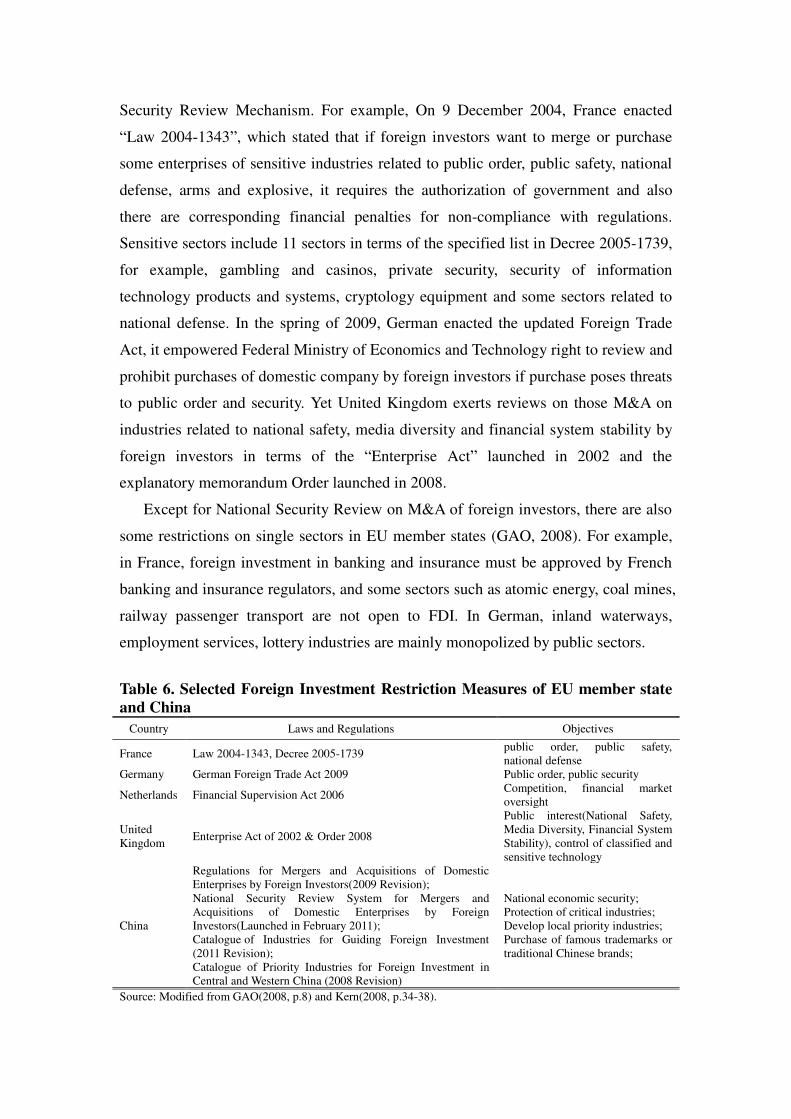
Security Review Mechanism. For example, On 9 December 2004, France enacted
“Law 2004-1343”, which stated that if foreign investors want to merge or purchase
some enterprises of sensitive industries related to public order, public safety, national
defense, arms and explosive, it requires the authorization of government and also
there are corresponding financial penalties for non-compliance with regulations.
Sensitive sectors include 11 sectors in terms of the specified list in Decree 2005-1739,
for example, gambling and casinos, private security, security of information
technology products and systems, cryptology equipment and some sectors related to
national defense. In the spring of 2009, German enacted the updated Foreign Trade
Act, it empowered Federal Ministry of Economics and Technology right to review and
prohibit purchases of domestic company by foreign investors if purchase poses threats
to public order and security. Yet United Kingdom exerts reviews on those M&A on
industries related to national safety, media diversity and financial system stability by
foreign investors in terms of the “Enterprise Act” launched in 2002 and the
explanatory memorandum Order launched in 2008.
Except for National Security Review on M&A of foreign investors, there are also
some restrictions on single sectors in EU member states (GAO, 2008). For example,
in France, foreign investment in banking and insurance must be approved by French
banking and insurance regulators, and some sectors such as atomic energy, coal mines,
railway passenger transport are not open to FDI. In German, inland waterways,
employment services, lottery industries are mainly monopolized by public sectors.
Table 6. Selected Foreign Investment Restriction Measures of EU member state
and China
Country Laws and Regulations Objectives
France Law 2004-1343, Decree 2005-1739 public order, public safety, national defense
Germany German Foreign Trade Act 2009 Public order, public security
Netherlands Financial Supervision Act 2006 Competition, financial market oversight
United Kingdom
Enterprise Act of 2002 & Order 2008
Public interest(National Safety, Media Diversity, Financial System Stability), control of classified and sensitive technology
China
Regulations for Mergers and Acquisitions of Domestic Enterprises by Foreign Investors(2009 Revision); National Security Review System for Mergers and Acquisitions of Domestic Enterprises by Foreign Investors(Launched in February 2011); Catalogue of Industries for Guiding Foreign Investment (2011 Revision); Catalogue of Priority Industries for Foreign Investment in Central and Western China (2008 Revision)
National economic security; Protection of critical industries; Develop local priority industries; Purchase of famous trademarks or traditional Chinese brands;
Source: Modified from GAO(2008, p.8) and Kern(2008, p.34-38).
Comparative with European countries, China exerts much stronger restrictions on
FDI. As a developing country, Chinese government tries to protect and boost its
domestic industries development through supportive policies. For example, Chinese
central government laid down Catalogue of Industries for Guiding Foreign Investment
in order to channel foreign capitals and Catalogue of Priority Industries for Foreign
Investment in Central and Western China in order to develop competitive industries
locating in backward regions. According to the current catalogue(2011 revision), only
parts of industries are open to foreign investors, and some of these open industries are
restricted in building joint venture or cooperative enterprise with Chinese investors.
China also built and launched a National Security Review System in February 2011,
which stated that it requires to be vetted by government if the M&A by foreign
investors is related to national security.
5. Conclusions and Remarks
In terms of analysis above all, this paper finds that: EU and China are main trade
partner for each other, and bilateral economic and trade relation are more and more
closer; and the close relationship is particularly based on the intra-industrial trade of
manufacturing industrial products, especially machinery and transport equipment
products. Trade in services and FDI flows just a small part of EU-China economic
exchanges; However, from the EU perspective, manufacturing industrial products
export to China is much less than those import from China, and it is the chief
contributor of EU‟s trade deficit with China; So, if EU and China want to handle the
huge trade deficit, they must improve Composition of Trade as far as possible.
This paper also find that there still exist a myriad of obstacles to EU-China trade
and investment interactions, especially non-tariff obstacles such as various subsidies,
trade and investment restrictions, technical barriers and so on. China‟s market is not
open entirely, and also it is reported that protectionism is on the rise in Europe
(Ashton, 2009). Undoubtedly these barriers are key factors of causing EU‟s huge trade
deficits with China, thus lessening or eliminating trade barriers between EU and
China can promote trade development and adjusting composition of trade. But, it
requires joint efforts, mutual trust, frequent interaction and cooperation.
However, above analysis is just a rough introduction of EU-China economic and
trade relations (“Economic Partnership”), it didn‟t introduce the “Economic
Competition” between EU and China. Actually, according to the arguments of EU
commission, relations between EU and China are Competition and Partnership (EU
Commission, 2006), which is not only in economic fields but also in political and
social fields. Another topic is that this paper just focused on the bilateral relations at
the supranational level, while in fact, as argued by Dai(2006), relations between EU
and China involves not only bilateral relations at supranational level(EU-China) but
also bilateral relations at member state level(relation between EU‟s every member
state and China). Thus if one wants to understanding EU-China economic and trade
relations completely, it is necessary to consider the performance arising from the
second type of bilateral relations.
Preference
Ashton, C.(2009). The EU-China Trade Relationship Going Forward: Building
Confidence. Speech at the University of International Business and Economics,
Beijing, China.
Beneyto, J.M., Sorroza, A., Hurtado, I. and Corti, J.(2011). Political Dialogue in
EU-China Relations. Documento de Trabajo Serie Unión Europea No.50/2011,
CEU Ediciones, Madrid, Spain.
Biuković, L.(2010). Selective Adaptation of WTO Transparency Norms and Local
Practices in China and Japan. In Debra P. Steger(ed.) Redesigning the World Trade
Organization for the Twenty-first Centuy. Waterloo, Canada: Wilfrid Laurier
University Press, pp.193-218.
Brenton, P., Sheehy, J. and Vancauteren, M.(2001). Technical Barriers to Trade in the
European Union: Importance for Accession Countries. Journal of Common
Market Studies, 39(2), pp.265-284.
Brülhart, M. and Matthews, A.(2007). EU External Trade Policy. In El-Agraa andAli,
M.(eds.) The European Union: Economics & Policies (8th Edition). Cambridge:
Cambridge University Press, pp.921-967.
Chang, H.-J.(2004). Regulation of Foreign Investment in Historical Perspective. The
European Journal of Development Research, 16(3), pp.687-715.
Casarini, N.(2006). The Evolution of the EU-China Relationship: from Constructive
Engagement to Strategic Partnership. Occasional Paper No.64, Institute for
Security Studies, the European Union, Paris, France.
Council of EC and Government of P. R. China.(1985). Agreement on Trade and

Economic Cooperation Between European Economic Community and the
People‟s Republic of China. Official Journal of the European Communities, No
L250, 19 September 1985, pp.2-7.
Dai, X.(2006). Understanding EU-China Relations: An Uncertain Partnership in
Making. Research Paper 1/2006, Centre for European Union Studies, The
University of Hull, UK.
EU Commission.(1995). A Long-term Policy for China-Europe Relations.
Communication from the Commission[COM(1995)279 final], Brussels,
15.07.1995.
EU Commission.(1998). Building a Comprehensive Partnership with China.
Communication from the Commission[COM(1998)181 final], Brussels,
25.03.1998.
EU Commission.(2001). EU Strategy towards China: Implementation of the 1998
Communication and Future Steps for a more Effective EU Policy.
Communication from the Commission[COM(2001)265 final], Brussels,
15.05.2001.
EU Commission.(2003). A Maturing Partnership-Shared Interests and Challenges in
EU-China Relations. Commission Policy Paper[COM(2003)533 final] , Brussels,
10.09.2003.
EU Commission.(2006). Closer Partners, Growing Responsibilities, A Policy Paper
On EU-China Trade and Investment: Competition and Partnership. Commission
Working Document [COM(2006) 631 final], Brussels, 24.10.2006.
EU Commission.(2010). The CAP towards 2020: Meeting the Food, Natural
Resources and Territorial Challenges of the Future. Communication from the
Commission[COM(2010)672 final], Brussels, 18.11.2010.
EU Commission.(2011a). Commission Regulation (EU) No 258/2011 of 16 March
2011 Imposing a Provisional Anti-dumping Duty on Imports of Ceramic Tiles
Originating in the People‟s Republic of China. Official Journal of the European
Union(English Edition), L70, Volume 54, 17 March,2011, pp.5-30.
EU Commission.(2011b). Trade and Investment Barriers Report 2012. Report from
the Commission to the European Council[COM(2011)114 final], Brussels,
10.3.2012.
EU Commission.(2012). Trade and Investment Barriers Report 2012. Report from the
Commission to the European Council[COM(2012)70 final], Brussels, 21.2.2012.

EU Council.(2000a). Council Regulation (EC) No 1334/2000 of 22 June 2000 Setting
up a Community Regime for the Control of Exports of Dual-use Items and
Technology. Official Journal of the European Union(English Edition), L159,
Volume 54, 30 June,2000, pp.1-215.
EU Council.(2000b).Council Decision of 22 June 2000 Repealing Decision 94/942/CFSP on
the Joint Action Concerning the Control of Exports of Dual-use Goods. Official Journal of
the European Union(English Edition), L159, Volume 54, 30 June,2000, pp.218.
EU Council.(2000c). Council Joint Action of 22 June 2000 Concerning the Control of
Technical Assistance Related to Certain Military End-uses. Official Journal of the
European Union(English Edition), L159, Volume 54, 30 June,2000, pp.216-217.
EU Council.(2011a). Council Implementing Regulation (EU) No 917/2011 of
12 September 2011 Imposing a Definitive Anti-dumping Duty and Collecting
Definitively the Provisional Duty Imposed on Imports of Ceramic Tiles
Originating in the People‟s Republic of China. Official Journal of the European
Union(English Edition), L238, Volume 54, 15 September,2011, pp.1-23.
EU Council.(2011b). Council Implementing Regulation (EU) No 451/2011 of 6 May
2011 Imposing a Definitive Anti-Subsidy Duty on Imports of Coated Fine Paper
Originating in the People‟s Republic of China. Official Journal of the European
Union(English Edition), L128, Volume 54, 14 May,2011, pp.18-75.
EU Council.(2011c). Council Implementing Regulation (EU) No 452/2011 of 6 May
2011 Imposing a Definitive Anti-Dumping Duty and Collecting Definitively the
Provisional Duty Imposed on Imports of Coated Fine Paper Originating in the
People‟s Republic of China. Official Journal of the European Union(English
Edition), L128, Volume 54, 14 May,2011, pp.1-17.
EUROPA.(2007). EU Budget-Facts and Myths. Press Releases MEMO/07/350,
Europa.eu, date: 12/09/2007.
Fox, J. and Godement, F.(2009). A Power Audit of EU-China Relations. European
Council on Foreign Relations(ECFR), London, UK.
GAO.(2008). Laws and Policies Regulating Foreign Investment in 10 Countries.
Highlights of GAO-08-320, a report to the Honorable Richard Shelby, Ranking
Member, Committee on Banking, Housing, and Urban Affairs, U.S. Senate, U.S.
Government Accountability Office, Washington DC.
Global Britain.(2004). Customs Duties: Hardly Worth Collecting. Global Britain
Briefing Note No.33, 17 September, 2004, London, UK.
Griese, O.(2006). EU-China Relations-An Assessment by the Communications of the
European Union. Asia Europe Journal, 4(4), pp.544-554.
Kasteng, J.(2012). Paving the Way for Unfair Competition: The Imposition of EU
Anti-Dumping Duties on Ceramic Tiles from China. Stockholm, Sweden: National
Board of Trade.
Kern, S.(2008). SWFs and Foreign Investment Policies-An Update. Frankfurt.
German: Deutsche Bank Research, October 22, 2008.
Kraft, J. M.(2010). Surviving the “Made in China” Stigma: Challenges for Chinese
Multinational Corporations. Master of Arts Thesis, published on 18/06/2010,
California, USA: University of Southern California.
Lardy, N. R.(2003). Trade Liberalization and Its Role in Chinese Economic Growth.
Proceedings of International Monetary Fund and National Council of Applied
Economic Research Conference “A Tale of Two Giants: India‟s and China‟s
Experience with Reform and Growth”, November 14-16, 2003, New Delhi, India.
Lorca-Susino, M.(2006). The EU-China Trading-Economic Relationship is not a
Zero-Sum Game. European Union Miami Analysis(EUMA), Vol.3, No.3, Miami,
USA.
Mullally, L., O‟Brien, N. and Stephenson, P.(2005). Open Up: Why the EU Must
Reform to Survive. London, UK: Open Europe.
National Audit Office.(2008). Financial Management in the European Union.
Norwich, UK: The Stationery Office.
Prevost, D., Choukroune, L., Creemers, R. and Huchet, J.-F.(2011). EU-China Trade
Relations. Directorate-General for External Policies of the Union, Directorate B,
European Parliament, Brussels, Belgium.
SCIO.(2011). China's Foreign Trade. Governmental White Paper, first edition 2011,
State Council Information Office(SCIO), Beijing, China.
Smith, M. and Xie, H.(2010). The European Union and China: The Logics of
„Strategy Partnership‟. Journal of Contemporary European Research, 6(4),
pp.432-448.
Sorroza, A.(2011). Is the Eurozone Crisis Changing EU-China Relations? Elcano
Royal Institute(ARI) 154/2011, Madrid, Spain.
Stepan, M. and Ostermann, F.(2011).EU-China Relations: Strategic or Pragmatic, the
Future or Already the Past? Atlantisch Perspectief, 35(2), pp.19-24.
van der Putten, F. P.(2009). The EU Arms Embargo against China: Should Europe

Play a Role in East Asian Security? Social and Cultural Research Occasional
Paper Series No.7, published by Centre for Qualitative Social Research Centre,
Department of Sociology, Hong Kong Shue Yan University, Hong Kong, China &
East Asian Studies Program, Department of History, Pace University, New York,
USA.
von Reppert-Bismarck, J. (2004). OECD Scolds EU, U.S. for Slow Farm-Subsidy
Cuts. The Wall Street Journal Europe, 11 Jun 2004.
Wickman, K.(2003). Whither the European Agricultural Policy? A Viable Reform of
the CAP in the Context of an Enlarged EU and the Doha Development Round.
Stockholm, Sweden: Timbro.
Appendix
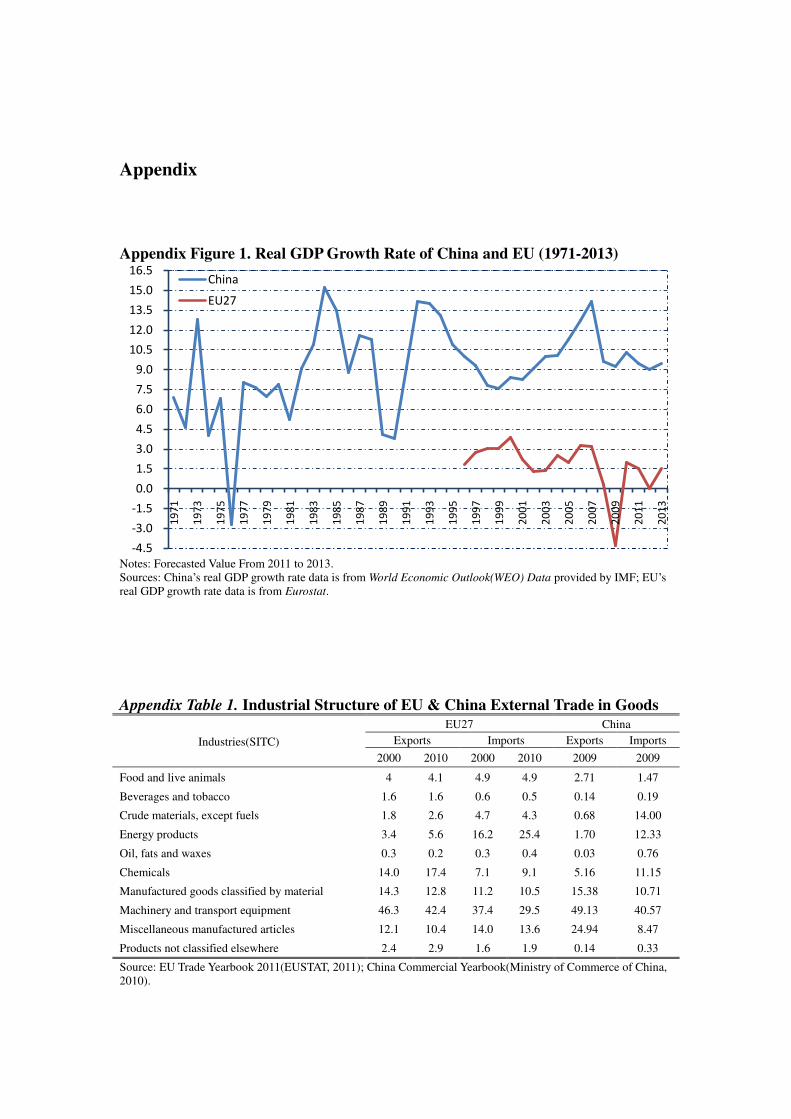
Appendix Figure 1. Real GDP Growth Rate of China and EU (1971-2013)
Notes: Forecasted Value From 2011 to 2013. Sources: China‟s real GDP growth rate data is from World Economic Outlook(WEO) Data provided by IMF; EU‟s real GDP growth rate data is from Eurostat.
Appendix Table 1. Industrial Structure of EU & China External Trade in Goods
Industries(SITC)
EU27 China
Exports Imports Exports Imports
2000 2010 2000 2010 2009 2009
Food and live animals 4 4.1 4.9 4.9 2.71 1.47
Beverages and tobacco 1.6 1.6 0.6 0.5 0.14 0.19
Crude materials, except fuels 1.8 2.6 4.7 4.3 0.68 14.00
Energy products 3.4 5.6 16.2 25.4 1.70 12.33
Oil, fats and waxes 0.3 0.2 0.3 0.4 0.03 0.76
Chemicals 14.0 17.4 7.1 9.1 5.16 11.15
Manufactured goods classified by material 14.3 12.8 11.2 10.5 15.38 10.71
Machinery and transport equipment 46.3 42.4 37.4 29.5 49.13 40.57
Miscellaneous manufactured articles 12.1 10.4 14.0 13.6 24.94 8.47
Products not classified elsewhere 2.4 2.9 1.6 1.9 0.14 0.33
Source: EU Trade Yearbook 2011(EUSTAT, 2011); China Commercial Yearbook(Ministry of Commerce of China, 2010).
-4.5
-3.0
-1.5
0.0
1.5
3.0
4.5
6.0
7.5
9.0
10.5
12.0
13.5
15.0
16.5
19
71
19
73
19
75
19
77
19
79
19
81
19
83
19
85
19
87
19
89
19
91
19
93
19
95
19
97
19
99
20
01
20
03
20
05
20
07
20
09
20
11
20
13
China
EU27
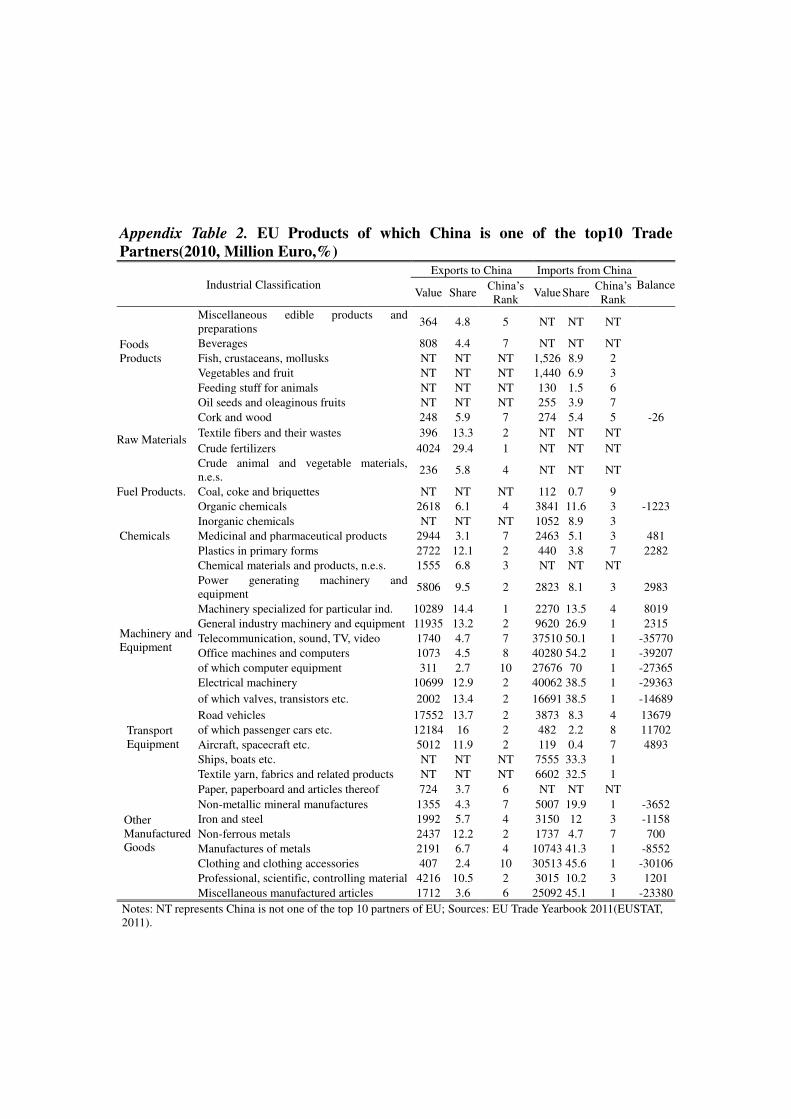
Appendix Table 2. EU Products of which China is one of the top10 Trade
Partners(2010, Million Euro,%)
Industrial Classification
Exports to China Imports from China
Balance Value Share
China‟s Rank
Value Share China‟s Rank
Foods Products
Miscellaneous edible products and preparations
364 4.8 5 NT NT NT
Beverages 808 4.4 7 NT NT NT
Fish, crustaceans, mollusks NT NT NT 1,526 8.9 2
Vegetables and fruit NT NT NT 1,440 6.9 3
Feeding stuff for animals NT NT NT 130 1.5 6
Raw Materials
Oil seeds and oleaginous fruits NT NT NT 255 3.9 7
Cork and wood 248 5.9 7 274 5.4 5 -26
Textile fibers and their wastes 396 13.3 2 NT NT NT
Crude fertilizers 4024 29.4 1 NT NT NT
Crude animal and vegetable materials, n.e.s.
236 5.8 4 NT NT NT
Fuel Products. Coal, coke and briquettes NT NT NT 112 0.7 9
Chemicals
Organic chemicals 2618 6.1 4 3841 11.6 3 -1223
Inorganic chemicals NT NT NT 1052 8.9 3
Medicinal and pharmaceutical products 2944 3.1 7 2463 5.1 3 481
Plastics in primary forms 2722 12.1 2 440 3.8 7 2282
Chemical materials and products, n.e.s. 1555 6.8 3 NT NT NT
Machinery and Equipment
Power generating machinery and equipment
5806 9.5 2 2823 8.1 3 2983
Machinery specialized for particular ind. 10289 14.4 1 2270 13.5 4 8019
General industry machinery and equipment 11935 13.2 2 9620 26.9 1 2315
Telecommunication, sound, TV, video 1740 4.7 7 37510 50.1 1 -35770
Office machines and computers 1073 4.5 8 40280 54.2 1 -39207
of which computer equipment 311 2.7 10 27676 70 1 -27365
Electrical machinery 10699 12.9 2 40062 38.5 1 -29363
of which valves, transistors etc. 2002 13.4 2 16691 38.5 1 -14689
Transport Equipment
Road vehicles 17552 13.7 2 3873 8.3 4 13679
of which passenger cars etc. 12184 16 2 482 2.2 8 11702
Aircraft, spacecraft etc. 5012 11.9 2 119 0.4 7 4893
Ships, boats etc. NT NT NT 7555 33.3 1
Other Manufactured Goods
Textile yarn, fabrics and related products NT NT NT 6602 32.5 1
Paper, paperboard and articles thereof 724 3.7 6 NT NT NT
Non-metallic mineral manufactures 1355 4.3 7 5007 19.9 1 -3652
Iron and steel 1992 5.7 4 3150 12 3 -1158
Non-ferrous metals 2437 12.2 2 1737 4.7 7 700
Manufactures of metals 2191 6.7 4 10743 41.3 1 -8552
Clothing and clothing accessories 407 2.4 10 30513 45.6 1 -30106
Professional, scientific, controlling material 4216 10.5 2 3015 10.2 3 1201
Miscellaneous manufactured articles 1712 3.6 6 25092 45.1 1 -23380
Notes: NT represents China is not one of the top 10 partners of EU; Sources: EU Trade Yearbook 2011(EUSTAT, 2011).
Recommended