Nancy Costello Miller, Esq., Chair John P. CrawfordMaureen T. Bezer, Secretary William R. DeeterLaurita Warner, Vice Chair Brian W. Duffy Nancy H. Blattner, Ph.D., OPA Kenneth J. GilmoreKathleen M. Barabas Sister Mary John Kearney, O.P. Sister Mary Lou Bauman, O.P. Linda Luciano, Ed.DJoseph Becker Sister Mary Eileen O’Brien, O.P., Ph.D.Elizabeth C. Berman William B. O'Brien Olga E. Bradford Patrick Osinski, Esq.Lisa M. Bromberg, Esq. Robert G. PurdySister Donna Ciangio, O.P. Mark A. RedaEdward R. Collins Gerald J. Smith, Jr.Sister Patricia Costello, O.P. Sister Patricia Tavis, O.P.
Eustace Anselmi Sister Anne John O’Loughlin, O.P.Thomas G. Ferguson Michael J. Quigley III, Esq.Kenneth F. Kunzman, Esq.
Nancy H. Blattner, Ph.D., OPAPresident
Barbara Chesler, Ed.D Kevin Boyle, M.B.A.Vice President for Academic Affairs Vice President for Development
and Alumni Affairs
Sheila N. O’Rourke, M.S. Joseph J. Posillico, C.P.A., M.B.A.Vice President for Institutional Effectiveness Vice President for Enrollment Management
and Communications
Jack T. Rainey, C.P.A. Sister Kathleen Tuite, O.P.Vice President for Finance and Administration Vice President for Student Life
BOARD OF TRUSTEES
TRUSTEES EMERITI
CABINET

1Mission Statement & Origins...................................................................................................................................... 2History and Accreditation.............................................................................................................................................. 3
I STUDENTS1. Admissions
Applications, Admissions, Enrollments: Fall 2015………………………………………………….. 4First Time Full-Time Freshman Applications, Admissions, Enrollments: 2011-2015……………………………….5Mean SAT Scores and High School GPA of Entering Freshmen: 2011-2015................................................. 6
2. Enrollment
Total Enrollment: Fall 2011- Fall 2015.......................................................................................................... 7First Time Full-Time Freshman Retention: 2006-2015 8Total Enrollment Headcount & Full-Time Equivalency: 2011-2015...................................................................................9Undergraduate Enrollments: Education Majors and Content Majors Fall 2015……….... 10Undergraduate Student Enrollment by Major: Fall 2015……..…………………….….... 11Total Undergraduate Student Enrollment by Major: 2011-2015………………………………………………………..12Graduate Enrollment by Program: 2011-2015………………………………………………………………13Undergraduate Enrollment by Gender: Fall 2015………………………………………………….. 14Graduate Enrollment by Gender: Fall 2011- 2015…………………………………………………… 15Full Time & Part Time Undergraduate Enrollment Headcount by Ethnicity: 2011-2015…………………………16Full Time & Part Time Graduate Enrollment by Ethnicity: 2011-2015…………………………… 17Demographics of Traditional Undergraduates 2015………………………………………………… 18Demographics of Adult Undergraduates 2015…………………………………………………………………….19Demographics of Graduate Students 2015…………………………………………………………………….20Bachelor's Degrees Conferred: 2011-2015………………………………………………………….. 21Master's Degrees Conferred: 2011-2015…………………………………………………………………..22
4. TuitionTuition Rates: 2011 - 2015………………………………………………………………………………….23
3. Financial Aid
Financial Aid: Academic Years 2011 - 2015.......................................................................... 24
II FACULTYFall 2015 Overview………………………………………………………………………………………………………………..25Total Faculty 2011-2015………………………………………………………………………………………25Faculty with Tenure 2011-2015……………………………………………………………………………………………………..25
III CAMPUS
Physical Plant, Classrooms, Residence Hall, Library 26Holdings and Expenditures of The College Library: 2011-2015...............................................................................26
IV CALDWELL UNIVERSITY BUDGETRevenue Sources and Expenditures Distribution.......................................................... 27Total Operating Expenses: 2011-2015........................................................................................ 27
TABLE OF CONTENTS
CALDWELL UNIVERSITY FACTSPAGE
Fast Facts: Fall 2015…………………………………………………………………………………………………………

Caldwell University 1
Fast Facts – Fall 2015
Address…………………… 120 Bloomfield Avenue, Caldwell, NJ 07006 USAPhone…………………………………………………. (973) 618 - 3000Fax……………………………………………………… (973) 618 – 3600Founded…………………………………………………………… 1939Colors………………………………………………… Scarlet/White/GoldNickname……………………………………………………… CougarsAthletic Conference Affiliations……………………. NCAA II, CACC, ECACWeb Page…………………………………………….. www.caldwell.edu
HEADCOUNTTotal Enrollment……………………………………….. 2,138FT Undergraduate………………………………………… 1,375PT Undergraduate………………………………………….. 220Graduate………………………………………………… 543
FTE………………………………………………………………. 1,863
EOF Enrolled………………………………………………………… 116
Degrees Conferred*…………………………………………………. 495
Full Time Faculty……………………………………………………. 89
Student-Faculty Ratio……………………………………………….. 12:1
TuitionFull Time Traditional Undergraduate……………………… $29,950Part Time Traditional Undergraduate…………………….. $830Continuing Education Undergraduate……………………. $700Graduate………………………………………………… $930
*Includes Bachelor’s and Master’s Degrees for prior 12 months- Counts Double Majors as separate Degrees

Caldwell University 2
Mission Statement
Founded in 1939 by the Sisters of Saint Dominic, Caldwell University promotes intellectual,spiritual, and aesthetic growth to a diverse population and welcomes all cultures and faithtraditions. Inspired by St. Dominic de Guzman and our Catholic heritage, we make adifference in the lives of our students and prepare them through the liberal arts andprofessional studies to think critically, pursue truth, and contribute to a just society.
Origins
As one of the youngest of the many Dominican colleges and universities throughout the world, Caldwell Univeristy is intimately linked to the 800-year history and spirit of the Dominican Order, a worldwide community of preachers, scholars, and educators that traces its origins to the thirteenth century. This Order had its beginnings in an age not unlike the present day, a time of unrest and transition in the social, economic, moral and intellectual sphere. Dedicated to the pursuit of truth, the Order has found itself since its inception at the heart of higher education and its climate of study and prayer has produced such scholars as Thomas Aquinas, social reformers like Catherine of Siena, artists like Fra Angelico, and scientists like Albert the Great. This inherited integration of the arts, humanities and sciences with the deepest expression of the contemplative and creative spirit of men and women forms the basis of the educational philosophy of Caldwell University
We celebrate our origins by Liturgy and through convocations, a campus-wide commitment to religious belief, and by witness to the University motto: “Sapientia et Scientia.”

Caldwell University 3
History and Accreditation
The Education Administration program at Caldwell University is awarded TEAC accreditationby the Inquiry Brief Commission of Council for the Accreditation of Education Preparation(CAEP) for a period of seven years, from October 2013 to October 2020. The accreditationdoes not include individual education courses that the EPP offers to P-12 educators forprofessional development, relicensure, or other purposes.
All of Caldwell University’s graduate programs in counseling (mental health and school counseling)have received accreditation from the Council for Accreditation of Counseling andRelated Education Programs (CACREP).
Caldwell University was founded as Caldwell College, a Catholic liberal arts college, by the Sisters of Saint Dominic under the leadership of Mother M. Joseph Dunn, O.P., and with the approval of the Most Reverend Thomas Joseph Walsh, Archbishop of Newark, who became its first president. Nancy H. Blattner, Ph.D., OPA became Caldwell’s eighth and current President in July of 2009.Caldwell College was incorporated on August 10, 1939, as an institution of higher learning for women under the laws of the State of New Jersey and empowered to grant degrees. In 1952, Caldwell College received full accreditation from the Commission on Higher Education of the Middle States Association of Colleges and Schools. Caldwell University has maintained this accreditation, which was last reaffirmed in June 2010. Caldwell College was granted the status of university in December, 2013 by the State of New Jersey and officially changed its name to Caldwell University on July 1, 2014.
In 1974, Caldwell became the first institution in New Jersey to award the Bachelor of Fine Arts degree. In 1979, Caldwell College became one of the few institutions in the state to offer a unique external degree program. In 1985, the Board of Trustees of the college voted to make Caldwell College fully co-educational, enabling men to receive the superior education and career preparation that women had been able to receive for fifty years. Caldwell University welcomed the first full-time male students in the fall of 1986.
In November 1992, Caldwell reached another plateau: the New Jersey Board of Higher Education granted approval for Caldwell to offer its first graduate program, the M.A. in Curriculum and Instruction. During the summer of 1993, the first graduate students began classes.
The University now offers eleven graduate degree programs, along with a number of post-baccalaureate and post-masters’ programs. The University has consistently shown growth in the area of Graduate Studies, including the following additions: in 2000, Caldwell was the first higher education institution in New Jersey to offer a specialization in Art Therapy within the M.A. in Counseling and in 2008, the first Post-Graduate M.A. in Art Therapy; in 2001, the University initiated a Post Baccalaureate Teacher Certification Program in Special Education and a dual Certification Program in Early Childhood and Elementary Education; in 2003, the University began offering an M.B.A. program in the Business Department and the Behavior Analyst Certification Board, Inc.® approved a course sequence submitted by Caldwell as meeting the coursework requirement for taking the Board Certified Behavior Analyst™ examination. In fall 2005, the University introduced an M.A. in Special Education and an M.A. in Applied Behavior Analysis. In 2007, an M.B.A. program with Nonprofit Management concentration was added. In the fall of 2009, the University’s first doctoral program, a Ph.D. in Applied Behavior Analysis commenced. In the fall of 2010, a B.S.N. degree program was introduced and the University has since added several health related majors. In spring 2012, the B.S.N. degree program received accreditation through the Commission on Collegiate Nursing Education (CCNE) The University was approved to offer its second and third doctoral programs in the fall of 2014, a Ph.D. program and an Ed.D program in education leadership.
Caldwell University is accredited by the Middle States Commission on Higher Education, 3624 Market Street, Philadelphia, PA. Several of Caldwell’s academic programs have received specialized academic accreditations: Caldwell University is accredited by the Accreditation Council for Business Schools and Programs (ACBSP) to offer the following programs: B.S. in Business Administration, B.S. in Accounting, B.S. in Financial Economics, B.S. in Marketing, M.B.A., M.B.A. with a Concentration in Accounting, and an M.B.A. with a Concentration in Nonprofit Management.

Caldwell University 4
Applicants Admissions EnrollmentsPercent
AcceptedPercent Enrolled
First Time Freshman 3631 2306 332 64% 14%New Undergraduate Transfers 531 93 42 18% 45%New Adult Students 250 100 56 40% 56%New Graduate Students 442 238 173 54% 73%
Summary of New StudentsApplications, Admissions, Enrollments – Fall 2015
0 200 400 600 800
1000 1200 1400 1600 1800 2000 2200 2400 2600 2800 3000 3200 3400 3600 3800 4000
First Time Freshman New Undergraduate Transfers
New Adult Students New Graduate Students
New Student Enrollment Applicants Admissions Enrollments

Caldwell University 5
2011 2012 2013 2014 2015Applicants 1733 2625 2984 3178 3631Admissions 1108 1608 1912 2033 2306Enrollments 284 292 330 371 332
First Time Freshman Applications, Admissions, Enrollments Fall 2011 - 2015
0
500
1000
1500
2000
2500
3000
3500
4000
2011 2012 2013 2014 2015
Freshman Applicants, Admissions, Enrollment 2010-2014
Applicants
Admissions
Enrollments

Caldwell University 6
2011 2012 2013 2014 2015
Mean SAT * 992 982 1041 1017 1035
Number of Students Enrolled 306 292 330 371 332
Mean H.S. GPA * 3.23 3.25 3.47 3.44 3.44
* Mean score for traditionally accepted Freshman; not all freshman submitted scores/GPA
Mean SAT Scores and High School GPA Entering Freshman 2011-2015
900
950
1000
1050
1100
1150
2011 2012 2013 2014 2015
Mean SAT Score 2011 - 2015
Mean SAT *
Caldwell University 7
2011 2012 2013 2014 2015
Full Time 1093 1100 1187 1239 1256Part Time 43 31 32 18 28
TOTAL 1136 1131 1219 1257 1284
Full Time 157 160 115 112 119Part Time 354 300 242 225 192
TOTAL 511 460 357 337 311
Graduate Full Time 144 150 132 136 154Part Time 462 472 474 418 342
SUB TOTAL 606 622 606 554 496Doctoral
Full Time 1 3Part Time 33 44
SUBTOTAL 34 47TOTAL 606 622 606 588 543
GRAND TOTAL 2253 2213 2182 2182 2138
TOTAL ENROLLMENT - FALL 2011-FALL 2015
Traditional Undergraduates
Adult Undergraduates
Graduate & Doctoral
0
200
400
600
800
1000
1200
1400
2011 2012 2013 2014 2015
ENROLLMENT HISTORY FALL 2011 - FALL 2015
Traditional Undergraduates Adult Undergraduates Graduate & Doctoral

Caldwell University 8
2004 2005 2006 2007 2008 2009 2010 2011 2012 2013 2014 2015
Enrolled Initial Cohort 293 297 284 290 276 269 284 306 292 330 371 332
# Enrolled 264 267 251 260 257 242 260 288 263 309 356% Enrolled 90% 90% 88% 90% 93% 90% 92% 94% 90% 94% 96%
# Enrolled 212 218 201 208 208 192 216 252 212 270 309% Enrolled 72% 73% 71% 72% 75% 71% 76% 82% 73% 82% 83%
# Enrolled 170 189 161 173 188 156 176 224 185 244% Enrolled 58% 64% 57% 60% 68% 58% 62% 73% 63% 74%
# Enrolled 162 176 146 151 176 143 174 212 176% Enrolled 55% 59% 51% 52% 64% 53% 61% 69% 60%
# Enrolled 61 60 56 53 47 57 49 70% Enrolled 21% 20% 20% 18% 17% 21% 17% 23%Cumulative Graduates 98 117 94 104 127 84 117 137% Graduated 33% 39% 33% 36% 46% 31% 41% 45%
# Enrolled 6 9 11 5 9 5 10% Enrolled 2% 3% 4% 2% 3% 2% 4%Cumulative Graduates 148 166 138 155 165 139 159% Graduated 51% 56% 49% 53% 60% 52% 56%
# Enrolled 3 1 5 1 4 1% Enrolled 1% 0% 2% 0% 1% 0%Cumulative Graduates 153 172 144 159 172 141% Graduated 52% 58% 51% 55% 62% 52%
# Enrolled 2 0 3 1 1% Enrolled 1% 0% 1% 0% 0%Cumulative Graduates 154 173 149 159 174% Graduated 53% 58% 52% 55% 63%
Note: Year of graduation is defined as graduation within the 12 monthperiod beginning with a fall semester.
2 Years
First Time Freshman Retention2004 - 2015
First-Time Degree-Seeking Students
First semester (Fall to Spring)
1 Year (Fall to Fall)
3 Years
4 Years
5 Years
6 Years
7 Years or More

Caldwell University 9
2011 2012 2013 2014 2015
Full Time 1250 1260 1302 1352 1375Part Time 397 331 274 242 220
Total 1647 1591 1576 1594 1595
Graduate Full Time 144 150 132 136 154Part Time 462 472 474 418 342
Sub Total 606 622 606 554 496Doctoal
Full Time 1 3Part Time 33 44
Sub Total 34 47Total 606 622 606 588 543
TOTAL HEADCOUNT 2253 2213 2182 2182 2138
2011 2012 2013 2014 2015Undergraduate
Traditional 1138 1140 1246 1299 1303Adult 276 259 197 185 177
Total 1414 1399 1443 1484 1480 Graduate & Doctoral
FTE Graduate 402 406 384 377 383Total 402 406 384 377 383
TOTAL FTE* 1816 1805 1827 1861 1863
Graduate FTE = Credit Hours/9
Total Enrollment Headcount and Full Time EquivalencyFall 2011- 2015
Headcount
FTE's
Undergraduate
Graduate & Doctoral
0
500
1000
1500
2011 2012 2013 2014 2015
Total Headcount Full Time
Part Time
Graduate & Doctoral
0
500
1000
1500
2011 2012 2013 2014 2015
Total FTE Tradi&onal Adult FTE Graduate

Caldwell University 10
FT PT Total FT PT Total
Art 2 2 0 2Biology 0 0 0English 16 1 17 2 2 19History 1 1 0 1
Mathematics 3 3 1 1 4Multidisciplinary 0 0 0
Music 0 0 0Psychology 3 3 1 1 4
Social Studies 10 1 11 3 3 14Spanish 3 3 0 3
Undeclared 0 1 1 1Total Elementary 38 2 40 6 2 8 48
Art 3 3 0 3Biology 0 0 0English 12 12 1 1 2 14History 0 0 0
Mathematics 4 4 1 1 5Multidisciplinary 0 0 0
Music 5 5 0 5Psychology 2 2 0 2
Social Studies 11 11 1 2 3 14Spanish 2 2 0 2
Undeclared 21 21 1 1 2 23Total Pre-Education 60 0 60 4 4 8 68
Biology 1 1 0 1English 8 8 0 8History 0 0 0
Mathematics 4 4 0 4Music 4 4 0 4
Psychology 7 7 1 1 8Social Studies 6 6 1 1 2 8
Spanish 4 4 2 2 6Undeclared 0 0 0
Total Secondary 34 0 34 4 1 5 39Total Education 132 2 134 14 7 21 155*Please note that the totals for Education Majors are the sum of the concentrations
Pre-Education
Secondary Education
Undergraduate Enrollments: Education Majors and Content MajorsFall 2015
Traditional Adult Total
Elementary Education

Caldwell University 11
FT PT Total FT PT Total
Art 73 2 75 1 1 76Auditor 2 14 16 16Biology 120 120 1 1 121Business
Business Administration 117 1 118 16 37 53 171Accounting 61 61 5 5 10 71
Global Business 0 1 1 1Management 0 0
Marketing 21 21 21Financial Economics 10 1 11 2 1 3 14Sport Management
Chemistry 1 1 1 1 2CIS/Business 9 9 1 4 5 14CIS/Information Technology 31 31 1 1 32Communication Arts 82 2 84 4 4 8 92Criminal Justice 64 3 67 5 28 33 100English 39 1 40 3 5 8 48Education 37 2 39 8 4 12 51French 0Health Sciences 62 1 63 9 6 15 78History 11 2 13 2 1 3 16Individualized Major 9 9 9Mathematics 23 23 1 1 24Medical Technology 4 4 2 2 6Multidisciplinary 2 2 2Music 11 1 12 12Nursing 154 8 162 5 9 14 176Occupational Therapy 2 2 2Political Science 7 7 1 1 8Pre-Med/Post-Bac 7 1 8 8*Psychology 172 172 30 38 68 240School Nurse Cert Teacher Health 5 5 5School Nurse Certification 3 3 3Social Studies 19 1 20 2 7 9 29Sociology 18 18 1 10 11 29Spanish 6 1 7 2 2 9Theology 1 1 2 2 3Undeclared 92 2 94 7 5 12 106
TOTAL 1256 28 1284 119 192 311 1595
*There were 38 Trad FT, 1 CE FT, 1 Trad PT and 0 CE PT students who had an Art Therapy Concentration
Undergraduate Student Enrollment by Major Fall 2015Traditional Adult Total
Headcount

Caldwell University 12
2011 2012 2013 2014 2015Art 77 22 20 35 79Auditor 24 25 19 9 16Business Division
Accounting 99 90 79 67 75Business Administration 181 161 165 169 178
Computer Information Systems 40 34 41 44 51Financial Economics 25 19 17 15 15
Global Business 20 17 1 1 1Management 21 26 10 6
Marketing 16 19 23 25 21Sport Management 2
Communication Arts 75 72 93 82 93Criminal Justice 146 137 146 123 106Education 308 229 197 174 155English 154 134 96 78 67Modern Languages
French 3 1Spanish 26 19 19 16 16
History/Social StudiesHistory 26 17 22 16 18
Political Science 23 17 15 11 11Social Studies 95 84 70 58 44
Individualized Major 1 1 1 2 10Mathematics 54 43 39 38 33Medical Technology 8 6 7 10 6Multidisciplinary Studies 16 8 4 2 2Music 24 19 11 17 13Natural Sciences
Biology 102 113 139 117 124Chemistry 8 5 3 1 2
Health Sciences 1 30 78Pre-Med Post-Bac 11 8
Teacher of Health & School Nurse Concentration 13 11 7 7 5School Nurse Concentration 10 8 13 9 3
Nursing 76 48 206 199 176Occupational Therapy 4 2Pre-Nursing 81 121 3Psychology 274 274 311 281 266Theology 6 6 3 1 3Sociology 56 55 45 37 32Undeclared 124 111 110 125 108
TOTAL* 2212 1952 1936 1822 1817*Figures include double majors
Total Undergraduate Student Enrollment by MajorFall 2011 - 2015

Caldwell University 13
Program 2011 2012 2013 2014 2015
M.A. Counseling Psych w/ School Couns Special. 35 39 34 35 28M.A Counseling Psych w/ Art Therapy Special. 36 41 45 58 62M.A Counseling Psych w/ Mental Health Counseling 42 46 30 32 32
M.A. Applied Behavior Analysis 79 88 91 77 49
M.A. Special Education 46 34 22 14 5MA Special Education/LDTC Program 15 25 22 15 11M.A. Special Education/TOSD 15 9 9 30 20
M.A. Curriculum & Instruction 21 25 31 23 20
M.A. Educational Administration 19 30 23 17 24
M.A. Literacy Instruction 21 26 37 43 39M.A. Literacy Instruction/Reading Specialist Cert 10 11 5
M.B.A. 39 42 36 29 37M.B.A. w/Accounting Specialization 8 5 8 10 10M.B.A./Human Resources 1 4 3 4M.B.A./Marketing 1 2M.B.A./Nonprofit Management 3 2 3 1
M.A. Pastoral Ministry 4 2 1
M.S. Accounting 3 5 12 8 4
Post Bac. Applied Behavior AnalysisPost Bac. Elementary Education 65 33 39 49 37Post-Bac Human Resources 1Post Bac. Secondary Education 14 21 22 16 23Post Bac. Special Education Certification 32 27 27 19 17
Post MA Supervisor's Certification 16 23 22 16 21Post MA Director of School Counseling 2 1 2 2 1Post MA Principal's Certification 15 25 16 13 17Post MA ESL Certification 3 4 3Post MA Prof. Counselor Licensing Program 1 5 3 3 6Post MA School Counseling 6 1 1 3 2Post MA School Counseling Certification 1 2Post Graduate MA in Art Therapy 9 4 5 5 1Post-MA Superintendent Certification 2 6 7 5Post MA Applied Behavior Analysis 19 12 16 13 7Post MA Certification- LD Teacher Consultant 5 7 5 6 8Post MA Reading Specialist 1 3 5 3 1
Ph.D. Applied Behavior Analysis 17 17 17 15 12PhD Educational Leadership 4 2Ed.D Educational Leadership 15 34Non-Matriculated 8 4 1 1 2
TOTAL 606 622 606 588 543
Graduate Enrollment By ProgramFall 2011- 2015
Caldwell University 14
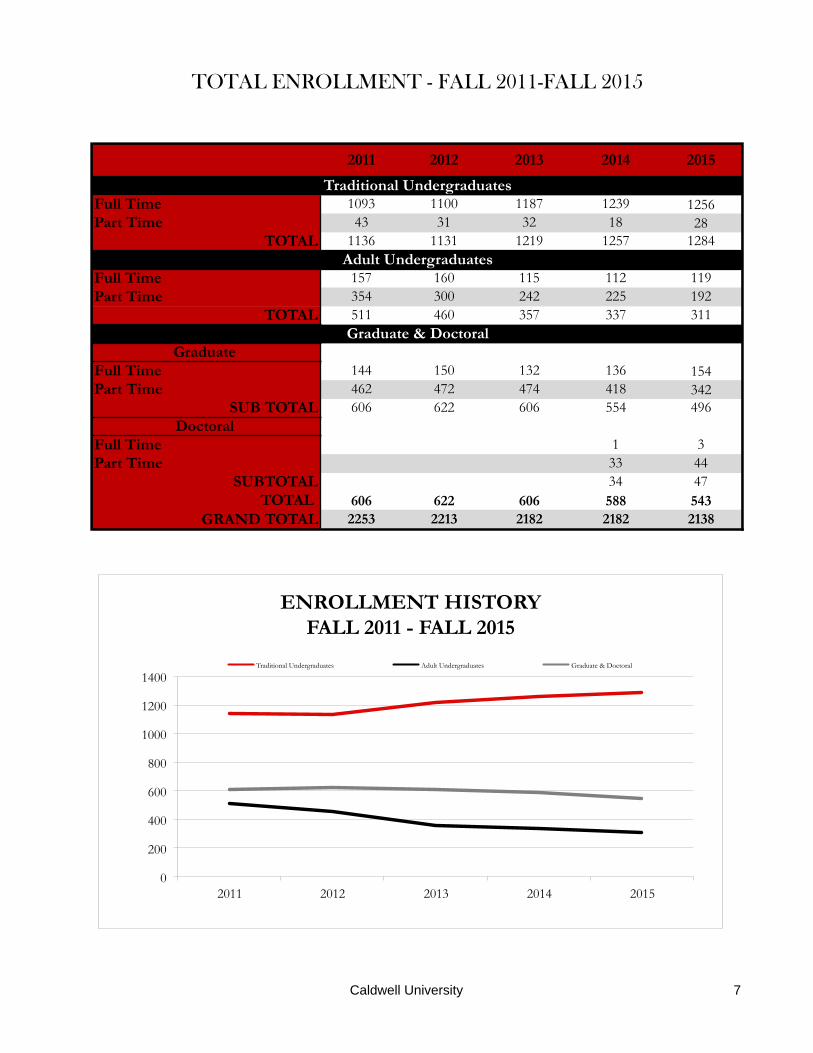
FT Traditional
UG
PT Traditional
UGFT Adult UG PT Adult UG
# %Female 904 16 77 141 1138 71%
Male 352 12 42 51 457 29%
Total 1256 28 119 192
# % # %Female 920 72% 218 70%
Male 364 28% 93 30%
Total 1284 100% 311 100%
Traditional Adult
Undergraduate Enrollment By GenderFall 2015
Total
1595
0% 10% 20% 30% 40% 50% 60% 70% 80% 90%
100%
FT Traditional UG PT Traditional UG FT Adult UG PT Adult UG
Attendance Status by Student Type
Female Male
Caldwell University 15
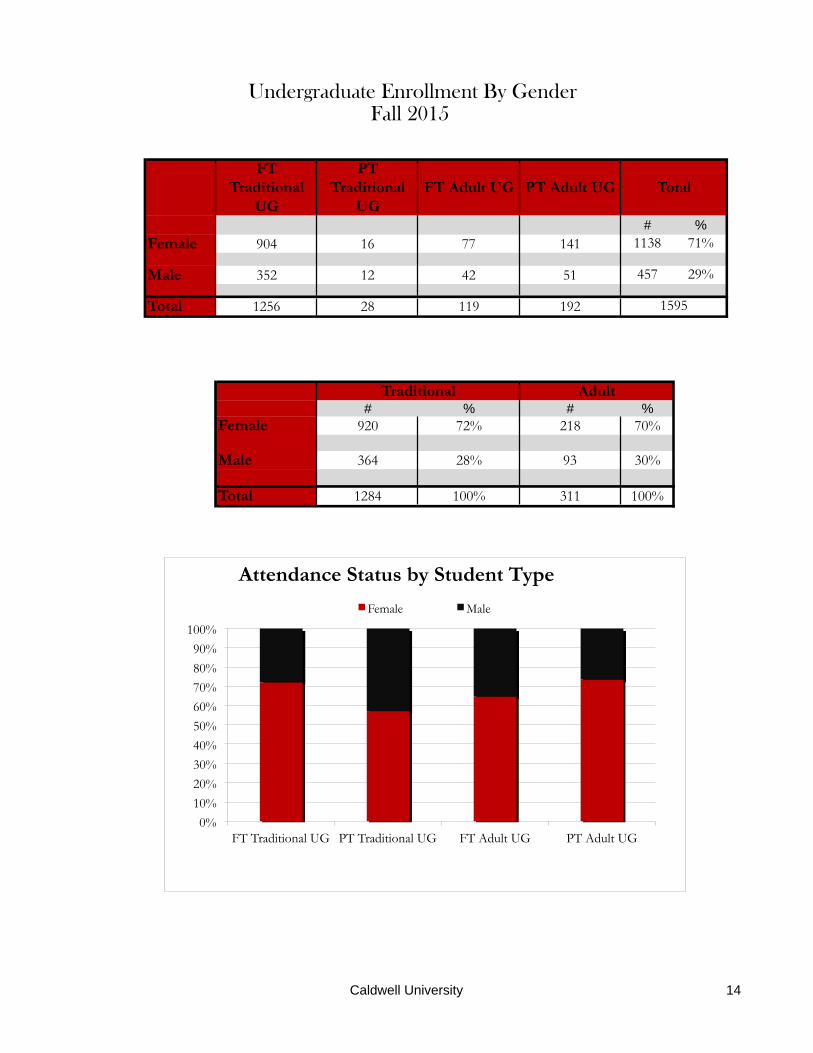
Full Time Part-Time Total Full-Time Part-Time Total2011 46 89 135 98 373 471
2012 42 96 138 108 376 484
2013 30 70 100 102 404 506
2014 17 76 93 120 375 495
2015 24 70 94 133 316 449
Graduate Enrollment By Gender5 Year Trend: Fall 2011- Fall 2015
Male Female
8% 7% 5% 3% 4%
15% 15% 12% 13% 13%
16% 17% 17% 20% 25%
62% 60% 67% 64% 58%
0%
10%
20%
30%
40%
50%
60%
70%
80%
90%
100%
2011 2012 2013 2014 2015
Fall Enrollment by Gender and Attendance Status
Male Full-Time Male Part-Time Female Full-Time Female Part-Time

Caldwell University 16
2011 2012 2013 2014 2015
1 3 0 1 0
178 184 151 190 197
29 36 56 65 54
583 585 494 566 528
192 197 195 237 254
74 61 53 58 74
Native Hawaiian* 2 2 3 3 4
2+ Races* 15 20 14 23 21
176 172 336 209 243
Total Full Time Enrollment 1250 1260 1302 1352 1375
2011 2012 2013 2014 2015
1 0 1 0 1
86 73 43 46 41
10 13 5 12 7
179 136 86 109 97
44 33 24 26 28
5 6 3 1 3
Native Hawaiian* 0 1 1 1 1
2+ Races* 3 3 0 2 1
69 66 111 45 41
Total Part Time Enrollment 397 331 274 242 220
Fall 2011-2015
Full Time Undergraduate Enrollment Headcount by Race/EthnicityFall 2011- 2015
American Indian/Alaskan
Black (non-Hispanic)
Asian/pacific Islander
White (non-Hispanic)
Hispanic
International
Not Reported
Part Time Undergraduate Enrollment Headcount by Race/Ethnicity
International
Not Reported
American Indian/Alaskan
Black (non-Hispanic)
Asian/pacific Islander
White (non-Hispanic)
Hispanic
Caldwell University 17
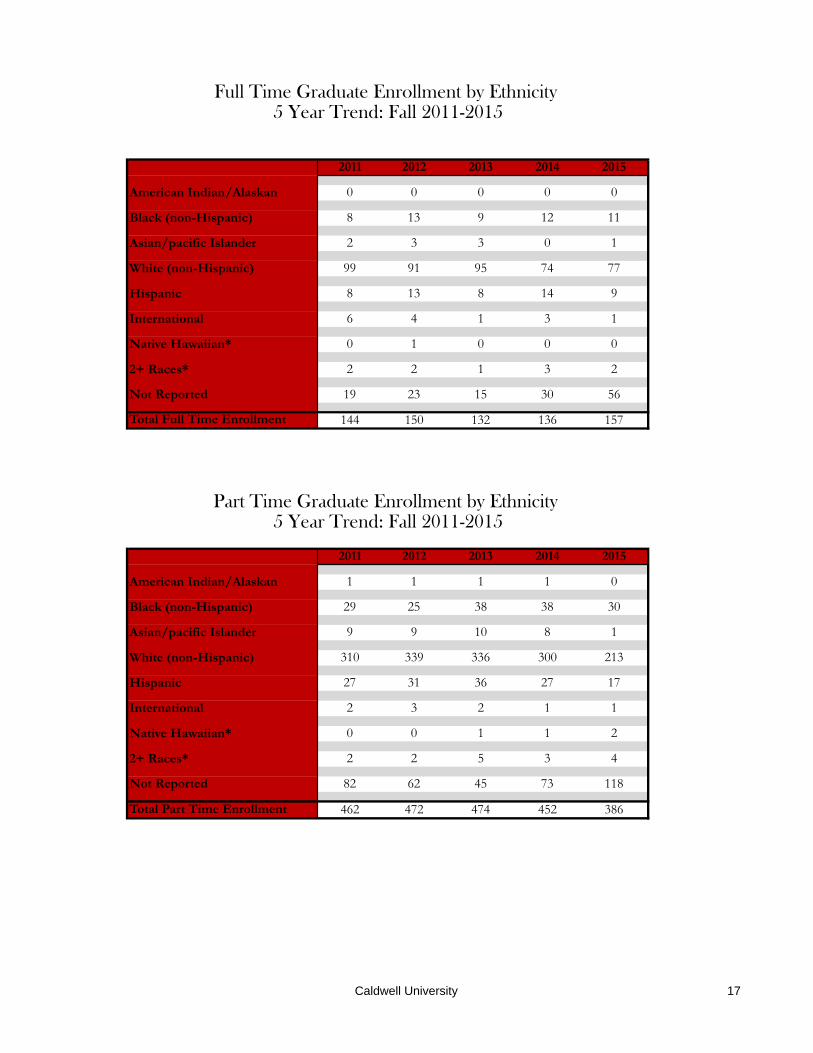
2011 2012 2013 2014 2015
American Indian/Alaskan 0 0 0 0 0
Black (non-Hispanic) 8 13 9 12 11
Asian/pacific Islander 2 3 3 0 1
White (non-Hispanic) 99 91 95 74 77
Hispanic 8 13 8 14 9
International 6 4 1 3 1
Native Hawaiian* 0 1 0 0 0
2+ Races* 2 2 1 3 2
19 23 15 30 56
Total Full Time Enrollment 144 150 132 136 157
2011 2012 2013 2014 2015
American Indian/Alaskan 1 1 1 1 0
Black (non-Hispanic) 29 25 38 38 30
Asian/pacific Islander 9 9 10 8 1
White (non-Hispanic) 310 339 336 300 213
Hispanic 27 31 36 27 17
International 2 3 2 1 1
Native Hawaiian* 0 0 1 1 2
2+ Races* 2 2 5 3 4
82 62 45 73 118
Total Part Time Enrollment 462 472 474 452 386
Not Reported
Full Time Graduate Enrollment by Ethnicity 5 Year Trend: Fall 2011-2015
Not Reported
Part Time Graduate Enrollment by Ethnicity 5 Year Trend: Fall 2011-2015
Caldwell University 18
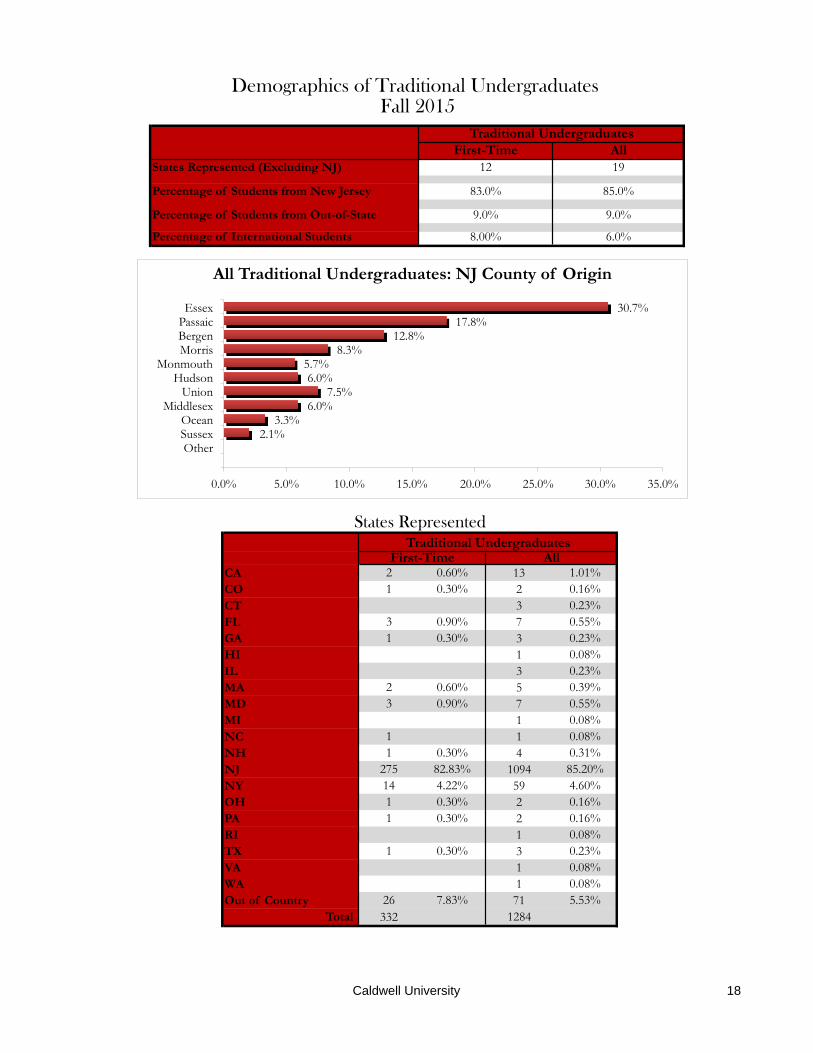
CA 2 0.60% 13 1.01%CO 1 0.30% 2 0.16%CT 3 0.23%FL 3 0.90% 7 0.55%GA 1 0.30% 3 0.23%HI 1 0.08%IL 3 0.23%MA 2 0.60% 5 0.39%MD 3 0.90% 7 0.55%MI 1 0.08%NC 1 1 0.08%NH 1 0.30% 4 0.31%NJ 275 82.83% 1094 85.20%NY 14 4.22% 59 4.60%OH 1 0.30% 2 0.16%PA 1 0.30% 2 0.16%RI 1 0.08%TX 1 0.30% 3 0.23%VA 1 0.08%WA 1 0.08%Out of Country 26 7.83% 71 5.53%
Total 332 1284
States Represented (Excluding NJ) 12 19
Demographics of Traditional Undergraduates Fall 2015
Traditional UndergraduatesFirst-Time All
First-Time All
Percentage of Students from New Jersey 83.0% 85.0%
Percentage of Students from Out-of-State 9.0% 9.0%
Percentage of International Students 8.00% 6.0%
States RepresentedTraditional Undergraduates
2.1% 3.3%
6.0% 7.5%
6.0% 5.7%
8.3% 12.8%
17.8% 30.7%
0.0% 5.0% 10.0% 15.0% 20.0% 25.0% 30.0% 35.0%
Other Sussex Ocean
Middlesex Union
Hudson Monmouth
Morris Bergen Passaic Essex
All Traditional Undergraduates: NJ County of Origin

Caldwell University 19
ARCAMTNJNYPAOut of Country
Total
Demographics of Adult Undergraduates Fall 2015
Adult UndergraduatesStates Represented (Excluding NJ) 5
Percentage of Students from New Jersey 96.5%
Percentage of Students from Out-of-State 3.50%
Percentage of International Students 0%
States RepresentedAdult Undergraduates1 0.32%1 0.32%1 0.32%
300 96.46%
311
6 1.93%2 0.64%
0.00%
3% 1%
3% 4%
6% 7%
5% 4%
9% 12%
45%
0% 5% 10% 15% 20% 25% 30% 35% 40% 45% 50%
Other Hunterdon
Sussex Somerset
Hudson Middlesex
Union Bergen Passaic Morris Essex
All Adult Undergraduates: NJ County of Origin
Caldwell University 20
CTFLNJNYPAWI
Out of CountryTotal
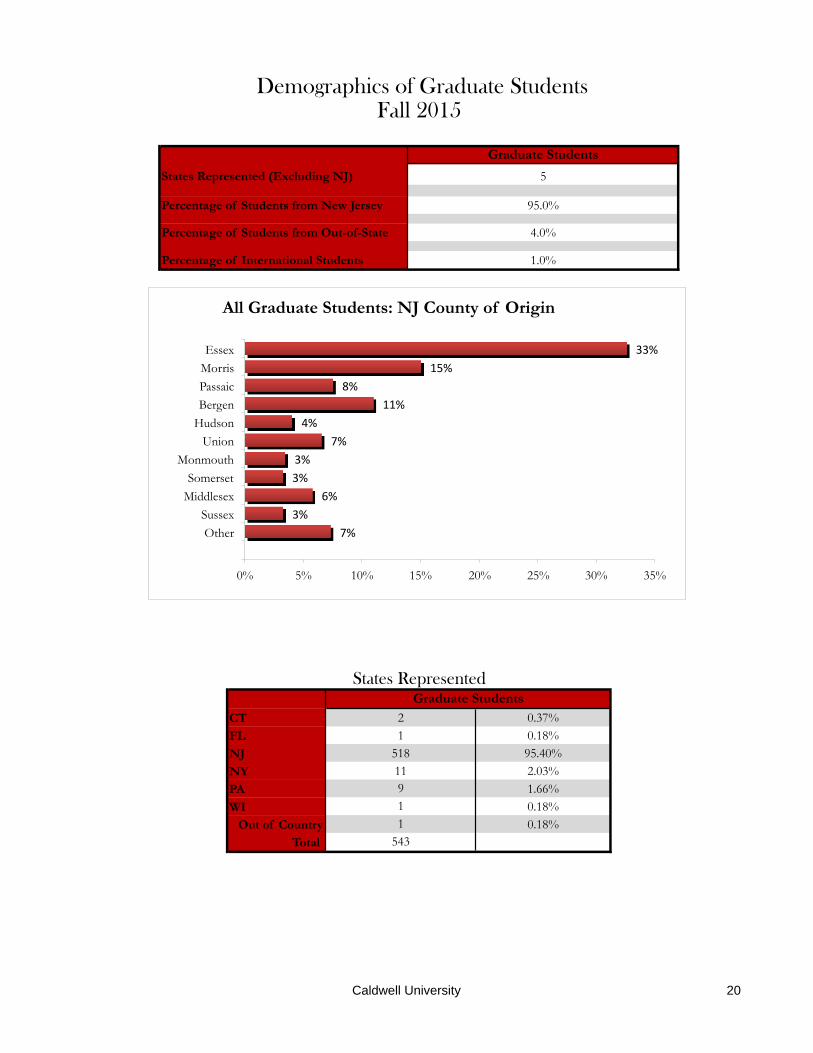
Demographics of Graduate StudentsFall 2015
Graduate Students
States Represented (Excluding NJ) 5
Percentage of Students from New Jersey 95.0%
Percentage of Students from Out-of-State 4.0%
1 0.18%518 95.40%
Percentage of International Students 1.0%
States RepresentedGraduate Students
2 0.37%
1 0.18%543
11 2.03%9 1.66%1 0.18%
7% 3%
6% 3% 3%
7% 4%
11% 8%
15% 33%
0% 5% 10% 15% 20% 25% 30% 35%
Other Sussex
Middlesex Somerset
Monmouth Union
Hudson Bergen Passaic Morris Essex
All Graduate Students: NJ County of Origin
Caldwell University 21
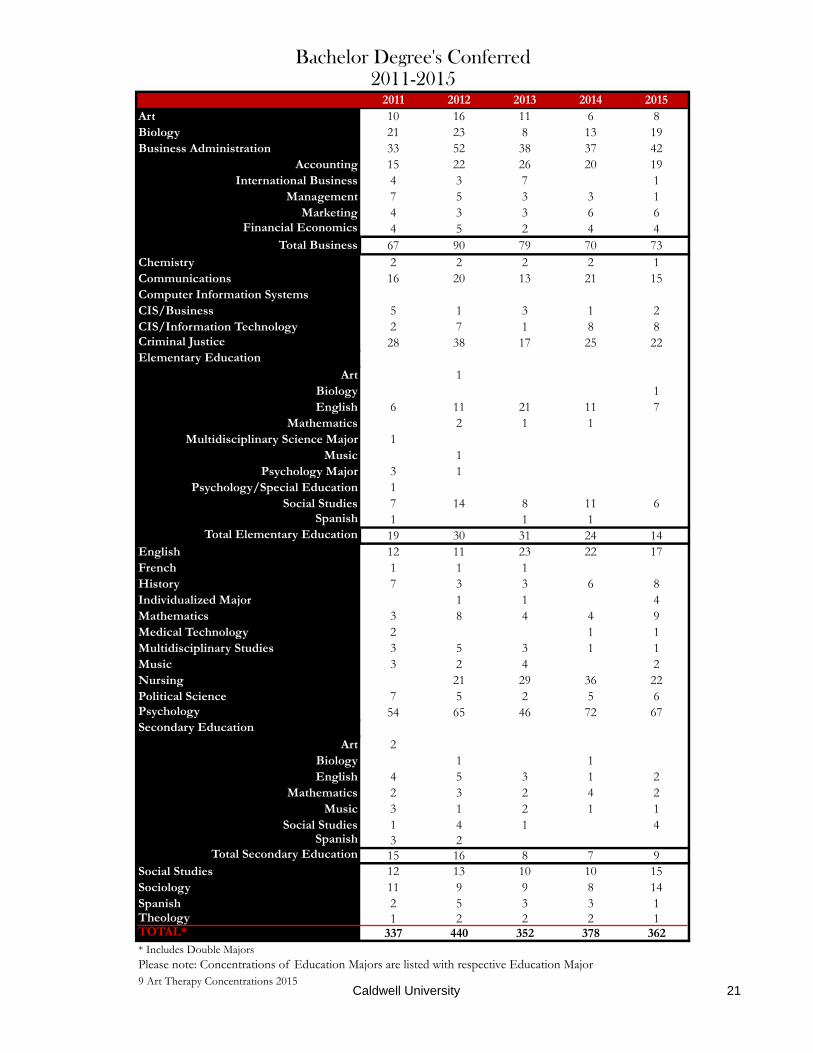
2011 2012 2013 2014 2015Art 10 16 11 6 8Biology 21 23 8 13 19Business Administration 33 52 38 37 42
Accounting 15 22 26 20 19International Business 4 3 7 1
Management 7 5 3 3 1Marketing 4 3 3 6 6
Financial Economics 4 5 2 4 4Total Business 67 90 79 70 73
Chemistry 2 2 2 2 1Communications 16 20 13 21 15Computer Information SystemsCIS/Business 5 1 3 1 2CIS/Information Technology 2 7 1 8 8Criminal Justice 28 38 17 25 22Elementary Education
Art 1Biology 1English 6 11 21 11 7
Mathematics 2 1 1Multidisciplinary Science Major 1
Music 1Psychology Major 3 1
Psychology/Special Education 1Social Studies 7 14 8 11 6
Spanish 1 1 1Total Elementary Education 19 30 31 24 14
English 12 11 23 22 17French 1 1 1History 7 3 3 6 8Individualized Major 1 1 4Mathematics 3 8 4 4 9Medical Technology 2 1 1Multidisciplinary Studies 3 5 3 1 1Music 3 2 4 2Nursing 21 29 36 22Political Science 7 5 2 5 6Psychology 54 65 46 72 67Secondary Education
Art 2Biology 1 1English 4 5 3 1 2
Mathematics 2 3 2 4 2Music 3 1 2 1 1
Social Studies 1 4 1 4Spanish 3 2
Total Secondary Education 15 16 8 7 9Social Studies 12 13 10 10 15Sociology 11 9 9 8 14Spanish 2 5 3 3 1Theology 1 2 2 2 1TOTAL* 337 440 352 378 362* Includes Double MajorsPlease note: Concentrations of Education Majors are listed with respective Education Major9 Art Therapy Concentrations 2015
Bachelor Degree's Conferred2011-2015
Caldwell University 22
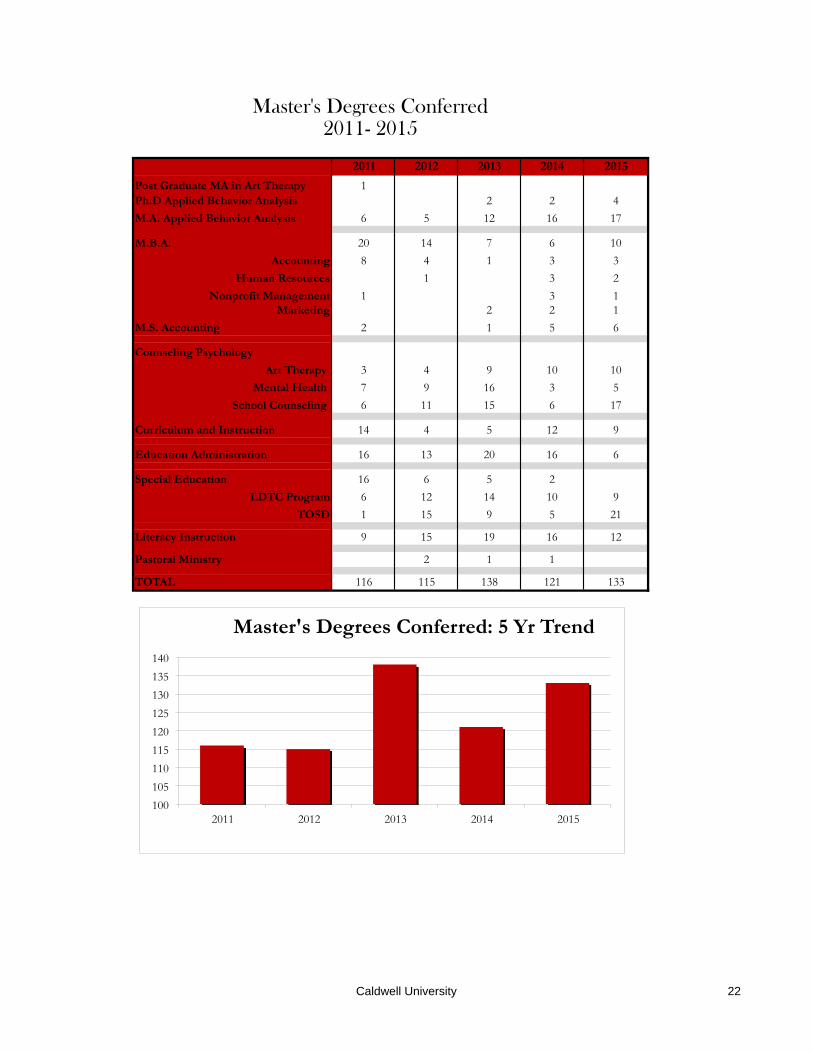
2011 2012 2013 2014 2015
Post Graduate MA in Art Therapy 1Ph.D Applied Behavior Analysis 2 2 4
M.A. Applied Behavior Analysis 6 5 12 16 17
M.B.A. 20 14 7 6 10
Accounting 8 4 1 3 3
Human Resources 1 3 2
Nonprofit Management 1 3 1Marketing 2 2 1
M.S. Accounting 2 1 5 6
Counseling Psychology
Art Therapy 3 4 9 10 10
Mental Health 7 9 16 3 5
School Counseling 6 11 15 6 17
Curriculum and Instruction 14 4 5 12 9
Education Administration 16 13 20 16 6
Special Education 16 6 5 2
LDTC Program 6 12 14 10 9
TOSD 1 15 9 5 21
Literacy Instruction 9 15 19 16 12
Pastoral Ministry 2 1 1
TOTAL 116 115 138 121 133
Master's Degrees Conferred2011- 2015
100
105
110
115
120
125
130
135
140
2011 2012 2013 2014 2015
Master's Degrees Conferred: 5 Yr Trend

Caldwell University 23
2011 2012 2013 2014 2015
$25,990 $26,990 $27,900 $28,900 $29,950
Part Time Traditional $712 $738 $738 $802 $830
$628 $650 $650 $675 $700
Graduate - Per Credit $800 $830 $850 $890 $930Graduate
Tuition Rates2011-2015
Undergraduate
Full Time Traditional
Part Time Adult
$24,000
$26,000
$28,000
$30,000
$32,000
2011 2012 2013 2014 2015
Full Time Undergraduate Tuition 2011 -‐ 2015
$580 $600 $620 $640 $660 $680 $700 $720
2011 2012 2013 2014 2015
Part Time Adult Tuition: 5 Yr Trend
$700
$750
$800
$850
$900
$950
2011 2012 2013 2014 2015
Graduate Tuition: 5 Yr Trend

Caldwell University 24
FY2011 FY2012 FY2013 FY2014 FY2015
(2010-2011) (2011-2012) (2012-2013) (2013-2014) (2014-2015)Total Financial Aid (all Students) $31,000,000 $29,300,000 $29,278,761 $33,233,099 $36,635,317
Total Caldwell Grants and Scholarships (all students)
$11,600,000 $12,900,000 $12,944,083 $15,074,322 $18,313,290
Caldwell Aid as % of Total Aid 37.0% 44.0% 43.0% 45.0% 50.0%
Number of First-Time Full-Time Freshman 284 306 292 330 371
Number of First-Time Full-Time Freshman receiving any financial aid
258 285 281 327 370
% First-Time Full-Time Freshman Receiving Any Financial Aid
91% 93% 96% 99% 99%
Number of First-Time Full-Time Freshman receiving CC grants/ scholarships
246 270 275 321 370
% of First-Time Full-Time Freshman receiving CC grants/ scholarships
87% 88% 94% 97% 99%
Total CC Grants and Scholarships (First-Time Full-Time Freshman)
$3,321,000 $3,671,470 $3,539,762 $5,041,865 $5,998,242
Freshman Tuition Discount 45.65% 44.62% 45.00% 54.80% 53.0%
Financial Aid Fiscal Years 2011- 2015
$0
$5,000,000
$10,000,000
$15,000,000
$20,000,000
$25,000,000
$30,000,000
$35,000,000
$40,000,000
Total Financial Aid vs. Total Institutional Grants/Scholarships
Total Caldwell Grants and Scholarships (all students) Total Financial Aid (all Students)
Caldwell University 25
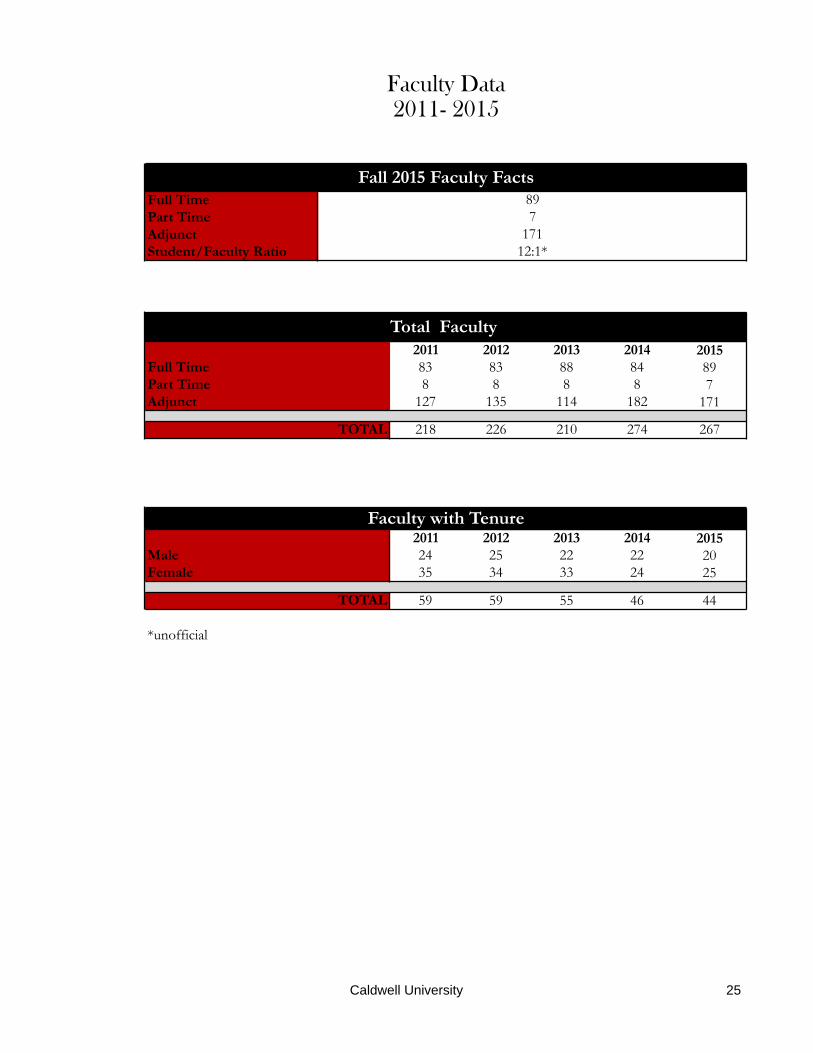
Full Time Part TimeAdjunctStudent/Faculty Ratio
2011 2012 2013 2014 201583 83 88 84 898 8 8 8 7
127 135 114 182 171
218 226 210 274 267
2011 2012 2013 2014 201524 25 22 22 2035 34 33 24 25
59 59 55 46 44
*unofficial
171
Faculty Data2011- 2015
Fall 2015 Faculty Facts897
TOTAL
12:1*
Total Faculty
Full TimePart TimeAdjunct
TOTAL
Faculty with Tenure
MaleFemale
Caldwell University 26
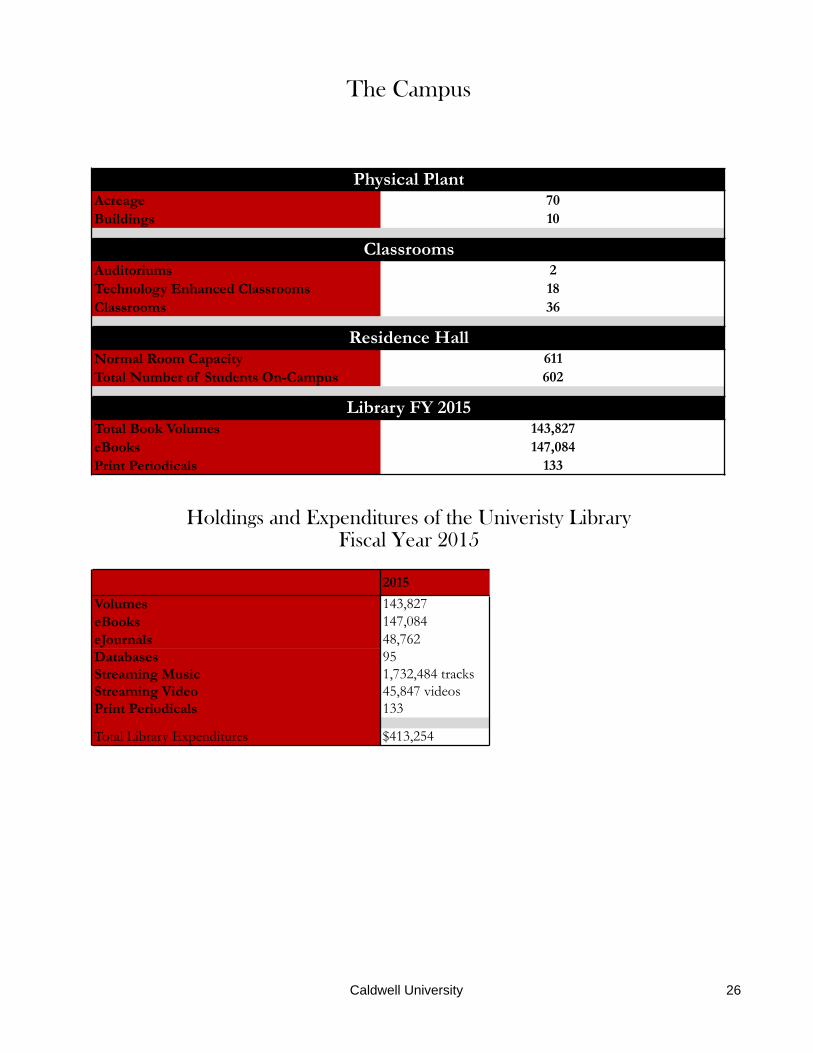
AcreageBuildings
AuditoriumsTechnology Enhanced ClassroomsClassrooms
Normal Room CapacityTotal Number of Students On-Campus
Total Book VolumeseBooksPrint Periodicals
2015
Volumes 143,827eBooks 147,084eJournals 48,762Databases 95Streaming Music 1,732,484 tracksStreaming Video 45,847 videos Print Periodicals 133
Total Library Expenditures $413,254
Library FY 2015
The Campus
Physical Plant7010
Classrooms21836
Residence Hall611602
143,827147,084
133
Holdings and Expenditures of the Univeristy LibraryFiscal Year 2015

Caldwell University 27
Net Tuition and Fees $31,215,000 Instruction 11,618,407$ Contributed Services $0 Academic Support 4,640,025$ Government $1,237,018 Student Services 1,683,000$ Private Contributions $1,870,000 Development 1,738,000$ Investment Income $150,000 Enrollment Management 5,596,000$ Auxiliary Enterprises $8,082,400 Institutional Support 10,883,000$ Other Revenue $315,000 Auxiliary Enterprises 5,383,000$
Miscellaneous 370,000$
Total Revenues $42,869,418 Total Expenditures $41,911,432
Total Operating Expenses 2011-2015
Fiscal Year Total 2011 $32,458,000
2012 $36,370,000
2013 $37,628,000
2014 $39,296,000
2015 $42,352,000
Caldwell University Approved BudgetFY 2016
Operating Revenues Operating Expenditures
Educational & General Educational & General
Recommended


![⃝ß [eustace mullins] secrets of the federal reserve](https://img.pdfslide.net/doc/110x75/568ca8dd1a28ab186d9b1974/ss-eustace-mullins-secrets-of-the-federal-reserve.jpg)