Evaluating Mozambique’s Agricultural Investment Plan: Round Two
James Thurlow
International Food Policy Research Institute, Washington DC
Coauthors:
Rui Benfica and Benedito Cunguara
Michigan State University, Maputo
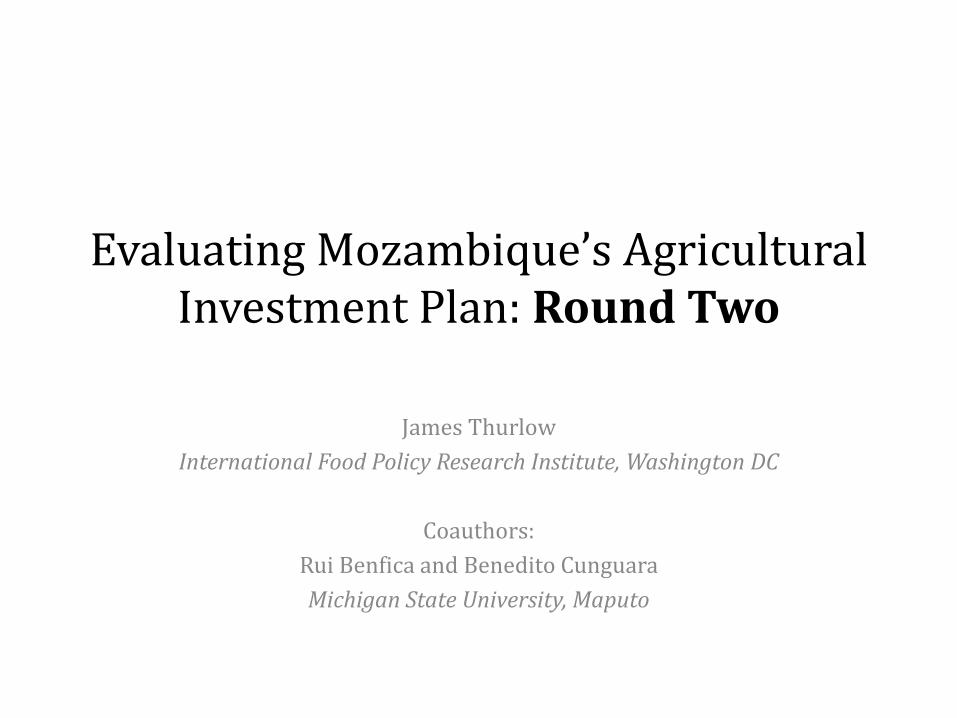
PNISA
• Ambitious investment plan for 2013-2017
• Doubles share of agricultural spending in the budget
• Diversifies investments relative to historical spending
5.4
5.5
13.2
8.8
11.0
0
2
4
6
8
10
12
14
2002 05 08 11 14 17
Shar
e o
f b
ud
get
(%) Historical
PNISA
31%
31%
9%
10%
19%Spending portfolio
Irrigation
R&E
Subsidies
Other MINAG
Fisheries & roads
Evaluating PNISA
• Evaluation questions:– What does PNISA mean for agricultural growth and poverty reduction?
– Can outcomes be improved by re-prioritizing investment areas?
– What is the relative importance of increasing spending vs. efficiency?
• Mixed methods approach:– Econometric estimates of farm-level impacts using historical data
– Economywide model then measures growth and poverty outcomes
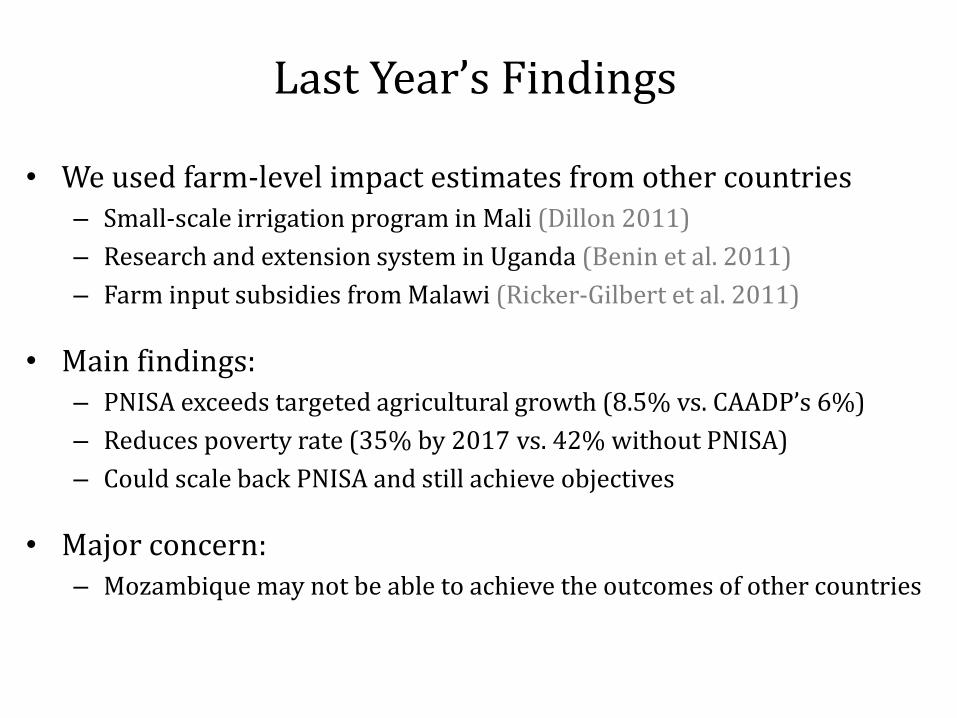
Last Year’s Findings
• We used farm-level impact estimates from other countries– Small-scale irrigation program in Mali (Dillon 2011)
– Research and extension system in Uganda (Benin et al. 2011)
– Farm input subsidies from Malawi (Ricker-Gilbert et al. 2011)
• Main findings:– PNISA exceeds targeted agricultural growth (8.5% vs. CAADP’s 6%)
– Reduces poverty rate (35% by 2017 vs. 42% without PNISA)
– Could scale back PNISA and still achieve objectives
• Major concern:– Mozambique may not be able to achieve the outcomes of other countries
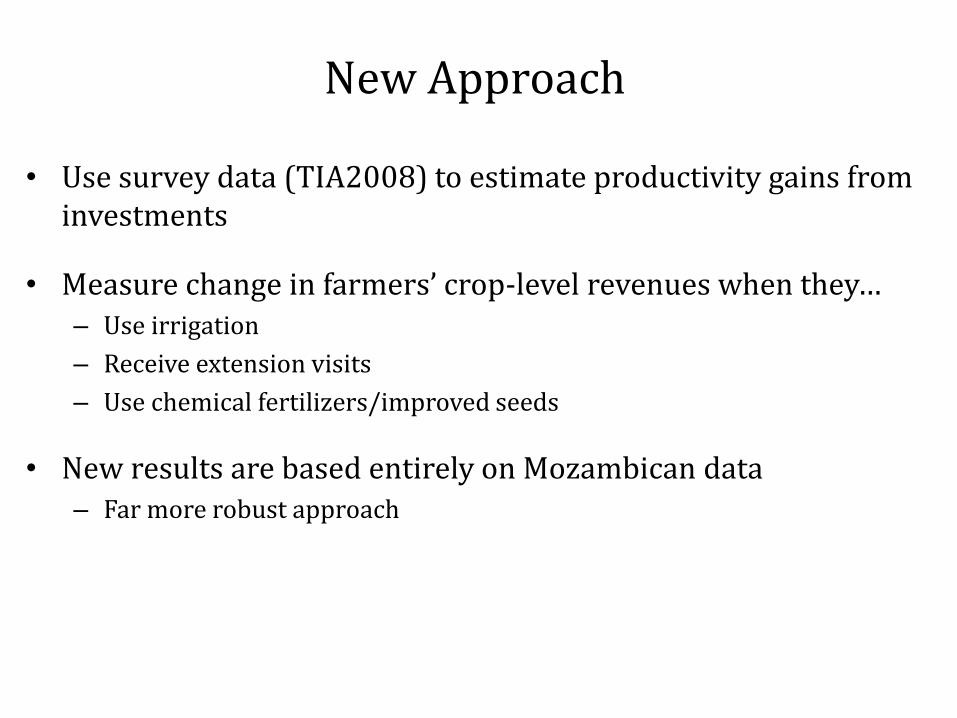
New Approach
• Use survey data (TIA2008) to estimate productivity gains from investments
• Measure change in farmers’ crop-level revenues when they… – Use irrigation
– Receive extension visits
– Use chemical fertilizers/improved seeds
• New results are based entirely on Mozambican data– Far more robust approach
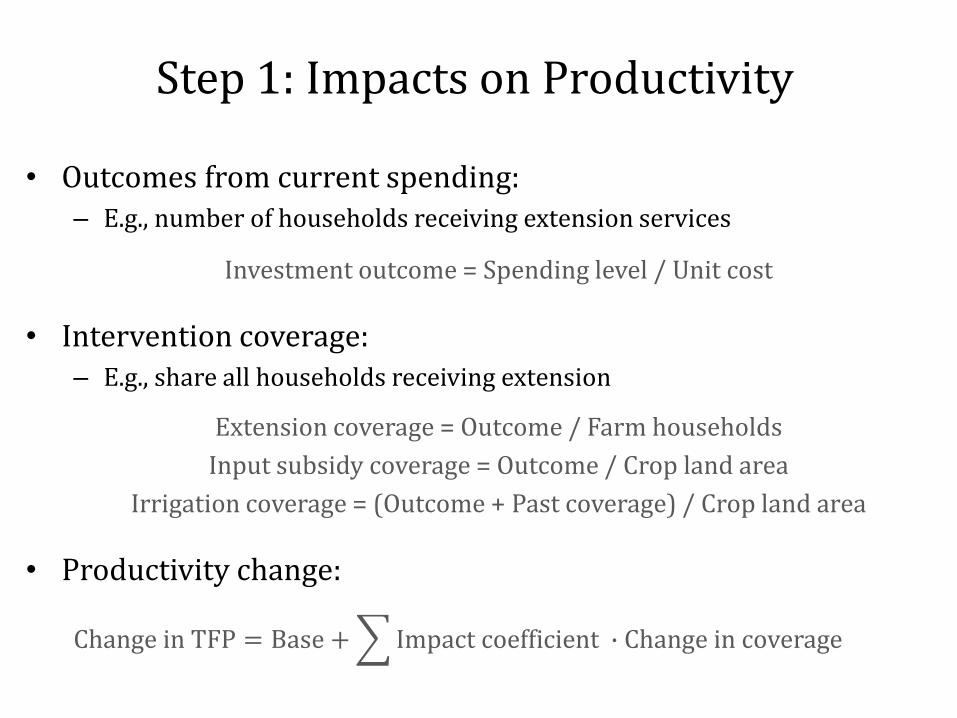
Step 1: Impacts on Productivity
• Outcomes from current spending:– E.g., number of households receiving extension services
Investment outcome = Spending level / Unit cost
• Intervention coverage:– E.g., share all households receiving extension
Extension coverage = Outcome / Farm households
Input subsidy coverage = Outcome / Crop land area
Irrigation coverage = (Outcome + Past coverage) / Crop land area
• Productivity change:
Change in TFP = Base + Impact coefficient ∙ Change in coverage
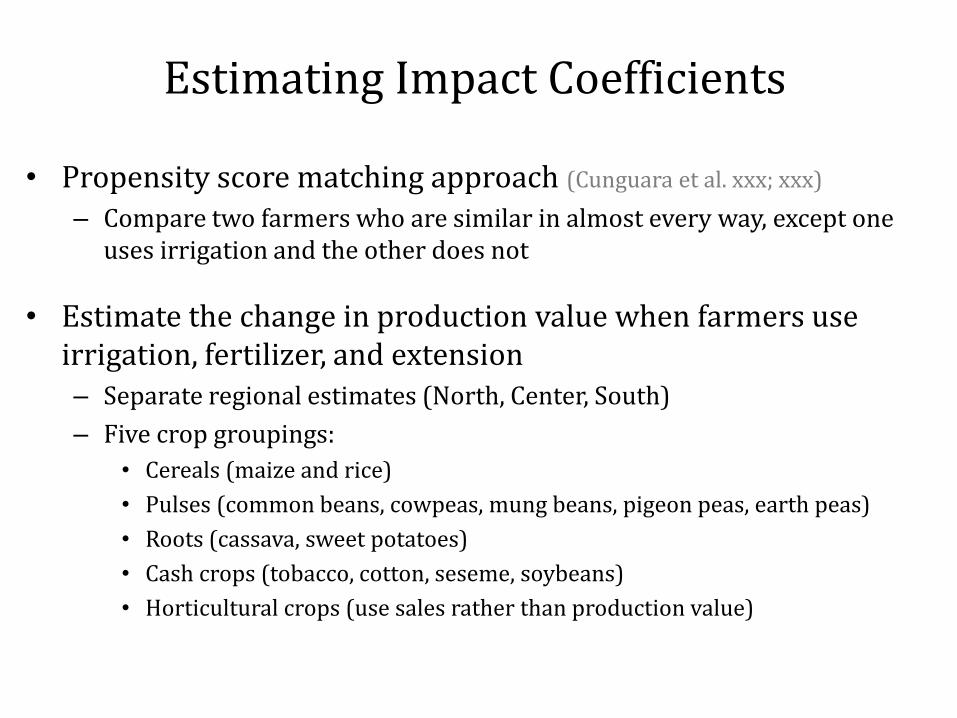
Estimating Impact Coefficients
• Propensity score matching approach (Cunguara et al. xxx; xxx)
– Compare two farmers who are similar in almost every way, except one uses irrigation and the other does not
• Estimate the change in production value when farmers use irrigation, fertilizer, and extension– Separate regional estimates (North, Center, South)
– Five crop groupings:
• Cereals (maize and rice)
• Pulses (common beans, cowpeas, mung beans, pigeon peas, earth peas)
• Roots (cassava, sweet potatoes)
• Cash crops (tobacco, cotton, seseme, soybeans)
• Horticultural crops (use sales rather than production value)
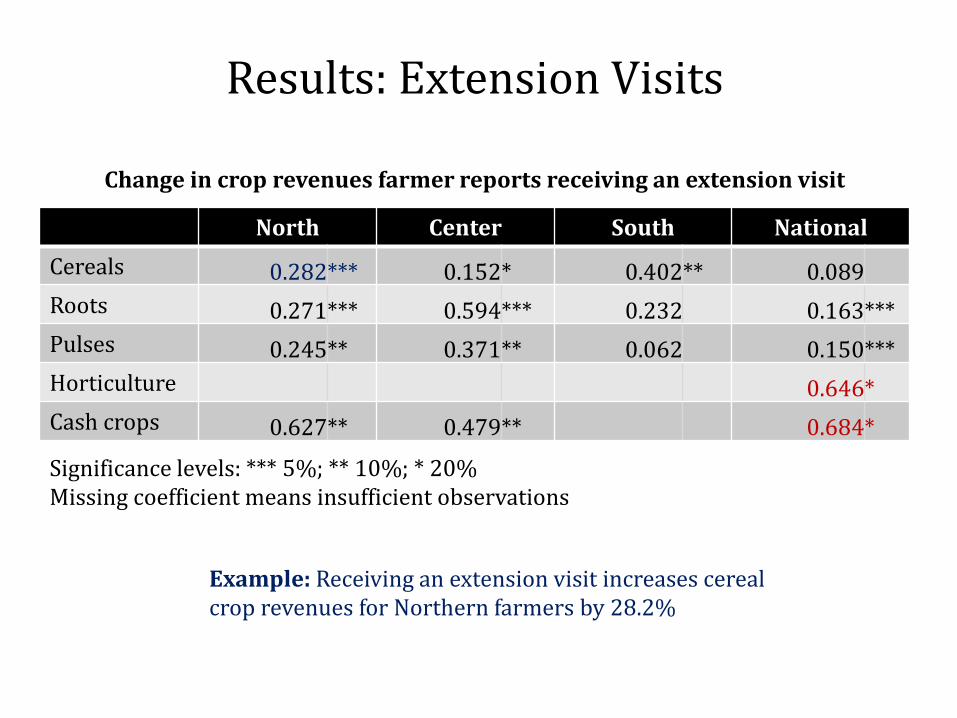
Results: Extension Visits
North Center South National
Cereals 0.282*** 0.152* 0.402** 0.089
Roots 0.271*** 0.594*** 0.232 0.163***
Pulses 0.245** 0.371** 0.062 0.150***
Horticulture 0.646*
Cash crops 0.627** 0.479** 0.684*
Change in crop revenues farmer reports receiving an extension visit
Significance levels: *** 5%; ** 10%; * 20%Missing coefficient means insufficient observations
Example: Receiving an extension visit increases cereal crop revenues for Northern farmers by 28.2%
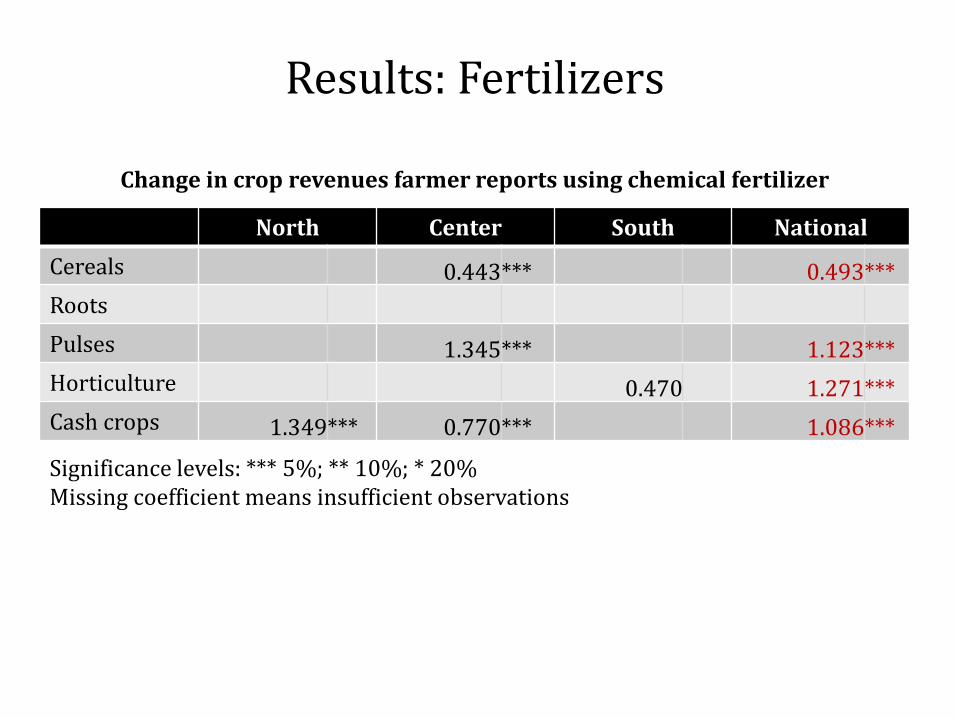
Results: Fertilizers
North Center South National
Cereals 0.443*** 0.493***
Roots
Pulses 1.345*** 1.123***
Horticulture 0.470 1.271***
Cash crops 1.349*** 0.770*** 1.086***
Change in crop revenues farmer reports using chemical fertilizer
Significance levels: *** 5%; ** 10%; * 20%Missing coefficient means insufficient observations
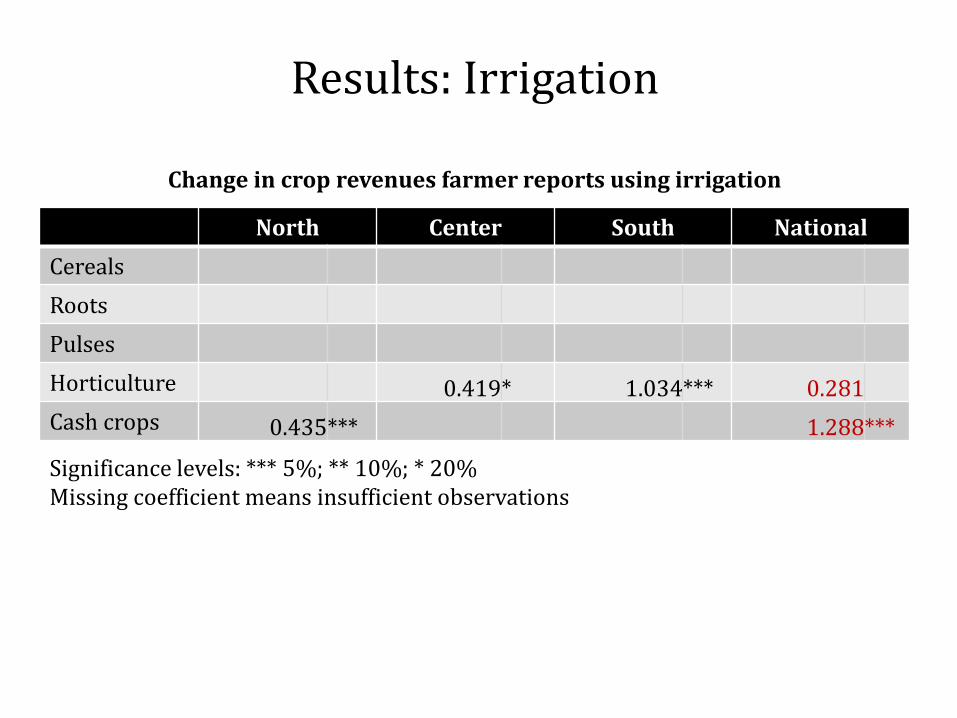
Results: Irrigation
North Center South National
Cereals
Roots
Pulses
Horticulture 0.419* 1.034*** 0.281
Cash crops 0.435*** 1.288***
Change in crop revenues farmer reports using irrigation
Significance levels: *** 5%; ** 10%; * 20%Missing coefficient means insufficient observations
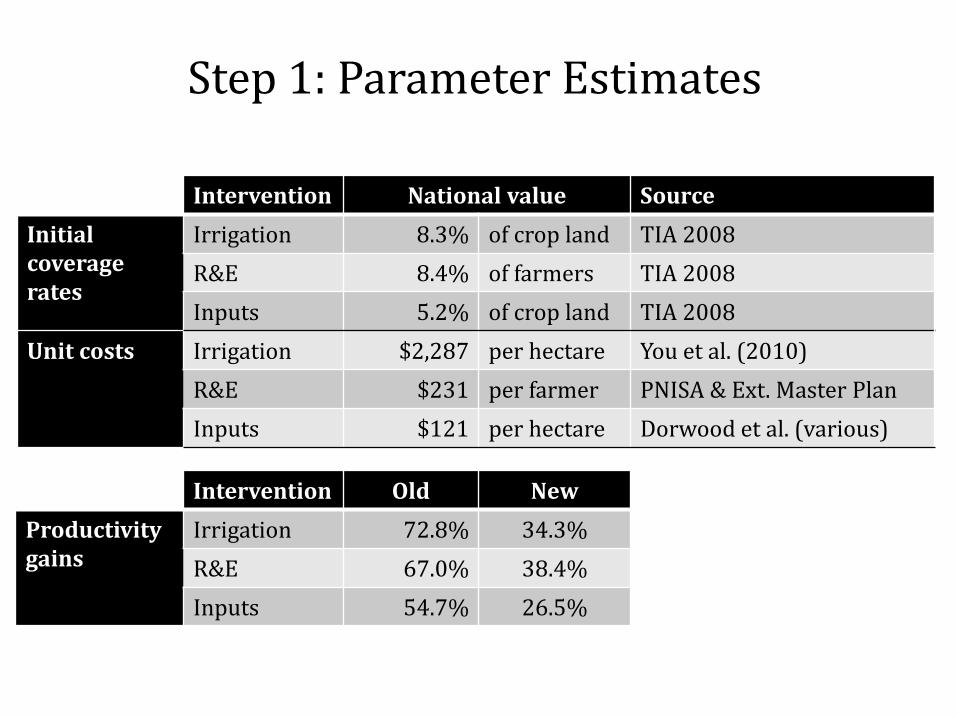
Step 1: Parameter Estimates
Intervention National value Source
Initialcoveragerates
Irrigation 8.3% of crop land TIA 2008
R&E 8.4% of farmers TIA 2008
Inputs 5.2% of crop land TIA 2008
Unit costs Irrigation $2,287 per hectare You et al. (2010)
R&E $231 per farmer PNISA & Ext. Master Plan
Inputs $121 per hectare Dorwood et al. (various)
Intervention Old New
Productivitygains
Irrigation 72.8% 34.3%
R&E 67.0% 38.4%
Inputs 54.7% 26.5%
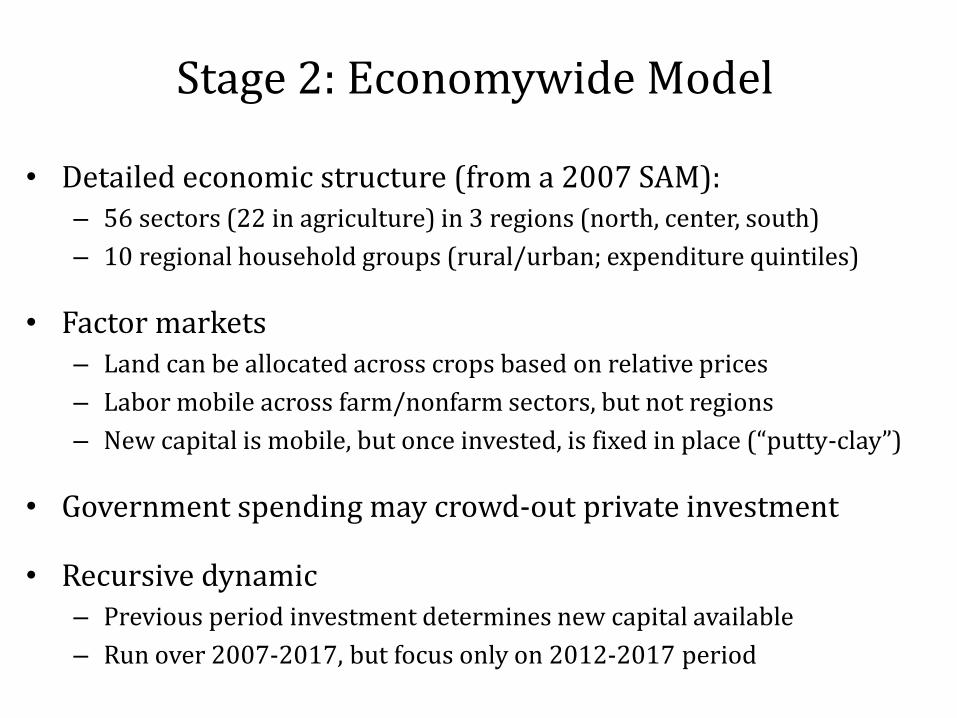
Stage 2: Economywide Model
• Detailed economic structure (from a 2007 SAM):– 56 sectors (22 in agriculture) in 3 regions (north, center, south)
– 10 regional household groups (rural/urban; expenditure quintiles)
• Factor markets– Land can be allocated across crops based on relative prices
– Labor mobile across farm/nonfarm sectors, but not regions
– New capital is mobile, but once invested, is fixed in place (“putty-clay”)
• Government spending may crowd-out private investment
• Recursive dynamic– Previous period investment determines new capital available
– Run over 2007-2017, but focus only on 2012-2017 period
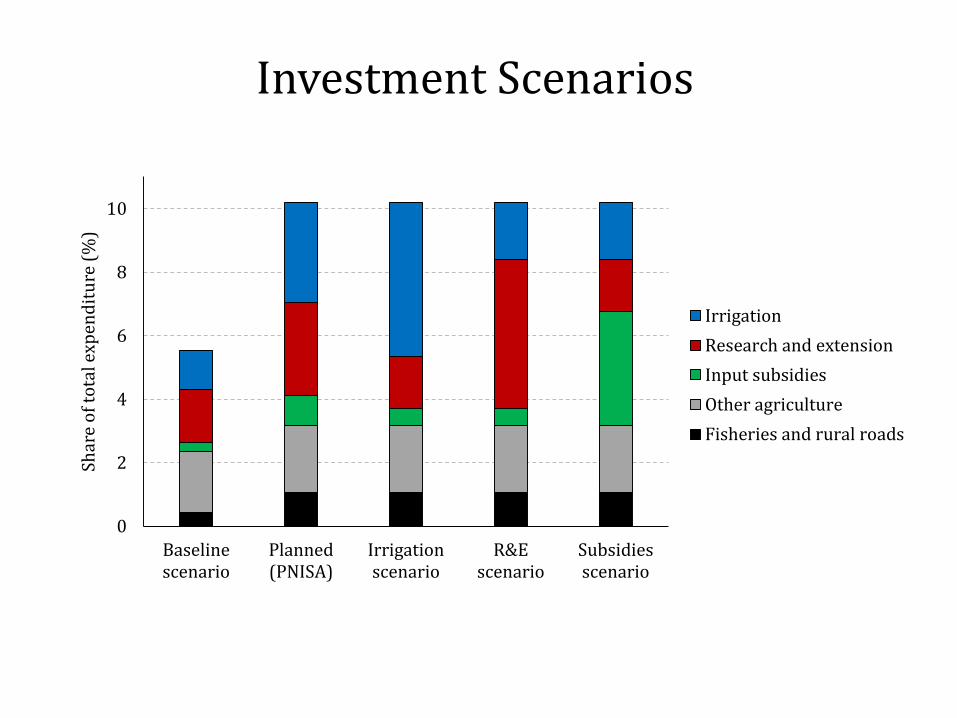
Investment Scenarios
0
2
4
6
8
10
Baselinescenario
Planned(PNISA)
Irrigationscenario
R&Escenario
Subsidiesscenario
Shar
e o
f to
tal e
xpen
dit
ure
(%
)
Irrigation
Research and extension
Input subsidies
Other agriculture
Fisheries and rural roads
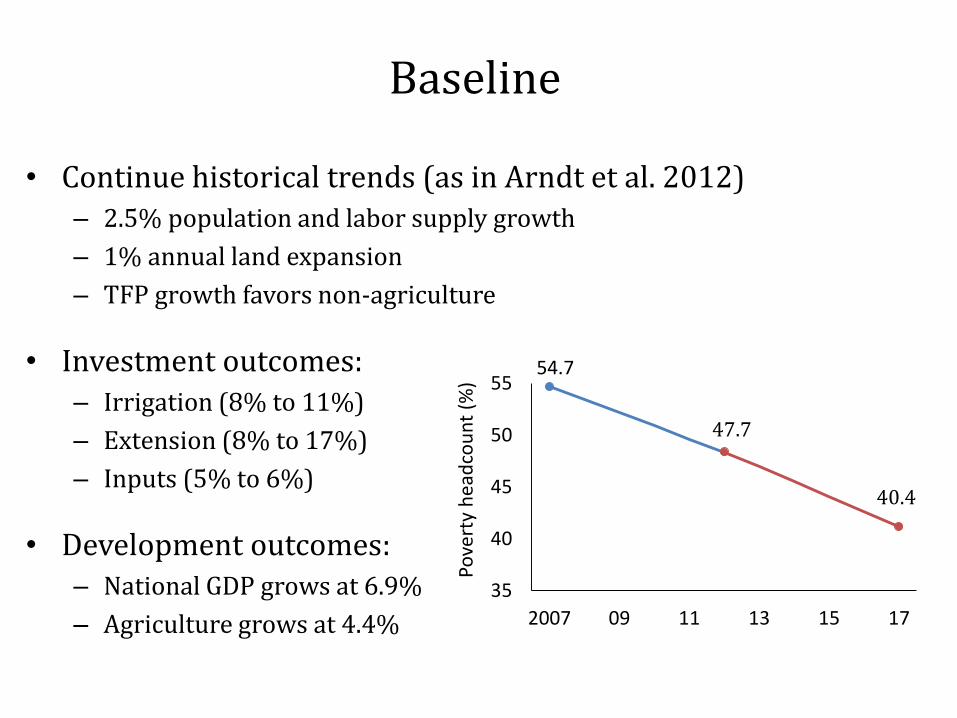
Baseline
• Continue historical trends (as in Arndt et al. 2012)– 2.5% population and labor supply growth
– 1% annual land expansion
– TFP growth favors non-agriculture
• Investment outcomes:– Irrigation (8% to 11%)
– Extension (8% to 17%)
– Inputs (5% to 6%)
• Development outcomes:– National GDP grows at 6.9%
– Agriculture grows at 4.4%
54.7
35
40
45
50
55
2007 09 11 13 15 17
Pove
rty
hea
dco
un
t (%
)
47.7
40.4
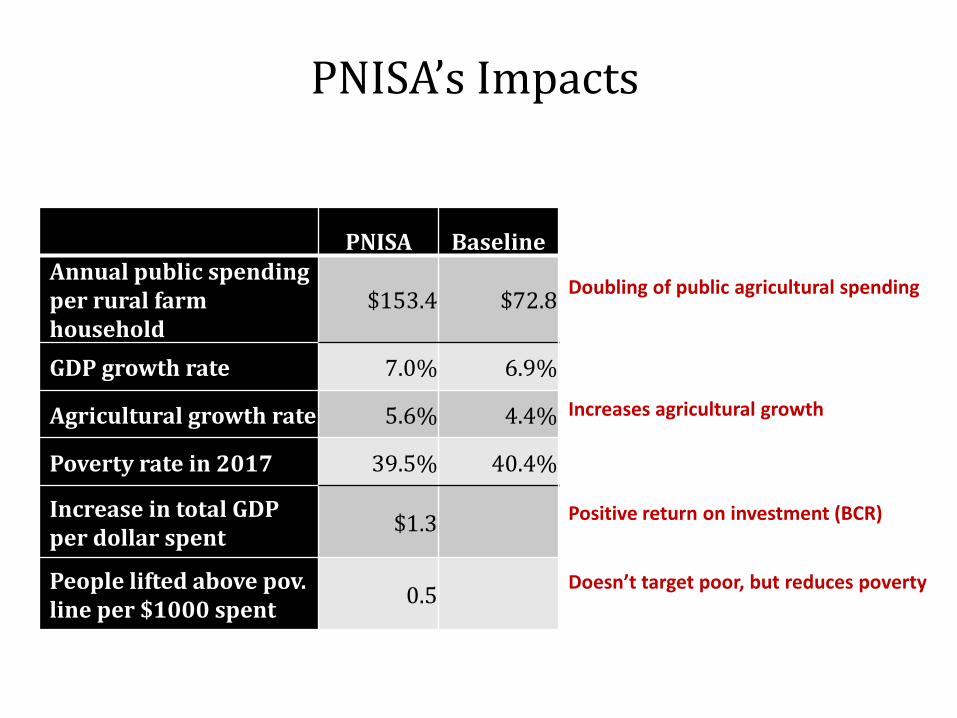
PNISA’s Impacts
PNISA BaselineAnnual public spending per rural farm household
$153.4 $72.8
GDP growth rate 7.0% 6.9%
Agricultural growth rate 5.6% 4.4%
Poverty rate in 2017 39.5% 40.4%
Increase in total GDP per dollar spent
$1.3
People lifted above pov.line per $1000 spent
0.5
Doubling of public agricultural spending
Increases agricultural growth
Positive return on investment (BCR)
Doesn’t target poor, but reduces poverty
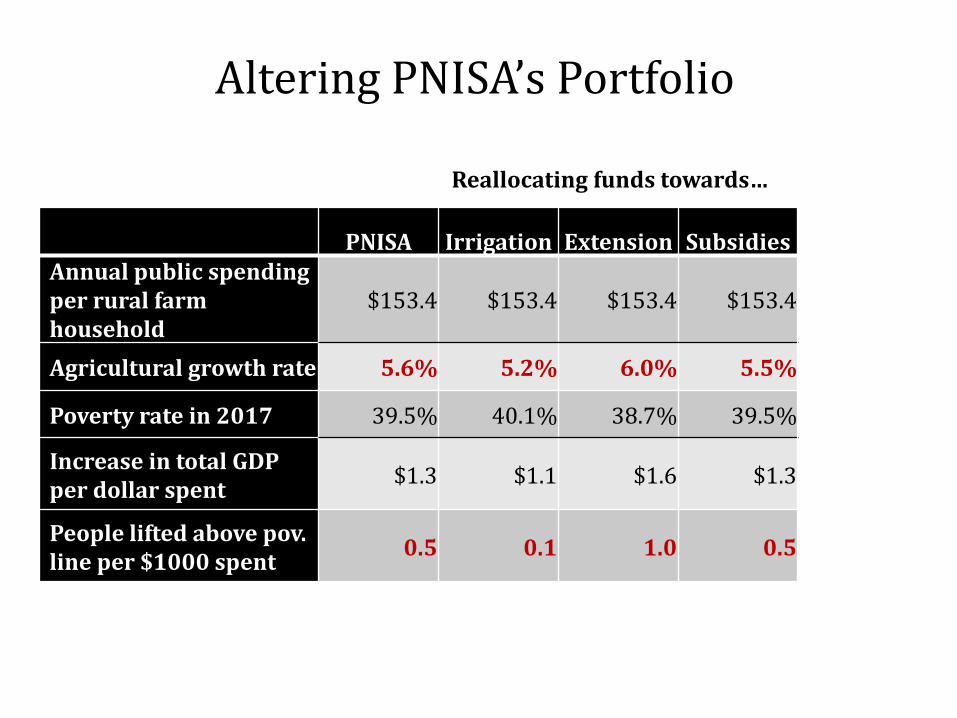
Altering PNISA’s Portfolio
PNISA Irrigation Extension SubsidiesAnnual public spending per rural farm household
$153.4 $153.4 $153.4 $153.4
Agricultural growth rate 5.6% 5.2% 6.0% 5.5%
Poverty rate in 2017 39.5% 40.1% 38.7% 39.5%
Increase in total GDP per dollar spent
$1.3 $1.1 $1.6 $1.3
People lifted above pov.line per $1000 spent
0.5 0.1 1.0 0.5
Reallocating funds towards…
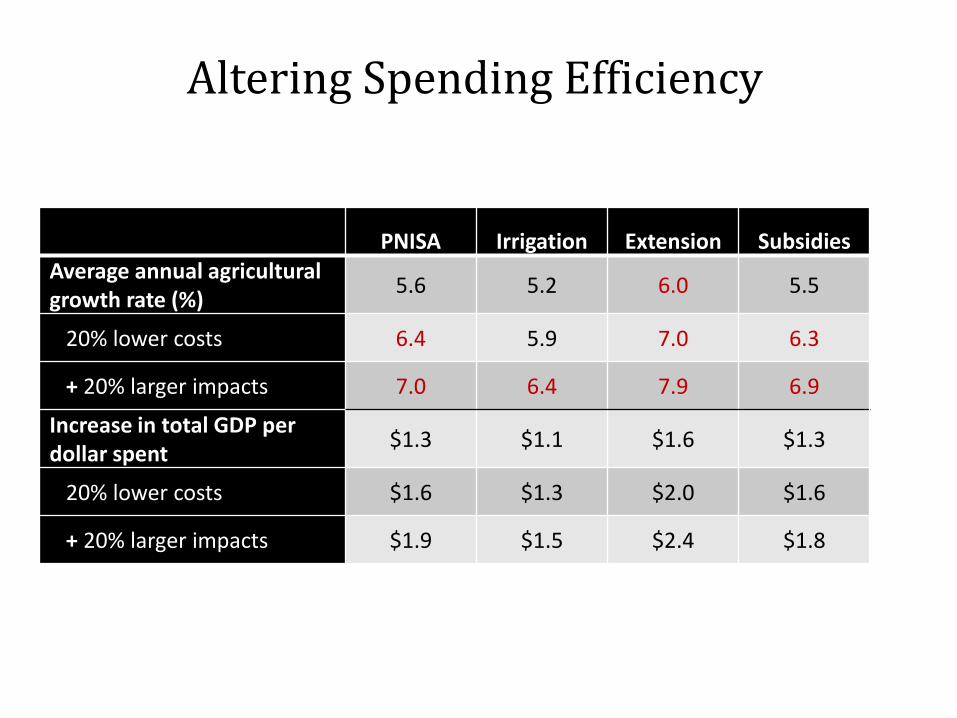
Altering Spending Efficiency
PNISA Irrigation Extension SubsidiesAverage annual agricultural growth rate (%)
5.6 5.2 6.0 5.5
20% lower costs 6.4 5.9 7.0 6.3
+ 20% larger impacts 7.0 6.4 7.9 6.9
Increase in total GDP per dollar spent
$1.3 $1.1 $1.6 $1.3
20% lower costs $1.6 $1.3 $2.0 $1.6
+ 20% larger impacts $1.9 $1.5 $2.4 $1.8
Conclusions
• Agricultural investments have a smaller effect on farmer productivity than in other countries
• PNISA increases agricultural growth and reduces poverty – But falls short of targets (e.g., CAADP 6% agricultural growth)
• PNISA is already a large scale program ($153 per farmer) – Little scope to further increase spending
• Altering portfolio improves program outcomes– Reducing emphasis on irrigation generates better returns
– But still does not achieve growth target
• Improving investment efficiency is absolutely essential
Recommended