Proceedings of the 2010 Joint Rail Conference JRC2010
April 27-29, 2010, Urbana, Illinois, USA
1 Copyright © 2010 by ASME
JRC2010-36219
EVALUATING THE POTENTIAL FOR DAMAGING HYDRAULIC PRESSURE
IN THE CONCRETE TIE RAIL SEAT
John C. Zeman
Univ. of Illinois at
Urbana-Champaign
Dept. of Civil and
Environ. Engineering
205 N Mathews Ave,
Urbana, IL 61801
J. Riley Edwards
Univ. of Illinois at
Urbana-Champaign
Dept. of Civil and
Environ. Engineering
205 N Mathews Ave,
Urbana, IL 61801
(217) 244-7417
David A. Lange
Univ. of Illinois at
Urbana-Champaign
Dept. of Civil and
Environ. Engineering
205 N Mathews Ave,
Urbana, IL 61801
Christopher P.L. Barkan
Univ. of Illinois at
Urbana-Champaign
Dept. of Civil and
Environ. Engineering
205 N Mathews Ave,
Urbana, IL 61801
ABSTRACT
Rail seat deterioration (RSD) is the most critical problem
with concrete tie performance on North American freight
railroads. Currently, the problem is not sufficiently
understood to allow for effective solutions. RSD is considered
to have up to five potential mechanisms, and this paper
investigates one of them: hydraulic pressure cracking. A
model of the effective stress in a concrete tie rail seat –
considering the contributions of a uniform vertical load, a
uniform lateral load, a prestressed beam on an elastic
foundation, and pore pressure to the state of stress – was
created to determine what surface water pressures at the rail
seat could lead to damaging pore water pressures in the
concrete. A laboratory test setup and procedure were devised
to measure the surface water pressure in a laboratory rail seat
using tie pads of differing material composition and geometry.
Results show that the magnitude of the pressure generated and
the rate of pressure dissipation with many load cycles depends
on the pad material and surface geometry. Comparing the
effective stress model and the measured surface pressures,
hydraulic pressure cracking appears to be a feasible
mechanism for RSD given the correct combination of dynamic
rail seat loads, sufficient moisture, and a tie pad surface that
develops high pressure.
INTRODUCTION
Rail seat deterioration (RSD) is concrete deterioration
underneath the rail on a concrete railroad tie. This
deterioration leads to track geometry defects such as wide
gauge and allows for accelerated deterioration of the rail-to-tie
fastening system. RSD is difficult to detect without removing
the rail and fastening system and examining the concrete rail
seat. Maintenance measures currently used to combat RSD
are regular replacement of the tie pad, periodic replacement of
the fastening components, restoration of the proper rail seat
surface with an epoxy or polyurethane, or removal of the
whole tie from service [1, 2]. A survey of freight railroads in
the US and Canada conducted by the University of Illinois at
Urbana-Champaign concluded that RSD was the most critical
problem with concrete ties on their routes [3]. Prestressed
concrete ties have the potential to withstand a combination of
heavy axle loads and high tonnage that other tie materials
2 Copyright © 2010 by ASME
cannot. Also, ballasted concrete-tie track or slab track are the
preferred method of track support for high-speed operations
due to their stiff support and tighter geometric tolerances [1,
2]. For these reasons, improving the performance of concrete
ties will be very beneficial to the railroad industry.
Learning how to effectively eliminate or mitigate RSD
will reduce the risk of concrete ties failing prematurely or
requiring excessive maintenance. This would lower the life-
cycle costs and help make concrete ties a more viable
economic alternative to timber ties in North America. The US
and Canadian railroads have learned much about RSD since it
was first identified in the mid-1980’s [4], such as the
importance of wheel loads, moisture, abrasive fines, and
tightness of the fastening system to the problem’s
development [1, 2]. There are multiple possible mechanisms
for RSD, but the concrete deterioration process is not wholly
understood. Currently, there is evidence that abrasion, freeze-
thaw cracking, crushing, or hydraulic pressure cracking may
contribute to RSD [4, 5]. Little evidence has been found to
suggest that alkali-silica reactivity (ASR) or cavitation erosion
is contributing to RSD [4]. This research study is an effort to
understand the mechanics of the concrete deterioration in RSD
by focusing on moisture-driven mechanisms, such as
hydraulic pressure cracking. By understanding which
deterioration mechanisms are acting on the concrete, it will be
possible to develop more effective methods to solve or
mitigate RSD.
The theory on hydraulic pressure cracking claims that
pore pressures in the concrete become large enough that the
concrete’s tensile strength is exceeded, resulting in cracking or
spalling [4]. In order to evaluate the feasibility of this theory,
two elements were examined: (1) the specific pore pressure
required to damage the concrete, and (2) the expected pore
pressure in a typical concrete railroad tie.
EFFECTIVE STRESS MODEL
To estimate the pore pressure required to do damage to
the concrete, a model was created to calculate the effective
stress beneath the center of the rail seat. This model is an
adaptation of an approach developed by Bakharev [4]. The
effective stress of the concrete is the total stress – the sum of
all the mechanical stresses acting on an element of concrete –
minus the pore pressure. With this formulation, stress is taken
as positive when it is compressive, and the pore pressure
exerts a tensile stress on the concrete, similar to what is
experienced by the walls of a pressure vessel. It is the
effective stress that must be compared with the concrete’s
strength to determine if damage will occur.
Bakharev’s effective stress model was for two-
dimensional stresses, considering only the vertical wheel
load’s contribution to total stress. Our model also
incorporates the contributions of lateral loads, prestress, and
flexure in three dimensions. We directly use Bakharev’s
formula for pore pressure distribution, expanded to three
dimensions.
Considering the effective stress in a concrete tie in three
dimensions, the total stress state was taken as the sum of the
stress states from a uniform vertical load, a uniform horizontal
load, and a prestressed beam on an elastic foundation. Then
the total stress state was converted to a principal stress state
that can be expressed by three mutually perpendicular normal
stresses and no shear stress [6]. The minimum of these three
stresses is referred to as the minor principal stress, and it
represents the direction in which the concrete is most
susceptible to damage from pore pressure. The minor
principal stress is the total stress term used in the effective
stress equation.
Total Stress
For the uniform vertical load (normal to the rail seat),
Holl’s equations were used to find the total stress beneath the
center of a square 42 square-inch (0.027 square-meter) rail
seat, assuming an elastic stress distribution with Poisson’s
ratio of 0.5 [7]. The Poisson’s ratio of concrete is typically
around 0.2 [8]. This discrepancy between the model and the
actual concrete material was accepted because the resulting
equations for a three-dimensional state of stress were readily
available. For elastic stress distributions, choosing a larger
Poisson’s ratio generally results in a stiffer material, thus
greater confining stresses than would be observed with a
smaller Poisson’s ratio [7]. The normal load on the rail seat
was estimated as approximately 50% of a rail car wheel load,
accounting for load distribution among adjacent ties and the
cant of the rail [1, 2]. Because Holl’s equations directly apply
to one fourth of the loaded area, they were multiplied by four
to apply superposition:
{ } { } { }
S 4 { } { } { }
{ } { } { }
x V xy V xz V
V xy V y V yz V
xz V yz V z V
σ τ τ
τ σ τ
τ τ σ
=
(1)
Similar to the calculation of total stress from a uniform
vertical load, the total stress from a uniform horizontal load
was calculated using equations from Holl – again assuming a
Poisson’s ratio of 0.5. The lateral load on the rail seat was
estimated as 52% of the normal load – effectively using a
lateral-to-vertical load ratio (L/V) of 0.52 [1, 2]. Holl’s
coordinates were such that the horizontal load was in the
positive x-direction, but our coordinates have the horizontal
load in the negative y-direction [7]. To correct for the
differing coordinates, Holl’s state of stress was transformed
(rotated 90-degrees) to our coordinate system before entering
the effective stress model. The transformed total stress state,
referencing the equations from Holl’s coordinates, is:
{ } { } { }
S 4 { } { } { }
{ } { } { }
y H xy H yz H
H xy H x H xz H
yz H xz H z H
σ τ τ
τ σ τ
τ τ σ
−
= − −
−
(2)
3 Copyright © 2010 by ASME
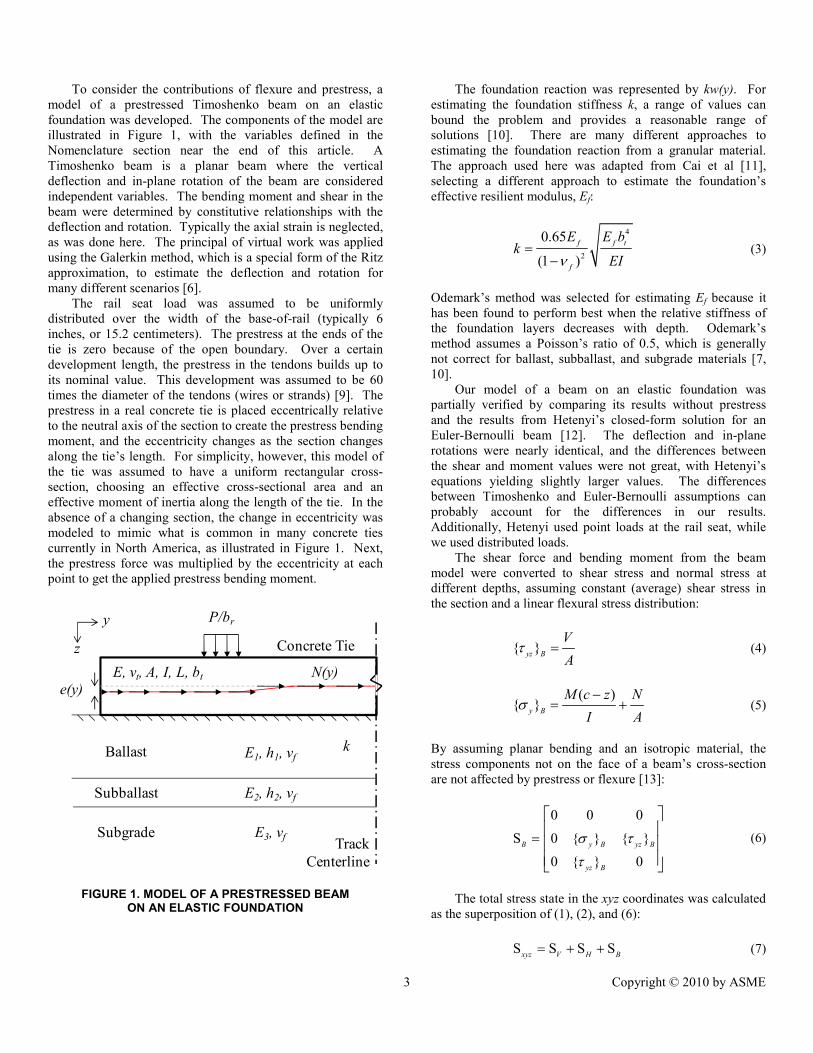
To consider the contributions of flexure and prestress, a
model of a prestressed Timoshenko beam on an elastic
foundation was developed. The components of the model are
illustrated in Figure 1, with the variables defined in the
Nomenclature section near the end of this article. A
Timoshenko beam is a planar beam where the vertical
deflection and in-plane rotation of the beam are considered
independent variables. The bending moment and shear in the
beam were determined by constitutive relationships with the
deflection and rotation. Typically the axial strain is neglected,
as was done here. The principal of virtual work was applied
using the Galerkin method, which is a special form of the Ritz
approximation, to estimate the deflection and rotation for
many different scenarios [6].
The rail seat load was assumed to be uniformly
distributed over the width of the base-of-rail (typically 6
inches, or 15.2 centimeters). The prestress at the ends of the
tie is zero because of the open boundary. Over a certain
development length, the prestress in the tendons builds up to
its nominal value. This development was assumed to be 60
times the diameter of the tendons (wires or strands) [9]. The
prestress in a real concrete tie is placed eccentrically relative
to the neutral axis of the section to create the prestress bending
moment, and the eccentricity changes as the section changes
along the tie’s length. For simplicity, however, this model of
the tie was assumed to have a uniform rectangular cross-
section, choosing an effective cross-sectional area and an
effective moment of inertia along the length of the tie. In the
absence of a changing section, the change in eccentricity was
modeled to mimic what is common in many concrete ties
currently in North America, as illustrated in Figure 1. Next,
the prestress force was multiplied by the eccentricity at each
point to get the applied prestress bending moment.
FIGURE 1. MODEL OF A PRESTRESSED BEAM ON AN ELASTIC FOUNDATION
The foundation reaction was represented by kw(y). For
estimating the foundation stiffness k, a range of values can
bound the problem and provides a reasonable range of
solutions [10]. There are many different approaches to
estimating the foundation reaction from a granular material.
The approach used here was adapted from Cai et al [11],
selecting a different approach to estimate the foundation’s
effective resilient modulus, Ef:
4
2
0.65
(1 )
f f t
f
E E bk
EIν=
− (3)
Odemark’s method was selected for estimating Ef because it
has been found to perform best when the relative stiffness of
the foundation layers decreases with depth. Odemark’s
method assumes a Poisson’s ratio of 0.5, which is generally
not correct for ballast, subballast, and subgrade materials [7,
10].
Our model of a beam on an elastic foundation was
partially verified by comparing its results without prestress
and the results from Hetenyi’s closed-form solution for an
Euler-Bernoulli beam [12]. The deflection and in-plane
rotations were nearly identical, and the differences between
the shear and moment values were not great, with Hetenyi’s
equations yielding slightly larger values. The differences
between Timoshenko and Euler-Bernoulli assumptions can
probably account for the differences in our results.
Additionally, Hetenyi used point loads at the rail seat, while
we used distributed loads.
The shear force and bending moment from the beam
model were converted to shear stress and normal stress at
different depths, assuming constant (average) shear stress in
the section and a linear flexural stress distribution:
{ }yz B
V
Aτ = (4)
( ){ }
y B
M c z �
I Aσ
−= + (5)
By assuming planar bending and an isotropic material, the
stress components not on the face of a beam’s cross-section
are not affected by prestress or flexure [13]:
0 0 0
S 0 { } { }
0 { } 0
B y B yz B
yz B
σ τ
τ
=
(6)
The total stress state in the xyz coordinates was calculated
as the superposition of (1), (2), and (6):
S S S Sxyz V H B= + + (7)
k
E, vt, A, I, L, bt
e(y)
P/br
�(y)
y
z
E1, h1, vfBallast
E2, h2, vf
E3, vf
Subballast
SubgradeTrack
Centerline
Concrete Tie
4 Copyright © 2010 by ASME
The principal directions and stresses were found by solving an
eigenvalue problem with the state of total stress [6].
Pore Pressure
To estimate the pore pressure in the concrete for this
study, the following approach was adapted from Bakharev’s
work on RSD. The pore water is assumed to obey Darcy’s
law flow. By assuming a fully saturated concrete, imposing
conservation of mass flow, and noting that the permeability of
concrete is nonzero, Bakharev showed that the pore pressure
has to satisfy a Laplace differential equation [4]:
2 2 2
2 2 20
u u u
x y z
∂ ∂ ∂+ + =
∂ ∂ ∂ (8)
The boundary conditions for this problem are that the pore
pressure u is zero above the rail seat surface and that u at the
surface is equal to p, a uniform surface pressure on the rail
seat area.
Looking at the pore pressure below the center of the rail
seat and assuming a square rail seat with sides br, Bakharev’s
solution to (8) simplifies to:
2arctan
2
rbp
uzπ
=
(9)
This equation can be used to estimate the pore pressure in a
fully saturated concrete tie resulting from pressurized water at
the rail seat surface. The general solution, not shown here,
can be used to evaluate pore pressure away from the center of
the rail seat.
Pascal’s law states that a fluid exerts pressure equally on
and normal to all surfaces of its container [14]. So in terms of
a state of stress in any coordinate system, the pore pressure
can be expressed as equal normal stresses without any shear
[6].
Damage Limits
To estimate the strength and fatigue limits for concrete
used in concrete ties, it was assumed that the tensile strength
could represent the strength limit and approximately 50% of
the tensile strength could represent the fatigue limit [8]:
'
1
2
'
312
0 0 { }
S' S U 0 0
0 0 { }
t Str
t Fat
u f
u or
u f
σ
σ
σ
−
= − = − ≤
−
(10)
The tensile strength was approximated as 10% of the 28-day
compressive strength [8]. Because AREMA recommends a
minimum compressive strength of 7,000 pounds per square
inch (psi) or 48.3 megapascals (MPa) [15], we used 700 psi
(4.83 MPa) as the tensile strength and 350 psi (2.41 MPa) as
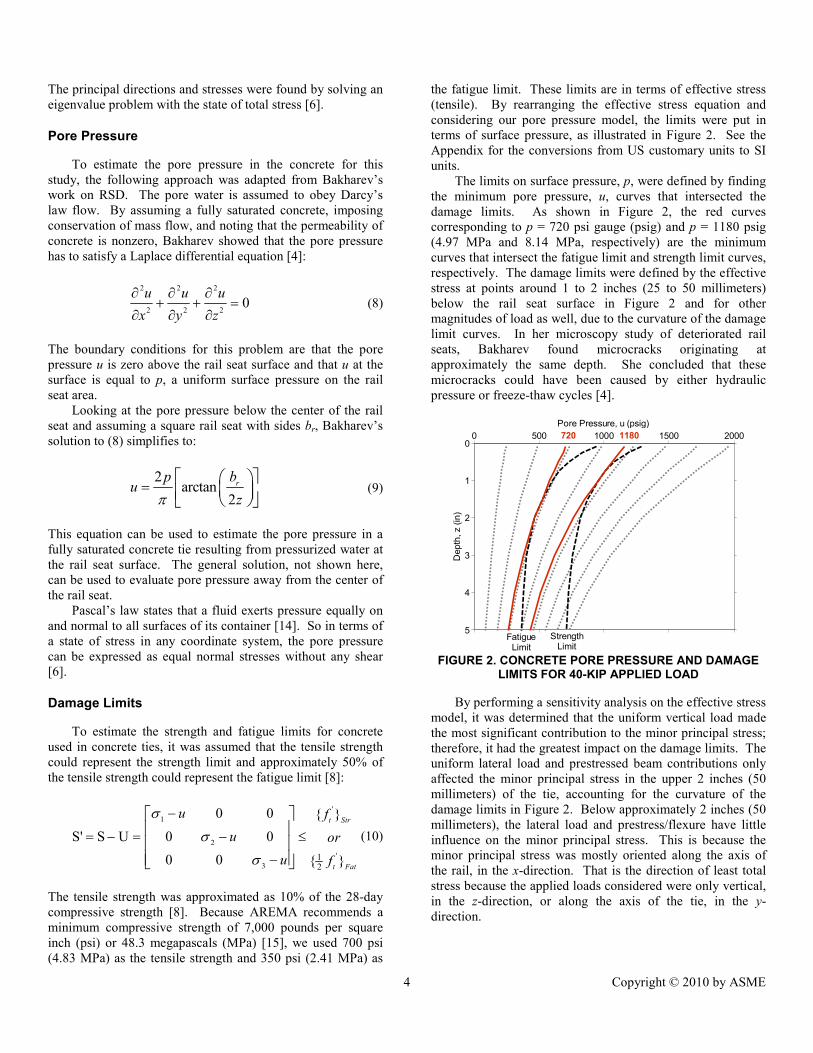
the fatigue limit. These limits are in terms of effective stress
(tensile). By rearranging the effective stress equation and
considering our pore pressure model, the limits were put in
terms of surface pressure, as illustrated in Figure 2. See the
Appendix for the conversions from US customary units to SI
units.
The limits on surface pressure, p, were defined by finding
the minimum pore pressure, u, curves that intersected the
damage limits. As shown in Figure 2, the red curves
corresponding to p = 720 psi gauge (psig) and p = 1180 psig
(4.97 MPa and 8.14 MPa, respectively) are the minimum
curves that intersect the fatigue limit and strength limit curves,
respectively. The damage limits were defined by the effective
stress at points around 1 to 2 inches (25 to 50 millimeters)
below the rail seat surface in Figure 2 and for other
magnitudes of load as well, due to the curvature of the damage
limit curves. In her microscopy study of deteriorated rail
seats, Bakharev found microcracks originating at
approximately the same depth. She concluded that these
microcracks could have been caused by either hydraulic
pressure or freeze-thaw cycles [4].
FIGURE 2. CONCRETE PORE PRESSURE AND DAMAGE LIMITS FOR 40-KIP APPLIED LOAD
By performing a sensitivity analysis on the effective stress
model, it was determined that the uniform vertical load made
the most significant contribution to the minor principal stress;
therefore, it had the greatest impact on the damage limits. The
uniform lateral load and prestressed beam contributions only
affected the minor principal stress in the upper 2 inches (50
millimeters) of the tie, accounting for the curvature of the
damage limits in Figure 2. Below approximately 2 inches (50
millimeters), the lateral load and prestress/flexure have little
influence on the minor principal stress. This is because the
minor principal stress was mostly oriented along the axis of
the rail, in the x-direction. That is the direction of least total
stress because the applied loads considered were only vertical,
in the z-direction, or along the axis of the tie, in the y-
direction.
0 500 1000 1500 20000
1
2
3
4
5
Pore Pressure, u (psig)
Depth, z (in)
720 1180
FatigueLimit
StrengthLimit
5 Copyright © 2010 by ASME
LABORATORY TESTS
In previous work on hydraulic pressure cracking, it was
assumed that the surface pressure p was equal to the uniform
vertical load stress [4]. A laboratory setup and procedure were
devised to measure p in a saturated, laboratory rail seat for
different tie pads and loading scenarios to determine the
validity of this assumption and whether the tie pad material or
surface geometry affects the pressure generated.
Materials
In order to measure surface water pressure developed by
simulated rail car loads on a mock concrete tie rail seat, a
6,000-psig-rated (41.4-MPa-rated) pressure transducer was
placed in a concrete block and protected by a steel pipe which
was cast in the specimen. The concrete had an average 28-day
compressive strength of approximately 8,000 psi (55.2 MPa),
and the block was capped with a sulfur compound to improve
the block and base plate interface. The pressure transducer’s
orifice has an inner diameter of 0.6 inches (15 millimeters)
and is 3.75 inches (95 millimeters) deep, and was placed flush
with the block’s “rail seat” surface.
A 100-kip (445-kilonewton (kN)) MTS servo-hydraulic
actuator was used to apply normal loads to the tie pads on top
of the instrumented concrete blocks. The concrete blocks
were placed in a steel-based, plexiglass tank to hold water
during the tests [1, 2].
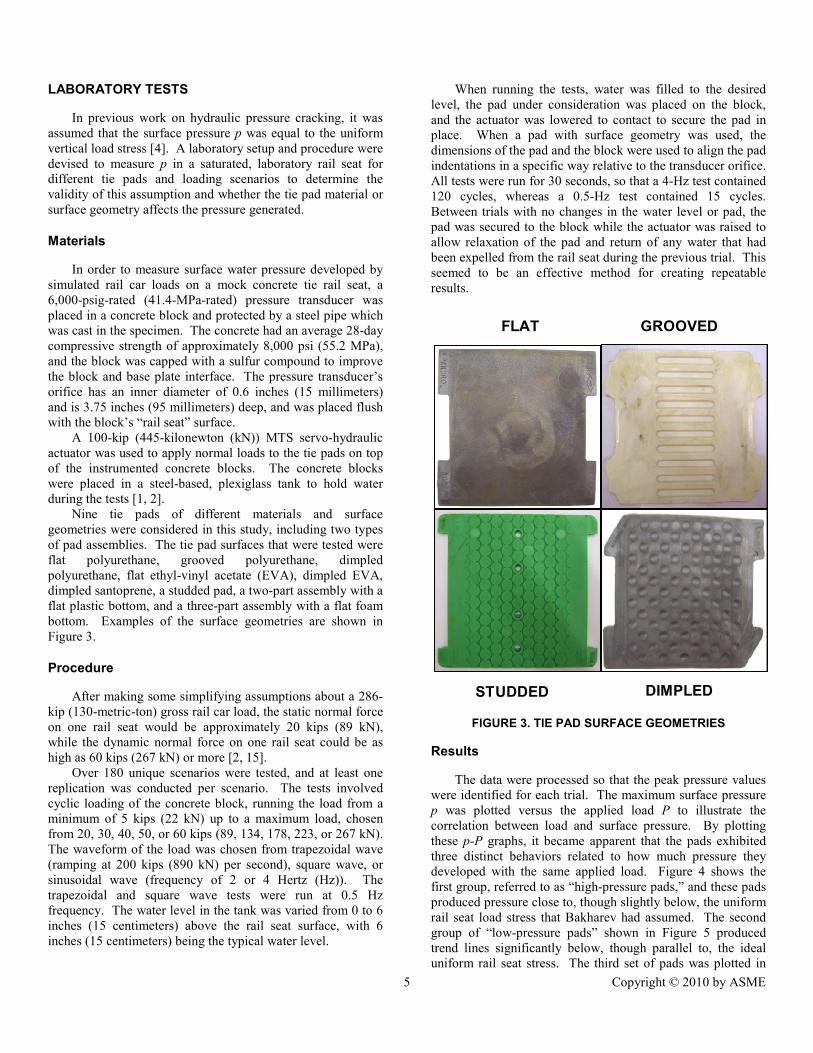
Nine tie pads of different materials and surface
geometries were considered in this study, including two types
of pad assemblies. The tie pad surfaces that were tested were
flat polyurethane, grooved polyurethane, dimpled
polyurethane, flat ethyl-vinyl acetate (EVA), dimpled EVA,
dimpled santoprene, a studded pad, a two-part assembly with a
flat plastic bottom, and a three-part assembly with a flat foam
bottom. Examples of the surface geometries are shown in
Figure 3.
Procedure
After making some simplifying assumptions about a 286-
kip (130-metric-ton) gross rail car load, the static normal force
on one rail seat would be approximately 20 kips (89 kN),
while the dynamic normal force on one rail seat could be as
high as 60 kips (267 kN) or more [2, 15].
Over 180 unique scenarios were tested, and at least one
replication was conducted per scenario. The tests involved
cyclic loading of the concrete block, running the load from a
minimum of 5 kips (22 kN) up to a maximum load, chosen
from 20, 30, 40, 50, or 60 kips (89, 134, 178, 223, or 267 kN).
The waveform of the load was chosen from trapezoidal wave
(ramping at 200 kips (890 kN) per second), square wave, or
sinusoidal wave (frequency of 2 or 4 Hertz (Hz)). The
trapezoidal and square wave tests were run at 0.5 Hz
frequency. The water level in the tank was varied from 0 to 6
inches (15 centimeters) above the rail seat surface, with 6
inches (15 centimeters) being the typical water level.
When running the tests, water was filled to the desired
level, the pad under consideration was placed on the block,
and the actuator was lowered to contact to secure the pad in
place. When a pad with surface geometry was used, the
dimensions of the pad and the block were used to align the pad
indentations in a specific way relative to the transducer orifice.
All tests were run for 30 seconds, so that a 4-Hz test contained
120 cycles, whereas a 0.5-Hz test contained 15 cycles.
Between trials with no changes in the water level or pad, the
pad was secured to the block while the actuator was raised to
allow relaxation of the pad and return of any water that had
been expelled from the rail seat during the previous trial. This
seemed to be an effective method for creating repeatable
results.
FIGURE 3. TIE PAD SURFACE GEOMETRIES
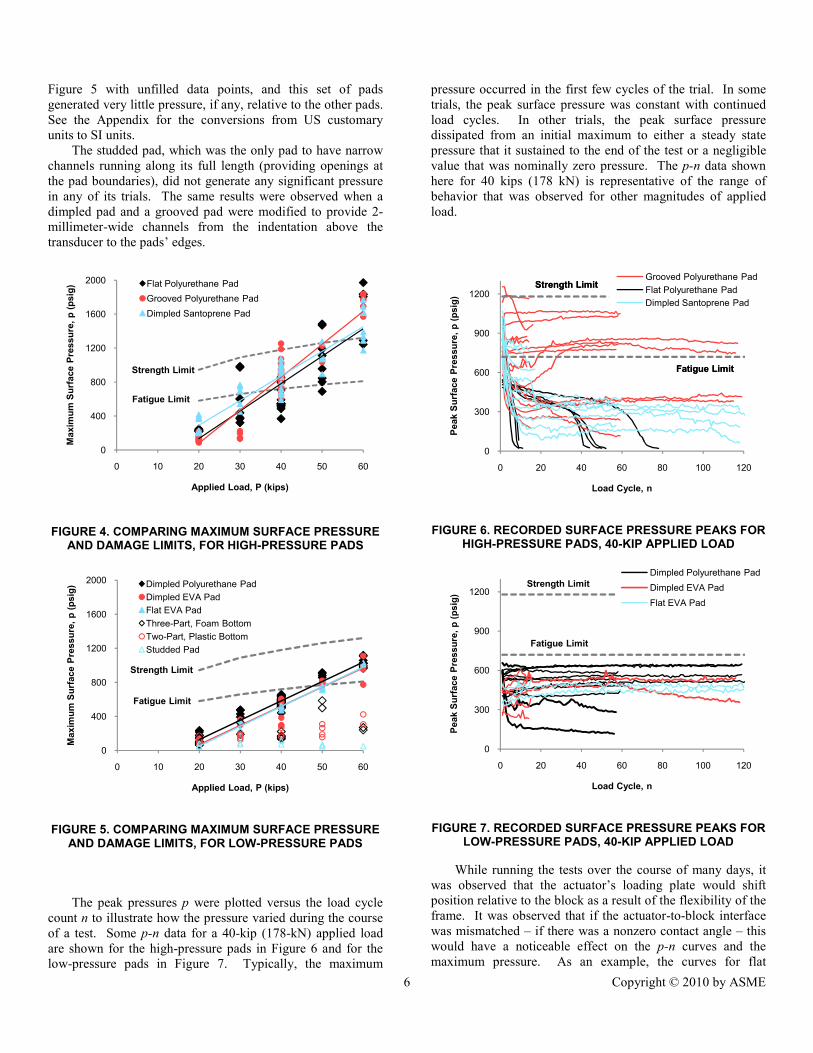
Results
The data were processed so that the peak pressure values
were identified for each trial. The maximum surface pressure
p was plotted versus the applied load P to illustrate the
correlation between load and surface pressure. By plotting
these p-P graphs, it became apparent that the pads exhibited
three distinct behaviors related to how much pressure they
developed with the same applied load. Figure 4 shows the
first group, referred to as “high-pressure pads,” and these pads
produced pressure close to, though slightly below, the uniform
rail seat load stress that Bakharev had assumed. The second
group of “low-pressure pads” shown in Figure 5 produced
trend lines significantly below, though parallel to, the ideal
uniform rail seat stress. The third set of pads was plotted in
FLAT GROOVED
DIMPLEDSTUDDED
6 Copyright © 2010 by ASME
Figure 5 with unfilled data points, and this set of pads
generated very little pressure, if any, relative to the other pads.
See the Appendix for the conversions from US customary
units to SI units.
The studded pad, which was the only pad to have narrow
channels running along its full length (providing openings at
the pad boundaries), did not generate any significant pressure
in any of its trials. The same results were observed when a
dimpled pad and a grooved pad were modified to provide 2-
millimeter-wide channels from the indentation above the
transducer to the pads’ edges.
FIGURE 4. COMPARING MAXIMUM SURFACE PRESSURE AND DAMAGE LIMITS, FOR HIGH-PRESSURE PADS
FIGURE 5. COMPARING MAXIMUM SURFACE PRESSURE AND DAMAGE LIMITS, FOR LOW-PRESSURE PADS
The peak pressures p were plotted versus the load cycle
count n to illustrate how the pressure varied during the course
of a test. Some p-n data for a 40-kip (178-kN) applied load
are shown for the high-pressure pads in Figure 6 and for the
low-pressure pads in Figure 7. Typically, the maximum
pressure occurred in the first few cycles of the trial. In some
trials, the peak surface pressure was constant with continued
load cycles. In other trials, the peak surface pressure
dissipated from an initial maximum to either a steady state
pressure that it sustained to the end of the test or a negligible
value that was nominally zero pressure. The p-n data shown
here for 40 kips (178 kN) is representative of the range of
behavior that was observed for other magnitudes of applied
load.
FIGURE 6. RECORDED SURFACE PRESSURE PEAKS FOR HIGH-PRESSURE PADS, 40-KIP APPLIED LOAD
FIGURE 7. RECORDED SURFACE PRESSURE PEAKS FOR LOW-PRESSURE PADS, 40-KIP APPLIED LOAD
While running the tests over the course of many days, it
was observed that the actuator’s loading plate would shift
position relative to the block as a result of the flexibility of the
frame. It was observed that if the actuator-to-block interface
was mismatched – if there was a nonzero contact angle – this
would have a noticeable effect on the p-n curves and the
maximum pressure. As an example, the curves for flat
0
400
800
1200
1600
2000
0 10 20 30 40 50 60
Maximum Surface Pressure, p (psig)
Applied Load, P (kips)
Flat Polyurethane Pad
Grooved Polyurethane Pad
Dimpled Santoprene Pad
Strength Limit
Fatigue Limit
0
400
800
1200
1600
2000
0 10 20 30 40 50 60
Maximum Surface Pressure, p (psig)
Applied Load, P (kips)
Dimpled Polyurethane Pad
Dimpled EVA Pad
Flat EVA Pad
Three-Part, Foam Bottom
Two-Part, Plastic Bottom
Studded Pad
Strength Limit
Fatigue Limit
0
300
600
900
1200
0 20 40 60 80 100 120
Peak Surface Pressure, p (psig)
Load Cycle, n
Grooved Polyurethane Pad
Flat Polyurethane Pad
Dimpled Santoprene Pad
Strength Limit
Fatigue Limit
Strength Limit
Fatigue Limit
0
300
600
900
1200
0 20 40 60 80 100 120
Peak Surface Pressure, p (psig)
Load Cycle, n
Dimpled Polyurethane Pad
Dimpled EVA Pad
Flat EVA Pad
Strength Limit
Fatigue Limit
7 Copyright © 2010 by ASME
polyurethane in Figure 6 came from two different test days,
with the curves dropping to zero within 10 cycles occurring
separately from the curves dropping to zero after 40 cycles.
This difference may have been related to changes in the
contact angle at the interface.
DISCUSSION
Sources of Variability
Linear trend lines fit the p-P data well, with the worst R-
squared value at 0.72 for the flat polyurethane pad – the rest of
the pads with trend lines had R-squared values at or above
0.88. Trend lines were not fitted to the studded pad or the
assemblies because their data were well below the predicted
fatigue limit. The p-P points plotted in Figures 4 and 5
include data from tests with different water levels, waveforms,
and indentation alignments, where applicable. The fact that
the data still plots with a good linear fit suggests that such
parameters as surrounding water head and loading rate (train
speed) do not have a strong influence on the surface pressure.
Also, analysis isolating these two variables did not show any
significant trends in the resulting surface pressure.
The most likely source of variability in the test results was
the difficulty in controlling the relative contact angle between
the loading plate and the rail seat block. When advancing the
actuator with a relative contact angle between the loading
plate and the block, this most likely allows the surface water
one direction in which it can escape more easily. On the other
hand, if there were a zero relative contact angle, there would
be an increased chance that a seal would develop between the
pad and the concrete before the surface water could be forced
out [2]. This may explain some of the scatter in the maximum
pressure generated, as well as the variations in p-n behavior,
particularly for the flat polyurethane’s different pressure loss
rates (Figure 6). The potential implications in track are that
rail roll or tilt could lead to similar non-zero contact angles
between the rail base and the rail seat. So if relative contact
angle occurs, it may reduce the rail seat surface pressure that
is generated in track.
As for the variable p-n behavior of the grooved
polyurethane pad (Figure 6), it appears that the trials with the
greatest sustained pressure largely occurred when the groove
indentation (see Figure 3) was directly above the transducer.
The set of trials with the pressure just above the fatigue limit
mostly came from the case of the transducer aligned between
two indentations, and the set of trials with the greatest pressure
loss for the grooved polyurethane pad mostly came from the
case of the transducer aligned with the long edge of an
indentation. So for the pads with geometry, some of the
variability in p-n behavior may be explained by changes in
indentation alignment.
Surface Water Pressure and Velocity
In Bakharev’s model of hydraulic pressure, it was
assumed that the surface pressure generated by a load P would
be equal to P divided by the area of the rail seat, which is
referred to here as the rail seat load stress. This assumes that
the pad and the rail seat are separated by a film of water that
transfers the load. For the surface water to ideally transfer
load, a seal must be created between the tie pad and the
concrete to prevent water from being ejected rather than
pressurized. The p-P trend lines for the high-pressure pads are
close to this ideal rail seat load stress, suggesting that the high-
pressure pads match Bakharev’s assumption well.
The low-pressure pads exhibited very consistent p-P
behavior that was parallel to but significantly below the ideal
rail seat load stress assumption. One way to explain these
results is to consider the transfer of energy through the system.
The applied load acts as an energy input that is transferred
through the pad to the rail seat block. If water is between the
pad and the rail seat, then energy is also transferred to the
water. Borrowing from the Bernoulli equation for pipe flow,
neglecting changes in elevation [14], we considered the
surface water’s total energy as the sum of its pressure energy
and velocity energy. If a perfect seal is created, and there is
no air in the transducer chamber, then all of the load energy
would be transferred as pressure energy in the water.
Neglecting any dynamic effects and assuming uniform load
distribution, it can be assumed that the rail seat load stress is a
maximum for the surface pressure that can be generated under
a given load – representing the case where the total energy is
pressure energy. But if water is allowed to escape or fill air
voids, then some of the energy would be manifested as
velocity, reducing the pressure that can be generated. So
allowing some of the water to escape or flow rather than be
pressurized may explain the difference between the high- and
low-pressure pads.
This same concept of energy transfer can be applied to
offer an explanation for the varied p-n results in Figures 6 and
7. There were three general types of p-n behavior observed:
constant pressure with continued cycles, pressure loss from a
maximum to a steady state pressure, and pressure loss from a
maximum to effectively zero pressure. What may be causing
pressure loss with load cycles is that some volume of water is
squeezed out either from within the transducer chamber or
from the indentations of the pad. As a pad relaxes between
cycles, there would still be at least 5 kips of load applied to the
pad, so there may be enough of a seal that water will not
return between cycles. Rather, there will be a reduced volume
of water in the chamber, requiring the pad to locally flex more
into the chamber to pressurize the water. As a result of this
loss of contact with the water, the stress distribution on the
pad may change so that most of the stress is transferred away
from the transducer’s orifice. If the volume of water in the
transducer chamber gets low enough, the pad may become
unable to contact the water and pressurize it, resulting in an
apparent zero pressure reading.
Comparison of Tie Pads
The grooved and flat polyurethane pad surfaces were two
sides of the same tie pad. These surfaces generated very
similar p-P curves, but consistently different p-n behavior,
providing strong evidence that surface geometry can lead to
8 Copyright © 2010 by ASME
more sustained pressures with load cycles – the indentations
may act as storage compartments for the surface water or they
may introduce more tortuous escape paths than a flat surface
would. However, the dimpled and flat EVA pads generated
similar p-P and p-n graphs, despite the difference in surface
geometry. It is important to note that the dimpled EVA and
flat EVA are different pads with different thicknesses, so it is
not quite the same comparison as with the grooved and flat
polyurethane. Generally EVA is a stiffer material than
polyurethane. But this introduces another complication when
comparing these tie pads: though the two EVA pads are
nominally the same material, there is room for variation of
material properties to fit a specific product, similar to how a
concrete mix is adjusted to produce different strengths. The
same can be said about the dimpled and the flat polyurethane
pads – they appear to have slightly different stiffness and
hardness properties. The major difference between the
dimpled santoprene and the dimpled polyurethane pads is that
the santoprene rubber was relatively very flexible and
underwent permanent deformation after a few trials. It is
suspected that the santoprene pad deforms enough that the
dimples are flattened during the trials, causing it to act more
like the flat polyurethane pad, in terms of surface pressure,
than the dimpled polyurethane pad. The material
specifications for each pad were not available for comparison
for this paper, but it appears that both the surface geometry
and the material properties of the pad determine what surface
pressures are generated.
A possible explanation for why the studded pad, as well
as the dimpled and grooved pads that were modified with
channels, generated zero pressure for all of its tests is that the
surface water had at least one direct path to escape under
applied load rather than being pressurized. As long as the
movement of escaping water over the rail seat is less
damaging than the pressure that would otherwise be generated
– this is likely the case – then providing escape channels in a
thermoplastic material appears to be an effective way to
prevent hydraulic pressure cracking in the rail seat.
It was observed that both the hardest material – the plastic
bottom of the two-part assembly – and the softest material –
the foam bottom of the three-part assembly – generated
pressures lower than the low-pressure pads. As shown in
Figure 5, these pad assemblies developed pressures that would
require very high rail seat loads – probably 80 to 90 kips (356
to 402 kN) or higher – to pass the fatigue limit, assuming that
the present data can be extrapolated. For the plastic, it is
possible that it was difficult to create a seal with such a hard,
stiff material, allowing water to escape rather than being
pressurized. It was observed during tests that the soft foam
bottom would become permanently deformed after one trial.
During the first trial, the foam apparently created an adequate
seal and developed pressure not too far below the low-pressure
pads, with some pressure loss with load cycles. When a
subsequent trial was run with the same pad, the same pressure
was not obtained, and even lower pressures were generated
with subsequently higher loads. This was observed when
going from 50 kips to 60 kips (223 to 267 kN) in Figure 5
(from 30 kips to 40 kips (134 to 178 kN) as well), and it may
be that the deformation of the foam prevented it from forming
a seal and allowed the water to escape.
Potential for Concrete Damage
The strength and fatigue limits from the effective stress
model were superimposed on the p-P graphs (Figures 4 and 5)
for comparison. The high-pressure pads, on average,
exceeded the fatigue limit between 30 and 40 kips (134 to 178
kN) applied load and exceeded the strength limit between 50
and 60 kips (223 to 267 kN) applied load. On the other hand,
the low-pressure pads exceeded the fatigue limit with 50 kips
(223 kN) applied load but did not exceed the strength limit
within 60 kips (267 kN). So for rail seat loads above 50 kips
(223 kN) there is the potential that a high-pressure pad could
initiate spalling in the concrete. It is also possible that fatigue
damage could result for either high- or low-pressure pads if
the proper conditions are met.
Fatigue damage would require surface pressure exceeding
the fatigue limits to be cycled millions of times, and this
would require each cycle to have the correct combination of
high rail seat loads and moisture in the concrete and on the rail
seat. Considering a 286-kip (130-metric-ton) rail car with 4
axles, approximately 36 million gross tons (MGT) (33 million
gross metric tons) would be required for 1 million load cycles.
High rail seat loads could result from high dynamic wheel
loads – caused by wheel or rail imperfections or support
transitions, such as those found adjacent to bridges and grade
crossings – or by poor load distribution among adjacent ties.
When 20 kips (89 kN) was taken as the static rail seat load,
this assumed that one rail seat supports at most half of a wheel
load, with the other half of the load distributed to adjacent ties
[15]. If adjacent ties are broken, missing, spaced too far apart,
or not providing good bearing for the rail, a rail seat could take
up to 100% of the wheel load. Based on data from wheel
impact load detectors (WILD), the rail seat load could be as
high as 90 kips (402 kN) or greater if one rail seat has to take
most of the wheel load [16, 17].
Our effective stress model assumed a saturated concrete
in order to model the distribution of pore water pressure from
an initial surface water pressure. If the concrete is fully
saturated, then all of its pores are filled with water. In an
unsaturated concrete, the pore volume not taken up by water is
filled with air. Considering pressure distribution, a fully
saturated concrete is assumed to transfer pressure
immediately, just as water contained in a pressure vessel
would. However, if the concrete is not fully saturated,
pressurized water will try to relieve its pressure by flowing
through the pores to fill the air voids. So in an unsaturated
case, the pressure at some depth would be lower than what our
ideal model predicts. Another way to think of this is that the
same surface pressure will potentially do more damage to a
saturated concrete than an unsaturated concrete. The
important question to answer then is whether concrete ties in
track can be fully saturated, even just locally saturated at the
rail seat. If not, then the effective stress model presented here
would represent a conservative but potentially invalid
prediction for concrete damage limits.
9 Copyright © 2010 by ASME
A significant assumption of the current model is that the
concrete damage limits are based on 7,000-psi 28-day
strength. This is the minimum strength AREMA recommends
for concrete ties. The reality is that concrete-tie manufacturers
in the US commonly use mixes that produce 28-day strengths
well above 7,000 psi, reaching up to 11,000 psi. If the model
were modified to incorporate higher concrete strengths, the
damage limits would effectively shift up on the p-P and p-n
graphs, representing an increase in the tie’s resistance to
hydraulic pressure cracking.
The current effective stress model largely represents a
conservative, worst-case scenario for hydraulic pressure
cracking resistance. One of the useful features of the model is
that it has demonstrated the feasibility of hydraulic pressure
contributing to RSD. The model requires further
modifications to transition from testing the feasibility of a
theory to predicting the likelihood that hydraulic pressure will
lead to damage for different scenarios. Such modifications
should attempt to account for the distributions of rail seat
loads, precipitation or ponding events, and concrete strengths
that occur in railroad track. These additions will result in a
more applied model, possibly useful as a tie-pad design aid.
CONCLUSION
Based on the results of the laboratory experiments and the
damage limits defined by our effective stress model, hydraulic
pressure cracking appears to have the potential to initiate or
contribute to RSD as a concrete deterioration mechanism. It
appears that the most effective way to prevent hydraulic
pressure is to use pads or pad assembly bottoms that do not
seal water. The soft foam and the hard plastic bottoms
developed little surface pressure at the rail seat, with the hard
plastic being slightly more effective. When thermoplastic
pads are in contact with the concrete rail seat, it appears that
designing the pad with direct escape channels for the water
effectively ejects the surface water upon load application
rather than pressurizing it. Thermoplastic pads without escape
channels created the highest surface pressures, apparently
sealing the water during load application. It seems advisable
and relatively simple to incorporate these considerations into
future pad and pad assembly designs – balanced with other
considerations, such as abrasion durability.
Low rail seat loads, resulting from near-static wheel loads
and good load distribution among adjacent ties, will not
generate damaging hydraulic pressure at the rail seat,
according to our effective stress model. Sufficient moisture
for saturated conditions is required for hydraulic pressure to
damage the concrete. The continuation of this research will
involve combining damage limits that account for variable
concrete strength, measured surface pressures for different
pads, wheel impact load detector (WILD) data, and what is
known about the potential for saturated concrete ties in track
to create a more informed prediction about the risk for fatigue
damage from hydraulic pressure.
ACKNOWLEDGMENTS
This research was funded by the AAR Technology
Scanning Program. The authors would like to thank David
Davis and Richard Reiff of TTCI; Ernie Barenberg, Grzegorz
Banas, and Tim Prunkard of the University of Illinois at
Urbana-Champaign (UIUC); Bill Riehl of RailAmerica Inc.;
Dwain Jackson of Transducers Direct; the AAR Technology
Scanning Committee; and the members of AREMA
Committee 30 – Ties, Subcommittee 4 – Concrete Tie
Technology for their invaluable contributions to this research.
The authors would also like to acknowledge Mauricio
Gutierrez-Romero, Mark Dingler, Kevin Kilroy, Hammad
Khalil, Charles Gross, Samantha Chadwick, David Marks, and
Joseph Rudd from UIUC and Edgardo Santana-Santiago of the
University of Puerto Rico at Mayaguez for their work on this
project. John C. Zeman has been supported in part by a CN
Research Fellowship in Railroad Engineering. J. Riley
Edwards has been supported in part by grants to the UIUC
Railroad Engineering Program from CN, CSX, Hanson
Professional Services, Norfolk Southern, and the George
Krambles Transportation Scholarship Fund.
NOMENCLATURE
A Cross-sectional area of the tie
br Base width of the rail
bt Base width of the tie
c Distance from neutral axis of section to extreme fiber,
assumed to be half the section height
E Young’s modulus of the tie
Ef Effective resilient modulus of the foundation
Ei Resilient modulus of layer i
e Eccentricity of the prestress force
ft’ Tensile strength of concrete
hi Thickness of layer i
I In-plane moment of inertia of the tie
k Modulus of the foundation reaction
L Length of the tie
(L/V) Ratio of lateral component to vertical component of
wheel load
M In-plane bending moment in the tie
� Axial prestress force in the tie
n Load cycle count
P Component of wheel load supported by the tie, normal
to the rail seat surface
p Surface water pressure at the rail seat
S Principal state of total stress, a 3x3 diagonal matrix
containing the principal stresses
S’ State of effective stress, a 3x3 diagonal matrix in
principal coordinates
SB Contributions from a prestressed beam on an elastic
foundation to the total stress-state, a 3x3 matrix in xyz
coordinates
SH Contributions from a uniform horizontal load to the
total stress-state, a 3x3 matrix in xyz coordinates
SV Contributions from a uniform vertical load to the total
stress-state, a 3x3 matrix in xyz coordinates
10 Copyright © 2010 by ASME
Sxyz State of total stress, a 3x3 matrix in xyz coordinates
U State of stress expression for pore water pressure, a 3x3
diagonal matrix
u Pore water pressure in the concrete
V Shear force in the tie
x Direction along the axis of the rail
y Lateral direction, along the axis of the tie
z Vertical direction, positive downward
νf Poisson’s ratio of the foundation
νt Poisson’s ratio of the tie
σi Normal stress on a face perpendicular to the i-direction,
positive when compressive
τij Shear stress on a face perpendicular to the i-direction,
positive when acting in the j-direction
REFERENCES
[1] Zeman, J.C., J.R. Edwards, D.A. Lange, C.P.L. Barkan,
“Investigating the Role of Moisture in Concrete Tie
Rail Seat Deterioration,” AREMA Conference
Proceedings 2009, American Railway Engineering and
Maintenance-of-way Association (AREMA), Landover,
Maryland, September 2009.
[2] Zeman, J.C., J.R. Edwards, D.A. Lange, C.P.L. Barkan,
“Investigation of Potential Concrete Tie Rail Seat
Deterioration Mechanisms: Cavitation Erosion and
Hydraulic Pressure Cracking,” Proceedings of the
Transportation Research Board 89th Annual Meeting,
Washington, DC, January 2010.
[3] Zeman, J.C., J.R. Edwards, D.A. Lange, C.P.L. Barkan,
“Failure Mode and Effect Analysis of Concrete Ties in
North America,” Proc. of the 9th
International Heavy
Haul Conference, Shanghai, China, June 2009.
[4] Bakharev, T., Chapters 1, 2, 3, 5, 6, and 7,
Microstructural Features of Railseat Deterioration in
Concrete Railroad Ties, M.S. Thesis, University of
Illinois at Urbana-Champaign, Urbana, Illinois, 1994,
pp. 1-28 and 68-97.
[5] Choros, J., B. Marquis, M. Coltman, “Prevention of
Derailments due to Concrete Tie Rail Seat
Deterioration,” Proceedings of the ASME/IEEE Joint
Rail Conference and the ASME Internal Combustion
Engine Division, Spring Technical Conference 2007,
pp. 173-181.
[6] Hjelmstad, K.D., Fundamentals of Structural
Mechanics, 2nd ed., Springer Science + Business Media,
LLC, New York City, New York, 2005, ch. 3 and 7, pp.
103-124 and 241-282.
[7] Poulos, H.G. and E.H. Davis, Elastic Solutions for Soil
and Rock Mechanics, John Wiley and Sons, New York
City, New York, 1974, ch. 1, 3 and 6, pp. 1-2, 54, 66,
and 162-164.
[8] Mindess, S., J.F. Young, D. Darwin, Concrete, 2nd ed.,
Pearson Education Inc., Upper Saddle River, New
Jersey, 2003, ch. 4 and 13, pp. 68-76 and 342-344.
[9] Naaman, A.E., Prestressed Concrete Analysis and
Design Fundamentals, 2nd ed., Techno Press 3000, Ann
Arbor, Michigan, 2004, ch. 4, pp. 193-195.
[10] Selig, E.T. and D. Li, “Track Modulus: Its Meaning and
Factors Influencing It,” Transportation Research
Record, v. 1470, 1994, pp. 47-54.
[11] Cai, Z., G.P. Raymond, R.J. Bathurst, “Estimate of
Static Track Modulus Using Elastic Foundation
Models,” Transportation Research Record, v. 1470,
1994, pp. 65-72.
[12] Hetenyí, M. Beams on Elastic Foundation, University
of Michigan Press, Ann Arbor, Michigan, 1946, ch. 1
and 4, pp. 1-9 and 56-58.
[13] Craig, R.R., Mechanics of Materials, 2nd ed., John
Wiley & Sons, Inc., New York City, New York, 2000,
ch. 3, pp. 81-84.
[14] Munson, B.R, D.F. Young, T.H. Okiishi, Fundamentals
of Fluid Mechanics, 5th ed., John Wiley & Sons, Inc.,
Hoboken, New Jersey, 2006, ch. 2, 8, and 9 and
Appendix B, pp. 39, 402-407, 489-492, 761.
[15] AREMA Manual for Railway Engineering, American
Railway Engineering and Maintenance-of-Way
Association (AREMA), Landover, Maryland, 2009, v
1, ch. 30, parts 2 and 4.
[16] Ameen, P.T., B.J. Pague, “Advanced Technology
Safety Initiative: Equipment Health Management
System,” Association of American Railroads, Circular
Letter (c-9907), August 26, 2004.
[17] Gemeiner, B., S. Mattson, “Wheel Impact Loads and
Transmission into Track Structure,” Transportation
Research Board 84th Annual Meeting, AR060
Committee for Railway Maintenance, Washington, DC,
January 2005.
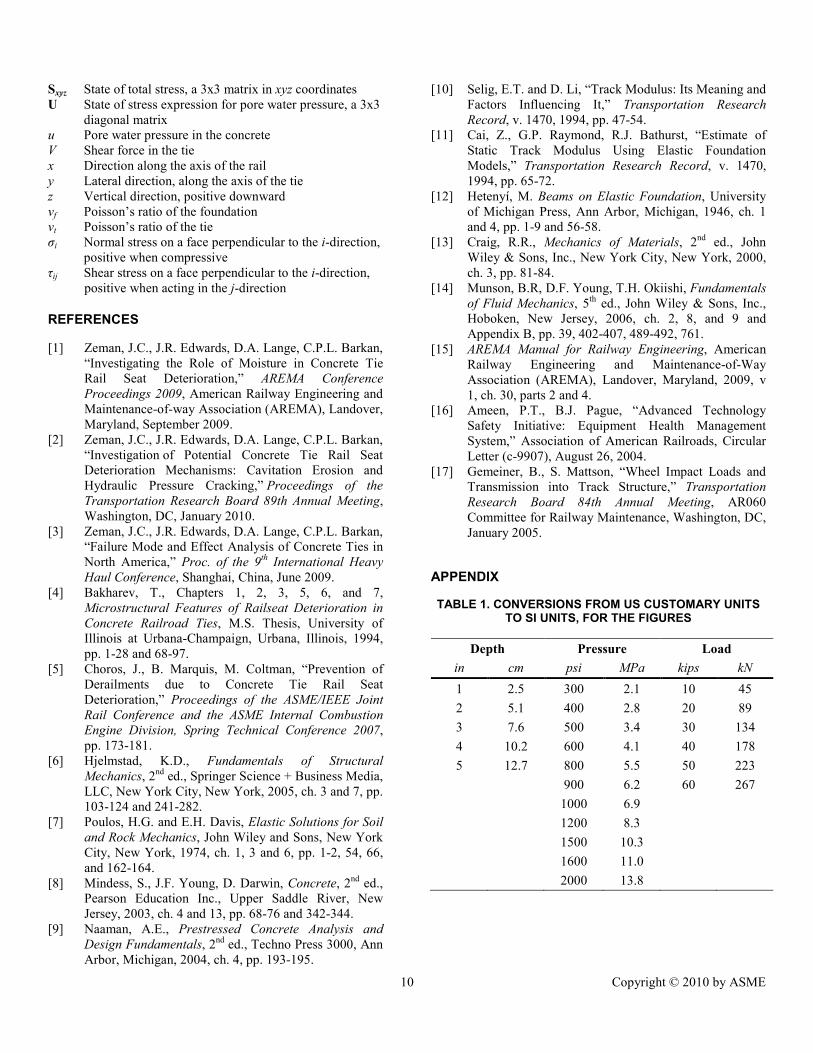
APPENDIX
TABLE 1. CONVERSIONS FROM US CUSTOMARY UNITS TO SI UNITS, FOR THE FIGURES
Depth Pressure Load
in cm psi MPa kips k�
1 2.5 300 2.1 10 45
2 5.1 400 2.8 20 89
3 7.6 500 3.4 30 134
4 10.2 600 4.1 40 178
5 12.7 800 5.5 50 223
900 6.2 60 267
1000 6.9
1200 8.3
1500 10.3
1600 11.0
2000 13.8
Recommended