EVALUATION OF FINANCIAL AND OPERATIONAL
PERFORMANCE (A Case Study of Dedebit Credit and Saving Institution)
A Research Project submitted to Department of Accounting & Finance, College of Business and Economics, Mekelle University, for the partial Fulfillment of the Degree of Master of Science in Finance & Investment
By
KASSAHUN TAFESE KENENI
CBE/PR-024/01
Advisor
Dr. FISSEHA GIRMAY, Ph.D. Assistant professor of accounting & finance
Department of Accounting and Finance College of Business & Economics
Mekelle University Mekelle, Ethiopia
June, 2010

ii
.
EVALUATION OF FINANCIAL AND OPERATIONAL
PERFORMANCE: A Case Study of Dedebit Credit and Saving Institution (DECSI)
By
KASSAHUN TAFESE KENENI
CBE/PR-024/01
iii
DECLARATION
I, Kassahun Tafese, hereby declare that this study entitled ―Evaluation of
Financial and Operational Performance: A Case Study of Dedebit Credit
and Saving Institution (DECSI) - Mekelle Branch No 1, in Tigray, Ethiopia‖
is my own genuine effort and study. I have carried out the study
independently with the guidance and support of the advisor. This study
has not been submitted for award of any degree, diploma or fellowship
program in this or other similar titles and Universities or institutions. It is
offered here in partial fulfillment for the requirement for the degree of
Master of Science (MSc) in Finance and Investment of Mekelle University.
Place: Mekelle Signature: ___________________
Date: June, 2010 KASSAHUN TAFESE

iv
CERTIFICATION
This is to certify that the project work entitled ―Evaluation of Financial and
Operational Performance: A Case Study of DECSI - Mekelle Branch No 1, in
Tigray, Ethiopia‖ is a bona-fide work by Kassahun Tafese who carried out
the research under my guidance. Certified further, that to the best of my
knowledge the work reported herein doesn‘t form part of any other project
report or dissertation on the bases of which a degree or award was
conferred on an earlier occasion on this or any other candidate.
Place: Mekelle Signature: ________________________
Date: June, 2010 Dr. FISSEHA GIRMAY (PhD) Department of Accounting & Finance
College of Business & Economics Mekelle University
v
ACKNOWLEDGEMENTS
Above all, my praises goes to the Almighty God who have given me the
tolerance and patience to reach at this stage.
I would like to extend my deep indebtedness to my advisor, Fisseha
Girmay (PhD), for his invaluable comments, encouragements and guidance
at various stages of the study.
I owe special thanks to the management and employees of Dedebit Credit
and Saving Institution (DECSI) - Mekelle Branch No 1, Tigray for so kindly
providing me the necessary data and useful information for the purpose of
this study. Further, I take the opportunity to express my deep sense
gratitude to Ato Ataklti Kiros the General Manager of Dedebit Credit and
Saving Institution, who allows me to conduct the study on this institution.
My indebtedness goes to W/t Mekdes Gesese for her support in providing
laptop for the study. I would like also to thank Ato Melak Basaznew for his
unreserved help in providing important materials and he tirelessly went
through the paper and finally gave me his invaluable comments.
Finally, my special thanks go to my beloved wife W/r Abonesh Debela for
her invaluable encouragement and home management. My thanks also
extend to my lovely kids Dawit and Noh, for their tolerance as I have spent
most of their times on the study.
Kassahun Tafese
vi
ABSTRACT
The overall objectives of all MFIs in the world would be mobilizing the vast majority of the poor
people in order to participating in the economic activity with little support from the institutions
and making profit for their continued existence. To attain these objectives the institutions should
work towards institutional Profitability and sustainability; because these factors are the most
comprehensive and reflect the ability of the MFI to continue operating in the future. This is
possible only if the institutions are measure their financial as well as operational performance
using measurement indicators which are developed by different scholars.
The objectives of DECSI in brief are food security, creation of job opportunity and stimulating the local
economy. To achieve these objectives, the institution has been striving for financial viability and
sustainability. To acknowledge its right position, the performance of the institution should be measured
every time. As a result, this research project describes financial and operational performance of
DECSI- Mekelle branch No 1; with the main objective of “evaluating financial and operational
performance” of the branch as a case study. The researcher focuses mainly on the outreach,
portfolio quality, profitability, productivity, efficiency, financial management, and financial
sustainability of the branch’s performance.
Data for the study was from primary source through unstructured personal interview with
different management bodies of the institution and secondary sources of financial statement and
operational data were analyzed via different techniques and performance indicators. In order to
see the trend in performance, five years data (2005 to 2009) were used and revealed using tables,
figures, and ratios.
The major findings of the study indicate that, the performance of the branch have declined in
terms of outreach, efficiency, productivity, profitability and financial sustainability in last year
(2009). However; the overall performance of the branch is encouraging. It attains operational self
sufficiency beyond threshold, ROE and ROA are attractive and an average portfolio at risk is too
low (only 0.75% for days 91 to 180). In addition; the branch has good potential in terms of
clients since it is located in the city.

vii
TABLE OF CONTENTS
PAGES
Title Page ii
Declaration iii
Certification iv
Acknowledgements v
Abstract vi
Table of contents viii
list of figures ix
Acronyms x
CHAPTER I 1
INTRODUCTION 1
1.1 Back Ground of the Study 1
1.2 Statement of the Problem 4
1.3 Research Questions 5
1.4 Objectives of the Study 6
1.4.1 Main Objective 6
1.4.2 Specific Objective 6
1.5 Justification of the study 6
1.6 Significance of the Study 7
1.7 Scope of the Study 7
1.8 Research Methodology 7
1.8.1 Sampling Technique 7
1.8.2 Types of Data Collection 8
1.8.3 Methods of Data Collection 8
1.8.4 Methods of Data Analysis and Interpretation 8
1.9 Limitations of the Study 8
1.10 Structure of the Study 9
CHAPTER II LITERATURE REVIEW 10
2.1 Theoretical Review 10
2.1.1 Definition of Microfinance Institution (MFI) 10
2.1.2 The History of Microfinance 10
2.1.3 Characteristics of MFIs 13
2.1.4 Key Principles of Microfinance 14
2.1.5 The Role and Contribution of Microfinance 17
2.1.6 School of Thought of MFIs 18
2.1.6.1 The Welfarists 18
2.1.6.2 The Institutionists 19
2.1.7 Performance Measurement in MFIs 19
2.1.8 Performance Measurement Indicators 20
2.1.8.1 Outreach (Coverage and Depth) 20
2.1.8.2 Portfolio Quality 22
2.1.8.3 Efficiency and Productivity 23
2.1.8.4 Financial Management 25
2.1.8.5 Profitability and Financial Viability/Sustainability 28
2.1.8.6 Analytical Adjustment 30
2.2 Empirical Review 31
2.2.1 Empirical Studies in Global Context 31

viii
2.2.2 Empirical Studies in Ethiopian context 32
CHAPTER III DESCRIPITION OF THE STUDY AREA 35
3.1 A Brief Overview of DECSI 35
3.1.1 Foundation 35
3.1.2 Vision 35
3.1.3 Mission 35
3.1.4 Objectives 36
3.1.5 Target groups 36
3.1.6 Ownership 36
3.1.7 Area Coverage 37
3.1.8 Types of Services 37
3.1.9 Organizational Structure of DECSI 38
CHAPTER IV DISCUSION AND ANALYSIS 39
4. 1 Introduction 39
4.2 The Structure of DECSI-Mekelle Branch No 1 39
4.3 Performance of DECSI-Mekelle Branch No 1 40
4.3.1 Outreach/Coverage 43
4.3.1.1 Active Clients 44
4.3.1.2 women 46
4. 3.2 Portfolio Qualities 46
4.3.2.1 Arrear rate 47
4.3.2.2 Repayment Rate 47
4.3.2.3 Portfolio at Risk (PAR) 48
4.3.2.4 Write-Off Ratio 50
4.3.3. Efficiency and Productivity 51
4.3.3.1 Operating Expense Ratio 51
4.3.3.2 Active Clients per Loan Officer 53
4.3.3.3 Active Clients per Staff Member 54
4.3.3.4 Average Outstanding Loan Size (AOLS) 55
4.3.3.5 Average Loan Disbursed 55
4.3.4 Financial (Asset/Liability) Management 56
4.3.4.1 Yields on Gross Portfolio 57
4.3.4.2 Cost of Fund 58
4.3.4.3 Portfolios to Assets 59
4.3.4.4 Debt to Equity 60
4.3.4.5 Current Ratio 61
4.3.5 Profitability and Financial Sustainability 62
4.3.5.1 Operational Self-Sufficiency (OSS) 64
4.3.5.2 Returns on Assets (ROA) 65
4.3.5.3 Returns on Equity (ROE) 66
CHAPTER V CONCLUSION AND RECOMMENDATION 67
5.1 Conclusion 67
5.2 Recommendation 69
BIBLIOGRAPHY 72
APPENDIX Appendix A: Consolidated Balance sheet 76
Appendix B: Consolidated Income Statement 77
Appendix C: Consolidated Operational Report 78
Appendix D: Portfolio at Risk 79
Appendix E: Interview questions 80

ix
LIST OF TABLES
TABLE No DESCRIPTION PAGES
Table 2.1 Formula for PAR 23
Table 2.2 Productivity and Efficiency Ratios Calculation 24
Table 2. 3 Financial Management Ratios Calculation 26
Table 2.4 Sustainability and Profitability Ratios Calculation 29
Table 4.5 Active Clients Served by the Branch 44
Table 4.6 Trends of Portfolio at Risk Ratio 50
Table 4.7 Trends of the Efficiency and Productivity Measurements 52
Table 4.8 Financial Management Ratios 57
Table 4.9 Profitability and Financial Sustainability Ratios 63
LIST OF FIGURES
FIGURE No DESCRIPTION PAGES
Figure 1 Trend of Total Active Client 45
Figure 2 Trends of Gender and Client Growth 46
Figure 3 Average portfolio at Risk 47
Figure 4 Operating Expense Ratio 53
Figure 5 Trends of Borrowers per Loan Officer and Active Clients per Staff Member
54
Figure 6 Average Outstanding Loan Size and Average Loan Disbursement
56
Figure 7 Yield on Portfolio and Cost of Fund 59
Figure 8 Portfolio to Asset and Debt to Equity 61
Figure 9 Current Ratio 62
Figure 10 Operational Self Sufficiency 64
Figure 11 Return on Asset and Return on Equity 66

x
ACRONYMS
ACSI Amhara Credit and Saving Institution
AEMFI Association of Ethiopian Microfinance Institutions
CGAP Cumulative Group to Assist the Poorest
DECSI Dedebit Credit and Saving Institution
FSS Financial Self- Sufficiency
GLP Gross Loan Portfolio
MENA Middle East and North Africa
MFIs Microfinance Institutions
NGO Nongovernmental Organizations
OSS Operational Self- Sufficiency
PAR Portfolio at Risk
CST Credit Scheme of Tigray
REST Relief Society of Tigray
ROA Return on Assets
ROE Return on Equity
ROSCAs Rotating Savings and Credit Associations
SFPI Specialized Financial and Promotional Institution

- 1 -
CHAPTER I INTRODUCTION
1.1 Back Ground of the Study
The emergence of the global micro finance has a history of about three decades, yet has
gone through stages of historical development. The micro finance industry is said to be
in revolution: the service that was initiated in small scale and small village of South East
Asia ―Chintanga‖, Bangladesh now turned to be international agenda (Arega, 2007).
The microfinance sector in Africa is quickly expanding, and institutions have increased
their activities. In fact, African Micro Finance Institutions (MFIs) are among the most
productive globally, as measured by the number of borrowers and savers per staff
member. They also demonstrate higher levels of portfolio quality, with an average
portfolio at risk over 30 days of only 4.0 percent. Still, they face many challenges.
Operating and financial expenses are high, and on average, revenues remain lower than
in other global regions. Technological innovations, product refinements, and ongoing
efforts to strengthen the capacity of African MFIs are needed to reduce costs, increase
outreach, and boost overall profitability.
Overall, African MFIs are important actors in the financial sector, and they are well
positioned to grow and reach the millions of potential clients who currently do not have
access to mainstream financial services (Anne-Lucie et al, 2005).
When we came to Ethiopian financial sector, until the initiation of financial sector
reforms in 1993, state-owned banks were the only authorized providers of financial
services in country, although a few small informal private financial institutions existed.
Responding to unsatisfied gap in financial services for micro and small-scale enterprises,
formal MFIs began emerge.

- 2 -
Institutionalization of microfinance is evolved after the Ethiopian government issued
the proclamation No.40/1996. Because, NGOs, government agencies, and cooperatives
and others perform micro credit delivery and savings mobilization in the country, in a
scattered and inconsistent way, the government took the initiative to establish the
regulatory framework in order to facilitate the sound development of the microfinance
industry (Arega, 2007). This resulted in institutionalization of 29 MFIs (AEMFI, 2009)
which are currently operating in the economy.
The Ethiopia‘s 1996 law on Licensing and Supervision of Micro-Financing Institutions
evidently shifted the basis of microfinance from humanitarian-oriented projects to a
more commercial orientation as incorporated financial intermediaries. Despite the
limited format permitted by the regulatory framework, Ethiopia has a relatively large
number of licensed MFIs, with strong rural penetration and high operational efficiency,
some reaching significant scale. Nevertheless, the system has some weaknesses in terms
of supervision, compliance with regulatory norms, governance, and lack of flexibility.
Prior to 1996, microfinance in Ethiopia (apart from traditional informal mechanisms)
consisted primarily of projects by some 30 NGOs with mainly humanitarian objectives
and was not based on sound, sustainable financial principles. Default rates were high,
with little attempt at savings mobilization (William et al, 2003).
Although Ethiopia was a leader in Africa in moving to treat MFIs as financial
intermediaries, it has only gradually moved toward promoting financial self-sufficiency.
The interest rate was initially fixed at 2% above the maximum rate for commercial
banks. Although the ceiling was removed in 1998, most MFIs were slow to go above the
previously mandated rate of 12.5%, reflecting both the influence of the regional
governments and the view that the poor cannot afford higher rates. With a floor of 6%
on savings, they found it difficult to cover the relatively high costs involved and had to
depend on subsidies and concessional funding. By 2002, however, most MFIs were
charging 18-24% (flat rate) and achieving high levels of operational self-sufficiency.
While Ethiopian MFIs had kept costs low by international standards, that had come in

- 3 -
part through complementary efforts of government agencies, especially to support the
regional MFIs and implementation of the government‘s agricultural input credit
scheme. All MFIs were depending to some extent on a combination of government
support and donor funding, although a few had been moving toward full financial
sustainability (William et al, 2003).
It is obvious that performance of any institution shall be measured from the objectives of
the organization angle. Microfinance‘s goal is to eradicate poverty. In the early days
when MFIs started they were financed by donor funds that have a poverty eradication
goal. Hence, the performance of the MFI was measured on how much MFI reach to the
poor (outreach) and impact (how far the live of those who get financial services are
changing as compared to those who don‘t get these services). But as the MF industry
grows in size, the need for increased financing coupled with unpredictability of donor
funds trigger the issue of building a sustainable MFIs that stand on their own leg. That
means MFIs shall start covering their own cost of operation from their program
revenues. Sustainability is loosely defined as the ability of a MFI to cover its operating
and other costs from generated revenue and provide for profit. It is an indicator which
shows how the MFI can run independent (free) of subsidies. Today many key
performance indicators used to measure the performance of the microfinance
institution. Some of these are portfolio quality, efficiency and productivity, financial
management and profitability play insignificant role to evaluate the performance of the
MFIs (Letenah, 2009).
The absence of financial institutions which can provide financial services to the poor
was one of the obstacles that hindered the undertaking of rehabilitation and
development activities after downfall of socialist administration of Ethiopia. As a
response, Dedebit Credit and Saving Institution /DECSI/ was established in 1994 as one
development wing of the Relief Society of Tigray (REST) to provide financial services to
the poor households. After 3 years of its operation, DECSI was reregistered in the form
of a Share holding Company as a legal entity in 1997 following the proclamation of the

- 4 -
National Bank of Ethiopia. With such commitment, DECSI has been working widely in
rural and urban Tigray for the last 16 years.
Currently DECSI has providing financial services through 139 offices, 8 main branch
offices and 15 micro finance collateral based branches. Up to now Birr 4 billion loans
have provided, over 407,780 active loan clients and have around 2000 staff employees.
Mekelle branch No 1 is one of the 15 branches which located in Mekelle city (DECSI,
2009).
The main aim of this study is to analyze the financial and operational performance of
this branch of the DECSI as a case study. The main performance measurement
indicators are incorporated to measure the performance of the branch.
1.2 Statement of the Problem
The overall objectives of all MFIs in the world would be;
(1) Mobilizing the vast majority of the poor people in order to participating in the
economic activity with little support from the institutions and
(2) Making profit for their continued existence.
To attain these objectives, the institutions should work towards institutional Profitability
and sustainability; because these parameters are the most comprehensive and reflect the
ability of the MFI to continue operating in the future. This is possible only if the
institutions are measure their financial as well as operational performance using
measurement indicators which are developed by different scholars.
The objectives of DECSI in brief are food security, creation of job opportunity and
stimulating the local economy. To achieve these objectives the institution should be
financially viable and sustainable. Judging success and progress based on size of
amounts dispersed, repayment levels and numbers of clients in a scheme may

- 5 -
sometimes lead to wrong conclusion. Moreover; international best practice in
microfinance around the world suggests, good financial analysis is the basis for
successful and sustainable microfinance operations. Some would even say that without
financial analysis MFI will never achieve sustainability.
The success of an enterprise to a great extent depends upon its financial and operating
performance. A careful and well-planned financial management is needed for raising
resources and utilizing them effectively. The financial performance of an enterprise
greatly influences its operational results and business efficiency. Besides, healthy
financial and operating performance of microfinance institutions is obviously very
important for a well functioning financial system in developing countries. Therefore, it
is highly significant to evaluate the financial performance of DECSI in relation to
efficiency in mobilizing the required credit and savings, and effectiveness in utilization
of these resources. For this purpose DECSI - Mekelle Branch No 1, in Tigray, is selected.
Hence, the present study entitled ―Evaluation of Financial and Operational
Performance: A Case Study of DECSI - Mekelle Branch No 1, in Tigray, is intended to
make a detail examination of the financial and operating performance of this selected
Branch.
1.3 Research Questions
The research questions focus on the following points:-
1. How the outreach level of the branch?
2. How does the quality of the portfolio?
3. Does the branch operate efficiently?
4. How is asset/liability management of the branch?
5. Does the profit earned make the branch self sufficient to cover it operational
costs?
6. Does the institution make necessary adjustments to the subsidies, inflation and
portfolio at risk?
- 6 -
1.4 Objectives of the Study
1.4.1 Main Objective
The main objective of this study is to analyze the financial and operational performance
of DECSI by taking Mekelle branch No 1 as a case study.
1.4.2 Specific Objective
The specific objectives of the study are focuses on the following points:-
1. To assess the outreach level of the branch
2. To examine the quality of portfolio of the branch
3. To evaluate asset/liability management of the branch
4. To assess how well the branch is operating
5. To find out whether the branch cover its operational cost with its earned
profits or not
6. To assess whether the institution make necessary adjustments to the subsidies,
inflation and portfolio at risk or not
1.5 Justification of the study
The importance of microfinance institutions to one country is multidimensional; at
glance, poverty eradication, healthy financial circulation, and contribution of economic
growth of the country. Therefore, the success of micro-financing operations has a
paramount importance in the development endeavor of the country. The rationale of the
study is aimed at shading some light as a contribution to address the problem, to waken
up further researchers in these institutions and suggest possible recommendations.
Furthermore, the findings of this research will be disseminated to officials in of the
institution to take whatever benefits of the study.

- 7 -
1.6 Significance of the Study
In spite of the fact that DECSI Mekelle branch No 1 has been undertaking its financial
and operational performance based on its own procedures and time, this study may
indicate the gap that the institution might not have been considered yet. Therefore, the
study adds value to the institution‘s managers, policy makers and workers so that they
can evaluate their performance once again. The study may also indicate the direction for
latter research work in the area as well.
1.7 Scope of the Study
The outcomes of the research are more pleasing if it was be able to cover more branches
of the institution. However; due to the shortage of time to study and the scattered
nature of the locations of the branches in the region, the scope of the study limited to the
Mekelle branch No 1 which is located in Mekelle city. Moreover; the study was also
delimited to the assessment of financial and operational performance of the branch for
the last five years starting from 2005 up to 2009.
1.8 Research Methodology
1.8.1 Sampling Technique
This is analytical research based on a case study approach. Because of scarcity of
resources at disposal and time limit given to the study; and more important the
locations where the branches exist are so scattered; using convenience sampling
technique one branch was chosen by the researcher to make thorough investigation
believing that it will throw a highlight as to the performance of the other branches of
DECSI . For this end, a recent five-year data were gathered to best describe the
performance.
- 8 -
1.8.2 Types of Data Collection
This study has conducted based on secondary as well as primary data. The secondary
data were gathered mainly from financial statements (balance sheet and income
statement) and operational report of the branch. Other sources of data were gathered
from DECSI main office, bulletins, government regulations, bank reports and internet.
The primary data were collected using unstructured interview with the branch officials
and the employees who have relevant task with the study area.
1.8.3 Methods of Data Collection
Data were collected using primary data gathering instruments – questionnaire and
personal interview. Interviews were conducted to the higher officials and the employees
of the institution who have direct relation with the study area.
1.8.4 Methods of Data Analysis and Interpretation
The data are scrutinized to facilitate and to make clear for analysis. The data are
analyzed using different statistical tools. The raw data are analyzed, summarized and
presented in tables, graphs and charts. Then interpreted to give solutions for the
research problem by using ratios; because, ratio analysis is a financial management tool
that enables managers of microfinance institutions to assess their progress in
achievement. Moreover, trends of the ratios used to measure the performance of each
year; because, it is important to show the trends of several accounting periods to
determine changes in performance.
The data that were collected are both qualitative and quantitative in nature and the
researcher used descriptive method of data analysis.
1.9 Limitations of the Study
Even if, the primary data fill the gap where the secondary data were unavailable, some
data still unavailable; so that certain measurement parameters excluded from the study.

- 9 -
1.10 Structure of the Study
The organization of this study makes five chapters. The first chapter is the introduction
part which encompasses the background of the study, the statement of the research
problem, the research question of the study, the objective of the study, the significance
of the study, the scope of the study, the design and methodology and the research
limitation. The second chapter presents the related review of literature. The third
chapter describes about the study area. The fourth chapter is data analysis and
discussion. The fifth chapter provides conclusion and recommendation.

- 10 -
CHAPTER II LITERATURE REVIEW
2.1 Theoretical Review
2.1.1 Definition of Microfinance Institution (MFI)
A MFI is an organization that provides financial services to the poor. This very broad
definition includes a wide range of providers that vary in their legal structure, mission,
and methodology. However, all share the common characteristic of providing financial
services to clients who are poorer and more vulnerable than traditional bank clients.
During the 1970s and 1980s, the microenterprise movement led to the emergence of
nongovernmental organizations (NGOs) that provided small loans for the poor. In the
1990s, a number of these institutions transformed themselves into formal financial
institutions in order to access and on-lend client savings, thus enhancing their outreach.
Specialized microfinance institutions have proven that the poor are ―bankable‖. Today,
formal institutions are rapidly absorbing the lessons learned about how to do small-
transaction banking. Many of the newer players in microfinance, such as commercial
banks, have large existing branch networks, vast distribution outlets like automatic
teller machines, and the ability to make significant investments in technology that could
bring financial services closer to poor clients. Increasingly, links among different types
of services providers are emerging to offer considerable scope for extending access
(CGAP, 2010).
2.1.2 The History of Microfinance
The concept of microfinance is not new. Savings and credit groups that have operated
for centuries include the "susus" of Ghana, "chit funds" in India, "tandas" in Mexico,
- 11 -
"arisan" in Indonesia, "cheetu" in Sri Lanka, "tontines" in West Africa, and "pasanaku" in
Bolivia, as well as numerous savings clubs and burial societies found all over the world.
Formal credit and savings institutions for the poor have also been around for decades,
providing customers who were traditionally neglected by commercial banks, a way to
obtain financial services through cooperatives and development finance institutions.
One of the earlier and longer-lived micro credit organizations providing small loans to
rural poor with no collateral was the Irish Loan Fund system, initiated in the early 1700s
by the author and nationalist Jonathan Swift. Swift's idea began slowly but by the 1840s
had become a widespread institution of about 300 funds all over Ireland. Their principal
purpose was making small loans with interest for short periods. At their peak they were
making loans to 20% of all Irish households annually.
In the 1800s, various types of larger and more formal savings and credit institutions
began to emerge in Europe, organized primarily among the rural and urban poor. These
institutions were known as People's Banks, Credit Unions, and Savings and Credit Co-
operatives. The concept of the credit union was developed by Friedrich Wilhelm
Raiffeisen and his supporters. Their altruistic action was motivated by concern to assist
the rural population to break out of their dependence on moneylenders and to improve
their welfare. From 1870, the unions expanded rapidly over a large sector of the Rhine
Province and other regions of the German States. The cooperative movement quickly
spread to other countries in Europe and North America, and eventually, supported by
the cooperative movements in developed countries and donors, also to developing
countries.
In Indonesia, the Indonesian People's Credit Banks (BPR) or The Bank Perkreditan
Rakyat opened in 1895. The BPR became the largest microfinance system in Indonesia
with close to 9,000 units.
In the early 1900s, various adaptations of these models began to appear in parts of rural
Latin America. While the goal of such rural finance interventions was usually defined in
- 12 -
terms of modernizing the agricultural sector, they usually had two specific objectives:
increased commercialization of the rural sector, by mobilizing "idle" savings and
increasing investment through credit, and reducing oppressive feudal relations that
were enforced through indebtedness. In most cases, these new banks for the poor were
not owned by the poor themselves, as they had been in Europe, but by government
agencies or private banks. Over the years, these institutions became inefficient and at
times, abusive.
Between the 1950s and 1970s, governments and donors focused on providing
agricultural credit to small and marginal farmers, in hopes of raising productivity and
incomes. These efforts to expand access to agricultural credit emphasized supply-led
government interventions in the form of targeted credit through state-owned
development finance institutions, or farmers' cooperatives in some cases, that received
concessional loans and on-lent to customers at below-market interest rates. These
subsidized schemes were rarely successful. Rural development banks suffered massive
erosion of their capital base due to subsidized lending rates and poor repayment
discipline and the funds did not always reach the poor, often ending up concentrated in
the hands of better-off farmers.
Meanwhile, starting in the 1970s, experimental programs in Bangladesh, Brazil, and a
few other countries extended tiny loans to groups of poor women to invest in micro-
businesses. This type of microenterprise credit was based on solidarity group lending in
which every member of a group guaranteed the repayment of all members. These
"microenterprise lending" programs had an almost exclusive focus on credit for income
generating activities (in some cases accompanied by forced savings schemes) targeting
very poor (often women) borrowers (Mercy Corps, 2006).
In general, the history of the modern microfinance institution can be traced back to
Bangladesh and the launch of Grameen Bank by Professor Muhammad Yunus in the late
1970s. Through Grameen Bank, Yunus was able to provide access to very small amounts

- 13 -
of capital with no collateral requirements. Grameen provided this capital at a very low
interest rate, which was almost unheard of when lending to the poor (Jonathan, 2010).
2.1.3 Characteristics of MFIs
The term ―microfinance institutions‖ is generally used to refer to those financial
institutions that are characterized by their commitment to assisting typically poor
households and small enterprises in gaining access to financial service. This
commitment may replace or supplement other private or public objectives, such as the
maximization of shareholder value, the direction of investment into priority sectors, or
the mobilization of savings to finance government operations. In common usage, MFIs
are distinguished from purely commercial, small-scale, possibly informal financial
institutions dealing with the poor (for example, village moneylenders, pawnshops, and
informal transfer systems) and from large, perhaps government-sponsored schemes that
may hold numerous small accounts more or less as a byproduct of their main business
(for example, national savings schemes or post office savings banks) (Daniel, 2002).
Formal providers are sometimes defined as those that are subject not only to general
laws but also to specific banking regulation and supervision (development banks,
savings and postal banks, commercial banks, and non-bank financial intermediaries).
Formal providers may also be any registered legal organizations offering any kind of
financial services. Semiformal providers are registered entities subject to general and
commercial laws but are not usually under bank regulation and supervision (financial
NGOs, credit unions and cooperatives). Informal providers are non-registered groups
such as Rotating Savings and Credit Associations (ROSCAs) and self-help groups.
Ownership structures: MFIs can be government-owned, like the rural credit
cooperatives in China; member-owned, like the credit unions in West Africa; socially
minded shareholders, like many transformed NGOs in Latin America; and profit-
maximizing shareholders, like the microfinance banks in Eastern Europe. The types of
services offered are limited by what is allowed by the legal structure of the provider:

- 14 -
non-regulated institutions are not generally allowed to provide savings or insurance
(CGAP, 2010).
2.1.4 Key Principles of Microfinance
1. The poor need a variety of financial services, not just loans: - Just like everyone
else, poor people need a wide range of financial services that are convenient, flexible,
and reasonably priced. Depending on their circumstances, poor people need not only
credit, but also savings, cash transfers, and insurance.
2. Microfinance is a powerful instrument against poverty: - Access to sustainable
financial services enables the poor to increase incomes, build assets, and reduce their
vulnerability to external shocks. Microfinance allows poor households to move from
everyday survival to planning for the future, investing in better nutrition, improved
living conditions, and children‘s health and education.
3. Microfinance means building financial systems that serve the poor: - Poor people
constitute the vast majority of the population in most developing countries. Yet, an
overwhelming number of the poor continue to lack access to basic financial services.
In many countries, microfinance continues to be seen as a marginal sector and
primarily a development concern for donors, governments, and socially-responsible
investors. In order to achieve its full potential of reaching a large number of the poor,
microfinance should become an integral part of the financial sector.
4. Financial sustainability is necessary to reach significant numbers of poor people: -
Most poor people are not able to access financial services because of the lack of
strong retail financial intermediaries. Building financially sustainable institutions is
not an end in itself. It is the only way to reach significant scale and impact far beyond
what donor agencies can fund. Sustainability is the ability of a microfinance provider
to cover all of its costs. It allows the continued operation of the microfinance
provider and the ongoing provision of financial services to the poor. Achieving

- 15 -
financial sustainability means reducing transaction costs, offering better products
and services that meet client needs, and finding new ways to reach the unbanked
poor.
5. Microfinance is about building permanent local financial institutions: - Building
financial systems for the poor means building sound domestic financial
intermediaries that can provide financial services to poor people on a permanent
basis; such institutions should be able to mobilize and recycle domestic savings,
extend credit, and provide a range of services. Dependence on funding from donors
and governments—including government-financed development banks—will
gradually diminish as local financial institutions and private capital markets mature.
6. Microcredit is not always the answer: - Microcredit is not appropriate for every one
or every situation. The destitute and hungry that have no income or means of
repayment need other forms of support before they can make use of loans. In many
cases, small grants, infrastructure improvements, employment and training
programs, and other non-financial services may be more appropriate tools for
poverty alleviation. Wherever possible, such non-financial services should be
coupled with building savings.
7. Interest rate ceilings can damage poor people’s access to financial services: - It
costs much more to make many small loans than a few large loans. Unless micro-
lenders can charge interest rates that are well above average bank loan rates, they
cannot cover their costs, and their growth and sustainability will be limited by the
scarce and uncertain supply of subsidized funding. When governments regulate
interest rates, they usually set them at levels too low to permit sustainable
microcredit. At the same time, micro-lenders should not pass on operational
inefficiencies to clients in the form of prices (interest rates and other fees) that are far
higher than they need to be.

- 16 -
8. The government’s role is as an enabler, not as a direct provider of financial
services: - National governments play an important role in setting a supportive
policy environment that stimulates the development of financial services while
protecting poor people‘s savings. The key things that a government can do for
microfinance are to maintain macroeconomic stability, avoid interest-rate caps, and
refrain from distorting the market with unsustainable subsidized, high delinquency
loan programs. Governments can also support financial services for the poor by
improving the business environment for entrepreneurs, clamping down on
corruption, and improving access to markets and infrastructure. In special situations,
government funding for sound and independent microfinance institutions may be
warranted when other funds are lacking.
9. Donor subsidies should complement, not compete with private sector capital: -
Donors should use appropriate grant, loan, and equity instruments on a temporary
basis to build the institutional capacity of financial providers, develop supporting
infrastructure (like rating agencies, credit bureaus, audit capacity, etc.), and support
experimental services and products. In some cases, longer-term donor subsidies may
be required to reach sparsely populated and otherwise difficult-to-reach populations.
To be effective, donor funding must seek to integrate financial services for the poor
into local financial markets; apply specialist expertise to the design and
implementation of projects; require that financial institutions and other partners
meet minimum performance standards as a condition for continued support; and
plan for exit from the outset.
10. The lack of institutional and human capacity is the key constraint: - Microfinance
is a specialized field that combines banking with social goals, and capacity needs to
be built at all levels, from financial institutions through the regulatory and
supervisory bodies and information systems, to government development entities
and donor agencies. Most investments in the sector, both public and private, should
focus on this capacity building.
- 17 -
11. The importance of financial and outreach transparency: - Accurate, standardized,
and comparable information on the financial and social performance of financial
institutions providing services to the poor is imperative. Bank supervisors and
regulators, donors, investors, and more importantly, the poor who are clients of
microfinance need this information to adequately assess risk and returns (CGAP, 2010).
2.1.5 The Role and Contribution of Microfinance
Microfinance services include micro credit, savings, money transfer, and insurance
products. Over the past 20 years, microfinance has developed into a specialized method
of providing these financial services at sustainable rates to the economically active poor
households, who cannot access the commercial banks of the formal sector, be it for
socio-cultural, systemic, geographical, or other reasons.
Target clients of the microfinance industry use and benefit from small savings and loans
to grow rather than establish their micro-businesses. The key motivator for microfinance
clients is access to (rather than price of) reliable and continuous financial services. The
chief motivation for repaying a loan is the promise of future access to another loan and
this is often re-enforced with social collateral such as group guarantees. This explains
why microfinance can operate successfully in the informal sector without physical
collateral, enforceable contracts, and commercial courts or enabling legislature. The laws
of microfinance are embedded in good operating practices and re-enforced by social
contracts.
Microfinance is not simply banking for the poor; it is a development approach with a
social mission and a private sector-based financial bottom line that uses tested and
continually adjusted sets of principles, practices and technologies. The key to successful
microfinance lies in the ability of the provider to cost-effectively reach a critical mass of
clients with systems of delivery, market responsiveness, risk management and control
that can generate a profit to the institution. Typically, this profit is ploughed back to
ensure the long-term survival of the institution, i.e. the continuous provision of services
- 18 -
demanded by its clients. The two long-term goals of microfinance are thus substantial
outreach and sustainability.
Financial services, especially credit, are being delivered around the world without
sufficient knowledge of or attention to these good practices – but the short-term losses,
and the longer-term unsustainable impact of such schemes ultimately harm the very
clients that they were meant to benefit. The experience from past failures proves that
direct provision of services by subsidized and non-profit bodies tends to result in
limited outreach and unsustainable impact. This fact is, however, sometimes overlooked
in the quest to combat poverty by availing cash to the poor through any available
channel. Because money is a commodity well-known and managed by almost everyone,
the technical skill and specialization necessary to provide this business service
successfully is often not adequately recognized.
Microfinance can be an effective and powerful instrument for poverty reduction,
helping poor people to increase incomes, build assets, and reduce their vulnerability in
times of economic stress. But it must be provided by institutions who strive to become
effective business entities by developing a strategic vision for viability and the necessary
professional skill and capacity. Often, promising microfinance institutions need support
to address constraints during their first 2-5 years in order to secure their ability to
provide market-responsive services in a viable manner (Lene, 2010).
2.1.6 School of Thought of MFIs
2.1.6.1 The Welfarists
The Welfarists are arguing that MFIs can achieve sustainability without achieving
financial sustainability. They contend that donations serve as a form of equity and as
such donors can be viewed as social investors. Unlike private investors who purchase
equity in publicly traded firm, social investors don‘t expect to earn monetary returns.
Instead these donor investors realize a social (intrinsic) return (Meyer, 2002).
- 19 -
Welfarists tend to emphasize poverty alleviation, place relatively greater weight on
depth of outreach relative to breadth of outreach and gauge institutional success
according to social metrics. This is not to say that neither breadth of outreach nor
financial metrics matter. Welfarists feel these issues are important, but they are less
willing than Institutionist to sacrifice depth of outreach to achieve them.
2.1.6.2 The Institutionists
The Institutionists are arguing that unless we build sustainable MFI that are capable of
running independent of subsidies the promise of MFI of eradicating world poverty will
not be met. They argue that sustainable MFI helps to expand outreach and reach more
poor people.
Hence even if the two schools of thought seem contradictory, they are actually not. Their
goal is eradicating poverty. Their difference lies on how to go about it. Welfarists say we
have to target the very poor and profitability shall be secondary. They prefer to charge
subsidized and low interest rates by relying on donor funds. Institutionist argues donor
funds are unreliable and MFI must by themselves generate enough revenues to reach
more poor people in the future. They favor marginally poor customer. They charge
higher interest rates and focus on efficiency of MFIs to generate profit and reach more
poor. The debate between the two schools of thought is endless and today many players
in the MF industry use both the welfarists and instututionist perspective to assess the
performance of MFIs (Basu, 2004).
2.1.7 Performance Measurement in MFIs
For many years the MFI industry was operating with subsidy from donors and
governments but there is now a pressure on these organizations to be financial
sustainable. However, it seems that serving the poor and being financially self sufficient
seems contradictory. Various arguments are forwarded: the poor can‘t pay high interest
rate, if the poor consume it has no collateral, there is big transaction cost in serving the

- 20 -
poor. But these assumptions are falsified in the last 20 years and the poor is seen as
capable of paying high interest as Return On Investment of small projects are larger than
large projects, the poor don‘t consume the money rather use it for financing his/her
business, transaction cost barriers are mitigated by the creation of group lending,
absence of physical collateral is mitigated by social capital. Hence contrary to the
expectations the MFI industry has shown significant repayment rate although high
repayment rates can‘t be translated into financial sustainability (Letenah, 2009).
2.1.8 Performance Measurement Indicators
The indicators presented to measure the performance of the MFIs fall into one of five
main categories: Outreach, portfolio quality, efficiency and productivity, financial
management and financial Sustainability and profitability. Of course, there are other
aspects that throw light on the performance of microfinance institutions and, even
within the five categories listed here; there are many different performance measures.
2.1.8.1 Outreach (Coverage and Depth)
The indicators for the outreach of the organization give information on the coverage
(size of operations in terms of clients) and on the depth or poverty orientation (to which
extent the institution serves poor households and which economic sectors it reaches).
The information on outreach is crucial to understand and interpret the indicators that
follow, in sections 2.1.8.2 to 2.1.8.6. Any changes in the coverage or depth of the financial
services will affect all performance indicators and have thus to be kept in mind when
analyzing the data and ratios (Berne, 2005).
Growth and outreach are important indicators to monitor, not only as ―social‖
objectives, but also as financial indicators: new clients provide a basis for revenue and
asset growth. It is fair to say that most MFIs do want to grow. Growth can be calculated
for anything by using the following formula: percentage growth = (final amount – initial

- 21 -
amount) / initial amount. Outreach is sometimes defined as sheer number of clients
reached, and sometimes it becomes more specific to include what segment of clients is
served. Common outreach categories include gender, age, poverty indices, geographic
location, or type of micro entrepreneurial activity. Because outreach is so closely linked
to the MFI‘s social goals.
The key areas of growth are:
Loan portfolio growth is the engine of revenue growth. An MFI may experience
seasonal fluctuation of its loan portfolio so that it may shrink from one quarter to
the next. An MFI should exhibit long-term growth of its loan portfolio.
Growth in borrowers is a good indicator of future revenues. As the number of
experienced clients increase, the loan portfolio and revenues will increase. Net
growth equals new clients minus clients who have left the program. Client
withdrawal is critical in assessing client satisfaction and greatly influences
efficiency and productivity.
Growth in equity is the foundation for future asset growth. This indicator reveals
how efficiently the MFI transfers revenues to equity, thereby enabling the
institution to grow.
Depth of portfolio evaluates how well the MFI is penetrating the market of very
low-income clients. This ratio serves as a proxy for client income by comparing the
average outstanding loan size with gross domestic product per capita. The smaller
the ratio, the poorer the client is assumed to be. While this says little about financial
performance, it may be relevant to the MFI‘s mission or other stated goals (Nancy,
2003).

- 22 -
2.1.8.2 Portfolio Quality
Portfolio quality is a crucial area of analysis, since the largest source of risk for any
financial institution resides in its loan portfolio. The loan portfolio is by far an MFI‘s
largest asset and, in addition, the quality of that asset and therefore, the risk it poses for
the institution can be quite difficult to measure. For microfinance institutions, whose
loans are typically not backed by bankable collateral, the quality of the portfolio is
absolutely crucial. Fortunately, many microfinance institutions have learned how to
maintain loan portfolios of very high quality. In fact, leading microfinance institutions
typically better at maintaining a higher portfolio quality than their commercial bank
peers in many countries (MicroRate et al, 2003).
Portfolio at Risk (PAR)
PAR and the Write-off Ratio are the preferred ratios for analyzing portfolio quality. PAR
is the value of all loans outstanding that have one or more installments of principal past
due more than a certain number of days. This item includes the entire unpaid principal
balance, including both the past due and future installments, but not accrued interest. It
also does not include loans that have been restructured or rescheduled. PAR is usually
divided into categories according to the amount of time passed since the first missed
principal installment.
Value of payments in arrears – the sum of all principal payments that are past due. It
does not include past-due interest. This item is also referred to as total arrears and
should not be confused with portfolio at risk.
PAR is the most accepted measure of portfolio quality. The most common international
measurements of PAR are > 30 days and > 90 days. But can vary with terms of loan.
- 23 -
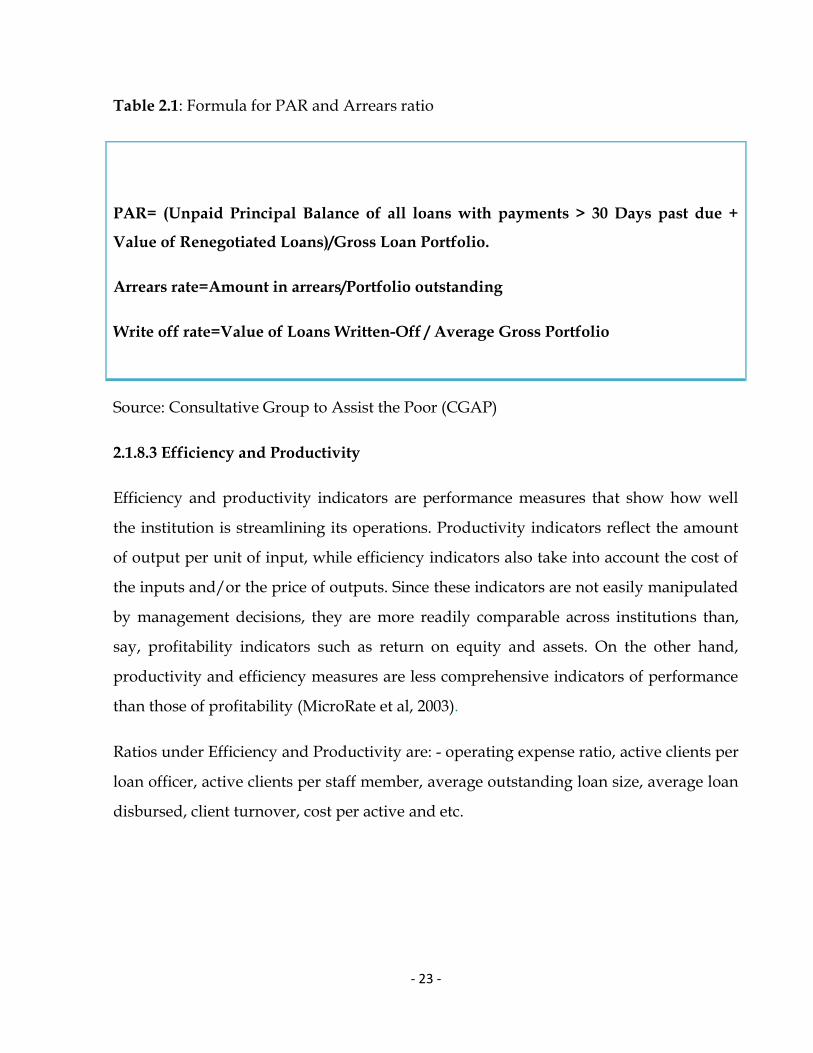
Table 2.1: Formula for PAR and Arrears ratio
PAR= (Unpaid Principal Balance of all loans with payments > 30 Days past due +
Value of Renegotiated Loans)/Gross Loan Portfolio.
Arrears rate=Amount in arrears/Portfolio outstanding
Write off rate=Value of Loans Written-Off / Average Gross Portfolio
Source: Consultative Group to Assist the Poor (CGAP)
2.1.8.3 Efficiency and Productivity
Efficiency and productivity indicators are performance measures that show how well
the institution is streamlining its operations. Productivity indicators reflect the amount
of output per unit of input, while efficiency indicators also take into account the cost of
the inputs and/or the price of outputs. Since these indicators are not easily manipulated
by management decisions, they are more readily comparable across institutions than,
say, profitability indicators such as return on equity and assets. On the other hand,
productivity and efficiency measures are less comprehensive indicators of performance
than those of profitability (MicroRate et al, 2003).
Ratios under Efficiency and Productivity are: - operating expense ratio, active clients per
loan officer, active clients per staff member, average outstanding loan size, average loan
disbursed, client turnover, cost per active and etc.

- 24 -
Table 2.2: Productivity and Efficiency Ratios Calculation
Ratio Formula Explanation
Operating Expense
Operating Expense/Average
Gross Loan Portfolio
Highlight personnel and
administrative expenses
relative to the loan portfolio
the most commonly used
efficiency indicator.
Cost per Active Client
Operating Expense/Average
Number of Active Clients
Provides a meaningful
measure of efficiency for an
MFI, allowing it to determine
the average cost of
maintaining an active client.
Borrowers per Loan Officer Number of Active
Borrowers/Number of Loan
Officers
Measures the average
caseload of (average number
of borrowers managed by)
each loan officer.
Active Clients per Staff
Member
Number of Active
Clients/Total Number of
Personnel
The overall productivity of
the MFI‘s personnel in terms
of managing clients, including
borrowers, voluntary savers,
and other clients.
Client Turnover
Number of Active Clients,
beginning of period +
Number of New Clients
Measures the net number of
clients continuing to access
services during the period;

- 25 -
during period – Number of
Active Clients, end of
period/Average Number of
Active Clients
used as one measurement of
client satisfaction.
Average Outstanding Loan
Size
Gross Loan Portfolio/Number
of Loans Outstanding
Measures the average
outstanding loan balance per
borrower. This ratio is a
profitability driver and a
measure of how much of each
loan is available to clients.
Average Loan Disbursed
Value of Loan
Disbursed/Number of Loans
Disbursed
Measures the average value of
each loan disbursed. This
ratio is frequently used to
project disbursements.
Source: CGAP
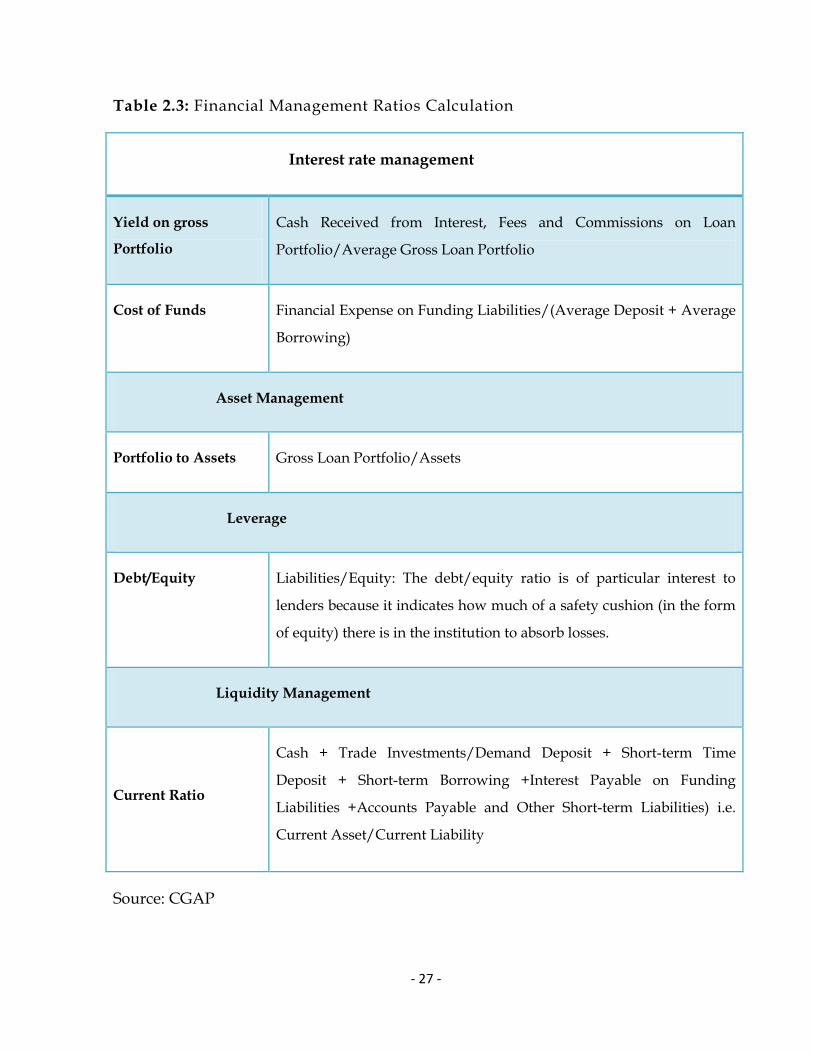
2.1.8.4 Financial Management
Financial management assures that there is enough liquidity to meet an MFI‘s
obligations to disburse loans to its borrowers and to repay loans to its creditors. Even
though financial management is a back /support office function, decisions in this area
can directly affect the bottom line of the institution. Errors in liquidity or foreign
exchange management, for example, can easily compromise an institution with efficient
credit operations and otherwise sound management. The importance of adequate
liquidity, and hence of financial management, grows further if the MFI is mobilizing
savings from depositors. Financial management can also have a decisive impact on
profitability through the skill with which liquid funds are invested. Finally, managing

- 26 -
foreign exchange risk and matching the maturities of assets and liabilities involve
financial management. Both are areas of great potential risk for an MFI and underline
the importance of competent financial management (MicroRate et al, 2003).
Asset/ Liability Management is the ongoing process of planning, monitoring and
controlling the volumes, maturities, rates and yields of assets and liabilities. The basis of
financial intermediation is the ability to manage assets (the use of funds) and liabilities
(the source of funds). Asset/liability management is required on the following levels:
Interest Rate Management: The MFI must make sure that the use of funds
generates more revenue than the cost of funds.
Asset Management: Funds should be used to create assets that produce the most
revenue (are most ―productive‖).
Leverage: The MFI seeks to borrow funds to increase assets and thereby increase
revenue and net profit. The term leverage indicates the degree to which an MFI is
using borrowed funds. At the same time, the MFI must manage the cost and use
of its borrowings so that it generates more revenue than it pays in Interest and
Fee Expense on those borrowings.
Liquidity Management: The MFI must also make sure that it has sufficient funds
available (―liquid‖) to meet any short-term obligations.
Ratios under Asset/Liability Management are:-yield on gross portfolio, portfolio to
assets, cost of funds ratio, debt to equity, liquid ratio and so on (CGAP, 2009).
- 27 -
Table 2.3: Financial Management Ratios Calculation
Interest rate management
Yield on gross
Portfolio
Cash Received from Interest, Fees and Commissions on Loan
Portfolio/Average Gross Loan Portfolio
Cost of Funds Financial Expense on Funding Liabilities/(Average Deposit + Average
Borrowing)
Asset Management
Portfolio to Assets Gross Loan Portfolio/Assets
Leverage
Debt/Equity
Liabilities/Equity: The debt/equity ratio is of particular interest to
lenders because it indicates how much of a safety cushion (in the form
of equity) there is in the institution to absorb losses.
Liquidity Management
Current Ratio
Cash + Trade Investments/Demand Deposit + Short-term Time
Deposit + Short-term Borrowing +Interest Payable on Funding
Liabilities +Accounts Payable and Other Short-term Liabilities) i.e.
Current Asset/Current Liability
Source: CGAP

- 28 -
2.1.8.5 Profitability and Financial Viability/Sustainability
Profitability measures, such as return on equity (ROE) and return on assets (ROA), tend
to summarize performance in all areas of the company. If portfolio quality is poor or
efficiency is low, this will be reflected in profitability. Because they are an aggregate of
so many factors, profitability indicators can be difficult to interpret. The fact that an MFI
has a high ROE says little about why that is so. All performance indicators tend to be of
limited use (in fact, they can be outright misleading) if looked at in isolation and this is
particularly the case for profitability indicators. To understand how an institution
achieves its profits (or losses); the analysis also has to take into account other indicators
that illuminate the operational performance of the institution, such as operational
efficiency and portfolio quality. The profitability analysis is further complicated by the
fact that a significant number of microfinance institutions still receive grants and
subsidized loans. ―Comparing apples with apples‖ is always a problem in microfinance,
because subsidies are still widespread and accounting practices vary widely. ROE and
ROA are some indicators to measure profitability (MicroRate et al, 2003).
Financial viability/sustainability refers to the ability of the MFI to cover its costs with
earned revenue. A financially viable MFI will not rely on donor funding to subsidize its
operation (Letenah, 2009).
Ratios under Sustainability and Profitability are: - ROA, ROE, Operational Self-
Sufficiency (OSS), financial self-sufficiency (FSS) and so on.

- 29 -
Table 2.4: Sustainability and Profitability Ratios Calculation
Ratio Formula Explanation
OSS
Financial Revenue/ (Financial
Expense + Impairment Losses on
Loans + Operating Expense)
Measures how well a MFI can cover its costs
through operating revenues like salaries,
supplies, loan losses, and other administrative
costs.
FSS
Adjusted Financial
Revenue/(Adjusted Financial
Expense + Adjusted Impairment
Losses on Loans + Adjusted
Operating Expense)
Measures how well a MFI can cover its costs
taking into account adjustments to operating
revenues and expenses. i.e., valued at market
prices.
ROA
Net Operating Income –
Taxes/Average Assets
Measures how well the MFI uses its assets to
generate returns. This ratio is net of taxes and
excludes non operating items and donations.
ROE
Net Operating Income –
Taxes/Average Equity
Calculates the rate of return on the average
Equity for the period.
Because the numerator does not include non
operating items or donations and is net of
taxes, the ratio is frequently used as a proxy for
commercial viability.
Source: CGAP
FSS = Operational income / [Operational costs + financial costs + provision for loan
losses + interest subsidy + in-kind subsidy adjustment] (Berne, 2005).
- 30 -
The financial self-sufficiency ratio corresponds to the operational self-sufficiency ratio,
adjusted by the interest subsidy from concessional loans and in-kind subsidies. The
institution has to plan that in the long run, it may have to get all its loans at market rates
and pay all the costs itself, without any external grants. Unless financial self-sufficiency
is reached, the long term provision of financial services is undermined by the continued
necessity to rely on donor funds. Usually, financial self-sufficiency should also cover the
cost of capital: the loss in the real value of equity due to inflation. Nevertheless, on the
other hand, the assets gain value through inflation, and calculating the net cost or profit
from inflation can be complicated (Berne, 2005).
2.1.8.6 Analytical Adjustment
Adjustments are additional, or hidden, costs incurred by the MFI that they need to
recognize for internal management purposes, for example, when calculating and
analyzing efficiency and profitability ratios. They are not to be included in the audited
financial statements; they are internal adjustments. These are:-Subsidies, Inflation and
Portfolio at risk.
A. Subsidies
Subsidized Cost of Funds: - Examines the difference between an MFI‘s financial
expense and the financial expense it would pay if all its funding liabilities were
priced at market rate.
In-kind Subsidy: - The difference between what the MFI is actually paying for a
donated or subsidized good or service and what it would have to pay for the same
good or service on the open market. Common examples of these in-kind subsidies
are computers, consulting services, free office space, and free services of a manager.
B. Inflation
The rationale behind the inflation adjustment is that an MFI should, at a minimum,
preserve the value of its equity (and shareholders investments) against erosion due to

- 31 -
inflation. In addition, this adjustment is important to consider when benchmarking
institutions in different countries and economic environments.
Unlike subsidy adjustment, recording an inflation adjustment is common in many parts
of the world and is mandated by Section 29 of the International Accounting Standards
(IAS) in high inflation economies.
C. Portfolio at Risk
Impairment Loss Allowance: - Intended to bring as MFI‘s Impairment Loss
Allowance in line with the quality of its Gross Loan Portfolio.
Write-off:- Intended to identify loans on an MFI‘s books that by any reasonable
standard should be written-off. This adjustment can significantly reduce the value
of an MFI‘s assets if persistent delinquent loans are not counted as part of the
gross loan portfolio (CGAP, 2009).
2.2 Empirical Review
2.2.1 Empirical Studies in Global Context
Empirical evidences summarized by Letenah, 2009 referring different Studies are
shown as follows:
The Studies conducted by Lafourcade et al, 2005 as follow:-
The outreach and financial performance of Microfinance institutions in Africa shows
that in terms of breadth of outreach; sub-Saharan MFI have a higher number of savers
than other regions of the world. However, in terms of number of borrowers, Africa is
lagging behind South Asia and East Asia and the Pacific. In terms of depth of outreach
measured by the percentage of women borrowers, sub-Saharan Africa has 61% women
borrowers as compared to 86% in south Asia and 80% in Middle East and North Africa
(MENA) and 76% in East Asia and Pacific. Sub-Saharan Africa MFI has the lowest
- 32 -
financial performance of ROA of 2% as compared to 7.6%-10% of Eastern Europe and
Central Asia.
One of the well done studies in the global microfinance industry is the study by
Cull et al (2007). In their study they have used data from 124 MFIs from 49
developing countries. They have not compared the performance of the MFIs with
a benchmark but the result of their studies can be summarized as follow:-
The average Financial Self Sufficiency (FSS) is found to be 1.035 meaning MFIs are
becoming financially self sufficient, OSS is a bit greater 1.165, whereas Adjusted ROA is
negative (-0.027). The adjusted ROA shows that most MFIs have no positive return on
their investment. Depth of outreach indicator like percentage of women borrowers is
found to be 64.9% and GLP to assets of 68.9%.
Hartarska in 2004 has studied Microfinance governance in Central and Eastern
European region and she found that:-
The average ROA is 3.038 indicating profitable MFIs in this region, and OSS of 91.99.
They do have an average number of 7268 borrowers.
2.2.2 Empirical Studies in Ethiopian context
Empirical studies conducted by Kereta, Adeno and Arega are as follows:-
I. The study conducted by Kereta (2007) is simple correlation econometric analysis
technique and descriptive analysis technique were employed in the analysis
process and reveals the following results:-
He studied the industry‘s outreach and financial performance using simple descriptive
analysis using graphs and percentage growth rates. The result of his study showed that
in terms of breadth of outreach, MFIs are serving an increasing number of clients in each
year from 2003-2007. The industry‘s growth rate in terms of number of clients is 22.9%.
In terms of depth of outreach measured by average loan size Ethiopian MFIs have a loan

- 33 -
size which is on average nearer to the standard $150 (Birr 1352). So they can be
considered pro poor. From sustainability angel, the MFIs are operationally sustainable
as measured by ROA and ROE and the industry‘s profit performance is improving
overtime. Dependency ratio as measured by the ratio of donated equity to capital
decline and the ratio of retained earnings to total capital is rising letting the industry to
be financially self sufficient. The study also found that PAR is at 3.2% for the period
from 2005-2007 which is in comfort zone (Kereta, 2007).
II. The study conducted by Adeno (2007) on one of the largest MFIs in Ethiopia
Amhara Credit and Saving Institution (ACSI) was descriptive type of study and
results that:-
By 2005, the institution was operationally and financially self sufficient at 119.9% and
115.3% respectively. The operating cost was as low as five cents in 2005. ACSI also has a
high portfolio quality, as delinquency rates are around 1.9% of >30 days. The average
loan and savings balances, ROA, ROE, Yield on Portfolio and Operating Expense to
Total Expense over the five year were 2,702.00 Birr, 4.5% , 13%., 16.58% and 65.95%
respectively. Moreover; ACSI performed debt to equity ratio and loans to total assets
ratio of 230.88% and 68.73% (Adeno, 2007).
III. The study conducted by Arega (2007) on three (Aggar, Harbu and SFPI) MFIs
which are found in Addis Ababa. The study was exploratory and descriptive
methods and some results revealed by him are:-
The ROA and ROE ratios were for Aggar, was unfavorable (negative) results with the
ROA ratios of -6.66% and -7.11% in 2005 and 2006 fiscal periods and with the ROE ratios
of -9.04% in 2005 and - 13.05% in 2006. The unfavorable ratios were the results of the
huge net loss reported by the firm during the years. SFPI‘s ROA ratios for 2005 and 2006
fiscal periods were 0.60% and 3.01% respectively. It also reported ROE ratios of 1.14%
and 5.68% in 2005 and 2006 fiscal years, respectively. The ROA ratios for Harbu were
0.28% in 2005 and -2.58% in 2006. While the ROE ratios for the same years were 0.97%

- 34 -
and -3.40% respectively. Regarding the productivity ratio for Aggar was 210 for 2006
and 191 in 2005. For SFPI during 2005 was 505 and 515 in 2006. A ratio of active
borrowers per credit officer for Harbu in 2005 was 134 whereas the 2006 result as per the
analysis indicated 283, which reflected a 111.19% increment. The PAR > 30 for Aggar
was 23.05% and 20.67% in 2005 and 2006 respectively. Harbu also reported a portfolio at
risk ratio of 3.67% during 2006 (Arega, 2007).
The above review of literature highlights that all the studies so far conducted are mainly
discussing the problems and prospects of Micro Finance Institutions in general at
Macro-level. The researcher also observed in the review of literature that there are no
specific studies conducted mainly to understand the problems of Micro Finance with
regard to finance and operation at a District level. Hence, the researcher felt it
appropriate to take up the present study entitled ―Evaluation of Financial and
Operating Performance – A case Study of Dedebit Credit and Saving Institution (DECSI)
- Mekelle Branch No 1, Tigray” to state the financial and operating problems.
- 35 -
CHAPTER III DESCRIPITION OF THE STUDY AREA
3.1 A Brief Overview of DECSI 3.1.1 Foundation
According to the research conducted on the socio-economic status in certain sample
Woredas of Tigray Regional State in 1993, the absence of financial institutions which can
provide financial services to the poor was one of the obstacles that hindered the
undertaking of rehabilitation and development activities. The research commissioned by
the Relief Society of Tigray /REST/ revealed the significance of establishing this
institution so that a full pledged financial services can be provided to the poor
households. Hence, Rural Credit Scheme of Tigray, as one development wing of REST,
was established in 1994. This was later called as Dedebit Credit and Saving Institution
/DECSI/.
After 3 years of its operation, Dedebit Credit and Saving Institution /DECSI/ was
reregistered in the form of a Share holding Company as a legal entity in 1997 following
the proclamation of the National Bank of Ethiopia. With such commitment, DECSI has
been working widely in rural and urban Tigray for the last 16 years.
3.1.2 Vision
The vision of DECSI is to see poverty eradicated in Tigray Regional State and the
country as well through the provision of quality of financial services by establishing a
competent, strong, efficient, stable and sustainable financial institution in our continent
3.1.3 Mission
The mission of DECSI is to improve the wellbeing of those individuals operating in the
areas of subsistence agriculture, micro, small and medium enterprises by increasing

- 36 -
their income and wealth through the provision of quality and sustainable microfinance
services.
3.1.4 Objectives
To improve food securities at household level both in the rural and urban areas of
the region.
To create job opportunities to the unemployed parts of the population through
promoting micro, small and medium enterprises in the region.
To stimulate the local economy through offering adequate and efficient financial
services and builds financially sound and sustainable institution.
3.1.5 Target groups
Though clients vary according to the type of product services, the target groups are
identified as:
Community members working to come out of poverty
The poorest of the poor capable of generating income /productive poor/
Owners of micro, small and medium enterprises
3.1.6 Ownership
Dedebit Microfinance /the so called DECSI/ is a share company established in
accordance with the requirements of the National Bank of Ethiopia. The owners (share
holders) are:
The government of Tigray Regional State
The Relief Society of Tigray (REST)
Women‘s Association of Tigray
Farmers‘ Association of Tigray
Youth Association of Tigray
- 37 -
3.1.7 Area Coverage
When the institution commenced operation in 1994; it had branches in 8 woredas of the
region with only 31 employees. Currently it is providing its services through 139
functionally decentralized offices including Addis Ababa and Gonder. It also has 8 main
branch offices and 15 micro finance collateral based branches. The current number of
staff has also reached 2000. Branches in Addis Ababa and Gonder are opened to
commence remittance services from abroad.
In light of this, Mekelle branch No 1 is one of the main branches of the institution among
15 micro finance collateral based branches. Currently, it supervises three sub-branches;
namely: Semen sub branch, Debub sub branch and Tureta sub branch which are found
in Mekelle town.
3.1.8 Types of Services
At this time, DECSI is rendering four types of financial services namely: - Credit (i.e.
regular or general and agricultural input loans), saving (i.e. savings mobilization from
loan clients and the community), Money Transfer, Pension Payment (i.e. services to
retired civil and military personnel), Current account, CPO, Tax collection and Gold
Management (DECSI, 2009).

- 38 -
3.1.9 Organizational Structure of DECSI
General Assembly
Public Relation
General Manager
Operational
department
Planning &business
development department
Management Information System
Legal Service
Audit Service
Human Resource
development department
Finance
Department
Microbank
division
Microcredit
division
Research and
development
General
accounts section Planning and
programming
Treasury
and Budget
Saving
division
Personnel
administration
Training and
development
General
Service
Board of Directors
15 Collateral based main Branches
8 none collateral main Branches
Management
Committee
- 39 -
CHAPTER IV DISCUSION AND ANALYSIS
4. 1 Introduction
To find the major out puts of the study and to suggest important recommendations, the
collected data must be analyzed and discussed. Accordingly, the analysis and important
findings of the study are discussed under this chapter.
This study measures the performance of the branch by consolidating all necessary data
from the sub-branches including the main branch itself. The findings stated below are
extracted and analyzed from the financial statements and operational report of each sub-
branches and main branch.
In this study, the researcher tries to encompass the major performance measurement
indicators used by different scholars in studies of MFIs so far. Moreover, under each
performance measurement indicators, certain ratios which assumed best describe the
performance and fit the data on hand are applied to measure the branch‘s performance.
The performance measurement indicators that are discussed under the study are;
Outreach, Portfolio quality, Efficiency and Productivity, Financial Management as well
as Profitability and Financial Viability or Sustainability.
Since the branch is under the supervision of the main office, some hidden costs which
may need analytical adjustments like, inflation and cost of funds (hidden cost, like
training) have not been recognized by the branch. Therefore, the researcher does not
consider any measurement ratios which need analytical adjustments.
4.2 The Structure of DECSI-Mekelle Branch No 1
DECSI-Mekelle Branch No 1 is one of the collateral based branches among 15 main
branches of DECSI and which encompasses 3 sub-branches; namely Semen sub-branch,
Debub sub-branch and Tureta sub-branch. The branch started it function as main branch
- 40 -
in 2004. However, the sub-branches had been providing their functions before the
Branch established as main branch. Semen and Debub sub-branches provide regular
loan to the business community and for urban package programs. Tureta sub-branch
manages pension funds to the retirements of some organizations that have agreements
with DECSI. In addition, Tureta sub branch provides saving and loan services for civil
servants. The main branch itself also provides basic financial services to the business
community. Moreover, the branch provides loans for housing and cooperatives
societies.
4.3 Performance of DECSI-Mekelle Branch No 1
The branch strongly stresses that, the business approach in its operation is a guiding
principle and the way to ensure institutional sustainability. It clearly predetermined that
in the branch nothing is provided for free. In other words, the branch gives its financial
services on fee basis. Interest is collected on credit provided and pays for savings
deposited in the branch. Fees are charged for other services like local money transfer,
pension administration and sell of passbook. To get credit from the branch, the clients
should require passing through rigorous screenings and evaluations.
According to Adeno (2007), effective and profitable financial service delivery requires
identifying who the potential clients are and differentiating the market base on credit
demand. In the case of the branch, the productive active clients with the demand for
such services are the target clientele. Potential clients are those economically productive
lacking access to conventional banking services. Loan applicants are expected to be
those in need of working capital and able to utilize the loan in productive businesses.
Therefore, the branch provides credit only to income generating activities. No
consumption loan is granted by the branch.
Regarding the loan size, the branch determines and provides the loan that is requested
by clients is decided by considering various requirements. The main requirements are

- 41 -
the type of activities the client engaged in, borrower‘s capacity, credit history,
institutional capacity and regulations of the supervising agency, and the business plan.
The main activities performed by the main branch
1. Business Loan: - due to the requirements, the loan is based on house collateral
and is focusing on individuals who own micro, small and medium enterprises.
The loan period is utmost 3 years. The requirements that the clients should fulfill
are: - business plan, renewed business license, original site plan of a house,
original ownership certificate of collateral and Marriage certificate. As a result,
the loan size is determined based on the value of collateral presented and the
amounts requested by clients. The interest rate charged to these clients is 10% per
annum.
2. Housing Loan: - the branch provides for construction of residential /business/
houses. The requirements that the clients should fulfill are: - the house under
construction should be at least with foundation and beam erected, original plan
and ownership certificate, marriage certificate, for those who earn salaries,
supporting letter from their employer is compulsory. Other clients should avail
financial statement that indicates their capacity to repay the loan. The loan size
for housing construction is not more than 300,000.00 Birr.
3. Money transfer: - it is a service which enables customers to transfer money from
one place to another in a timely, certain and safe manner. It is introduced to
increase the income of rural communities through providing all rounded
financial services.
4. Saving services: - the branch provides saving service to all members of the
community; like clients, non-clients, governmental and non-governmental
organizations regardless of their level of wealth. Massive mobilization of saving
is undertaken as part of the key strategy of the institution to achieve financial self

- 42 -
sufficiency. The service is aimed at boosting the economy through developing the
culture of saving. Saving helps not only to solve immediate problems and expand
income sources but also creates self-confidence and high spirit of the customers.
It increases the chance of getting loans by strengthening collateral. It enables to
follow planned expenditure through raising financial management capacity. Any
saver has the right to withdraw his/her money any time during working hours.
Through this service, it is desired to cover money required for loans out of saving
deposits. The interest paid for saving/deposit/ is 4% per annum.
5. Equipment leasing loan: - such product is given in kind and different loan sizes
depending on the type and quality of the machinery. This kind of loan is given to
cooperative societies. Maximum loan term is 3 years and it is provided with a
guarantee from the regional government (DECSI, 2010).
The main activities performed by the sub branches of the branch
1. Urban package loan: - it is provided to owners of micro and small business
enterprises in towns. It also consists of loan for urban agriculture. It is
implemented in collaboration with the Bureau of Trade and Industry as well as
with the Agency of Micro, Small and Medium Enterprises as guarantees.
Regarding this program, the loan period is ranges from 1 to 3 years and
maximum amount of loan provided is Birr 5,000.
2. Regular Loan: - it is a loan provided to regular clients of branch and it is provided
through group guarantee. The minimum number of group numbers is 3 and the
maximum period of loan is 3 years. The maximum loan amounting Birr 10,000 is
given to clients who brought real and measurable results in their lives (DECSI,
2010). The interest rate charged to these clients is 18% per annum.
3. Civil servant loan: - it is given to civil servants for their different purposes; like, to
cover education fees, for house construction and for purchase of house furniture.

- 43 -
Civil servants should bring a support and letter of guarantee from their employer
which indicates the amount of their salary and other relevant information. The
loan allowed is the maximum of 7 months‘ salary with 15% interest rate per
annum.
4. Pension payments: - the intention of DECSI regarding this service is providing
pensions to pensioners in their vicinity without being exposed to unnecessary
ups and downs and extra expenses. This is implemented by different mode of
operations in collaboration with the Social Security Agency of the region.
Accordingly, the branch implements this service in one of its sub branches to the
pensioners. Hence, payrolls are prepared by the Agency for Pensioners and
payments are made by the sub branch using its payout offices.
5. Saving Services: - this service is provided to all communities as per their choice
and mandatory for borrowers as it mentioned above under main branch‘s
activities.
In general the Interest rate charged to borrowers is a commercial declining interest rate
ranging from 9.9 to 18 percent per annum depending on the type and risk characteristics
of the product. All interests are calculated on remaining balances. The interest is meant
to cover administrative costs, cost of fund, default and inflation (DECSI, 2010).
4.3.1 Outreach/Coverage
The number of client is a sheer indicator for how MFI is reaching the poor. Expanding
the number of clients being served is an ultimate goal of almost all microfinance
interventions. Outreach can be measured in terms of coverage i.e. the number of clients
served and volume of services (total savings on deposit and total outstanding loan
portfolio) and depth i.e. to which extent the institution serves poor households and
which economic sectors as it mentioned in the literature part of the study. However, this
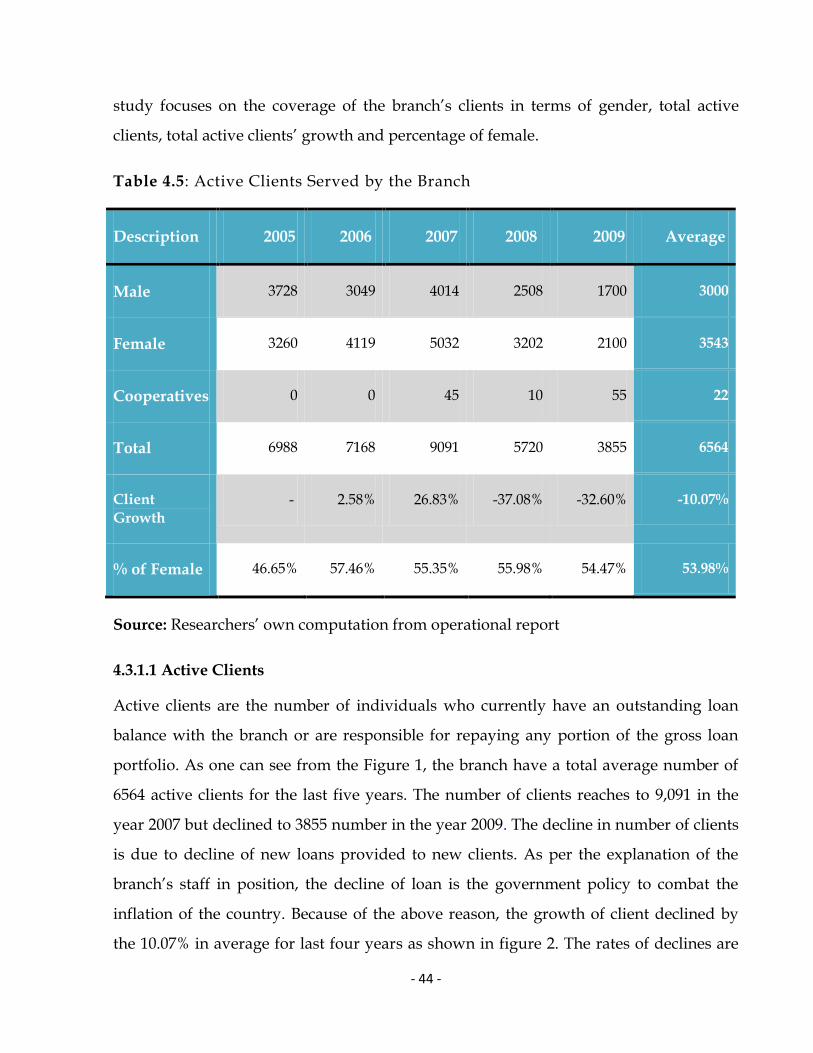
- 44 -
study focuses on the coverage of the branch‘s clients in terms of gender, total active
clients, total active clients‘ growth and percentage of female.
Table 4.5: Active Clients Served by the Branch
Description 2005 2006 2007 2008 2009 Average
Male 3728 3049 4014 2508 1700 3000
Female 3260 4119 5032 3202 2100 3543
Cooperatives 0 0 45 10 55 22
Total 6988 7168 9091 5720 3855 6564
Client
Growth - 2.58% 26.83% -37.08% -32.60% -10.07%
% of Female 46.65% 57.46% 55.35% 55.98% 54.47% 53.98%
Source: Researchers‘ own computation from operational report
4.3.1.1 Active Clients
Active clients are the number of individuals who currently have an outstanding loan
balance with the branch or are responsible for repaying any portion of the gross loan
portfolio. As one can see from the Figure 1, the branch have a total average number of
6564 active clients for the last five years. The number of clients reaches to 9,091 in the
year 2007 but declined to 3855 number in the year 2009. The decline in number of clients
is due to decline of new loans provided to new clients. As per the explanation of the
branch‘s staff in position, the decline of loan is the government policy to combat the
inflation of the country. Because of the above reason, the growth of client declined by
the 10.07% in average for last four years as shown in figure 2. The rates of declines are
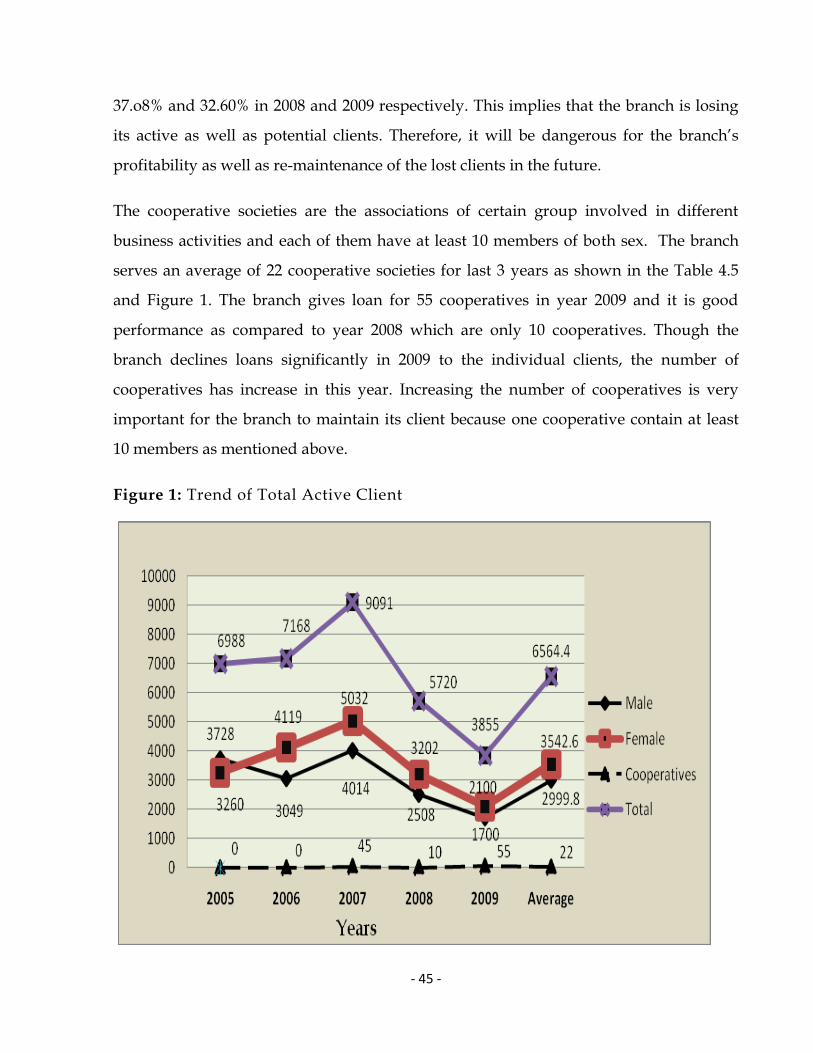
- 45 -
37.o8% and 32.60% in 2008 and 2009 respectively. This implies that the branch is losing
its active as well as potential clients. Therefore, it will be dangerous for the branch‘s
profitability as well as re-maintenance of the lost clients in the future.
The cooperative societies are the associations of certain group involved in different
business activities and each of them have at least 10 members of both sex. The branch
serves an average of 22 cooperative societies for last 3 years as shown in the Table 4.5
and Figure 1. The branch gives loan for 55 cooperatives in year 2009 and it is good
performance as compared to year 2008 which are only 10 cooperatives. Though the
branch declines loans significantly in 2009 to the individual clients, the number of
cooperatives has increase in this year. Increasing the number of cooperatives is very
important for the branch to maintain its client because one cooperative contain at least
10 members as mentioned above.
Figure 1: Trend of Total Active Client
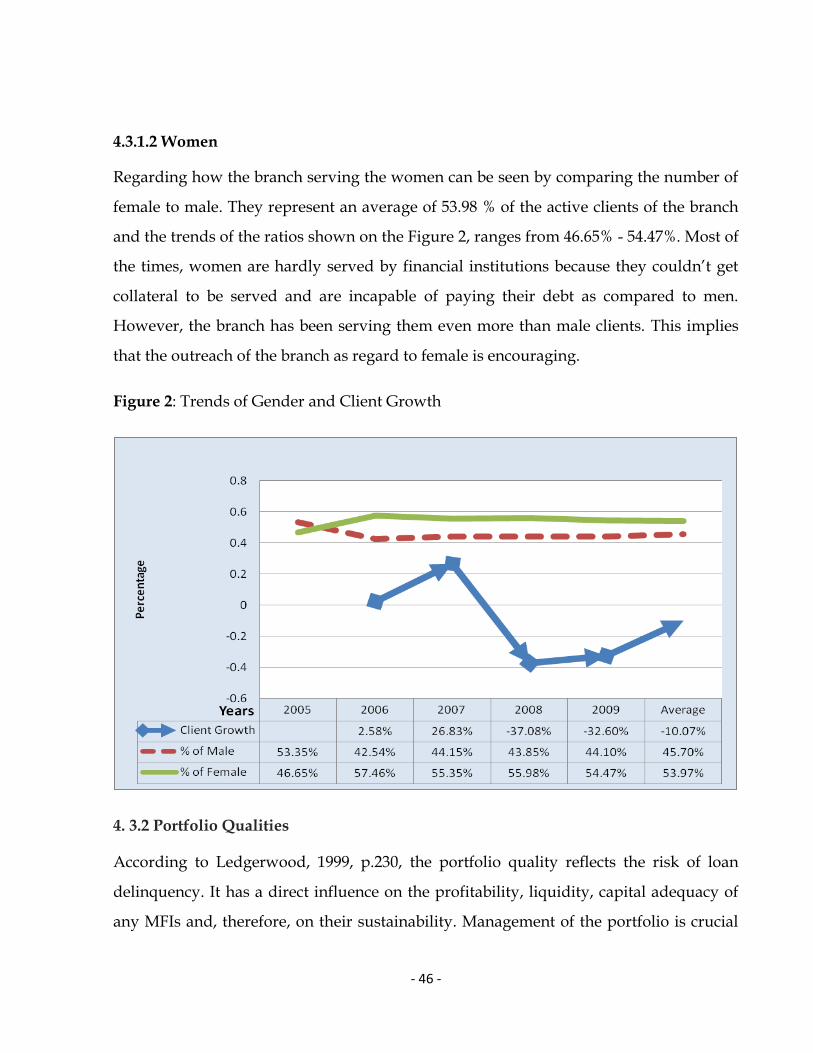
- 46 -
4.3.1.2 Women
Regarding how the branch serving the women can be seen by comparing the number of
female to male. They represent an average of 53.98 % of the active clients of the branch
and the trends of the ratios shown on the Figure 2, ranges from 46.65% - 54.47%. Most of
the times, women are hardly served by financial institutions because they couldn‘t get
collateral to be served and are incapable of paying their debt as compared to men.
However, the branch has been serving them even more than male clients. This implies
that the outreach of the branch as regard to female is encouraging.
Figure 2: Trends of Gender and Client Growth
4. 3.2 Portfolio Qualities
According to Ledgerwood, 1999, p.230, the portfolio quality reflects the risk of loan
delinquency. It has a direct influence on the profitability, liquidity, capital adequacy of
any MFIs and, therefore, on their sustainability. Management of the portfolio is crucial

- 47 -
one for the viability of the loan provision and for the security of clients‘ savings. If the
quality of the portfolio is poor, the MFI cannot continue to operate in the long run.
4.3.2.1 Arrears rate
Since the branch requires collateral to provide a loan, it has no write-off policy to any
arrears. However, the branch convert the arrears to bad debt expense account totally the
portfolios at arrears with the past due date of 365 and above.
As it described by Ledgerwood, 1999, p.207, arrears are loan amounts overdue from the
originally set repayment time and date. In other terms it is the amount that has become
due and has not been received. The arrears rate provides an indication of the risk that a
loan will not be repaid. The arrears rate shows how of the loan has become due and has
not been received. However, the arrears rate understates the risk to the portfolio and
understates the potential severity of a delinquency problem, because it only considers
payments as they become past due, not the entire amount of the loan outstanding that is
actually at risk. Because of the above reason, the researcher does not consider this ratio
in this study.
4.3.2.2 Repayment Rate
It measures loan repayments collected compared to the total expected outstanding over
a given period of time. Therefore, it is important in cash flow projections and
monitoring loan repayments.
As it described by Dan (2004) repayment ratio is calculated as the amount paid (minus
any prepayments) divided by the sum of the amounts due plus the amounts past due.
This ratio has fallen out of favor among microfinance practitioners because it hides a
looming arrears problem. Often prepayments are not subtracted, so the good works of
preparers‘ cover up late payments of those in arrears. The industry standard in world is
95 percent.
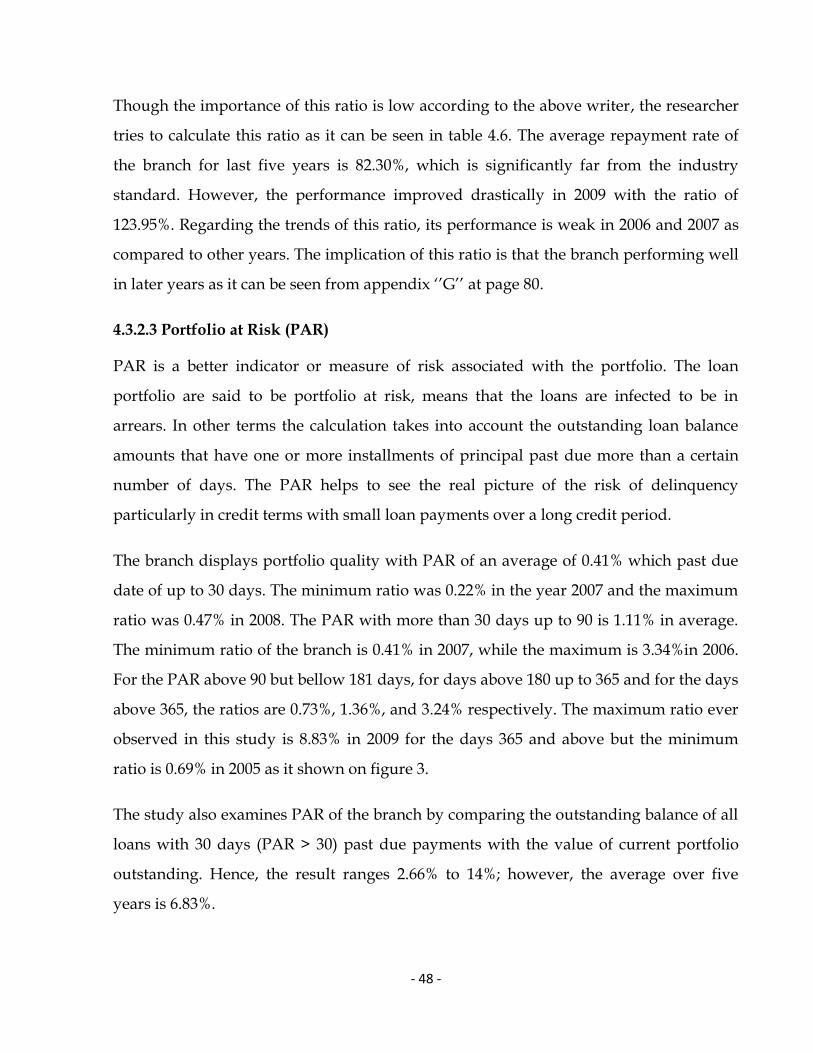
- 48 -
Though the importance of this ratio is low according to the above writer, the researcher
tries to calculate this ratio as it can be seen in table 4.6. The average repayment rate of
the branch for last five years is 82.30%, which is significantly far from the industry
standard. However, the performance improved drastically in 2009 with the ratio of
123.95%. Regarding the trends of this ratio, its performance is weak in 2006 and 2007 as
compared to other years. The implication of this ratio is that the branch performing well
in later years as it can be seen from appendix ‗‘G‘‘ at page 80.
4.3.2.3 Portfolio at Risk (PAR)
PAR is a better indicator or measure of risk associated with the portfolio. The loan
portfolio are said to be portfolio at risk, means that the loans are infected to be in
arrears. In other terms the calculation takes into account the outstanding loan balance
amounts that have one or more installments of principal past due more than a certain
number of days. The PAR helps to see the real picture of the risk of delinquency
particularly in credit terms with small loan payments over a long credit period.
The branch displays portfolio quality with PAR of an average of 0.41% which past due
date of up to 30 days. The minimum ratio was 0.22% in the year 2007 and the maximum
ratio was 0.47% in 2008. The PAR with more than 30 days up to 90 is 1.11% in average.
The minimum ratio of the branch is 0.41% in 2007, while the maximum is 3.34%in 2006.
For the PAR above 90 but bellow 181 days, for days above 180 up to 365 and for the days
above 365, the ratios are 0.73%, 1.36%, and 3.24% respectively. The maximum ratio ever
observed in this study is 8.83% in 2009 for the days 365 and above but the minimum
ratio is 0.69% in 2005 as it shown on figure 3.
The study also examines PAR of the branch by comparing the outstanding balance of all
loans with 30 days (PAR > 30) past due payments with the value of current portfolio
outstanding. Hence, the result ranges 2.66% to 14%; however, the average over five
years is 6.83%.

- 49 -
Figure 3: Average portfolio at Risk
Concerning to this measurement indicator; the lower the ratio, the better the
performance the branch achieves. In general, the trend of this ratio shows that the
branch performs well in 2007 for all PARs except for days more than 365 (2.17%). Table
4.6 describes PAR for all years and different days‘ intervals. From the trend we can learn
that, at the time of good achievement in performance especially in terms of number of
clients, the quality of portfolio increases. As the loan provision declines by the branch,
the clients motives towards a work also declines, as a result they could unable to pay
their loans back to the branch. As per the responses of the officials of the branch, the
branch starts to take legal action for the amount not paid back after the first notice to the
clients as far as they are collateralized.
- 50 -
Table 4.6: Trends of Portfolio at Risk Ratio
Particulars 2005 2006 2007 2008 2009 Average
1-30 days 0.46% 0.44% 0.22% 0.47% 0.46% 0.41%
31-90 days 0.51% 3.34% 0.41% 0.82% 0.47% 1.11%
91-180 days 0.77% 0.52% 0.50% 1.11% 0.73% 0.73%
181-365 days 0.66% 1.16% 0.50% 1.90% 2.56% 1.36%
>365 days 0.69% 1.28% 2.17% 3.24% 8.83% 3.24%
>30 days 2.66% 6.44% 3.68% 7.37% 14.00% 6.83%
Repayment Rate 82.68% 59.07% 56.13% 90.82% 123.95% 80.30%
Write-off ratio 0.99% 2.16% 2.78% 4.04% 10.02% 4.84%
Source: Researchers‘ own computation from operational report
4.3.2.4 Write -Off Ratio
According to MicroRate, 2003, the Write-Off Ratio is calculated by dividing total write-
offs for the period by the period‘s average gross portfolio. It simply represents the loans
that the institution has removed from its books because of a substantial doubt that they
will be recovered. The writing off of a loan is an accounting transaction to prevent assets
from being unrealistically inflated by loans that may not be recovered. The writing off of
a loan affects the gross loan portfolio and loan loss reserves equally. So unless provision
reserves are inadequate, the transaction will not affect total assets, net loan portfolio,
expenses or net income. Write-offs have no bearing whatsoever on collection efforts or
on the client‘s obligation to repay.
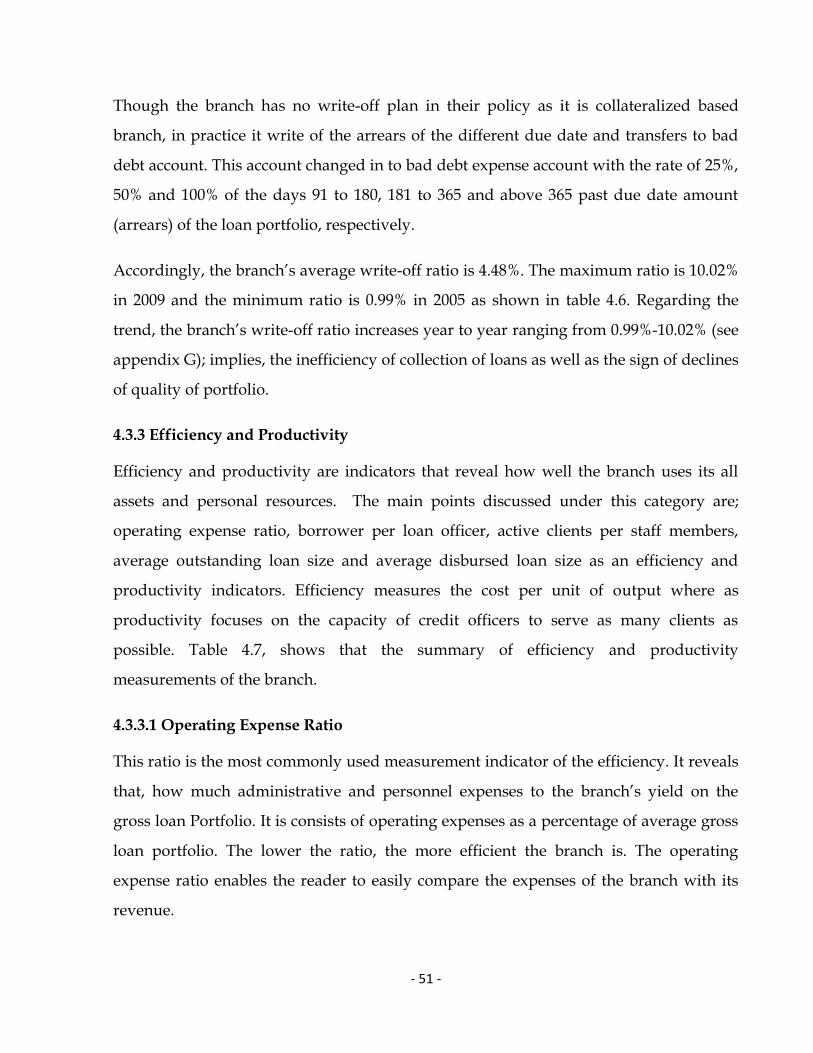
- 51 -
Though the branch has no write-off plan in their policy as it is collateralized based
branch, in practice it write of the arrears of the different due date and transfers to bad
debt account. This account changed in to bad debt expense account with the rate of 25%,
50% and 100% of the days 91 to 180, 181 to 365 and above 365 past due date amount
(arrears) of the loan portfolio, respectively.
Accordingly, the branch‘s average write-off ratio is 4.48%. The maximum ratio is 10.02%
in 2009 and the minimum ratio is 0.99% in 2005 as shown in table 4.6. Regarding the
trend, the branch‘s write-off ratio increases year to year ranging from 0.99%-10.02% (see
appendix G); implies, the inefficiency of collection of loans as well as the sign of declines
of quality of portfolio.
4.3.3 Efficiency and Productivity
Efficiency and productivity are indicators that reveal how well the branch uses its all
assets and personal resources. The main points discussed under this category are;
operating expense ratio, borrower per loan officer, active clients per staff members,
average outstanding loan size and average disbursed loan size as an efficiency and
productivity indicators. Efficiency measures the cost per unit of output where as
productivity focuses on the capacity of credit officers to serve as many clients as
possible. Table 4.7, shows that the summary of efficiency and productivity
measurements of the branch.
4.3.3.1 Operating Expense Ratio
This ratio is the most commonly used measurement indicator of the efficiency. It reveals
that, how much administrative and personnel expenses to the branch‘s yield on the
gross loan Portfolio. It is consists of operating expenses as a percentage of average gross
loan portfolio. The lower the ratio, the more efficient the branch is. The operating
expense ratio enables the reader to easily compare the expenses of the branch with its
revenue.

- 52 -
Table 4.7: Trends of the Efficiency and Productivity Measurements
Particulars 2005 2006 2007 2008 2009 Average
Operating Expense Ratio 3.11% 3.46% 3.00% 3.26% 7.30% 4.03%
Borrowers per Loan Officer 874 796 1010 520 275 696
Active Clients per Staff Member 159 153 165 99 55 126
Average Outstanding Loan Size 2,157.26 3,705.33 6,145.72 6,237.41 6,470.68 4,943.28
Average Loan Disbursed size 2,736.16 4,525.10 4,854.87 5,305.08 4,966.92 4,477.62
Source: Researchers‘ own computation from operational report
As it illustrated in figure 4, the average expense ratio for the last five years is 4.03%. That
means the operating cost is as low as 0.0403 Birr (4 cent) for 1 Birr portfolio. The trend of
this ratio ranges from 3.00% to 3.46% in the periods of 2005 to 2008 which all are below
the average. However, in the recent year (i.e. 2009), this ratio rises drastically to 7.30%.
This indicates that the branch‘s efficiency is very poor in 2009 as compared to the rest
four years.
The branch‘s operative expense increases more than double in this year and on contrary
gross loan portfolio decreases in certain amount. The main operative expenses that the
branch incurs in this year are the bad debt account amounts that has past due date. If the
branch won‘t collect the amount of those bad debt account time and again till declined
to insignificant amount, it deteriorates the profit of the branch and it may unable to
manage later if accumulated to large amount.
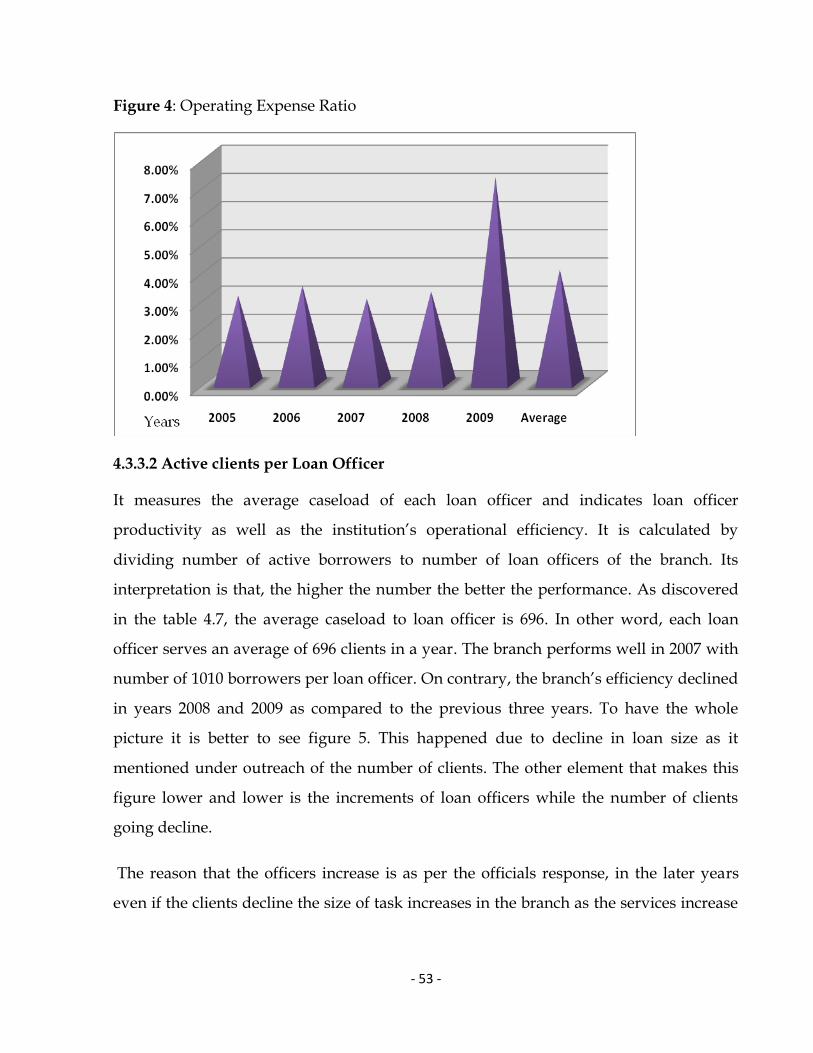
- 53 -
Figure 4: Operating Expense Ratio
4.3.3.2 Active clients per Loan Officer
It measures the average caseload of each loan officer and indicates loan officer
productivity as well as the institution‘s operational efficiency. It is calculated by
dividing number of active borrowers to number of loan officers of the branch. Its
interpretation is that, the higher the number the better the performance. As discovered
in the table 4.7, the average caseload to loan officer is 696. In other word, each loan
officer serves an average of 696 clients in a year. The branch performs well in 2007 with
number of 1010 borrowers per loan officer. On contrary, the branch‘s efficiency declined
in years 2008 and 2009 as compared to the previous three years. To have the whole
picture it is better to see figure 5. This happened due to decline in loan size as it
mentioned under outreach of the number of clients. The other element that makes this
figure lower and lower is the increments of loan officers while the number of clients
going decline.
The reason that the officers increase is as per the officials response, in the later years
even if the clients decline the size of task increases in the branch as the services increase

- 54 -
as years goes increase. The loan which had been taken at early years has been collected
in later years. Collection of loan takes more time than providing the loan.
Figure 5: Trends of Borrowers per Loan Officer and Active Clients per Staff
4.3.3.3 Active Clients per Staff Member
This measures the personnel productivity; i.e. the overall productivity of the branch‘s
total human resources in managing clients who have an outstanding loan balance and
are thereby contributing to the financial revenue of the branch. It is calculated by
dividing the number of active clients to the total number of staffs of the branch. The
average number in this measurement is 126 as shown in the Table 4.7. The highest
number is 165 in 2007 and the lowest number is 55 in 2009. The productivity of the
branch is better for earlier three years and declined for the later two years as it can be
seen from the trend of the ratios illustrated on the Figure 5. Meaning of this ratio is just
like the active clients per staff member ratio, the higher the ratio of the borrowers per

- 55 -
staff member, the more productive the branch is. Here, still the branch‘s staff number
increases while clients decline. If the trends go like that in the future, the branch‘s
personnel productivity will be under a question. However; the convincing idea here is
the lending takes less time than collecting the loan as the branch provides loan at early
years.
4.3.3.4 Average Outstanding Loan Size (AOLS)
It indicates the average outstanding loan balance per client. As it mentioned in the
literature part of the study, this ratio is a profitability driver and measures how much of
each loan is available to clients. The average ratio for the branch is 4943.28 for last five
years. The trend of this ratio increases year by year through all years. It is 2157.26 in year
2005 and it grows to 6470.68 in 2009. For the latter three years, the ratios become high as
compared to the former two years as it is displayed in the figure 6 and table 4.7.
Therefore, this indicates that the branch‘s performance is better for the last three years as
compared to the first two years. However, this ratio does not guarantee for profitability
when a number of clients go declining.
4.3.3.5 Average Loan Disbursed
This ratio measures the average value of each loan disbursed to the clients. The five
years average ratio is 4477.62. The ratios are almost doubled for last four years as
compared to the year 2005 which is 2736.16. Figure 6, demonstrates the trend of the
average loan disbursed for the last five years in the branch. This measurement helps the
branch to predict the future average disbursements to the client. Since the branch
provides loan to different categories of the clients with various loan size ranging from
seven months‘ salary of the employee to more than five million Birr to business
individuals; it is difficult to say exactly the performance of the branch is good but in
general, by observing the figure one can say the branch‘s performance is progressive in
first two years and almost constant in last three years. The higher the amount of the
ratio, the better the performance of the branch is as compared to the rest of the years.
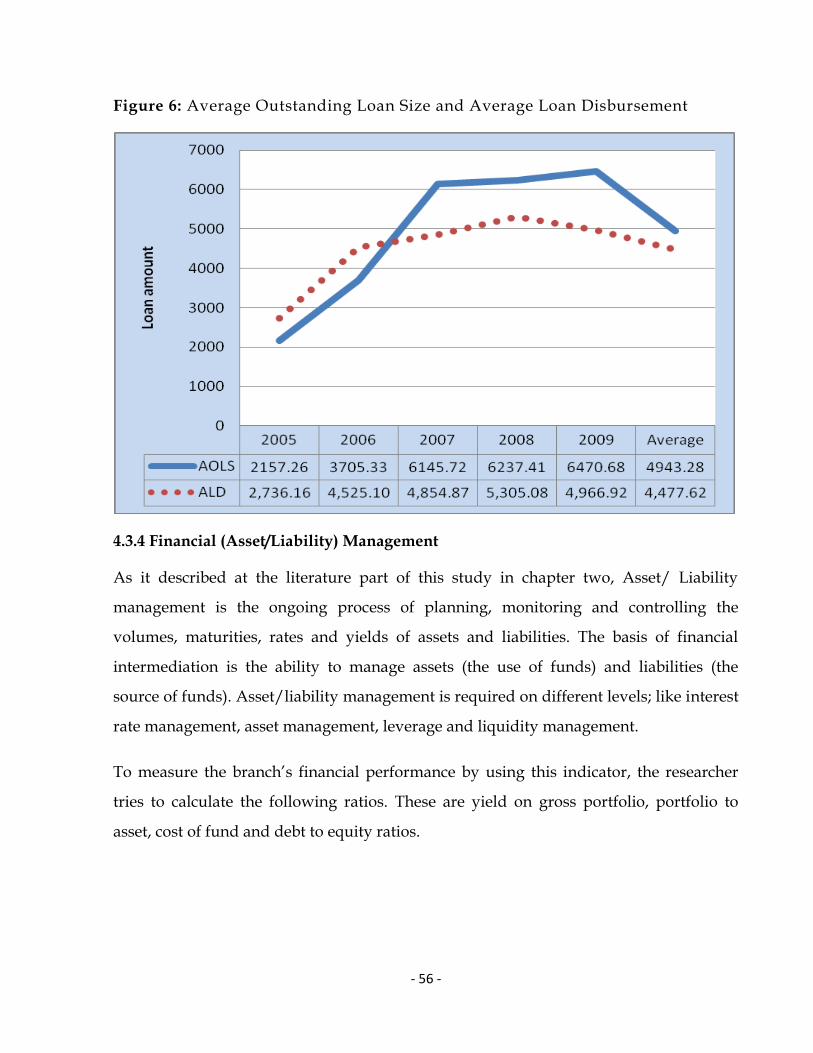
- 56 -
Figure 6: Average Outstanding Loan Size and Average Loan Disbursement
4.3.4 Financial (Asset/Liability) Management
As it described at the literature part of this study in chapter two, Asset/ Liability
management is the ongoing process of planning, monitoring and controlling the
volumes, maturities, rates and yields of assets and liabilities. The basis of financial
intermediation is the ability to manage assets (the use of funds) and liabilities (the
source of funds). Asset/liability management is required on different levels; like interest
rate management, asset management, leverage and liquidity management.
To measure the branch‘s financial performance by using this indicator, the researcher
tries to calculate the following ratios. These are yield on gross portfolio, portfolio to
asset, cost of fund and debt to equity ratios.

- 57 -
4.3.4.1 Yields on Gross Portfolio
Portfolio Yield is calculated by dividing total cash financial revenue by the period
average gross portfolio. It measures the gross loan portfolio‘s ability to generate cash
financial revenue from interest, fees and commissions. It does not include any revenues
that have been accrued but not paid in cash or any non-cash revenues in the form of
post-dated checks, seized but unsold collateral.
Table 4.8: Financial Management Ratios
Particulars 2005 2006 2007 2008 2009 Average
Yield on Gross Portfolio 10.90% 8.75% 5.78% 8.18% 10.48% 8.82%
Portfolio to Asset 77.29% 87.48% 81.15% 82.76% 82.52% 82.24%
Cost of Fund 2.29% 2.31% 3.00% 2.41% 2.77% 2.56%
Debt to Equity 32.13% 26.06% 15.88% 21.87% 33.45% 25.88%
Current Ratio 4.09 4.83 7.29 5.56 3.98 5.15
Source: Researchers‘ own computation from financial statement
Portfolio yield is the initial indicator of an institution‘s ability to generate revenue with
which to cover its financial and operating expenses. So, it is an easy way for the branch
to calculate the actual rate obtained and really received in interest payments on its loans.
As per the figure 7 and table 4.8, the ratio (5.78%) in the year 2007 is the least value for
the last five years; whereas, the ratios recorded in 2005 and 2009 with percentage of
10.90 and 10.48 respectively are the highest and considered as better achievements as
compared to other years. However, as it compared to the lending interest rate of the
institution (9.9-18%), the average yield on portfolio ratio (8.82%) shows less

- 58 -
achievement. From the result it is possible to say the branch lends some loans to the
lower rate and certain amount of the loans is not collected (average repayment rate
80.30%). Because of the reasons, the branch couldn‘t achieve the intended yields. As it is
designed to cover administrative costs, cost of fund, default and inflation, the branch
should attain at least the minimum rate that is 9.9%. The implication of fewer rates than
the intended rate is indication of inefficiency of the branch towards the portfolio yield
and it is the risk to the branch.
4.3.4.2 Cost of Fund
The Cost of Funds Ratio is calculated by dividing interest and fee expenses on funding
liabilities by period average funding liabilities (average deposits) of the branch. It
measures the average cost of deposits (all savings) in the branch. The cost of funds ratio
shows whether the branch has gained access to low cost funding sources such as savings
or not. However, this advantage can offset to some extent by the higher administrative
cost of mobilizing savings.
Regarding this ratio, the lower value shows the better performance of the branch. As
result, the branch performs well in 2005 as compared to other years. The trend of the
ratio reveals variability through last five years, having the value of 2.29%, 2.31%, 3%,
2.41%, and 2.77% ratios in the years 2005, 2006, 2007, 2008 and 2009, respectively. Even
though the variability of ratios, it looks like constant and stable. The average ratio is
2.56% for all five years as illustrated on Figure 7. The interest paid for saving/deposit/
is 4%; so when as compared to this value, the cost of fund indicates the better
performance. The possible reason here is, the branch minimizes it cost of fund by
relending its fund including profits attained at every time. The better achievement of
this performance is important to the branch to balance the yield to portfolio rates that
not enabled to achieve.

- 59 -
4.3.4.3 Portfolios to Assets
This ratio measures the productivity of asset. It is calculated by dividing gross loan
portfolio to assets. It highlights how efficiently the branch structured. Loans are
generally the most productive account on the balance sheet because they generate a high
rate of financial income. The branch has to use funds to create assets that produce the
most revenue. Therefore, maintaining a high percentage of assets in the loan portfolio is
crucial to be productive and profitable.
Figure 7: Yield on Portfolio and Cost of Fund
On response of this, the branch scores 87.48% (the highest ratio) in 2006 and 77.29% (the
lowest ratio) in 2005. The average ratio for last five years of the branch is 82.24% and
which almost nearly equal to the last two years ratios as shown on figure 8. This means
that the branch‘s asset in average of 17.76% (100%-82.24%) has been deployed on other
than the loan portfolio.
In general, the meaning of the high value of the ratio is more important if and only if the
branch does not utilize its assets to some other businesses activities which generate
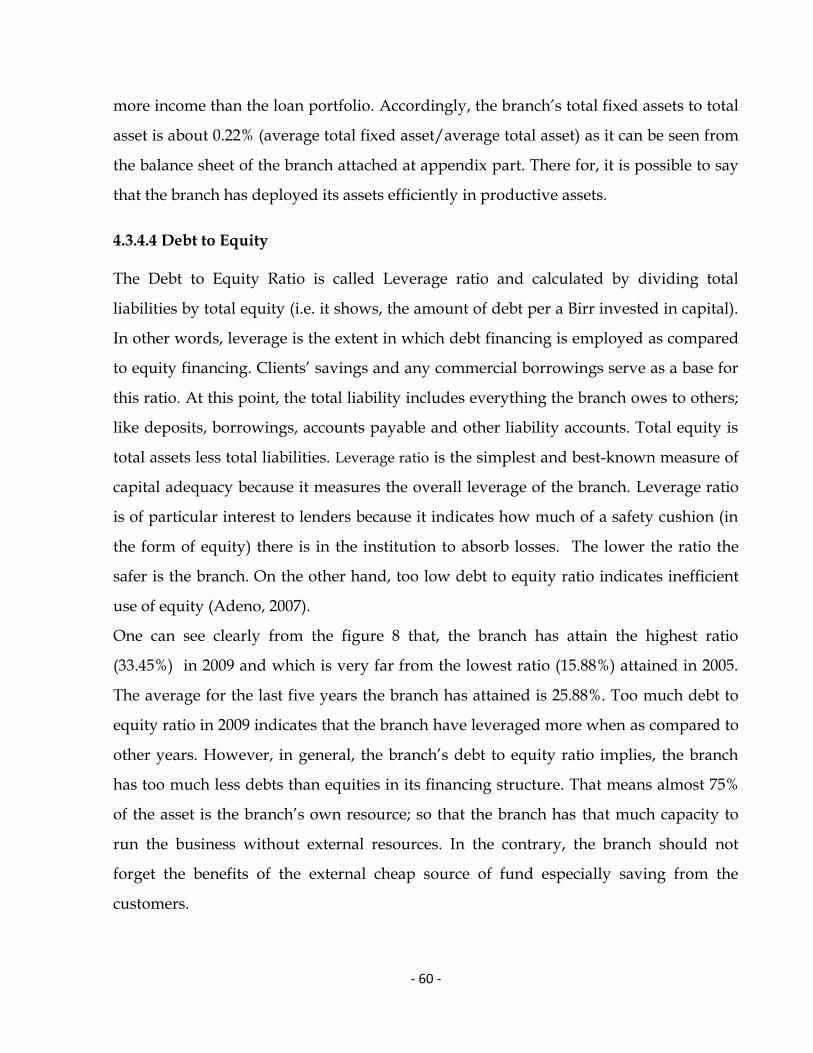
- 60 -
more income than the loan portfolio. Accordingly, the branch‘s total fixed assets to total
asset is about 0.22% (average total fixed asset/average total asset) as it can be seen from
the balance sheet of the branch attached at appendix part. There for, it is possible to say
that the branch has deployed its assets efficiently in productive assets.
4.3.4.4 Debt to Equity
The Debt to Equity Ratio is called Leverage ratio and calculated by dividing total
liabilities by total equity (i.e. it shows, the amount of debt per a Birr invested in capital).
In other words, leverage is the extent in which debt financing is employed as compared
to equity financing. Clients‘ savings and any commercial borrowings serve as a base for
this ratio. At this point, the total liability includes everything the branch owes to others;
like deposits, borrowings, accounts payable and other liability accounts. Total equity is
total assets less total liabilities. Leverage ratio is the simplest and best-known measure of
capital adequacy because it measures the overall leverage of the branch. Leverage ratio
is of particular interest to lenders because it indicates how much of a safety cushion (in
the form of equity) there is in the institution to absorb losses. The lower the ratio the
safer is the branch. On the other hand, too low debt to equity ratio indicates inefficient
use of equity (Adeno, 2007).
One can see clearly from the figure 8 that, the branch has attain the highest ratio
(33.45%) in 2009 and which is very far from the lowest ratio (15.88%) attained in 2005.
The average for the last five years the branch has attained is 25.88%. Too much debt to
equity ratio in 2009 indicates that the branch have leveraged more when as compared to
other years. However, in general, the branch‘s debt to equity ratio implies, the branch
has too much less debts than equities in its financing structure. That means almost 75%
of the asset is the branch‘s own resource; so that the branch has that much capacity to
run the business without external resources. In the contrary, the branch should not
forget the benefits of the external cheap source of fund especially saving from the
customers.

- 61 -
Figure 8: Portfolio to Asset and Debt to Equity
4.3.4.5 Current Ratio
Current ratio compares the current assets with the current liabilities. It is also known as
‗working capital ratio‘ or ‗solvency ratio‘. As it is known in financial management,
current ratio is categorized under liquidity ratio. Liquidity ratio refers the ability of
firms to meet their short-term obligations. The ratios which indicate the liquidity of
companies are Current ratio, Quick/Acid-Test ratio, and Cash ratio.
In this study, the researcher considers only current ratio as one of the financial
management indicator because it is commonly used by commercial financial
institutions. This ratio measures the liquidity of the current assets and the ability of the
branch to meet its short-term debt obligation. Thus, it compares assets, which became
liquid within approximately twelve months with liabilities of the same period. The
higher this ratio means, the greater the short-term solvency of the branch. Conversely,
too high current ratio is the indication of the poor management of current asset since it
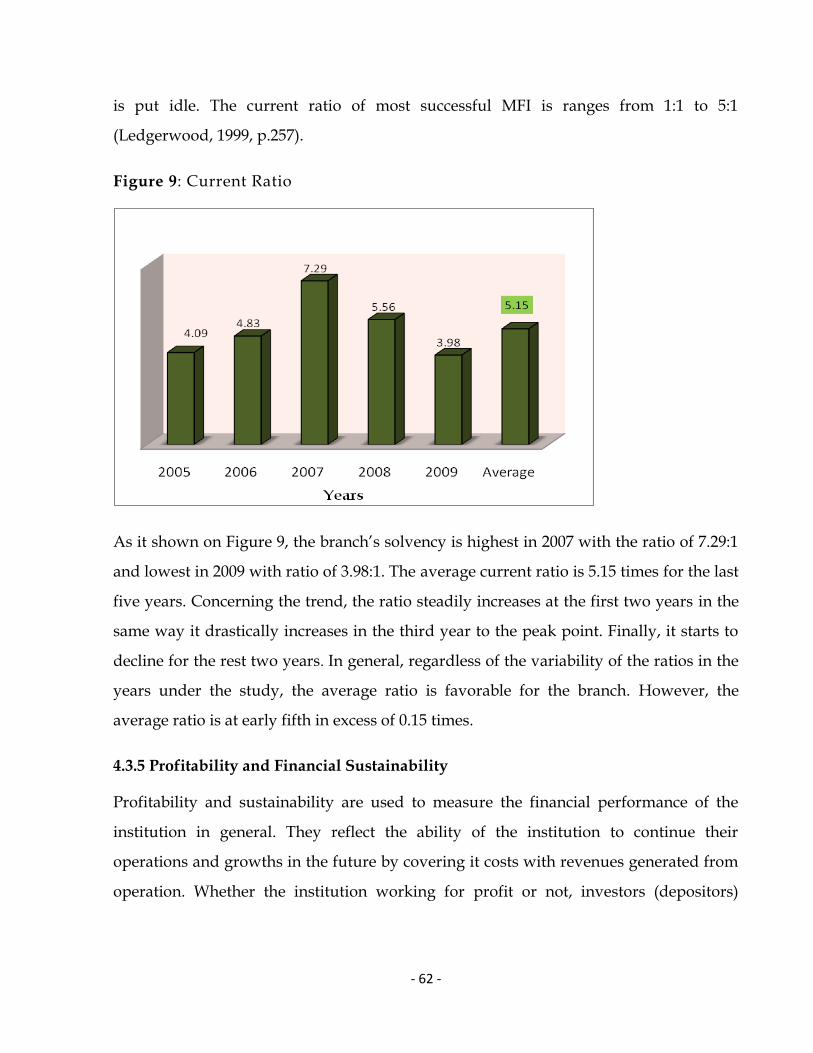
- 62 -
is put idle. The current ratio of most successful MFI is ranges from 1:1 to 5:1
(Ledgerwood, 1999, p.257).
Figure 9: Current Ratio
As it shown on Figure 9, the branch‘s solvency is highest in 2007 with the ratio of 7.29:1
and lowest in 2009 with ratio of 3.98:1. The average current ratio is 5.15 times for the last
five years. Concerning the trend, the ratio steadily increases at the first two years in the
same way it drastically increases in the third year to the peak point. Finally, it starts to
decline for the rest two years. In general, regardless of the variability of the ratios in the
years under the study, the average ratio is favorable for the branch. However, the
average ratio is at early fifth in excess of 0.15 times.
4.3.5 Profitability and Financial Sustainability
Profitability and sustainability are used to measure the financial performance of the
institution in general. They reflect the ability of the institution to continue their
operations and growths in the future by covering it costs with revenues generated from
operation. Whether the institution working for profit or not, investors (depositors)
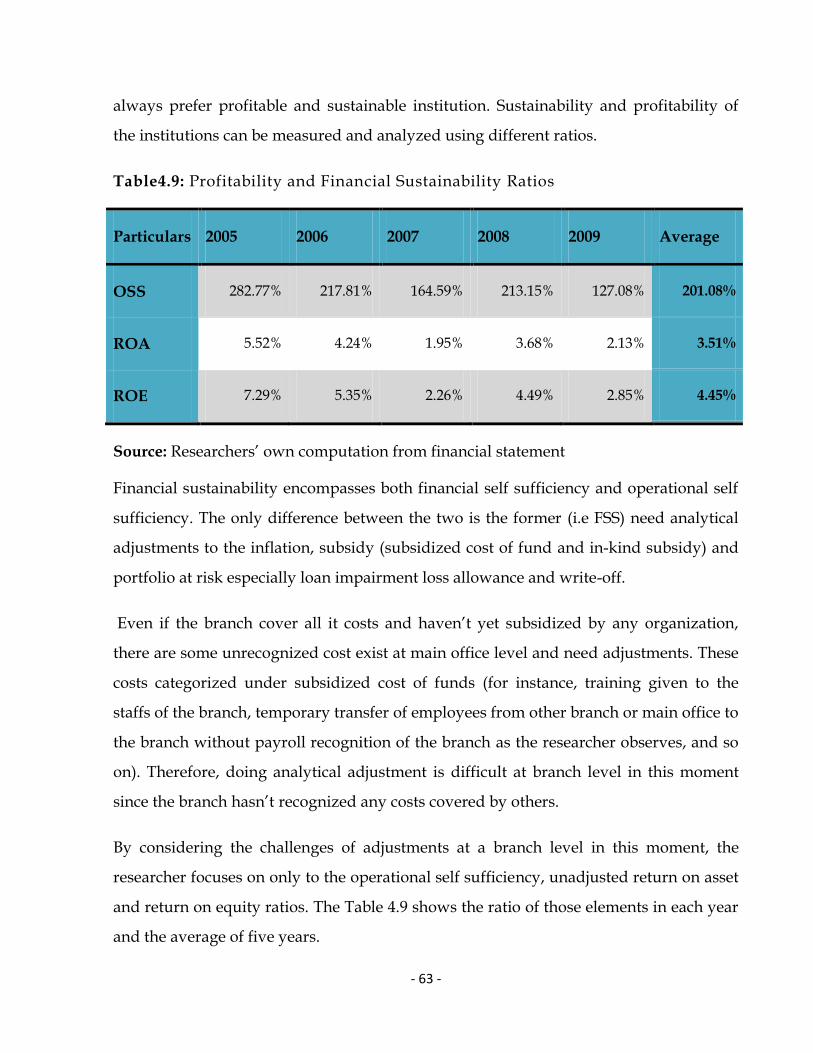
- 63 -
always prefer profitable and sustainable institution. Sustainability and profitability of
the institutions can be measured and analyzed using different ratios.
Table4.9: Profitability and Financial Sustainability Ratios
Particulars 2005 2006 2007 2008 2009 Average
OSS 282.77% 217.81% 164.59% 213.15% 127.08% 201.08%
ROA 5.52% 4.24% 1.95% 3.68% 2.13% 3.51%
ROE 7.29% 5.35% 2.26% 4.49% 2.85% 4.45%
Source: Researchers‘ own computation from financial statement
Financial sustainability encompasses both financial self sufficiency and operational self
sufficiency. The only difference between the two is the former (i.e FSS) need analytical
adjustments to the inflation, subsidy (subsidized cost of fund and in-kind subsidy) and
portfolio at risk especially loan impairment loss allowance and write-off.
Even if the branch cover all it costs and haven‘t yet subsidized by any organization,
there are some unrecognized cost exist at main office level and need adjustments. These
costs categorized under subsidized cost of funds (for instance, training given to the
staffs of the branch, temporary transfer of employees from other branch or main office to
the branch without payroll recognition of the branch as the researcher observes, and so
on). Therefore, doing analytical adjustment is difficult at branch level in this moment
since the branch hasn‘t recognized any costs covered by others.
By considering the challenges of adjustments at a branch level in this moment, the
researcher focuses on only to the operational self sufficiency, unadjusted return on asset
and return on equity ratios. The Table 4.9 shows the ratio of those elements in each year
and the average of five years.
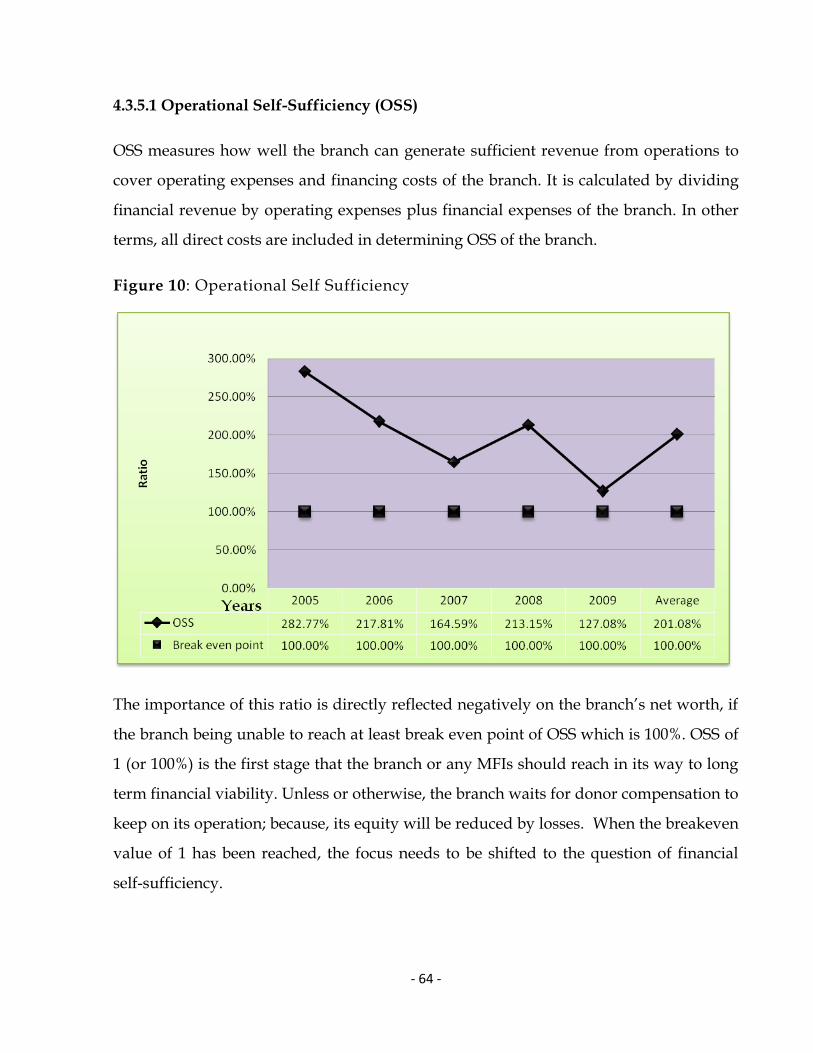
- 64 -
4.3.5.1 Operational Self-Sufficiency (OSS)
OSS measures how well the branch can generate sufficient revenue from operations to
cover operating expenses and financing costs of the branch. It is calculated by dividing
financial revenue by operating expenses plus financial expenses of the branch. In other
terms, all direct costs are included in determining OSS of the branch.
Figure 10: Operational Self Sufficiency
The importance of this ratio is directly reflected negatively on the branch‘s net worth, if
the branch being unable to reach at least break even point of OSS which is 100%. OSS of
1 (or 100%) is the first stage that the branch or any MFIs should reach in its way to long
term financial viability. Unless or otherwise, the branch waits for donor compensation to
keep on its operation; because, its equity will be reduced by losses. When the breakeven
value of 1 has been reached, the focus needs to be shifted to the question of financial
self-sufficiency.

- 65 -
Eventually, when one comes to the outcome of this measurement, the branch achieves
OSS ratio above break-even points for years under the study. It performs the highest in
2005 with OSS ratio of 282.77% and it also performs the lowest ratio in 2009 which is
127.08%. The lowest achievement is due to the huge amount of doubtful expense
recognition by the branch in this year and that undermines the income of the year. The
average ratio for five years is 201.08%. Regarding the trends of this ratio, it is going
decline through the years except in 2008 as it is depicted in the Figure 10.
In general, however, the branch performs operationally self sufficient though out the
years under the study. This implies that the branch can cover its operating costs and
interest on savings.
4.3.5.2 Returns on Assets (ROA)
ROA measures how well the branch uses its total assets (equity and liabilities) to
generate returns. Its importance is for both internal management and external
stakeholders to evaluate profitability of the branch so that the investors (depositors)
build their trust on the branch‘s fate to operate in future. It is calculated by dividing the
average net income earned by the branch to average amount of total assets. The higher
the ratio means, the better the branch‘s performance.
As it illustrated on Figure 11, the average ROA ratio is 3.51% for last five years. The
maximum value in 2005 (5.52%) is drastically decline to 1.95% in 2007. When the trends
considered, the achievement is good in former two years as compared to the later years.
Even if, certain improvements observed in 2008, it again declines in 2009. The one
possible reason for the decline in the year 2009 is, due to the huge amount of the bad
debt recognition in this year.
In overall, the achievement of the branch on profitability is encouraging as it attains an
average of 3.51%.
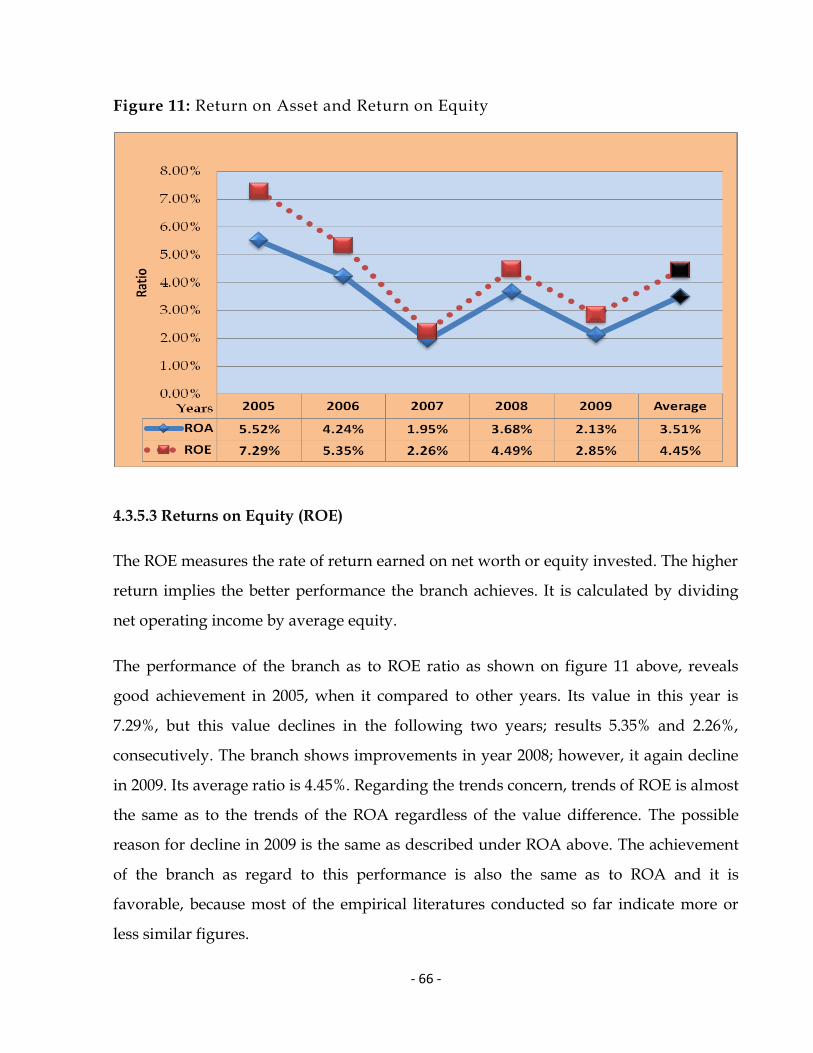
- 66 -
Figure 11: Return on Asset and Return on Equity
4.3.5.3 Returns on Equity (ROE)
The ROE measures the rate of return earned on net worth or equity invested. The higher
return implies the better performance the branch achieves. It is calculated by dividing
net operating income by average equity.
The performance of the branch as to ROE ratio as shown on figure 11 above, reveals
good achievement in 2005, when it compared to other years. Its value in this year is
7.29%, but this value declines in the following two years; results 5.35% and 2.26%,
consecutively. The branch shows improvements in year 2008; however, it again decline
in 2009. Its average ratio is 4.45%. Regarding the trends concern, trends of ROE is almost
the same as to the trends of the ROA regardless of the value difference. The possible
reason for decline in 2009 is the same as described under ROA above. The achievement
of the branch as regard to this performance is also the same as to ROA and it is
favorable, because most of the empirical literatures conducted so far indicate more or
less similar figures.

- 67 -
CHAPTER V CONCLUSION AND RECOMMENDATION
5.1 Conclusion
Apart from its social mission, the branch has been serving as financial intermediary. In
order to achieve its social as well as financial intermediary mission, it should first
financially viable and operational efficient. Therefore, any effort regarding the
performance of the branch should be measured time and again to have the exact
position of the branch. Then after, it is easy for managers to take whatever decisions to
the branch‘s sustainable and efficient performance.
Based on the discussion and analysis made in chapter four, the following conclusions
are made on the evaluation of the financial and operational performance of the branch.
Concerning the outreach performance of the branch, the number of clients in terms of
total client size shows significant decline especially in recent two years. Actually, this is
happen due to decline of loan size as well as less or no services for new clients; because
of government policy to combat inflation growth. The trend of female borrowers as
compared to male is almost constant and balanced throughout the years except few
variations. This indicates that female can borrow equally as male in the branch.
In spite of the fact that, Portfolio at Risk is not a headache of the branch since it is
collateral based branch; it performs high portfolio quality of an average of 3.24% for
PAR over 365 days. As it described by some literatures, this performance is considered
as a high quality. The quality of portfolio is more pleasing for days 1 to 30 and 91 to 180
past due date, which have the portfolio at risk of only 0.41% and 0.73% respectively.
However; the total PAR greater than 30 days is 6.83%. However; the quality of portfolio
in terms of repayment rate (80.30%), it is too far less than the industry average (95%).
Even if the branch do not have write-off policy explicitly, It write-offs the arrears with

- 68 -
greater than 90 days and above using different percentage and completely write -off for
the days greater than 365 past due.
With respect to productivity and efficiency; Operating expense ratio, Borrowers per loan
officer and Active clients per staff member are the main focus of the study of those
measurements indicators. There are increments in operating expense, staff members
and loan officers rather than they should have declined to the response of decline of
gross loan portfolio and client numbers. This is because of the increments in services
provided by the branch. The main additional services that the branch started on the
letter periods of the study are:-
1) Collection of pay backs from the customers which were not exists at early years
of the study.
2) Local money transfer services like a commercial banks and etc.
The effect of these services deteriorates the productivity and efficiency of the branch;
because, services like collection of loan does not generate additional income rather its
effect revealed directly on profitability of branch. However; the loan numbers declines
over the last two years, the average outstanding loan size and the average loan
disbursed size have positive result on the profitability of the branch.
From financial management point of view, especially asset and liability management is
very important to the healthy operation of any business. Regarding yield on portfolio,
the branch performs below the official rate of interest (9.9-18%); that means the branch
hasn‘t been attained its intended yield on portfolio. The possible reason that the
researcher found is the high amount of bad debt that has transferred to expense account.
However, this ratio will be maintained in the future when the bad debt account paid
back because of collaterals. On contrary, the branch performs efficiently on the cost of
fund; it pays below (average 2.56%) the official interest rate (4%). This achievement is
the result of the different businesses activities performed by the branch to generate
revenue. Concerning the debt to equity and portfolio to asset ratios, the branch is

- 69 -
mobilizing an average of almost 74 %( 100%-25.88%) of equity and about 82% of loan
portfolio in its balance sheet. The branch also has the current ratio of an average 5.15%;
which indicates liquidity is not the problem of branch (i.e. it has the ability to meet it
short term obligation) and at the same time it is encouraging.
From profitability and financial sustainability angle of view, it is found that the branch
is hopeful though its performance declining over time. It is operational self sufficient as
it achieves an average of 201.08% and above breakeven through five years. Its
profitability as measured by return on asset and return on equity is also performed well
as far as it becomes positive profit.
By considering important contributors to ROA and ROE discussed so far in chapter
four, the branch has the potential to achieve more than what it currently performing; if it
were kept its client in constant growth. Moreover; the huge amount of bad debt account
recorded as expense affects the returns very significantly.
All in all; what the researcher recognizes from the result of the study is, the trends of
overall performance of the branch is declined especially in 2007 and 2009 years.
However; the branch still has a good potential and it can performs more than what it
currently performing after some corrections.
5.2 Recommendation
Based on the findings of the study, the researcher suggests the following
recommendations by considering all important points in mind for successful
performance of the branch in future endeavor.
Even if, execution of government policy is mandatory to the branch to the response of
fighting against inflation, the branch should have at least some other mechanisms (like,
minimizing the loan size) to retain its clients as an active client to the number it had
before the last two years; because, it will be difficult to the branch to get back those
clients in the future.

- 70 -
Though the ratio of Portfolio at risk is small, the amount in arrears what the branch has
should be repaid back to the branch in total amount before it accumulated to a large
value; because, its effect revealed on operating expense and then eventually on profits of
the branch.
Too high expense of the branch understates the profit of the branch especially in last
year (2009). The source for expense is the amount of bad debt, which is about 20% of
total expenses of the branch. Therefore, this accumulated amount should be repaid back
to the branch in order to reflex the true profit of the branch. As long as the branch is
collateral based, the importance of collateral is under the question to the lenders
otherwise.
When the number of clients declines significantly, the branch should immediately watch
out their operating expenses, client per staff and client per loan officer to be cost efficient
and personnel productive. Actually it may be difficult to fire and hire staffs now and
then, but it is at least possible to maintain the existing number of clients and staffs.
Otherwise, the branch should diversify its activities in some more other means to
generate income. The best examples that the branch doing is local money transfer and
pension payments on behalf of some other organization. The other potential activities
like tax collection, underwriting, insurance, housing rental collection, and so on.
The branch should at least first maintain its yield on portfolio as per the intended official
borrowing rate and secondly it should try its best to achieve more than the minimum
lending rate (i.e. 9.9%). The other point here is regarding current ratio the branch should
determine it fixed rate based on its transaction movement so that it use as a bench mark;
because holding too low or too high current asset is not feasible for healthy business.
Concerning financial sustainability; financial self sufficiency is very important tool of
measurement and it can be measured after some adjustments made. In order to measure
this tool, the branch should record whatever the costs that covered by some other

- 71 -
organization including the main office. If and only if the costs expected it were covered
by the branch, if it was not covered by other organization.
In general, the branch should observe the trends of their performance time and again
using different measurement tools discussed so far. So that, it can take correcting
measures in order to achieve its intended mission.

- 72 -
BIBLIOGRAPHY
Adeno Kindane (2007), Outreach and Sustainability of the Amhara Credit and Saving
Institutions(ACSI) Ethiopia: MA thesis, Norwegian University of Life Sciences.
AEMFI (2009): retrieved from http://www.aemfi
ethiopia.org/Membership/default.aspx
Alemayehu Yirsaw (2008), The Performance of Micro Finance Institutions in Ethiopia: A case
of six microfinance institutions, Addis Ababa, April, 2008.
Anne-Lucie Lafourcade, Jennifer Isern, Patricia Mwangi, and Matthew Brown (2005),
Overview of the Outreach and Financial Performance of Microfinance Institutions in Africa:
April 2005.
Arega Seyoum (2007), Assessment of the Financial and Operating Performance and
Challenges of MFIs in Addis Ababa : Addis Ababa, August 2007.
Basu J.C. and Woller G. (2004), Microfinance a comprehensive review of existing literature:
Journal of Entrepreneurial Finance and Business Ventures, 9(1), pp. 1-26, 2004.
Befikadu Kereta (2007), Outreach and Financial performance analysis of Microfinance
Institutions in Ethiopia, African Economic Conference: Addis Ababa.
Berne (2005), Monitoring system for saving and credit operation: Guide and explanation of
data and ratios (short version), March 2005.
CGAP (2009), Financial Analysis for Microfinance Institution: Participant course materials.
CGAP (2010), Consultative Group to Assist the Poor: www.cgap.org
CGAP 1818 H Street, Building financial systems for the poor: Washington, DC 20433.
Retrieved from http://www.cgap.org/keyprncmicrofinance_CG_eng.pdf

- 73 -
Cull, R., A. DemigÄuc-Kunt, and J. Morduch (2007), Financial performance and outreach:
A global analysis of leading micro banks, Economic Journal 117 (517), 107/133.
Daniel C. Hardy, Paul Holden, and Vassili Prokopenko (2002), Microfinance
Institutions and Public Policy: IMF Working Paper, Monetary and Exchange
Affairs Department, September 2002.
Dan Norell (2004), How To Reduce Arrears In Microfinance Institutions:
Volume 3 Number 1. Retrieved from
www.rulalfinance/BanaryDownloader?.
Dedebit microfinance (2010), A Brief overview on DECSI achievements: Mekele, Tigray,
Ethiopia, and Brochure December 2009.
Hartarska, V. (2005), Governance and performance of microfinance institutions in central and
eastern Europe and the newly independent states: World Development 33, 1627/1648.
Jonathan Roe, Function of Microfinance banks. Retrieved from http://www.ehow.com/
Lafourcade A. L., Isern J., Mwangi P., and Brown M. (2005), Overview of the outreach and
Financial performance of Microfinance Institutions in Africa: The MIX market Inc.
Ledgerwood, J. (1999). Microfinance handbook: An institutional and financial perspective,
Sustainable banking with the poor, The World Bank, Washington , D.C., U.S.A.
Lene Hansen, Financial Services Sector Assessment in Nepal FINAL REPORT:
Letenah Ejigu (2009), Performance Analysis of a sample Microfinance Institutions of Ethiopia:
University Business School, Panjab University, Chandigarh, India, March 2009.
Mercy Corps (2006), the history of microfinance: The article Posted on April 14, 2006.
Retrieved from http//www: History%20of%20M%20%20Global%20Envision.htm.
- 74 -
Meyer, R. L. (2002), Track Record of Financial Institutions in Assisting the Poor in Asia: ADB
Institute Research Paper, No 49, December 2002.
MicroRate & Inter-American Development Bank Sustainable Development Department
Micro, Small and Medium Enterprise Division (2003), Performance Indicators for
Microfinance Institutions: Technical guide 3rd Edition Washington, D. C., July 2003.
Nancy Natilson, Tillman A. Bruett (2003), Financial Performance Monitoring: A manual for
board members of microfinance institutions, SEEP Network 2003.
William F. Steel & David O. Andah (2003), Rural and Micro Finance Regulation in Ghana:
Implications for Development and Performance of the Industry, Africa Region Working
Paper Series No. 49 June 2003; Sited from Amha 2000; Shiferaw and Amha 2001.

- 75 -
APPENDIX
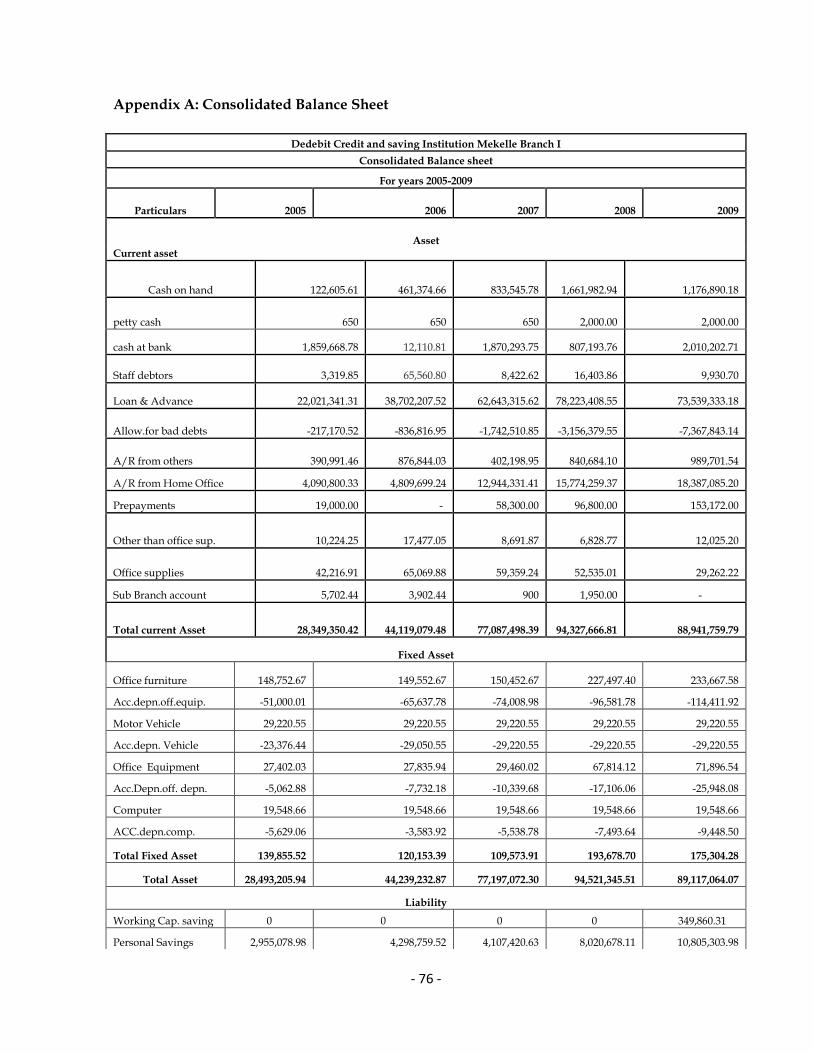
- 76 -
Appendix A: Consolidated Balance Sheet
Dedebit Credit and saving Institution Mekelle Branch I
Consolidated Balance sheet
For years 2005-2009
Particulars 2005 2006 2007 2008 2009
Asset Current asset
Cash on hand 122,605.61 461,374.66 833,545.78 1,661,982.94 1,176,890.18
petty cash 650 650 650 2,000.00 2,000.00
cash at bank 1,859,668.78 12,110.81 1,870,293.75 807,193.76 2,010,202.71
Staff debtors 3,319.85 65,560.80 8,422.62 16,403.86 9,930.70
Loan & Advance 22,021,341.31 38,702,207.52 62,643,315.62 78,223,408.55 73,539,333.18
Allow.for bad debts -217,170.52 -836,816.95 -1,742,510.85 -3,156,379.55 -7,367,843.14
A/R from others 390,991.46 876,844.03 402,198.95 840,684.10 989,701.54
A/R from Home Office 4,090,800.33 4,809,699.24 12,944,331.41 15,774,259.37 18,387,085.20
Prepayments 19,000.00 - 58,300.00 96,800.00 153,172.00
Other than office sup. 10,224.25 17,477.05 8,691.87 6,828.77 12,025.20
Office supplies 42,216.91 65,069.88 59,359.24 52,535.01 29,262.22
Sub Branch account 5,702.44 3,902.44 900 1,950.00 -
Total current Asset 28,349,350.42 44,119,079.48 77,087,498.39 94,327,666.81 88,941,759.79
Fixed Asset
Office furniture 148,752.67 149,552.67 150,452.67 227,497.40 233,667.58
Acc.depn.off.equip. -51,000.01 -65,637.78 -74,008.98 -96,581.78 -114,411.92
Motor Vehicle 29,220.55 29,220.55 29,220.55 29,220.55 29,220.55
Acc.depn. Vehicle -23,376.44 -29,050.55 -29,220.55 -29,220.55 -29,220.55
Office Equipment 27,402.03 27,835.94 29,460.02 67,814.12 71,896.54
Acc.Depn.off. depn. -5,062.88 -7,732.18 -10,339.68 -17,106.06 -25,948.08
Computer 19,548.66 19,548.66 19,548.66 19,548.66 19,548.66
ACC.depn.comp. -5,629.06 -3,583.92 -5,538.78 -7,493.64 -9,448.50
Total Fixed Asset 139,855.52 120,153.39 109,573.91 193,678.70 175,304.28
Total Asset 28,493,205.94 44,239,232.87 77,197,072.30 94,521,345.51 89,117,064.07
Liability
Working Cap. saving 0 0 0 0 349,860.31
Personal Savings 2,955,078.98 4,298,759.52 4,107,420.63 8,020,678.11 10,805,303.98
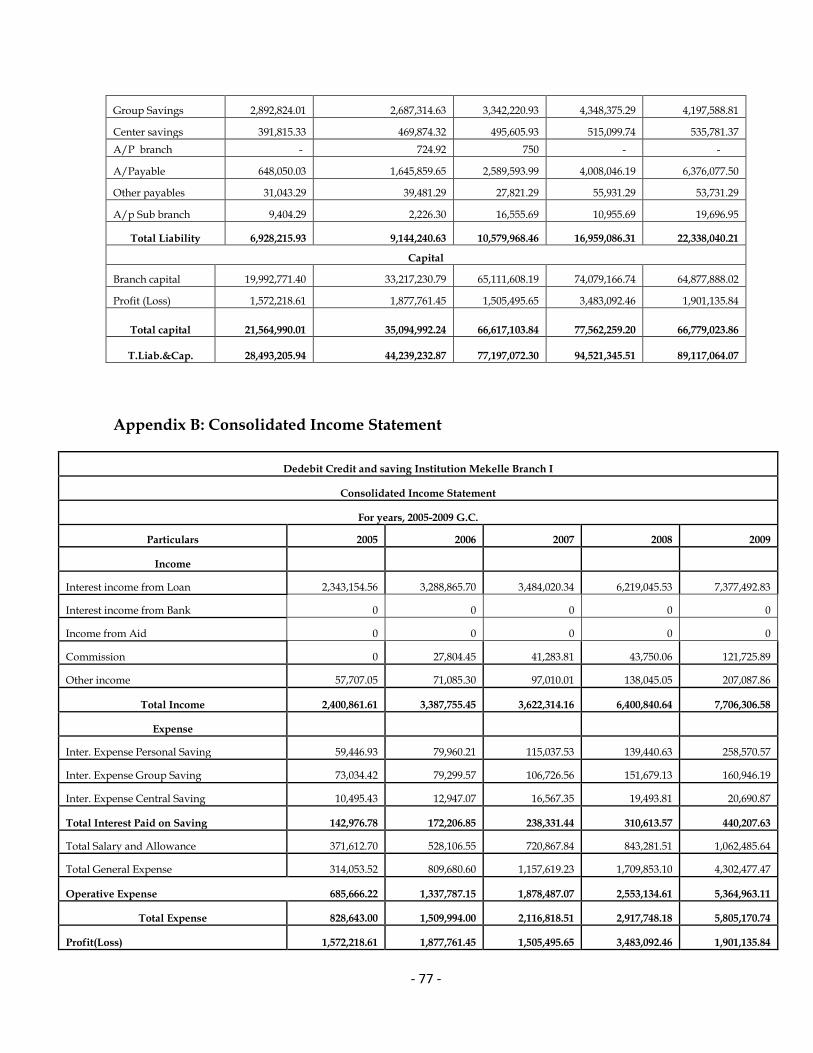
- 77 -
Appendix B: Consolidated Income Statement
Dedebit Credit and saving Institution Mekelle Branch I
Consolidated Income Statement
For years, 2005-2009 G.C.
Particulars 2005 2006 2007 2008 2009
Income
Interest income from Loan 2,343,154.56 3,288,865.70 3,484,020.34 6,219,045.53 7,377,492.83
Interest income from Bank 0 0 0 0 0
Income from Aid 0 0 0 0 0
Commission 0 27,804.45 41,283.81 43,750.06 121,725.89
Other income 57,707.05 71,085.30 97,010.01 138,045.05 207,087.86
Total Income 2,400,861.61 3,387,755.45 3,622,314.16 6,400,840.64 7,706,306.58
Expense
Inter. Expense Personal Saving 59,446.93 79,960.21 115,037.53 139,440.63 258,570.57
Inter. Expense Group Saving 73,034.42 79,299.57 106,726.56 151,679.13 160,946.19
Inter. Expense Central Saving 10,495.43 12,947.07 16,567.35 19,493.81 20,690.87
Total Interest Paid on Saving 142,976.78 172,206.85 238,331.44 310,613.57 440,207.63
Total Salary and Allowance 371,612.70 528,106.55 720,867.84 843,281.51 1,062,485.64
Total General Expense 314,053.52 809,680.60 1,157,619.23 1,709,853.10 4,302,477.47
Operative Expense 685,666.22 1,337,787.15 1,878,487.07 2,553,134.61 5,364,963.11
Total Expense 828,643.00 1,509,994.00 2,116,818.51 2,917,748.18 5,805,170.74
Profit(Loss) 1,572,218.61 1,877,761.45 1,505,495.65 3,483,092.46 1,901,135.84
Group Savings 2,892,824.01 2,687,314.63 3,342,220.93 4,348,375.29 4,197,588.81
Center savings 391,815.33 469,874.32 495,605.93 515,099.74 535,781.37
A/P branch - 724.92 750 - -
A/Payable 648,050.03 1,645,859.65 2,589,593.99 4,008,046.19 6,376,077.50
Other payables 31,043.29 39,481.29 27,821.29 55,931.29 53,731.29
A/p Sub branch 9,404.29 2,226.30 16,555.69 10,955.69 19,696.95
Total Liability 6,928,215.93 9,144,240.63 10,579,968.46 16,959,086.31 22,338,040.21
Capital
Branch capital 19,992,771.40 33,217,230.79 65,111,608.19 74,079,166.74 64,877,888.02
Profit (Loss) 1,572,218.61 1,877,761.45 1,505,495.65 3,483,092.46 1,901,135.84
Total capital 21,564,990.01 35,094,992.24 66,617,103.84 77,562,259.20 66,779,023.86
T.Liab.&Cap. 28,493,205.94 44,239,232.87 77,197,072.30 94,521,345.51 89,117,064.07

- 78 -
Appendix C: Consolidated Operational Report
Mekelle Brach I
Consolidated Operational Report
For the years end 2005-2009 G.C.
No Particulars Sex 2005 2006 2007 2008 2009
1 Number of Staff M&F 44 47 55 58 70
2 N. of loan offer M&F 8 9 9 11 14
3 Number of new clients
Male 2567 2479 2489 2579 1573
Female 1967 2399 2083 3368 2237
Cooperative 0 0 45 15 NA
Total 4534 4878 4617 5962 3810
4 Number of active clients
Male 3728 3049 4014 2508 1700
Female 3260 4119 5032 3202 2100
Cooperative 0 0 45 10 55
Total 6988 7168 9091 5720 3855
5 Amount of loan disbursed
Male 13,271,390.00 21,058,943.00 27,965,225.00 22,720,702.76 15,411,158.35
Female 6,790,108.50 16,381,751.00 19,424,250.04 19,981,652.45 15,476,501.00
Cooperative 0 0 4,649,851.16 1,520,773.16 4,387,408.12
Total 20,061,498.50 37,440,694.00 52,039,326.20 44,223,128.37 35,275,067.47
6 Amount collected
Male 8,992,549.28 11,880,439.35 16,684,309.80 22,449,461.70 23,642,288.63
Female 7,595,161.47 10,235,095.47 12,519,526.78 17,016,786.15 19,202,169.73
Cooperative 0 0 7,853.18 697,240.54 +880,650.16
Total 16,587,710.75 22,115,534.82 29,211,689.76 40,163,488.39 43,725,108.52
7 Loan outstanding
Male 12,885,523.92 23,419,634.59 34,140,616.02 30,651,295.47 24,110,473.74
Female 9,135,817.39 15,242,572.95 22,907,534.96 24,315,459.94 12,017,206.29
Cooperative 0 0 4,641,997.98 3,682,314.40 2,801,664.24
Total 22,021,341.31 38,662,207.54 61,690,148.96 58,649,069.81 38,929,344.27
8
Total Clients with Male 5,589 5,318 5,530 6,729 6,106
outstanding Female 4,619 5,127 4,618 5,752 5,219
Cooperative -
- 45 60 40
Total 10,208 10,445 10,193 12,541 11,365

- 79 -
Appendix D: Portfolio at Risk
Me
ke
lle
Bra
nch
I
Co
nso
lid
ate
d O
pe
rati
on
al
Re
po
rt o
f P
AR
(d
eli
nq
ue
nt)
Fo
r th
e y
ears
en
de
d 2
005
-20
09
200
9
336
,15
9.71
348
,09
4.01
540
,24
8.70
1,8
83,6
70.
63
6,4
90,4
30.
12
9,5
98,6
03.
17
No
. C
lie
nt
742
299
222
436
154
8
324
7
200
8
369
,68
4.11
642
,87
5.16
866
,11
9.53
1,4
88,9
14.
08
2,5
36,5
98.
37
5,9
04,1
91.
25
No
. C
lie
nt
691
315
326
356
928
261
6
200
7
139
,09
2.00
256
,18
0.40
312
,82
4.10
311
,99
0.20
1,3
58,5
35.
00
2,3
78,6
21.
70
No
. C
lie
nt
284
228
211
199
706
162
8
200
6
171
,85
2.18
1,2
90,7
91.
60
200
,94
6.22
448
,37
7.93
497
,04
2.76
2,6
09,0
10.
69
No
. C
lie
nt
664
56
62
159
165
110
6
200
5
102
,20
7.00
112
,56
6.00
170
,37
8.00
145
,62
1.00
152
,12
5.00
682
,89
7.00
No
. C
lie
nt
84
66
45
45
104
344
serv
ice
loa
n
loa
n
loa
n
loa
n
loa
n
Da
ys
1 t
o 3
0
31
to 9
0
91
to 1
80
181
to
365
>36
5
To
tal
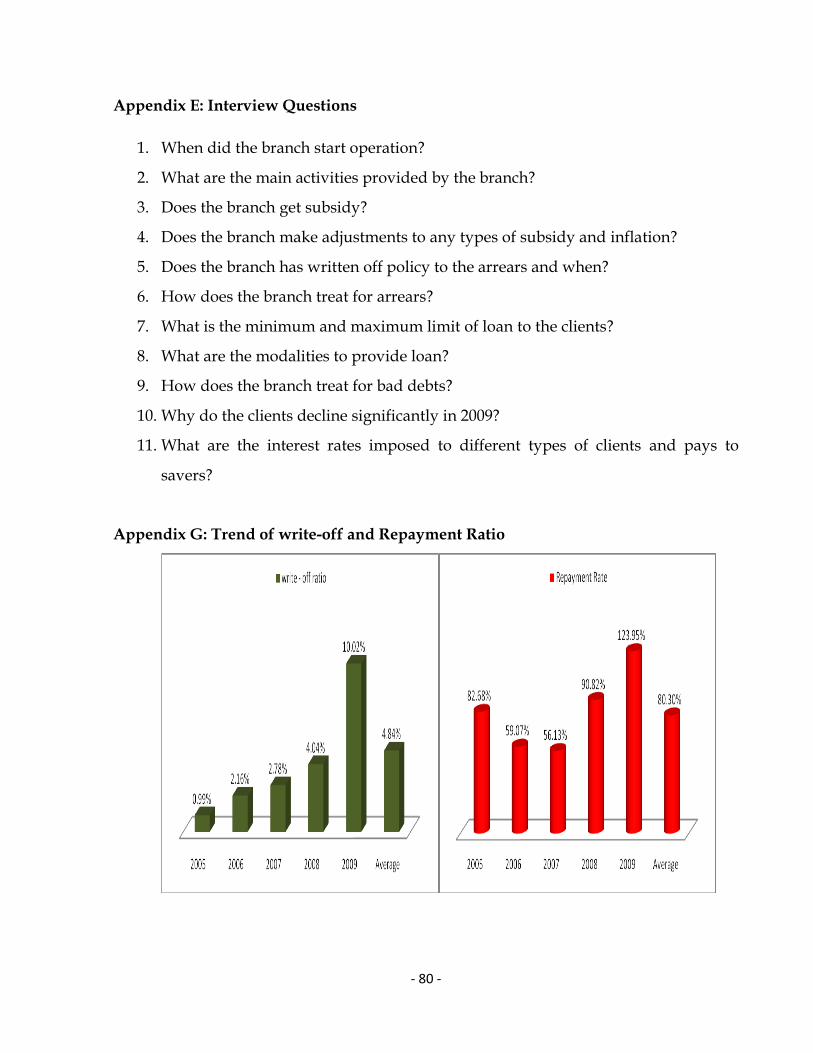
- 80 -
Appendix E: Interview Questions
1. When did the branch start operation?
2. What are the main activities provided by the branch?
3. Does the branch get subsidy?
4. Does the branch make adjustments to any types of subsidy and inflation?
5. Does the branch has written off policy to the arrears and when?
6. How does the branch treat for arrears?
7. What is the minimum and maximum limit of loan to the clients?
8. What are the modalities to provide loan?
9. How does the branch treat for bad debts?
10. Why do the clients decline significantly in 2009?
11. What are the interest rates imposed to different types of clients and pays to
savers?
Appendix G: Trend of write-off and Repayment Ratio
Recommended