
Graduate Theses, Dissertations, and Problem Reports
2000
Evaluation of lubricants for cold forming of steels by double-cup Evaluation of lubricants for cold forming of steels by double-cup
extrusion tests extrusion tests
Shivakumaran Bharadwaj Venkataraman West Virginia University
Follow this and additional works at: https://researchrepository.wvu.edu/etd
Recommended Citation Recommended Citation Venkataraman, Shivakumaran Bharadwaj, "Evaluation of lubricants for cold forming of steels by double-cup extrusion tests" (2000). Graduate Theses, Dissertations, and Problem Reports. 1030. https://researchrepository.wvu.edu/etd/1030
This Thesis is protected by copyright and/or related rights. It has been brought to you by the The Research Repository @ WVU with permission from the rights-holder(s). You are free to use this Thesis in any way that is permitted by the copyright and related rights legislation that applies to your use. For other uses you must obtain permission from the rights-holder(s) directly, unless additional rights are indicated by a Creative Commons license in the record and/ or on the work itself. This Thesis has been accepted for inclusion in WVU Graduate Theses, Dissertations, and Problem Reports collection by an authorized administrator of The Research Repository @ WVU. For more information, please contact [email protected].

EVALUATION OF LUBRICANTS FOR COLD FORMING OF
STEELS BY DOUBLE - CUP EXTRUSION TESTS
Shivakumaran B. Venkataraman
A Thesis Submitted to
The College of Engineering
at West Virginia University
In partial fulfillment of the requirements
for the degree of
Master of Science
in Mechanical Engineering
Donald Lyons Ph.D., Chair
Ken Means Ph.D.
Gary Morris Ph.D.
Jacky Prucz Ph.D.
Department of Mechanical Engineering
Morgantown, West Virginia
2000
Keywords: Cold Forging Lubricant, Friction, Friction Testing, Double Cup
Backward Extrusion, Lubricant Testing

EVALUATION OF LUBRICANTS FOR COLD FORMING OF
STEELS BY DOUBLE - CUP EXTRUSION TESTS
By
Shivakumaran B. Venkataraman
ABSTRACT
The double-cup extrusion testing method was chosen for measuring the pressure
and material flow parameters in order to quantify the frictional shear factor
between the workpiece and the forming tool in cold metal forming processes. The
test was adapted to be used under production conditions and applied to
characterize and compare the lubrication properties of different types of
lubricants and coatings.
It was found to be a useful approach to estimate the relative efficiency of different
lubricants and coating methods. It indicated that one specific lubricant has
significantly superior lubricant characteristics than others.
FEA analysis of the experimental setup was constructed to generate calibration
curves for the coefficient of friction, m, at various values of m and deformation
stroke by using the metal forming software package ANTARES. Statistical
techniques were utilized to calculate the mean and variance of results obtained
for various combinations of the experimental control variables.
Additional efforts are needed in order to make the test results more sensitive to
slight variations of friction within a given lubrication method.

iii
ACKNOWLEDGMENTS
I would like to take this opportunity to thank the following people without whose
help and guidance this experimental research project would not have been
possible.
• Prof. Jacky Prucz, my Graduate Research Advisor, whose constant guidance
and evaluation of my work help me keep focused on the scope of this project.
Special thanks to him for his trips to Saginaw to evaluate this project and his
encouragement given to me to complete this thesis.
• Dr. Ravi Duggirala, Staff Project Engineer, Process Engineering and
Development, Delphi Saginaw Steering Systems - General Motors
Corporation, who as my on-site advisor helped define the scope of the project
and took time to explain its finer technical details.
• Mr. David Hitz, Chief Engineer, Process Engineering and Development,
Delphi Saginaw Steering Systems - General Motors Corporation, for providing
managerial support for this endeavor.
• Prof. Don Lyons, Head of the Department of Mechanical and Aerospace
Engineering, West Virginia University, who was instrumental in leveraging my
stay at Saginaw to complete this project. He was a major source of guidance
and help at the crucial inception stage of this research project.
• Prof. Gary Morris and my thesis advisory committee for having guided and
supported me during the course of this project.

iv
TABLE OF CONTENTS
CHAPTER # TITLE Page #
Chapter 1 Introduction - Object of research and overview of thesis 1
Chapter 2 2.1 Forging as a metal forming practice
2.2 Correlation of metal forming practice and theory
2.3 The finite element method as an analysis tool
3
5
5
Chapter 3 Friction
3.1 Introduction to friction
3.2 Theory of friction
3.3 Expressions for friction
9
9
10
12
Chapter 4 Lubricants
4.1 Introduction to lubrication
4.2 Classification of lubrication mechanisms
4.3 Characteristics of ideal lubricants
4.4 Process conditions and mechanisms of lubricants
4.5 Selection criteria for industrial lubricants
4.6 Types of lubricants used in industry
4.7 Table comparing lubricants
16
16
16
19
21
23
24
27
Chapter 5 Friction test methods
5.1 Principles of friction testing
5.2 List of commonly used test methods
5.3 Comparison of test methods
28
28
29
39
Chapter 6 The double-cup backward extrusion test
6.1 Purpose of test
6.2 Theory of double-cup backward extrusion test
6.3 Design of experiment
6.4 Description of apparatus
6.5 Method of fixing deformation stroke on the press
43
43
44
46
49
50

v
CHAPTER # TITLE Page #
Chapter 6 6.6 Friction test procedure
6.6.1 Preparations prior to test
6.6.2 Test procedure for each run
51
51
54
Chapter 7 FEA of double cup backward extrusion friction test
7.1 Introduction
7.2 Procedure for setting up simulation
7.2.1 Material spec. in the Material Data sub menu
7.2.2 Input sub menu
7.2.3 Simulate sub menu
7.3 Post processing simulation results
57
57
57
58
59
61
62
Chapter 8 Friction test results
8.1 Computer simulation
8.2 Discussion on calibration curves
8.3 Actual test results
8.4 Discussion of friction test results
64
64
65
66
70
Chapter 9 Overall conclusions
9.1 Conclusions
9.2 Contributions
9.3 Recommendations
74
74
74
75
References 76
APPENDIX
A. Tables of extruded cup heights from actual testing 78
B. Computer Simulation (ANTARES) generated data 87
C. Engineering drawings of dies used for test 96

vi
LIST OF SYMBOLS AND THEIR MEANINGS (NOMENCLATURE)
σ0 = uniaxial yield stress
τfr = avg. frictional shear strength at workpiece - tool interface
K = yield strength of workpiece
τf = friction stress
p = interface pressure
µ = coefficient of friction
N = pressure in normal direction
A r = actual area of contact
A = area of workpiece undergoing deformation
m = friction factor
Us = relative sliding velocity of workpiece to forming tool
v = relative velocity
Vw = workpiece velocity
Vd = die velocity
Vr = vertical ram velocity
α = ratio of real to apparent area of contact
f = friction factor at asperity - tool interface
ho = initial thickness of strip
hi = final thickness of strip
S = separating force in Rolls
P = drawing force in Rolls

1
CHAPTER 1
OBJECT OF RESEARCH AND OVERVIEW OF THESIS
The main objectives of the research and experimental work in this thesis are:
• To investigate if, under “near production” conditions, the double cup backward
extrusion method can be used as a robust testing method for testing lubricity
of coatings.
• To investigate the friction between forming tools and workpiece material in
cold forging of steel.
• To determine the stability of coatings at higher percentages of deformation
and tonnage.
• To benchmark the lubricity of coatings currently used in Delphi Saginaw
Steering Systems. The lubricity of the currently used coatings is benchmarked
against specially designed formulations as possible replacements.
• To determine the sensitivity of the double cup extrusion method as a test to
distinguish between a “good” and a “bad” coating within a specific coating
application method.
The steps given below are followed in an attempt to achieve the above
objectives:
1. To predict, using finite element analysis code ANTARES, the extruded cup
heights under various shear friction coefficients (0 < m < 0.2 for cold forging
[1]) input into the plastic metal forming simulation set-up. The shear friction
factor, m, is increased in steps of 0.02 for each iteration of the simulation.
Predicted cup height ratios are plotted against the deformation (working)
stroke of the press to generate calibration curves.
2. The predicted cup heights are then compared to the cup heights extruded in
the experiments to determine the friction (in terms of the friction factor)
between the forming tools and the workpiece.
3. Extruded cup height ratio is computed for each combination of a specific
lubricant under a defined deformation stroke. Extruded cup height ratio is

2
directly proportional to the shear friction factor m. Friction is quantitatively
expressed as the ratio of the extruded cup heights.
4. Using this experimental setup, lubricity (expressed as friction factor) of
currently used coatings in Delphi Saginaw Steering Systems is determined.
5. Lubricities of currently used coatings are benchmarked against new coatings.
These formulations are designed specially for evaluation by the competitors
(of the current supplier) – Acheson Colloids and IRMCO.
Chapters 1 through 5 describe in detail the theoretical basis for conducting the
research in an attempt to establish the above objectives. Chapters 6 and 7
describe the experimental work and the finite element technique used for this
thesis respectively. Chapter 8 discusses the results of the experimental work.
Chapter 9 discusses the contributions of this thesis and makes recommendations
for future work.

3
CHAPTER 2
FORGING AS A METAL FORMING PROCESS AND THE FINITE
ELEMENT METHOD AS AN ANALYSIS TOOL
2.1 Forging As A Metal Forming Process
Metal forming is the term used to describe various processes of plastic
deformation of metal into a wide variety of shaped parts by controlled flow
techniques. Slugs of metal are forced to flow around punches and into or through
shape-forming dies, thus producing parts of the desired configuration. The design
and control of such processes depend on an understanding of the characteristics
of the workpiece material, the conditions at the tool/workpiece interface, the
mechanics of plastic deformation (metal flow), the equipment used, and the
finished-product requirements. These factors influence the selection of tool
geometry and material as well as processing conditions (for example, workpiece
and die temperatures and lubrication). Models of various types, such as
analytical, physical, or numerical models are often relied upon to design such
processes because of the complexity of metal forming operations.
The domain of metal forming can be broadly classified into –- bulk metal forming
(forging) and sheet metal forming. This thesis will concentrate on the
characteristics associated with forging.
Metal forming technology has a special place because it helps to produce parts
of superior mechanical properties with minimum waste of material. In metal
forming, the starting material has a relatively simple geometry; this material is
plastically deformed in one or more operations into a product of relatively
complex configuration. Forming to near net shape dimensions drastically reduces
metal removal requirements, resulting in significant material and energy savings.
Metal forming usually requires relatively expensive tooling. Therefore the process
is economically attractive when a large number of parts must be produced and/or

4
when the mechanical properties required in the finished product can be obtained
only by the forming process [2].
The following factors need to be taken into consideration in a forging process:
• Geometry and required dimensional accuracy of component
• Material of component
• Number of parts required of component
Based on the above factors, the following parameters need to be evaluated:
• Mechanics of plastic deformation such as effective strain (% elongation) on
the part
• Maximum strain or stress the part can take before it cracks
• Load required to impart the computed strain
• Number of steps required going to final geometry
• Conditions at tool/workpiece interface
• Temperature of operation
Based on the above evaluation, the following can be determined:
• Equipment to be used
• Progression design
• Tooling design
• Material of tooling
and other details such as material handling, lubricant coating, heat treatment
cycle, heating equipment, etc.

5
2.2 Correlation of Metal Forming Practice and Theory
The theory of plasticity studies and predicts shape change that occurs in metal
forming using quantitative techniques. Plasticity theory makes certain
assumptions and takes a simplified, mechanistic view of metal forming
processes. At the outset it is important to understand the fundamentals and the
basic terms generally used in plasticity theory before entering into a meaningful
discussion of friction and its effects. The basic assumptions are that the
deforming material is continuous, homogenous and isotropic. The theoretical
treatment is further simplified if the material is also assumed to behave as a
rigid/perfectly plastic (non-hardening) substance. This means that the material
shows no elastic deformation but suddenly begins to deform plastically when the
yield criterion has been satisfied. In simple tension or compression this occurs
when the uniaxial yield stress of the material σo is reached. It is then assumed to
flow at the same stress. However, in the real world, all materials first suffer
elastic deformation and - especially in cold working - also strain hardening,
leading to a continuous rise in the yield stress. The ideal perfectly plastic
behavior is sometimes approximated in hot working or by some heavily strain-
hardened metals (e.g. Aluminum) in cold working.
2.3 Finite Element Method as an Analysis Tool
The deforming workpiece material is subjected to an often rather complex
combination of compressive, tensile, and shear stresses; these can be reduced
to three (compressive and/or tensile) principal stresses. Plastic flow sets in only if
the Stress State satisfies the yield criterion. The yield criterion of Tresca states
that yielding occurs when the difference between the maximum and minimum
principal stresses reaches σσ0. The more accurate and generally used Von Mises
criterion takes also the intermediate principle stress into consideration.
The controlled change of the workpiece geometry in metal forming processes is
influenced by such process parameters as the intrinsic workability of the

6
engineering material, the tribological conditions between the workpiece and the
tooling, the tool geometry, tool material, process temperature and the imposed
strain-rate. Process modeling is a design procedure that is based on the
theoretical and experimental process analysis. Process simulation follows logical
steps, and it is closely related to process analysis. [3]
Often the preform and the die designs for the metalworking processes such as
forging are too complicated to enable the development of simple and general
methods for predicting working loads, metal flow and the occurrence of defects.
The trial and error methods are not only expensive and time consuming, but they
frequently require expensive experimental setups and difficult measurements.
Additionally, they encroach on production time on the equipment thus preventing
production of required components. Therefore, an ever-increasing amount of
research has been and continues to be done to develop general mathematical
and computer techniques that are capable of simulating metal forming processes
under arbitrary conditions.
The development of powerful computer-based simulation techniques, such as
those based on the finite-element method, has provided a vital link between
advances in tooling and equipment design, on the one hand, and an improved
understanding of the materials behavior on the other. Finite element analysis
(FEA) is one of various methods used to mathematically model and analyze
metal forming processes. It is based on the infinitesimal theory of plasticity. This
theory discards the elastic part of the stress-strain curve and is based the
following three assumptions:
1. The infinitesimal deformation at any time can be resolved into a sum of an
elastic part and a plastic part.
2. A yield function in stress space exists.
3. The workpiece material is stable and continuos in the sense that any increase
in deformation will not produce a decrease in the flow stress.

7
In this method of analysis, a cross-section of deforming material, for either an
axisymmetric or a plane strain problem is divided into a two-dimensional network
of discrete elements called finite elements. The deformation at selected points
called nodes in each element is determined by the application of some variational
principle. Thus, by analyzing an aggregate of elements one at a time, the
deformation pattern in a complex shape can be determined. The accuracy of the
predicted deformation increases with the number of elements used.
Initially, codes based on the infinitesimal elastic-plastic theory were used to
analyze small deflections and deformations. This code was restricted to metal
forming problems in which plastic flow was tightly constrained. However, when
researchers began applying it to the study of forging operations, i.e., operations
in which there was significant shape change and hence plastic deformations
being far greater than elastic deformations, it became evident that the codes
required more sophistication. In analyzing problems that involved large plastic
deformations, the material particles were found to undergo very large
displacements and rotations in most cases.
Inputs to finite-element codes include the characteristics of the workpiece
material (flow stress and thermal properties) and the tool/workpiece interface
(friction and heat transfer properties), as well as workpiece and tooling geometry.
Typical outputs include predictions of forming load; strain, strain rate, and
temperature contour plots; and tooling deflections. This information is used in
design considerations, such as selection of press capacity, determination of
success or failure with regard to material workability, and estimation of likely
sources of tooling failure (abrasive wear, thermal fatigue, and so on).
Advantages of the Finite Element Method
• FEM can incorporate different material properties for each element, since the
properties of each element are evaluated separately.
• FEM can handle almost any degree of nonhomogenity.

8
• There is no restriction as to the shape of the medium.
• FEM can accommodate many types of boundary conditions easily.
• FEM can easily handle factors such as nonlinearities, arbitrary loading
conditions and time dependence.
• FEM can introduce most admissible velocity fields or shape functions.
• FEM has a unified treatment of the velocity fields in building the stiffness
matrix at the elemental level.
• FEM can be used to achieve connected simulations for such sequential
processes as forging, heat treating and machining and casting.
The ANTARES finite element code is an updated Langragian form that uses an
appropriate time integration scheme. It is coupled with different related fields that
include the following: thermal analysis, material workability modeling, die analysis
and CAD/CAM systems. The package is capable of analyzing elastic-plastic,
rigid-plastic, rigid-viscoplastic and rigid-thermoviscoplastic metal forming
problems for both 2D and 3D cases. Quadratic elements are used in 2D analysis
using the Quadtree Algorithm developed by RPI, Troy, NY. Automatic remeshing
is done using an UES developed algorithm.
Process simulation techniques also provide a method for preform and die design
through the ability to determine metal flow patterns without constructing tooling or
conducting expensive in-plant trials.
(The literature on the finite element analysis as applied to metal forming is
predominantly quoted from the book “Metal Forming and the Finite Element
Method” by Kobayashi S., Oh S., Altan T. [2])

9
CHAPTER 3
FRICTION
3.1 Introduction to friction
The importance of friction and lubrication in deformation processes such as
extrusion, forging, wire drawing, etc. has long been recognized by metal forming
professionals. Metalworking is probably the earliest technological occupation
known to mankind; native metals must have been forged and shaped more than
7000 years ago. Although, substantial advances have been made largely on an
empirical basis, the need for a more systematic approach has become imperative
over the years. Progress in this direction has however been rather slow, mainly
because the subject does not fit conveniently into any of the established,
classical scientific disciplines. Metal deformation processing itself is the domain
of specialists working on the borders of metallurgy and mechanical engineering;
metalworking lubrication necessitates a further involvement in fields traditionally
cultivated by chemists and physicists.
Metals are capable of accommodating only a limited amount of tensile strain
before necking sets in and fracture soon occurs. Much greater deformation may
be achieved without fracture in compression; therefore, most practical metal -
working processes effect plastic deformation by applying a force through a
suitable tool or die. Friction inevitably arises at the die - workpiece interface, and
it is this friction that is the subject of the thesis.
Reducing friction, between the die and the workpiece, in general, reduces:
• the force and energy required for a given operation,
• reduces the stresses imposed on the dies,
• achieves larger changes in shape,
• promotes die filling,

10
• reduces workpiece bulging and
• promotes more homogenous deformation
The theoretical background for a more systematic understanding and approach
to friction dates as far back as 1508 when Leonardo da Vinci recognized the
basic law of friction. Amontons later rediscovered this law in 1699. Since then,
the concept of a coefficient of friction has been adopted, but it was almost a
century before Coulomb developed a theory postulating that friction was due to
both surface roughness and adhesion. Another hundred years later, at the end of
the 19th century, the principles of hydrodynamic theory of lubrication were
developed by a number of scientists, all working within a span of 20 years. Hardy
closely investigated boundary lubrication, which plays such an important role in
metalworking processes, in the years 1919 - 1933, and his work is still a
foundation stone of present knowledge. Theories relating to dry and lubricated
friction were developed in the late forties. The science of friction and lubrication is
now being recognized as a discipline of its own, although it is still being practiced
by researchers trained in related classical disciplines. Since then, more powerful
drives on forming equipment have promoted increased production, heavier
reductions, higher speeds and thereby imposed severe conditions on lubricants.
New metals that were introduced to satisfy the needs of the developing
aerospace, chemical and electronic industries often had properties quite different
from the more common metals used thus far and continue to present some of the
most difficult lubrication problems [4]. This has and continues to generate an
unprecedented need to establish rigorous and systematic testing methods to
further the cause of understanding lubricants and use them more efficiently. This
thesis deals with one such technique to evaluate lubricants.
3.2 Theory of friction
Friction is the resistance to motion encountered when one body slides over
another; in metalworking, it arises from sliding of the workpiece against the
die. Figure 3.1 (a) shows a schematic of a die - workpiece interface (macro

11
view). The existence of friction increases the value of deformation force and
makes deformation more inhomogeneous which in turn increases the propensity
for fracture. If friction is high, seizing and galling of the workpiece surfaces occur,
and surface damage results. Relative motion is opposed by friction, which can be
simply (and accurately) described by assigning an average frictional shear
strength ττfr to the interface. When this value reaches the shear flow strength of
the workpiece material K, it is energetically more favorable for deformation to
take place by internal shearing in the body of the workpiece (sticking friction
condition). However, the macroscopic view is inadequate if the characteristics of
friction and the mechanisms of lubrication are to be understood. On the
microscopic scale, both die and workpiece show minute peaks, asperities, and
valleys (figure 3.1(b)). Relative motion between such surfaces is impeded by
contact under pressure.
Fig 3.1 Die - Workpiece Interface (a) on the macroscale (b) on the microscale [4]
The magnitude and the directionality of this microgeometry plays an important
role in creating friction and also in establishing and sustaining lubricant films
designed to mitigate friction. Break-up of the original surface and temperature
gradient in workpiece and die during the deformation process, and rubbing
process in metal forming accelerates chemical reactions, etc.
In forging, friction greatly influences metal flow, pressure distribution, load and
energy requirements. In addition to lubrication effects, the effects of die chilling or

12
heat transfer from the hot material to colder dies must be considered. For
example, for a given lubricant, friction data obtained from hydraulic press forging
cannot be used for mechanical press or hammer forging even if die and billet
temperatures is comparable. High friction leads to various defects that limit
workability. However, for most workability tests, conditions are selected under
which friction is either absent or easily controlled. Most workability tests make no
provision for reproducing the frictional conditions that exist in the production
process; consequently, serious problems can result in the correlation of test
results with actual production conditions. Surface contact and friction theories are
described below and further in ref. [4]
3.3 Expressions for friction
The mechanics of friction at the tool / workpiece interface are very complex;
therefore, simplifying assumptions are usually used. Listed below are various
friction models based on fundamental laws of friction and theories based on
them.
3.3.1 Coulomb model
The most commonly used method of modeling friction between contacting
surfaces, whether lubricated or not, is the Amontons - Coulomb Law [8]. The law
implies that the friction stress ττf opposes relative surface motion and is
proportional to the interface pressure p as:
ττf = µp Eq. (3.1)
where the constant of proportionality is called the coefficient of friction. In bulk
metal forming Ar (actual area of contact) is nearly equal to A (area of the
workpiece undergoing deformation). This representation is valid primarily for light
loads and when near complete hydrodynamic effects occur, such as in high
speed thin strip rolling. As p increases, ττf may exceed the shear yield strength of
the workpiece material, K, changing the mechanism of friction.

13
3.3.2 Shear factor model:
The strong relationship between friction and the workpiece shear strength is
expressed by:
ττf = mK Eq. (3.2)
where m = friction factor ( 0 < m < 1 ) and K is the yield stress in pure shear
In solid film or boundary lubrication, m represents the ratio of interface film
strength to workpiece shear strength. Friction during most forging and extrusion
operations is best described by the friction factor. While this model has a
fundamental basis where the surfaces are completely separated by a film of a
perfectly plastic lubricant, the main reason for its use is pragmatic empiricism
since it uncouples the friction stress from the interface pressure. Eqs. (3.1) and
(3.2), both specify τf, but in different terms
3.3.3 Chen and Kobayashi [1] introduced a variation of the model of friction
factor m as:
ττf = mK ( 2/π * tan-1 ( Us/ Uo A ) ) n Eq. (3.3)
where, ττf is the frictional stress, n is the unit vector in the opposite direction of
relative sliding, Us is the sliding velocity of a material relative to die velocity, and
Uo is a small positive number compared to Us. The above expression represents
that the magnitude of the frictional stress is dependent on the magnitude of the
relative sliding velocity and direction. The approximation of the frictional stress by
the arctangent function of the relative sliding velocity eliminates the sudden
change of direction of the frictional stress mK at the neutral point, which can
cause numerical errors.
Recent investigation [9] indicate that friction is more correctly represented as a
function of relative velocity between the two surfaces. This implies that the

14
lubricant films can be considered as viscous hydrodynamic films in which shear
stress is related to sliding velocity difference.
ττf = mKv Eq. (3.4)
v = dimensionless relative velocity = (Vw - Vd ) / Vr
Vw = workpiece velocity
Vd = die velocity (usually zero)
Vr = vertical ram velocity
3.3.4 Friction model based on slip - line theory
Wanheim and Bay [10] have analyzed the deformation of surface asperities on
the specimen by means of slip lines assuming shear factor friction at the asperity
- tool interface. They have shown that below a certain surface pressure P* it is
reasonable to assume constant friction µµ and above a pressure P** it is
reasonable to assume m - friction. In the range P* and P** neither µµ - friction nor
m - friction provides a good representation for friction. Wanheim and Bay express
friction as
ττf = (α) f K Eq. (3.5)
where,
f = is the friction factor in the asperity - tool interface,
αα = is the ratio between real and apparent area of contact and
K = is the yield stress in pure shear.
At high normal pressures (α) approaches 1. In the pressure range where
Coulomb's law is valid the correlation between and f is expressed as,
21 1cos2/1 ff
f
−++Π+=
−µ Eq. (3.6)
3.3.5 Other models
Ramaekers and Kals [11] have provided some mathematical representation of
friction in metal forming analysis and support the inclusion of the relative
displacement between tool and workpiece and increase of the nominal area of

15
contact between tool and workpiece (surface - extrusion). Daulkert and Wanheim
[12] suggest a model that uses µµ and m for different regions in simple upset
tests. ττf = P in the slip zone ( outer zone of cylinder ), ττf = mK ( R/Rc ) in the stick
zone ( center portion of the cylinder ) and, ττf = mK in the drag zone (intermediate
zone of the cylinder) where R is the distance from the center of the cylinder to the
location under consideration, and Rc is the critical radius where drag zone and
stick zone are divided.
2.3.6 Realistic friction models
Models based on the fundamental mechanisms of friction are required where the
process is very sensitive to friction and friction is strongly influenced by changes
in the variables under study. The key to developing better friction models is to
take account of the local, current lubrication regime which requires a knowledge
of the local current film thickness and surface roughness. For the thick-film
regime the friction model may be represented as
ττf = µµ ( U - V) / h Eq. (3.7)
where U and V are the workpiece and tooling velocities and h is the local film
thickness [13].
Simple friction models such as Coulomb and Shear-factor are useful in
investigating the influence of friction stress on a particular process or in process-
design simulations where friction variability is small. However, they fail to
represent the influence of processing conditions on friction, particularly when the
system undergoes a transition from one regime to another or where more than
one regime exists concurrently. Under these conditions, models that are more
realistic require knowledge of the local current lubrication regime. Some such
models are also presented in [4,5] for different lubrication regimes.

16
CHAPTER 4
LUBRICANTS
4.1 Introduction to Lubrication
Lubrication is of great importance in forging operations to reduce friction between
the die and the workpiece. Considering the importance of lubricants in the
deformation processes, it is amazing that no account of their use can be found
until relatively recent times. This can be attributed to the fact that the
composition, manufacture, and use of lubricants were - and to some extent, still
are - closely guarded secrets. Additionally, it is quite possible that lubricants
assumed a vital role only at a later stage of development of forging as a
technology [4].
Effective lubrication provides better surface finish, die life and workability. Two of
the most significant lubricant developments occurred during World War II. The
phosphate conversion coating was adopted in Germany for severe cold
deformation (such as drawing and extrusion) of steel. These developments are in
practice even today.
4.2 Classification of lubrication mechanisms
In forging, as in most other metal forming operations, friction modeling is
complicated by the fact that any of several different regimes of lubrication can
exist at the billet-die interface. Lange [5] classifies the lubricating mechanisms
as:
4.2.1 Dry interfaces
Under "dry" conditions, no lubricant is present at the interface and only the oxide
layers deposited on the die and workpiece materials may act as a "separating"
layer. In this case, friction is high, and such a situation is desirable in only a few
selected forming operations, such as hot rolling of plates and slabs and

17
nonlubricated extrusion of aluminum alloys. This kind of a situation is desirable
because it allows the rolls to get a better grip of the workpiece.
Fig. 4.1 A dry interface. a - proportion of surface area that has been pressure welded; c -
proportion of surface covered with contaminant film of ττc shear strength. [12]
4.2.2 Solid-film lubrication
Die
Workpiece
Fig. 4.2 Solid - Lubricated interface [8]
A continuous solid film, thick enough to separate die and workpiece surfaces
everywhere along their interface acts as a lubricant if τC < K. Coatings of a soft,
ductile metal deposited on the workpiece surface are among the most effective
solid lubricants. A chemical reaction film at the die - workpiece interface provides
a lubricant with strong resistance to destruction during sliding contact both for the
substrate and itself. It is also more durable than a film formed by a purely
physical process.
4.2.3 Extreme pressure lubrication
The surface film is formed by reaction of the metal with an organic compound
containing phosphorous, sulfur or chlorine. The reaction product has low shear
strength and is firmly attached. The shear strength of these films is sensitive to
imposed pressure.

18
4.2.4 Boundary lubrication
"Boundary" Lubrication is the most widely encountered situation in metal forming.
Increases in temperature at the interface and the relatively high forming
pressures do not usually allow the presence of a hydrodynamic lubrication
regime. Boundary lubrication does not lend itself to ‘classical’ analysis and
consequently most of the available knowledge is empirical.
4.2.5 Hydrodynamic lubrication
"Hydrodynamic" conditions exist when a thick layer of fluid lubricant is present at
the interface between the dies and the workpiece. The friction conditions are
governed by the viscosity of the lubricant and by the relative velocity between the
die and the workpiece. As the viscosity of most lubricants decrease rapidly with
increasing temperature and thinning occurs, in most metal-working situations,
some asperity contact is unavoidable, sliding speeds may be too low, heating of
the lubricant film and interface pressures maybe too high for efficient metal
forming.
4.2.6. Mixed-film lubrication
Many metal -working lubricants are liquid or are dissolved or dispersed in a liquid
carrier
Fig. 4.3 Mixed film lubrication at die - workpiece interface [5]
for a variety of reasons. Therefore, there will be substantial entrapment of liquids,
and the limited compressibility of such liquids result in the formation of
hydrodynamic (hydrostatic) pockets in the surface of the deforming workpiece,
19
while the rest of the workpiece is in boundary contact with the die. Friction in
mixed-film lubrication depends greatly on the micro-geometry of the interface.
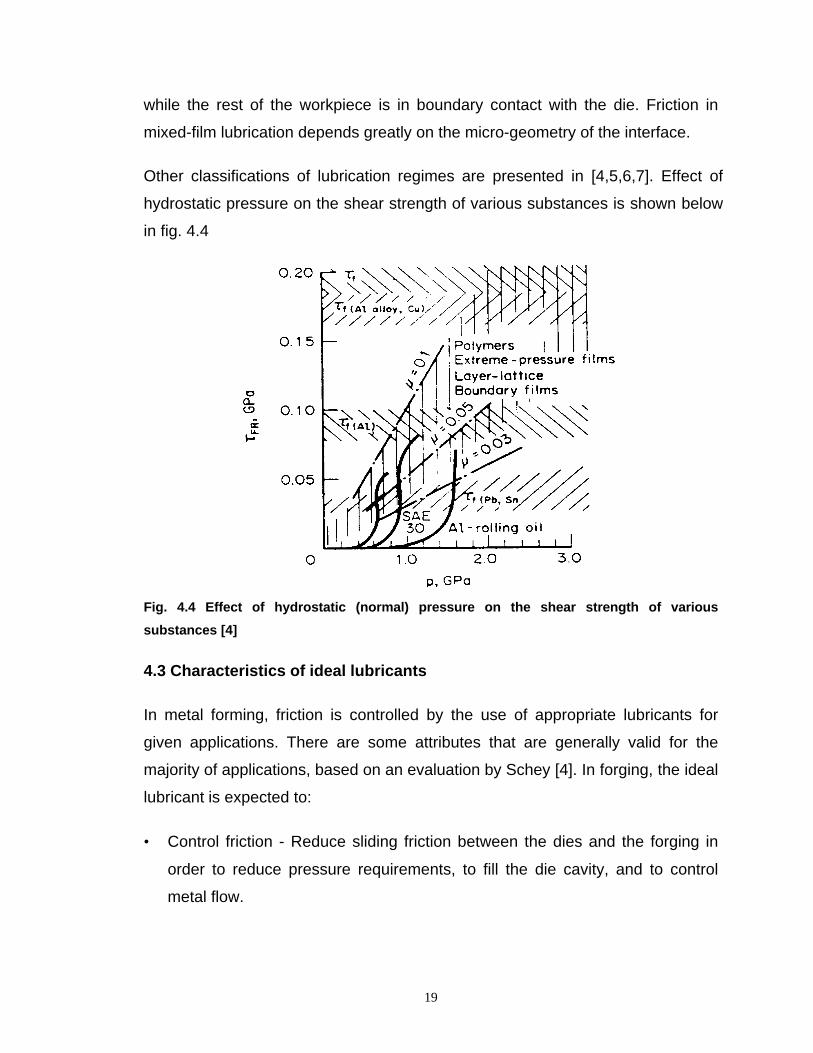
Other classifications of lubrication regimes are presented in [4,5,6,7]. Effect of
hydrostatic pressure on the shear strength of various substances is shown below
in fig. 4.4
Fig. 4.4 Effect of hydrostatic (normal) pressure on the shear strength of various
substances [4]
4.3 Characteristics of ideal lubricants
In metal forming, friction is controlled by the use of appropriate lubricants for
given applications. There are some attributes that are generally valid for the
majority of applications, based on an evaluation by Schey [4]. In forging, the ideal
lubricant is expected to:
• Control friction - Reduce sliding friction between the dies and the forging in
order to reduce pressure requirements, to fill the die cavity, and to control
metal flow.
20
• Separation of surfaces - Act as a parting agent and prevent local welding and
subsequent damage to the die and workpiece surfaces.
• Reduced Wear - should reduce wear of die while limiting wear of workpiece
material to tolerable proportions.
• Protection of old and new surfaces - should cover both old and new surfaces
generated during deformation efficiently by possessing wetting and spreading
characteristics.
• Adaptability to varied working conditions - Function at varying pressures,
temperatures and relative sliding velocities.
• Thermal Insulation - Possess insulating properties so as to reduce heat
losses from the workpiece and to minimize temperature fluctuations on the
die surface.
• Rapid response - should exert its influence in a short time (order of a few
milliseconds.)
• Durability of liquid film - Capable of withstanding continued or repeated
encounters.
• Cooling − Also function as a coolant in high rate forming.
• Stability - Should be unaffected by temperature, oxidation, contamination,
bacteriological attack, etc..
• Reactivity - Should not be corrosive to the dies or workpiece.
• Harmless residues - Should not cause unwanted physical, chemical or
metallurgical changes in the products.
• Application and removal - Should be easy.
21
• Disposal - Should be possible to reclaim some lubricant and easy to treat
effluents.
• Cost - Commercially available at reasonable cost.
• Handling and Safety - Non toxic, non carcinogenic, etc..
• Integrated Approach - As part of the activity of technology.
• Cover the die surface uniformly so that local lubricant breakdown and uneven
metal flow are prevented.
• Be free of residues that would accumulate in deep impressions.
• Develop a balanced gas pressure to assist quick release of the forging from
the die cavity; this characteristic is particularly important in hammer forging, in
which ejectors are not used.
No single lubricant can fulfill all of the requirements listed above; therefore, a
compromise must be made for each specific application. Various types of
lubricants are used, and they can be applied by swabbing or spraying. The
simplest is high flash point oil swabbed onto the dies. Colloidal graphite
suspensions in either oil or water are frequently used. Synthetic lubricants can be
employed for light forging operations. The water-base and synthetic lubricants
are extensively used primarily because of cleanliness.
In addition, no single test method can evaluate all of these characteristics
simultaneously. Therefore, various testing methods exist for evaluation of one or
more lubricant characteristic [4].
4.4 Process conditions and mechanisms of lubricants used in forging
Schey [4] provides a detailed description of lubrication in cold and hot forging
covering different materials such as iron-base alloys, light metals, non-ferrous,
etc. In cold forging the initially entrapped lubricant cushion is sealed at the edges,

22
where a zone of pure boundary contact develops. Thus, lubrication is mixed in
the macroscopic sense, with PHD (Plasto hydrodynamic) conditions in the center
and boundary conditions at the edges. As deformation proceeds, the film thins
out as it follows the expansion of the end face, and roughening of the workpiece
results in a shift toward conventional (microscopic) mixed-film lubrication in the
original PHD zone. At lower speeds of forming, oil-base lubricants are needed
and high viscosity alone can ensure film formation. Adequate viscosity is crucial
in forming of nonreactive metals, and in lubricating the freshly formed end faces
in forging from a bar. If additives are added, care should be taken not to hurt the
dies in the first few contacts when the reactive reactions have not yet taken
place.
Elastic deformation of dies especially flat platens, can help in trapping lubricant
and may be a major source of squeeze-film lubrication. Relubrication by
interrupting upset and by superimposing a vibration on the platen can aid in
replenishing squeeze films. Such films are also formed in plane-strain
compression, but this film is then gradually washed out from the work zone.
In hot forging, workpieces are heated to typical hot working temperatures but
dies are usually substantially colder. Therefore a lubricant not only should ensure
die / workpiece separation and lower friction, but preferably also act as a heat
insulator. Excessive heating of the dies would lead to die damage and wear, and
the lubricant - or its carrier - should also perform a cooling function. High
temperatures at the interface severely limit the choice of lubricant; solid forms
being important. Oxides and scale substitute as lubricants but they are generally
not competitive with layer-lattice substances, and most forging lubricants contain
graphite and Molybdenum sulfide at lower temperatures.
Lubricant breakdown and oxidation are functions of contact time, die and
workpiece temperature, and surface deformation and sliding. Heat transfer
characteristics are also important to prevent die chilling. A thicker oxide is, in
general, a better heat insulator and the reduced heat flow reduces the

23
temperature gradient in the surface layer of the die. Another important function of
the lubricant in hot forging is cooling the die. Aqueous lubricants are the most
effective. With higher forging speeds, flow stress increases because the strain
rate increases, contact time is reduced and cooling is minimized, the time of
exposure of the lubricant to high temperature is reduced and in the presence of a
liquid carrier or carrier residue, squeeze-film effects develop. Die geometry,
temperature, and application method are other factors that influence the selection
of lubrication for hot forging.
4.5 Selection criteria for industrial lubricants
Some of the criterion used for industrial lubricant selection is [14]:
Tooling: What is the die alloy? How hot will it get? How complex is the die?
Workpiece: What is its composition? What is its proper forging temperature?
Forging equipment: Press? Hammer? Type and size/capacity?
Forging sequence: Number and type of die stations? Function of each? Cycle
times?
Lubricant used: Perceived advantages? Disadvantages? Application methods
used.
Lubricants have to be chosen based on the operating temperatures, relative
velocities of workpiece and die, interface pressures, adhesion to the materials
involved and the lubricant regime under these conditions. Therefore lubrication in
hot forging and cold forging are different, the former in the regime of solid-film
and the latter in the regime of mixed-film. Hot forging involves less pressures and
higher temperatures than cold forging. Table 4.1 shows some typical lubricants
used in hot and cold forging. Schey has described extensively different
lubricants, their constituents, application, and etc. [4].

24
A review of cold working lubrication and hot working lubrication is presented by
Male [30]. The types of lubricants and lubrication systems used in cold working
vary with the particular material and the severity of the operation. The basic
lubrication mechanism is, however, of the boundary type in a high proportion of
these processes, although hydrodynamic conditions do exist in some high-speed
operations. In cold strip rolling and wire drawing, water is still used as a coolant
and as a lubricant with some mix of oil. Synthetic emulsions of oil and water are
also being used. In cold working operations, where there is substantial
deformation and surface extension of the workpiece, higher viscosity oils and
appropriate additives are used as the regime tends toward hydrodynamic and
EP. Protective phosphate coatings are used for extremely arduous cold forming
operations.
Historically, for many years lubrication in the majority of hot working operations
consisted of swabbing the tooling with oil or tallow-base concoctions containing
graphite, and the judicious application of a handful of sawdust and water. The
use of glass-type lubricants has ushered a new wave in hot forming lubrication.
4.6 Types of lubricants used in industry
The great variety of processes calls for a yet larger variety of lubricants, and their
operative mechanisms are best discussed according to workpiece temperature,
starting with the simpler cold forging mechanisms and progressing to the
complexities introduced by higher temperatures. A brief review of the different
lubricant types used and their application in the different lubrication regimes and
forging processes is presented.
4.6.1 Oil-base lubricants
Mineral oils obtained from the distillation of crude oils (or their synthetic
equivalents) provide the base for many well-established industrial lubricants.
Their viscosity is usually chosen to assure predominantly hydrodynamic
lubrication at the existing velocities, pressures, temperatures, and during plastic
25
deformation even in cold working, and this leads to a reduction in their viscosity,
counterbalanced by the usually exponential increase in viscosity with pressure.
Above some critical pressure, oils become solids and behave as a polymer film
would.
In cold working, lubrication is mostly of the mixed-film type and additives are
almost invariably incorporated to protect against direct metal-to-metal contact at
asperities. The types of additives depend on the workpiece and die compositions
and on the severity of the operation. Different additives enable use of oil-base
lubricants for boundary and EP regimes over a wide temperature and pressure
range. Natural oils, fats, etc. offer a wide range of viscosity, relatively low
solidification pressures, and usually also contain some free boundary agents.
When their viscosity is too high, they may be deposited from a volatile solvent as
is done with lanolin in the coating of Al slugs for cold extrusion. All oils ignite at
their flash point and while the residue may lubricate, especially if the oil contains
additives, the resulting pollution is objectionable and has led to a diminishing use
of oil-base lubricants for hot-working processes.
4.6.2 Aqueous lubricants
Water, although the best coolant has too low a viscosity for lubrication. With
chemicals added for corrosion protection, it is still used for its cooling qualities in
the hot rolling of steel where iron oxide acts as the lubricant. However, hot rolling
of nonferrous metals and all cold-working operations are conducted with
emulsions in which water serves as the carrier for an oily phase, dispersed with
the aid of emulsifiers. Technical, economic, and ecological consideration demand
that aqueous lubricants be circulated in a system that has filters for the removal
of debris, etc.
4.6.3 Soaps and greases
Soaps are the reaction products of a metal hydroxide with a fatty acid. With the
exception of alkali metal soaps they are water-soluble. At high pressures and

26
shear rates they behave as Non - Newtonian substances and are capable of
forming thick lubricant films, as in the dry drawing of steel wire. Their apparent
viscosity decreases with temperature. Thus friction first decreases, but after
reaching a minimum at around 4000 F, it increases because of increasing
boundary contact. Greases with boundary, EP, and lamellae additives are used
when process conditions are not favorable for establishing a thick enough
lubricant film with an oil or emulsion.
4.6.4 Solid films
Soft metal films are still used when the base metal cannot be effectively
lubricated. The coating is chosen for its low shear strength, high ductility, good
adhesion to the base, reduced adhesion to the die and improved reactivity with
the lubricant. Molten glass films may act simply as low-shear-strength films (as in
the hot forging of titanium), as gradually melting films (as in hot extrusion of steel
and Ti and Ni based alloys), or as hydrodynamic agents (as in hot extrusion with
predeposited films). Layer-lattice compounds are the only alternative to glass in
hot forging. Graphite and MoS2 based lubricants may be used but the difficulty is
in depositing a uniform and continuous film and as they do not spread easily they
need a carrier.

27
4.7 Table 4.1: Typical Lubricants Used In Cold Working And Representative Coefficients Of Friction
Process Steel µµ
Stainless Steela,Nickel basec µµ
Titaniumb
µµCopper,c
Brass µµAluminum,Magnesiumd µµ
Rolling FO 0.03FO - EM 0.07(FO - MO) 0.05
GL - MOe 0.07GL-FO-EM 0.10
FO-MO 0.10SP 0.10
FO-MO(10-50) 0.03FO-MO-EM 0.07
1-5% FA-MO 0.03(Synthetic MO)
Extrusion
Light EP - MO 0.10 GL-MO 0.10 SP or GR grease onfluoride-PH 0.05
FO-MO 0.10 Lanolin 0.05
SevereSP on PH 0.05MoS2 + SPon PH 0.05
SP onoxalate 0.05
GR-FO 0.05GR-grease 0.05
Zn Stearate 0.05SP on PH 0.05
EP - MO 0.10 EP-MO 0.10 As extrusion FO 0.05 FO 0.05Forging
Light
Severe SP on PH 0.05 GL-MO 0.10SP on oxalate 0.05
SP 0.05 Lanolin 0.05
Typical Lubricants Used In Hot Working And Representative Coefficients Of Friction
Process Steel µµ
Stainless Steel,Nickel base µµ
Titanium µµ
Copper,Brass µµ
Aluminum,Magnesium, µµ
RollingNone STa
(GR suspension)c 0.20(MO-FA-EM) 0.20
As Steel As Steel MO-FA-EMb 0.20 MO-FA-EM 0.20
Extrusion GL 0.02(GR) 0.20
GL 0.02 GL 0.02 None ST(GR) 0.20
None ST
Forging None STGR 0.20
GR 0.20 GL 0.02MoS2 0.10
GR 0.10-0.20 GR 0.10-0.20MoS2 0.10-0.20
a The symbol ST indicates sticking frictionb Hyphenation indicates that several components are used in the lubricantc Less frequent lubricant usage is shown in parenthesesd Interface pressures can be very high, and sticking may occur even if µµ is low
EM - emulsion; the listed lubricants are emulsified and 1-5% is dispersed in waterFA - fatty acid, alcohol, amines, estersGL - glass (sometimes in conjunction with GR on the die)GR – graphiteMO - mineral oil

28
CHAPTER 5
FRICTION TEST METHODS
5.1 Principles of friction testing
Tribology in metalworking is most reliably studied, and lubricants are best
evaluated and developed, in an actual production situation. Full-scale trials
interrupt production and especially if a lubricant fails, may carry an exorbitant
price tag because the product is ruined. Also, uncontrollable and often
unrecognized variables may creep into the evaluation. Therefore, a great deal of
effort has been expended in attempts to develop laboratory tests that are,
hopefully, less expensive and easier to control and evaluate while still retaining
their relevance to production. Alan T. Male has presented [16,30,31] several
discussions on ring tests, lubricant requirements and evaluation. From the
discussions on testing, the tests may be evaluated based on their ability to:
• be used for different temperature ranges
• ease of testing
• exposure of fresh surfaces to closely imitate real forming problems
• produce the required range of pressures as in real practice
• provide sufficient sensitivity to friction factor change in value
• represent different lubrication regimes presented earlier
• simplicity and methods for generating analytical curves
• effects of material, rates, speeds, relative motions, etc. to be depicted
There has been extensive literature on testing, testing methods, applications
based on material, temperature range, etc. The tests are conducted under
controlled conditions, sometimes with elaborate measuring devices. Several

29
correction factors need to be applied to test results such as accounting for
barreling, deflections of equipment, heat loss, etc. Analysis methods may not
precisely duplicate test conditions [16] to provide the comparative calibration
curves. The friction models (shear factor, friction factor, etc.) also do not
represent friction conditions for all ranges of pressure, temperature, and
lubrication regimes.
However, a knowledge of the different lubrication regimes, lubrication test
methods, their limitations and scope, the requirements for a lubricant and a good
understanding of the tribology and requirements of the application under
consideration, enables one to judiciously select the required lubrication.
"Periodically, a test method emerges with some claims to universality, only to fall
into disrepute as experience accumulates. Considering the complexity of the
system it is clear that there is no universal test that will be found. The best that
one can hope for is to establish tests that simulate particular aspects of the
systems and then select a group of these tests that will provide adequate
coverage of all aspects of importance" [4].
5.2 List of commonly used test methods
5.2.1 The ring compression test
Lubricity is a means of expressing friction between the workpiece and the die. It
is a property of the lubricant and is defined by the friction factor f, or the shear
factor, m. It is most commonly measured by using the ring test [16,17]. In the ring
test a flat ring-shaped specimen is compressed to a known reduction (fig. 5.1).
The change in internal and external diameters of the forged ring is very much
dependent on the friction at the tool/specimen interface. If friction were equal to
zero, the ring would deform in the same way as a solid disk, with each element
flowing radially outward at a rate proportional to its distance from the center. With
increasing deformation, the internal diameter of the ring reduces if friction is high
and increases if friction is low. Thus, the change in the internal diameter
represents a simple method for evaluating interface friction.

30
The ring test has an advantage when applied to the study of friction. In order to
measure friction with this test, the force necessary to deform the ring and the flow
stress of the specimen material do not have to be known. Thus evaluation of test
results is greatly simplified. Several theoretical analyses are available to obtain
the magnitude of the friction factor from the experiment [15,18,19].
(a)
(b)
Fig. 5.1 The ring compression test: (a) schematic of metal flow; (b) E.g.: rings upset to
various reductions in height (Altan et. al., 1983) [2]
In one of the analysis [15] a computer program has been developed for
mathematically simulating the metal flow in ring compression with bulging. From
the ring dimensions at various reductions in height, the results are plotted in the
form of "theoretical calibration curves" as shown in fig. (5.2).
Fig. 5.2 Theoretical calibration curves for upsetting rings having indicated OD: ID
thickness ratio [2]

31
Table 5.1 Values of frictional shear factor, m, obtained from ring tests conducted in a
mechanical press (temperature of the dies = 3000 F, surface finish = 25 micro - in.) [2]
In determining the value of the shear factor, m, for a given experimental
condition, the measured dimensions are placed on the appropriate calibration
curve. From the position of that point with respect to theoretical curves given or
various values of m, the value of the shear factor, m, which existed in the
experiment, is obtained. Table 5.1 shows the results of tests conducted [17] for
various materials. Ring tests can be used to measure m conveniently at the high

32
temperature and strain rate typical of hot working processes. If the deformation
pressure is measured during compression it is possible to calculate the flow
stress as well [20]. Ring tests have been used for porous materials also [9]. Misra
et al [21] have used the ring test on different lubricants for warm and hot forming
operations of Inconel 718, 625, and Ti-6AL-4Va and have used the results in
selection of lubricant for warm-working of sheet metal.
5.2.2 Plane-strain drawing tests
A flat bar or strip of thickness ho is drawn between inclined die surfaces to a
thickness hi. The strip is free to spread to the side, and lubricant can escape in
that direction too. The converging gap may be produced by two rollers fig. 5.3(a)
and the strip drawn first with rolls freely rotating and then with rolls clamped. The
difference in measured draw forces is approximately equal to the frictional force.
By keeping the rolls clamped, but measuring the separating force S, as well as
the draw force P, an average coefficient of friction can be calculated using
simplifying assumptions [24]. An advantage of this test is that the strip need not
be pointed as the dies can indent it before commencing the test. Also new
surfaces are generated by means of deforming the specimen through its entire
thickness.
Wedge-shaped dies are also used with various ingenious design solutions; one
such is shown in figure 5.3(b). Other devices by Kudo et. al. and Wilson and
Cazeault are described in [4].
The devices enable reducing errors due to elastic deflections, varying reductions
that can be taken with dies at different angles, thereby evaluating lubricant and
material parameters simultaneously, and providing for varying interface
pressures figure 5.3(c).
Figures 5.4(a) through 5.4(d) show other proposed test methods for evaluating
forging lubricants [4]. Forging of a rectangular slab between inclined die surfaces

33
results in a shift of the neutral plane toward the converging side and an increased
material flow toward the expanding side.
This principle is widely utilized when material movement in a certain direction is
desired. It is also suitable for lubricant evaluation, because the position of the
neutral plane depends not only on the angle of inclination but also on frictional
resistance figure 5.4(a), just as it does in rolling. A better lubricant allows more
material flow in the widening direction, and lubricants can be ranked by simply
observing flow, or by determining average external µ or m values from an
appropriate theory.
Fig. 5.3 Plane strain drawing (a) between rolls (b) with low-friction die supports and (c)
with a deflecting die frame and provision for push - pull operation. [4]
Figure 5.5 shows tests involving one-sided reduction subjecting the two faces to
different conditions. When the die set is composed of one flat and one angled
surface figure 5.5(a), an approximate coefficient of friction can be derived at least
for small die angles simply from the ratio of pull force to die separating force. The
arrangement in figures 5.5(b) and 5.5(c) reduce alignment errors.
In yet other variations of plane-strain drawing, the strip is wrapped around a
punch that constitutes the flat die surface (figure 5.6). Variations of this method
are shown in figures 4.6(b) and 4.6(c). Figure 5.7 shows another plane-strain
drawing test configuration and its variation by Sachs [23]. Further details on
these tests are included in [4].

34
Other tests that generate new surfaces while sliding under high normal pressures
that serve to break through surface oxide films are shown in fig. 5.8. In one group
of tests the specimen is upset [24], in another group the specimen is pushed (fig.
5.8(c)) [25] or drawn (fig. 5.8(d)) [26] through a converging die gap. In the third
group of tests indenting the workpiece (fig. 5.9) generates the new surface. [4]
Fig. 5.4 Proposed test method for evaluating lubricants [4]
Fig. 5.5 Plane - strain drawing with one - sided reduction [4]
Fig. 5.6 Plane - strain drawing over a stationary punch [4]

35
Fig. 5.7 Pulling (a) and pushing (b) in plane strain [4]
Fig. 5.8 Simulating tests with bulk deformation: (a) and (b) Upsetting with sliding. (c)
Pushing through. (d) Flat bar drawing [4]
The above tests however may be good for studying lubricants used in machining.
5.2.3. Back extrusion test
Back extrusion is particularly sensitive to lubricant depletion under the punch and
is often used as a small-scale test. Punch force P, normal force S and frictional
force F are measured in a plane strain condition to determine the effect of
process variables (fig. 5.9).

36
Fig. 5.9 Back extrusion test (plane strain) [27]
5.2.4 Bucket test
A circular billet is backward extruded to form a "bucket". The surface area of this
part increases significantly during forging making it a good test for the lubricant's
ability to move material. The bucket tests were conducted and the results
detailed in [28]. The part does not comply as an axisymmetric or plane strain
part. Both approximations were attempted on the appropriate sections of the
forging and 2-D metal flow analysis conducted using ‘ALPID’. Figs. 5.10, 5.11
show variation of loads and bottom thickness for different lubricants. The
thickness of the bottom of the bucket with respect to stroke represents the ease
of metal flow up the bucket walls for different lubricants. The bucket test provides
a more complex geometry to evaluate friction with (versus simple ring tests).
Higher pressures are encountered in the bucket test compared to the ring test.
The correlation of experimental results with FEM analysis with axisymmetric or
plane-strain assumptions are questionable. Also FEM analysis of bucket
geometry requires remeshing.

37
Fig. 5.10 Comparison of the final forging load in Bucket tests [28]
Fig. 5.11 Comparison of the final bottom thickness in bucket tests [28]
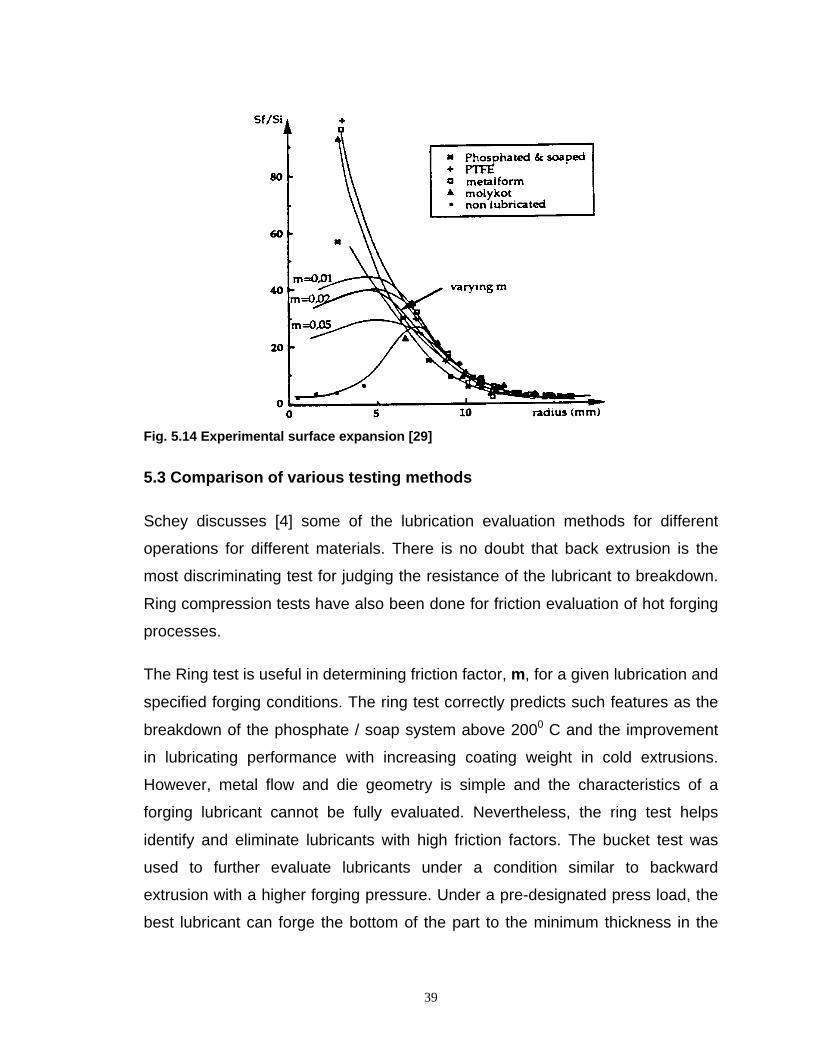
5.2.5 Cold forging test- (cetim-forgelube test) [29]
Figure 5.12 shows the set-up of the above test. The forging operation is a non-
symmetrical upsetting (heading). The slug surface is lubricated and pressed
against a flat plate the roughness of which is tightly controlled and maintained
constant. It is pressed through a cavity that is lubricated.
In the second step the head of the upset workpiece is rotated upon two bearing
balls. Balls are locked in rotation. The test goes on until lubricant film breaks
down. The load and rotation speeds remain constant.

38
The variation of the surface expansion of the head as well as the strain
hardening of the material represent friction conditions during the test. Figure 5.13
represents FEM simulation of heading used to determine calibration curves.
Figure 5.14 shows experimental surface expansion versus varying m. The
second part of the test covers issues of lubricant and specimen tool surface
(tribological test).
Fig. 5.12 CETIM - FORGELUB Friction test [29]
Fig. 5.13 FEM Simulation [29]
39
Fig. 5.14 Experimental surface expansion [29]
5.3 Comparison of various testing methods
Schey discusses [4] some of the lubrication evaluation methods for different
operations for different materials. There is no doubt that back extrusion is the
most discriminating test for judging the resistance of the lubricant to breakdown.
Ring compression tests have also been done for friction evaluation of hot forging
processes.
The Ring test is useful in determining friction factor, m, for a given lubrication and
specified forging conditions. The ring test correctly predicts such features as the
breakdown of the phosphate / soap system above 2000 C and the improvement
in lubricating performance with increasing coating weight in cold extrusions.
However, metal flow and die geometry is simple and the characteristics of a
forging lubricant cannot be fully evaluated. Nevertheless, the ring test helps
identify and eliminate lubricants with high friction factors. The bucket test was
used to further evaluate lubricants under a condition similar to backward
extrusion with a higher forging pressure. Under a pre-designated press load, the
best lubricant can forge the bottom of the part to the minimum thickness in the
40
bucket test. Oil base and water-base lubricants used in the test behaved
differently. Shen, et. al. [28] proposed an approach to generate friction calibration
curves for bucket type of forging instead of evaluating relative performance of the
lubricants.
In a ring test, the forging load and the I.D. (inner diameter) of the ring are
influenced by friction but only the I.D. is considered in friction calibration, as the
former is not a friction sensitive parameter. However, in a bucket test the forging
load and the bottom thickness can be chosen together to represent friction. Also
an axisymmetric bucket is proposed for the test for ease of evaluation by analysis
methods.
Another advantage claimed with the bucket test is that the load and bottom
thickness can be obtained without stopping the test. Thus the experimental
friction value at any specific stage can be obtained after the test. The factoring of
load and bucket bottom thickness as a friction evaluation parameter is empirical.
However, work hardening has a major effect on results. The bucket-test is
material dependent.
For various forming conditions, the values of m vary as follows: [1]
• m = 0.05 to 0.15 in cold forming of steels, aluminum alloys and copper, using
conventional phosphate-soap lubricants or oils.
• m = 0.2 to 0.4 in hot forming of steels, copper and aluminum alloys with
graphite-base (graphite-water or graphite-oil) lubricants.
• m = 0.1 to 0.3 in hot forming of titanium and high-temperature alloys with
glass lubricants.
• m = 0.7 to 1 when no lubricant is used, e.g., in hot rolling of plates or slabs
and in nonlubricated extrusion of aluminum alloys.

41
Therefore the testing method must be sensitive in the ranges of friction factors
that normally occur in cold and hot forming to be applied for lubrication evaluation
in that particular process (hot or cold). In determining the friction factor, f, or the
shear factor, m, for hot forming, in addition to lubrication effects, the effects of die
chilling or heat transfer from the hot material to colder dies must be considered.
Therefore, the lubrication tests used for determining friction factors must include
both lubrication and die-chilling effects. Consequently, in hot forming, a good test
must satisfy as much as possible the following requirement [2]:
• The specimen and die temperatures must be approximately the same as
those encountered in the actual hot forming operation.
• The contact time between specimen and tools under pressure must be
approximately the same as in the forming operation of interest.
• The ratio of the new generated deformed surface area to the original surface
area of the undeformed specimen must be approximately the same as in the
process investigated.
• The relative velocity between deforming metal and dies should have
approximately the same magnitude and direction as in the forming process.
As long as the evaluation method can be performed at cold and hot working
temperatures, are able to handle the different lubrication systems, account for
heat transfer, die chilling and different friction ranges at the hot forming
temperatures, it may be applied to evaluate friction for both processes.
Therefore, some methods may be preferred in cold to hot forging and vice-versa.
In general, friction evaluation methods at high temperatures need to maintain the
die and workpiece at the hot working temperatures or appropriately compensated
by analysis methods for heat loss, temperature gradients etc. Ring tests, upset
tests, compression tests, etc. can be performed to evaluate lubricants both for
hot and cold forging but the choice is made based on factors discussed.

42
In most forming applications, the lubricity of a lubricant is the single most
significant factor since it directly determines the interface friction, which in turn
influences the stresses, the forming load and energy. In order to evaluate the
performance of various lubricants and to be able to predict forming pressures, it
is necessary to express the interface friction quantitatively, in terms of a factor or
coefficient [15].

43
CHAPTER 6
DOUBLE CUP BACKWARD EXTRUSION TEST
6.1 Purpose of test
The objective of the double cup backward extrusion test is to establish a
correlation between the ratio of the extruded cup-heights to the friction conditions
between the billet surface and the punch and die container. The friction
conditions at the workpiece - die container interface is expressed as a number
known as the friction factor m which varies between 0 and 1. If such a correlation
can be established, then the existing friction conditions can be quantified. The
goal of the double cup backward extrusion test method is to:
1. determine a friction factor using experiments on the one hand and
appropriate calibration curves (determined by computer - aided metal-
flow simulations) on the other
2. provide information on the quality of a lubricant coating from a
production coating line using workpieces from that line and
3. compare various lubricants
This particular test method was chosen because it provides an effective means
of measuring friction in cold forging operations. The concept was initially explored
by Dr. Taylan Altan from Ohio State University and Dr. Klauss Weinmann [33]
from Michigan Technological University. The test method has the additional
advantage of measuring friction with a technique that closely simulates cold
forging conditions at Delphi Saginaw Steering Systems, which are:
• time of contact between the workpiece and the die under pressure
• amount of new surface generation
• simultaneous backward and forward extrusions

44
• high forming pressures
Conditions encountered in industrial production are therefore closely reflected by
this test method i.e. high surface pressure, severe material flow, substantial
surface enlargement, etc.
6.2 Theory of double-cup backward extrusion test
In this test, the top punch is moved downwards, while the bottom punch and the
die are kept stationary. The reduction ratios are the same for both the top and the
bottom extrusion dies. Additionally, the diameters of the punch and the anvil are
the same. The billet is placed in the die container. The billet extrudes
simultaneously in the backward and forward directions as shown below in fig.
6.1.
Fig. 6.1 A geometric representation of the test set up.
If the friction conditions between the die wall and the billet were to be zero,
the length of the forward extrude would be equal to the length of the
backward extrude. However, due to friction, the backward extruded cup is
longer than the forward extruded one. The difference in the extruded lengths
becomes larger as the friction increases.
PUNCH (top)
WORKPIECE
ANVIL
DIE
45
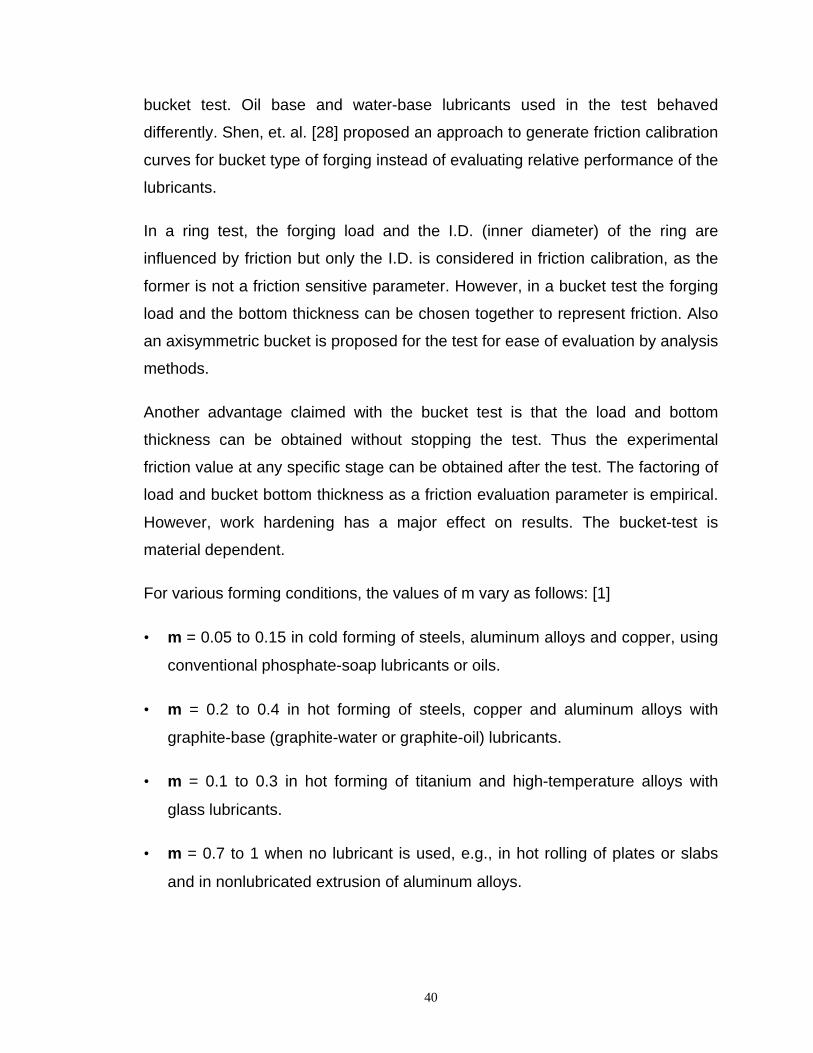
In this study, the friction shear factor m was chosen for characterization of friction
because it represents the friction conditions in forging, where the interface
stresses are large, better than the Coulomb law.
Fig. 6.2 The billet / workpiece before and after deformation
Furthermore, the m value is very common in USA. Therefore, any results from
the test could easily be compared with other methods or data. Shown in fig. 6.2 is
a sketch of the billet before and after the test. The height h1 and h2 is measured.
S Hi
h1
h2
Upper Punch(moving)
Lower Punch(stationary)

46
The ratios are calculated and tabulated for a given lubricant type and relative
stroke.
The ratios of the cup heights are then plotted against the relative stroke. This plot
is then calibrated against a graph generated by computer simulations of the
process with varying values of m. The simulation plots cup - height - ratios (CHR)
for incremental values of stroke. Many such curves are generated for different
values of friction conditions (friction factor m) in the simulation. The CHR
obtained from the experimental results are then be compared with these plots to
determine the friction factor m. A higher value of the CHR denotes a higher
friction condition and therefore poor lubricity of the coating.
Each curve in the calibration curves generated from the FEA simulations reaches
a maximum after the initial increase. With increasing percentage deformation
(deformation stroke of the punch), the magnitudes of initial peaks decrease. This
is attributed to the fact [33] that the peak coincides with the punch stroke that
provides the lower cup height close to the length of the extrusion land on the
lower punch (anvil). As the top surface of the lower cup passes through the
space between the punch land and the die insert, the resistance to metal flow in
the lower cup increases, compared to that of the upper cup. This transitional
behavior of the cup heights is dependent on the length of the extrusion land.
6.3 Design of experiment
The main task for this effort is to find a combination of process parameters that
would best indicate a small change in the lubrication conditions. The friction
conditions might change towards the end of the deformation due to thinning of
the lubrication layer, but this effect can be neglected if the punch does not move
very deep into the workpiece.
• Relative stroke is defined as the ratio of the amount of travel of the punch
(after making contact with the workpiece) to the initial height of the workpiece
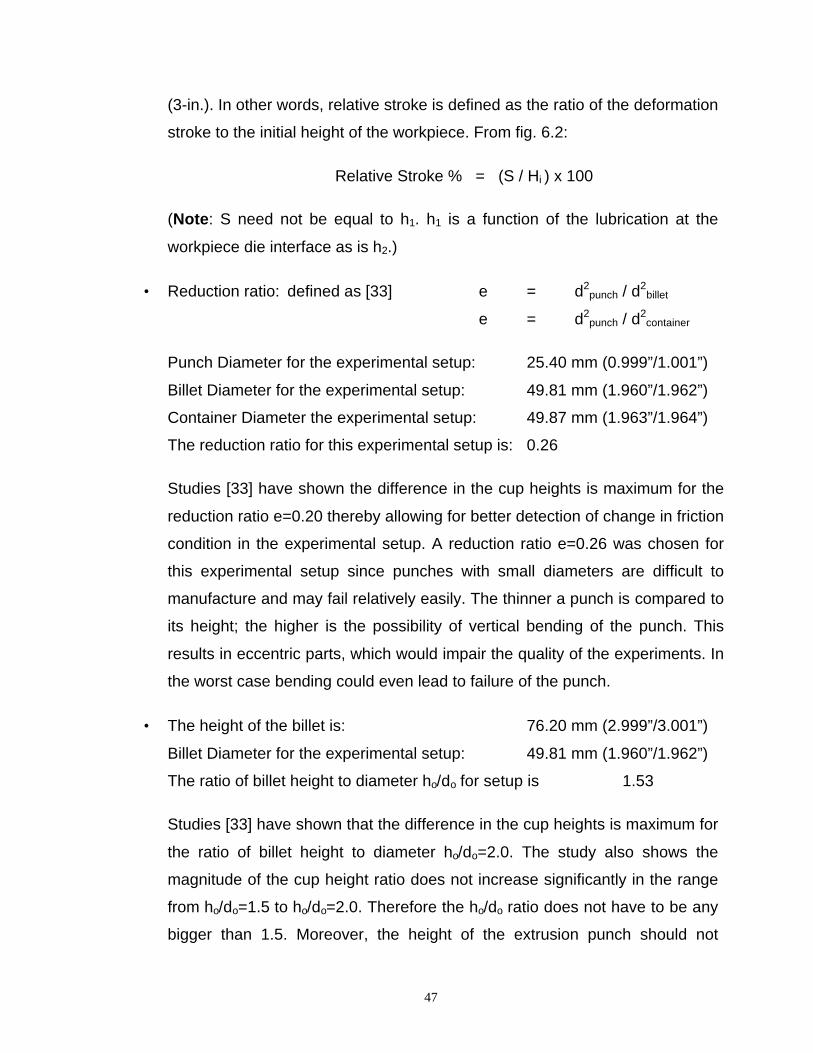
47
(3-in.). In other words, relative stroke is defined as the ratio of the deformation
stroke to the initial height of the workpiece. From fig. 6.2:
Relative Stroke % = (S / Hi ) x 100
(Note: S need not be equal to h1. h1 is a function of the lubrication at the
workpiece die interface as is h2.)
• Reduction ratio: defined as [33] e = d2punch / d
2billet
e = d2punch / d
2container
Punch Diameter for the experimental setup: 25.40 mm (0.999”/1.001”)
Billet Diameter for the experimental setup: 49.81 mm (1.960”/1.962”)
Container Diameter the experimental setup: 49.87 mm (1.963”/1.964”)
The reduction ratio for this experimental setup is: 0.26
Studies [33] have shown the difference in the cup heights is maximum for the
reduction ratio e=0.20 thereby allowing for better detection of change in friction
condition in the experimental setup. A reduction ratio e=0.26 was chosen for
this experimental setup since punches with small diameters are difficult to
manufacture and may fail relatively easily. The thinner a punch is compared to
its height; the higher is the possibility of vertical bending of the punch. This
results in eccentric parts, which would impair the quality of the experiments. In
the worst case bending could even lead to failure of the punch.
• The height of the billet is: 76.20 mm (2.999”/3.001”)
Billet Diameter for the experimental setup: 49.81 mm (1.960”/1.962”)
The ratio of billet height to diameter ho/do for setup is 1.53
Studies [33] have shown that the difference in the cup heights is maximum for
the ratio of billet height to diameter ho/do=2.0. The study also shows the
magnitude of the cup height ratio does not increase significantly in the range
from ho/do=1.5 to ho/do=2.0. Therefore the ho/do ratio does not have to be any
bigger than 1.5. Moreover, the height of the extrusion punch should not
48
exceed 2.5 times its diameter to prevent failure. The unsupported height of
the punch used for this experimental setup is 1.742” and its diameter is
1.000”. This causes a limitation to the punch travel for the chosen geometry.
The stroke of the upper punch should be less than 35mm for a reduction ratio
of e=0.25. To be thorough, punch strokes up to 30mm have been
investigated. Since for ho/do=2.0 the workpiece is not deformed sufficiently
with this limited punch travel, m-value variations have been examined for
ho/do ratio = 1.53 for this experimental setup.
• Tooling set-up and dimensional details of the individual pieces of perishable
tooling are shown in appendix D. The tooling design is based on principles of
die design as outlined in Verson’s book on Impact Machining [31]. The
backward extrude punch and anvil designs are based on studies conducted
by Altan et. al. in their publication on design parameters effecting the punch
and anvil in the double backward extrusion of aluminum and steel [33].
• Three different percentages (30%, 40% and 50%) of relative stroke are
employed to reduce the height of the billets. Six billets are used for each
lubricant and relative stroke combination. This is done to obtain more
repeatable results and also determine the statistical variance.
Two companies that manufacture industrial lubricants were also invited to
participate. The companies are IRMCO and Acheson Colloids. The research and
development departments from both companies have developed cold forging
lubricants which are seen as an alternative to the acid pickling and coating
process that is currently in place. A list of coatings is shown in the table below.
Eleven different coatings are tested and evaluated. While the coatings “Fitch”,
“Karst”, “Black lubricant” and Polymer are applied in house using current coating
processes that are used in production, the coatings from the companies IRMCO
and Acheson Colloids were coated on the outside by the companies themselves.
The billets for all these coatings, however, are provided for by Delphi Saginaw
Steering Systems.

49
• The FITCH and KARST coatings are the regular phosphate coatings that are
typically used in cold forging applications. These two coatings get their unique
names from the two coating lines in Plant 4, Delphi Saginaw Steering
Systems.
• “Black lubricant” is a non-reactive lubricant used at Plant 5, Delphi Saginaw
Steering Systems. The Mn stearate soap applied on the Zn phosphate
surface does not react with it. The polymer coating is a lubricant applied over
the Zn phos coat.
• IR-1, IR-2, IR-3 & IR-4 are coatings from the company IRMCO. While IR-1 &
IR-2 are coatings that were deposited on a surface that had been phos
coated, coatings IR-3 & IR-4 were lubricants deposited on surfaces that had
no phos coat.
• AC-1, AC-2, AC-3 are coatings from the company Acheson Colloids.
SL. # PLANT No. COATER TYPE / I.D.
1 4 FITCH
2 4 KARST
3 5 BLACK LUBE
4 5 POLYMER
5 IRMCO IR-1
6 IRMCO IR-2
7 IRMCO IR-3
8 IRMCO IR-4
9 ACHESON COLLOIDS AC-1
10 ACHESON COLLOIDS AC-2
11 ACHESON COLLOIDS AC-3

50
6.4 Description of apparatus
The tests are conducted on a 1000-Ton vertical acting mechanical press. The
manufacturer of the press was USA Clearing Ltd. The press specifications are
given below:
Press Specifications
SSG # 45933 Model # F-1 Serial # 17352
Style S-1 Bed (LR) 42” Size (FB) 42”
Shut height 44.0” Stroke length 20” Strokes/min 45
Tonnage 1000 T
Shut Height of a press is defined as the distance between the bottom of the ram
of the press and the top of die bed.
Stroke length of a mechanical press is defined as the distance between the “Top
dead center” and the “Bottom dead center” of the press.
6.5 Method of determining and setting the ram stroke
The stroke of the press ram can be adjusted by electrically turning the worm
which in turns the threads on the slide thus increasing or decreasing the length of
the pitman. A button on the control panel of the press activates a motor that turns
the worm. The amount of travel is shown on the ram shut height counter that is
located on the slide of the press. The counter is calibrated to the thousandths of
an inch. The line diagram of this set - up is shown in the fig. 6.3.
The three levels of relative stroke to obtain the deformation percentages (30%,
40% and 50%) for experiments are obtained by lowering the ram in steps by
turning the worm as mentioned before. The exact amount of descent of the ram
is verified both on the ram counter as well as the distance traveled by affixing an
indicator to one of the guide pins of the press.

51
Fig. 6.3 Assembly diagram of press ram shut height adjustment
6.6 Friction test Procedure
The experimental procedure can be classified into the following categories:
1. Preparations prior to the test
2. Procedure for each test run
3. Quality control and adjustments after each run

52
Fig. 6.4 Billet dimensions for the double-cup backward extrusion friction tests
6.6.1 Preparations prior to the test
6.6.1.1. Design of experiment and Procurement of designed tooling
• The perishable tooling in contact with the workpiece was designed and
ordered from the fabrication source. The prints of the tooling designed and
ordered are enclosed in Appendix C.
• The designed tooling was received and inspected against the prints and
found to be acceptable
• Diameter of the punch = 1.000 ± 0.001”
Material: SAE 8720Turn O.D. to the reqd. dim.Saw to length from 15’ bars andturn billet ends to specifiedtolerance.Anneal billets at 1325°° F for 8 hrs.
φ = 1.961 ± 0.001”
3.000 ± 0.001”

53
• Diameter of the anvil = 1.000 ± 0.001”
• Diameter of the container = 1.9635”
6.5.1.2. The billet manufacturing and annealing process
The tests were conducted using annealed cylindrical billets of ASTM 8620 steel.
The dimensions of the billet are as shown in figure 6.4.
• The test plan / design of experiment was completed. Number of billets of steel
required for testing was determined. The test plan is as shown in table 6.1.
• 14 - 16 feet long hot rolled bars of 8620 steel were procured from steel
supplier (Republic Steel Co.).
• Procured Bars were 2.5” in diameter.
• Bars were sawn and CNC machined down to 3” ± 0.001” in length.
Thereafter, the diameters were turned down to 1.961” ± 0.001”.
• The sawn billets were then annealed through cycle of 1325° ± 10° for 8 hours.
This annealing cycle is used for processing billets used in production.
• Predetermined number of billets were put in enclosed baskets and processed
with regular production billets through both the Fitch and Karst coater in plant
4. Similarly, billets were processed through the “pickle house” (the coating
department) at plant 5 and coated with the Conventional (“Black lubricant”)
coating and the Polymer coating.
• Billets were sent to Acheson Colloids and IRMCO to have them apply their
coatings. They were provided instructions on the number of billets required
with each formulation of their coating. The method of application was not
standardized.
• Detailed charts were drawn up to capture the order of the experiments and
the lubricant type used on each billet of material. Chart is shown in Appendix

54
• The tooling was pre-assembled into the compression rings to facilitate the
assembly of tooling in the press and reduce time lost on press.
6.6.1.3. The billet coating process on site
The typical steps involved in phosphate coating at the plants at Saginaw include
the following steps:
• Clean the surface to remove rust, anneal scale, soap lubricants, other foreign
soils, etc. with an alkaline cleaner
• Rinse the above alkaline cleaner with hot water to prevent contamination of
the subsequent baths
• Pickle the steel in sulfuric acid baths maintained at an elevated temperature
(150° F) for a few minutes to remove any leftover hot-rolled mill scale and any
oxides of iron.
• Rinse in cold water
• Rinse immediately in hot water
• Deposit the phosphate coating through a chemically reactive process. The
phosphate coating forms a covalent bond with the iron surface.
• Rinse in cold water
• Neutralize the acidic surface from the previous phosphating bath
• Apply the necessary lubricant (black lubricant, synthetic, stearate, etc.)
• Dry
6.6.2 Test procedure for each run
• The deformation stroke was calculated using Aluminum test pieces ordered
specifically for this. Eight pieces were used to set-up. The ram was very
slowly lowered until it just touched the top of the billet surface and then the
press was run on automatic. Once the starting point was established,
subsequent increases in relative stroke was adjusted by electrically turning

55
the worm wheel as described before. As an additional check, the amount of
travel on the vertical guide pins of the press were also observed and noted
down.
• The set up was repeated to ensure that start of relative stroke was accurate.
• The coated billets were manually loaded into the die cavity and the press
operated by the plant’s press operator. Six billets were loaded into each
experimental set up combination of relative stroke and coating one after the
other to ensure repeatability. After each extrusion the punch, anvil and die
container was examined visually to ensure that there was no “pickup” or
galling.
• The order of the test was carefully noted down and the now extruded double
cup marked with permanent ink immediately after ejecting it from the die for
future reference for checking the cup height ratios. The table into which the
experiment number that was recorded on the billet is shown in Appendix A.
• Occasionally, the top punch would gall indicating breakdown of lubricant
between the punch and the workpiece. This happened especially at higher
percentages of deformation and with the experimental coatings from the
outside suppliers.
• Those coatings that caused galling on the punches were discontinued from
the test in order to ensure that the punch and the anvil could be used for the
remaining coatings. When galling occurred, the punch was polished with
emery paper to remove the galling.
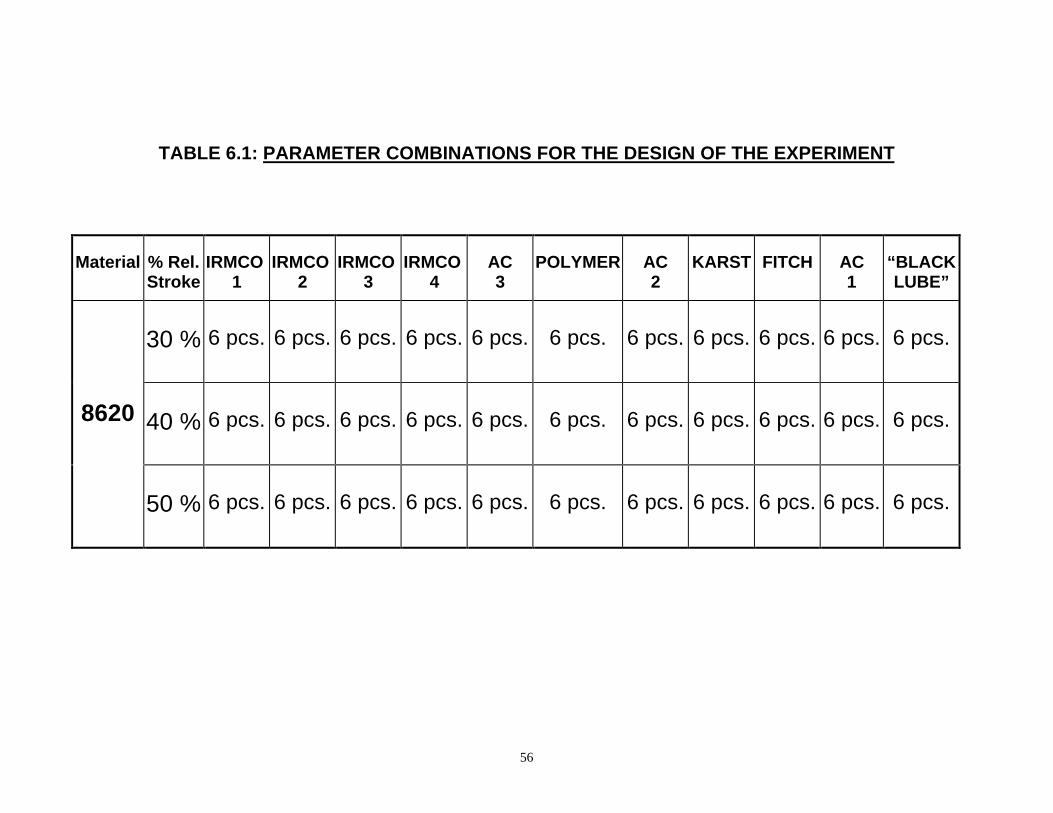
56
TABLE 6.1: PARAMETER COMBINATIONS FOR THE DESIGN OF THE EXPERIMENT
Material % Rel.Stroke
IRMCO1
IRMCO2
IRMCO3
IRMCO4
AC3
POLYMER AC2
KARST FITCH AC1
“BLACKLUBE”
30 % 6 pcs. 6 pcs. 6 pcs. 6 pcs. 6 pcs. 6 pcs. 6 pcs. 6 pcs. 6 pcs. 6 pcs. 6 pcs.
8620 40 % 6 pcs. 6 pcs. 6 pcs. 6 pcs. 6 pcs. 6 pcs. 6 pcs. 6 pcs. 6 pcs. 6 pcs. 6 pcs.
50 % 6 pcs. 6 pcs. 6 pcs. 6 pcs. 6 pcs. 6 pcs. 6 pcs. 6 pcs. 6 pcs. 6 pcs. 6 pcs.

57
CHAPTER 7
FINITE ELEMENT ANALYSIS OF DOUBLE CUP BACKWARD
FRICTION TEST
7.1 Introduction
The biggest challenge to applying FEA to metal forming problems is setting up
the conditions, preparing the mesh and then applying the boundary conditions.
Thereafter, the problem is in interpreting the results to optimize the shape of the
workpiece and the dies.
Generic steps in the Finite Element Method
1. Start with the preform in contact with one or more dies.
2. Approach the other dies until first point is touched.
3. Initialize the problem.
4. Calculate the velocity field.
5. Choose the time increment.
6. Update positions, strains, strain-rates
7. Update boundary conditions
8. Force sliding nodes onto surface
7.2 Procedure for setting up simulation along with parameters used
The ANTARES software package is installed on a HP C-10 UNIX workstation.
Typing in the command ANTARES opens it. The opening screen depicts six
different buttons, which are menus for performing different components of the
simulation. The six sub menus are as follows:
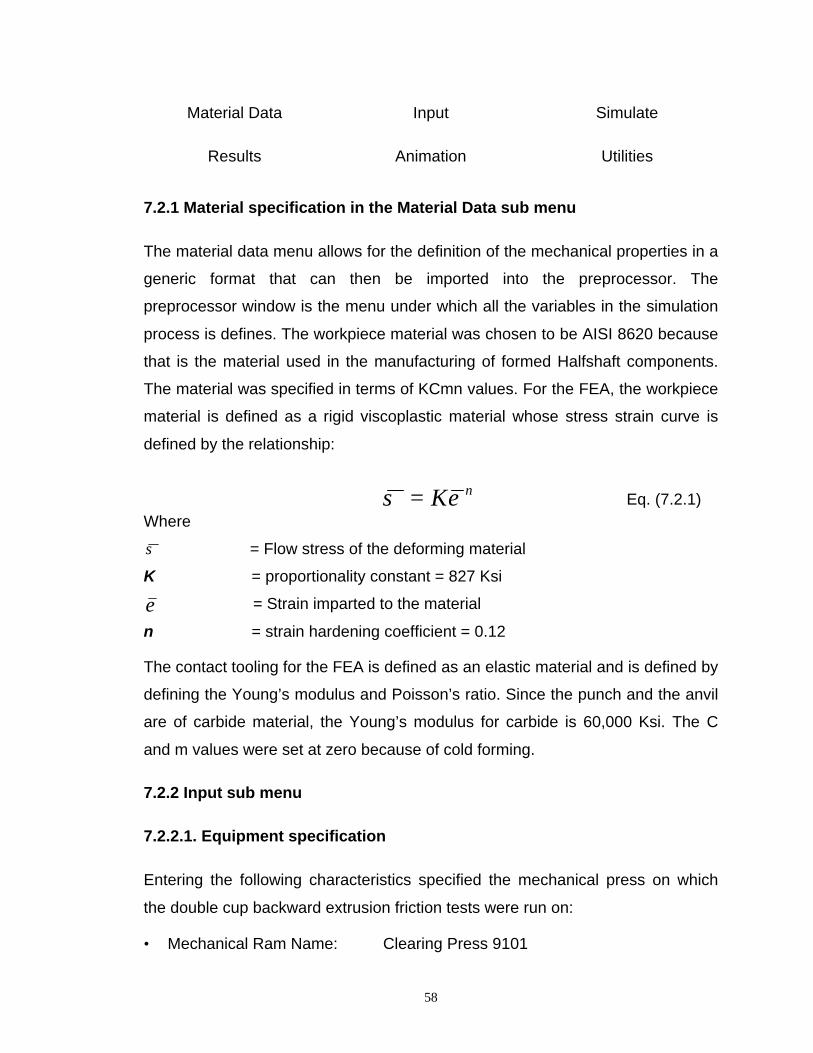
58
σ
ε
Material Data Input Simulate
Results Animation Utilities
7.2.1 Material specification in the Material Data sub menu
The material data menu allows for the definition of the mechanical properties in a
generic format that can then be imported into the preprocessor. The
preprocessor window is the menu under which all the variables in the simulation
process is defines. The workpiece material was chosen to be AISI 8620 because
that is the material used in the manufacturing of formed Halfshaft components.
The material was specified in terms of KCmn values. For the FEA, the workpiece
material is defined as a rigid viscoplastic material whose stress strain curve is
defined by the relationship:
Where
= Flow stress of the deforming material
K = proportionality constant = 827 Ksi
= Strain imparted to the material
n = strain hardening coefficient = 0.12
The contact tooling for the FEA is defined as an elastic material and is defined by
defining the Young’s modulus and Poisson’s ratio. Since the punch and the anvil
are of carbide material, the Young’s modulus for carbide is 60,000 Ksi. The C
and m values were set at zero because of cold forming.
7.2.2 Input sub menu
7.2.2.1. Equipment specification
Entering the following characteristics specified the mechanical press on which
the double cup backward extrusion friction tests were run on:
• Mechanical Ram Name: Clearing Press 9101
nKεσ = Eq. (7.2.1)

59
• Ram Axis: negative Y axis
• Maximum Stroke: 20.000 inches
• Number of strokes: 45 per minute
• Deformation Stroke: 1.8 inch (max.)
After entering the above data the window allows for graphing the velocity of the
ram against the time taken to complete the down stroke of the press. The time
required is captured to be used later in specifying the run parameters.
7.2.2.2. Lubricant specifications
Lubricants used for the simulation were specified as shown below. The friction
type chosen was the shear type because that closely simulated the friction
between the dies and the workpiece. This range was chosen because the friction
factor between the dies and the workpiece varies between these two limits in
cold forging [3]. The interface heat transfer coefficient table was left empty as this
test was being run cold on the assumption was that there would no effects of
heat transfer.
The shear friction coefficient was changed for each iteration of the simulation
between 0.05 and 0.19 in increments of 0.02. The change in the extruded cup
heights due to this change is what led to the generation of the calibration curves.
• Lubricant Name: Phoscoat (or any other name as required)
• Friction Type: Shear
• Shear Friction Coefficient m: 0.05 to 0.19 in steps of 0.02 / iteration
7.2.2.3. Construction of geometry
The geometry of the punch, die and the workpiece is constructed in ANTARES’
pre-processor using straight lines, angles and fillet radii. The geometry of the
punch, anvil, container and the billet are all individually constructed. They are
then aligned as required for the simulation in the view menu. The geometry is
constructed such that only half the details have been drawn. This is because the

60
tooling and the workpiece are cylindrical and are symmetrical about their vertical
axes.
7.2.2.4. Defining / Specifying boundary conditions
Here, the boundary conditions that require to be specified are the contact
conditions and the symmetry conditions of the geometric entities that have been
created. In defining the contact boundary condition, the names for the boundary
condition being defined along with the contact placement axis have to be
specified. This software package can be adapted to simulate heat exchange
amongst other things. In defining the symmetry boundary condition, the name for
the boundary condition being defined along with the constrained degree of
freedom have to be specified.
7.2.2.5. Assigning parameters
Under this menu, all the parameters defined this far need to be correlated to
each other appropriately.
The equipment requires to be assigned to the punch created in the geometry sub
menu in order for the punch to simulate the movement of the press’s RAM.
The materials need to be assigned appropriately.
The lubricant requires to be assigned to the contact surfaces between the
workpiece, the die and the punch.
The boundary conditions need to assigned with due care. In ANTARES, the
workpiece is considered to be stationary while the die and the punch move to
contact it. This condition needs to be incorporated in assigning the boundary
conditions.
The mesh type and density for the billet, die and workpiece is specified. The
simulation of the test setup being a two dimension axisymmetric problem, the
type of mesh specified was quad mesh. For this set - up a mesh density of “8x8”

61
was specified for the workpiece. This translates into eight nodes per inch along
the boundary of the specified geometry and eight mesh elements connected to
each node on the interior. Since only the workpiece is to be studied, no mesh
needs to be specified for the dies.
In this window, the simulation control parameters are also specified. The time
step value, the save interval, the number of time steps per mesh, the strain
increment value, the number of iterations per time step, the object dimension
type (plane strain or axisymmetric), etc., are all specified. These are the
parameters that are crucial for running the simulation. This is an iterative process
and fine-tuning of the above individual parameters is likely.
Once all the above parameters have been specified appropriately, all the data is
written to a database, the geometry written to a file containing information about
the geometry and the run parameters written to a run file that provides the key for
initiating the simulation under a different window.
7.2.3. Simulate sub menu
The “simulate” menu is one in which the problem is submitted for simulation
either as a 2D or 3D set-up. The simulation is initiated from the “simulate” sub-
window. If the above parameters have been appropriately specified, the
simulation should proceed with minimal anomalies. The progress of the
simulation can be tracked on the “simulate” window by plotting the load-stroke
curve. This graph shows the load (tonnage) as a function of the deformation
stroke completed. The “simulate” menu appears as a green icon when the
simulation is in progress. It turns red when the simulation is either completed or
stops due to computational errors. This serves as an additional indicator of the
progress of the simulation.

62
7.3 Post processing simulation results
The results are accessed through the “results” database. The “results” menu is
one in which the results of the simulation are post processed. The animate menu
is to create user-defined animation of the deforming mesh.
The results of a completed simulation, i.e., of a simulation in which the
deformation stroke has been completed, can be accessed by opening the results
menu from the main window. The result database is loaded. The deformed mesh
of the workpiece can be viewed along with the punch and die. The deformation of
the mesh can be tracked from start to finish incrementally by moving the step
button cursor one step at a time. Fig. 7.1 shows an example of the deformed
mesh along with the dies.
The individual results of the friction test, i.e.; the cup heights were tracked
through a feature called point tracking in the result window under operations.
This feature allows tracking of steps incrementally and allows for documenting
the length of the extruded cups as a function of incremental strokes of the press.
The individual results are documented in an Excel spreadsheet and shown in
Appendix B of this report
Fig. 7.1 Deformed mesh along with the punch and die

63
CHAPTER 8
FRICTION TEST RESULTS
8.1 Computer simulation results
The results required from the simulation were plots of the ratio of the extruded
cup heights as a function of the deformation stroke of the press under
incrementally varying lubricant conditions at the workpiece - dies interface.
The results from the simulation were extracted from the Unix workstation by
tracking the cup heights using the FEA software code ANTARES. The stroke of
the press at each increment of the cup height was extrapolated by going into the
“utilities” menu of the code and generating the load stroke curve of the press.
The stroke of the press at each time step interval was obtained from the raw data
generated by doing this step. Thereafter, the time step value common to both the
stroke and the cup height increment was found and the two correlated.
The data from the correlation were then entered into a Microsoft Excel file as
shown in Appendix B. Data for each lubricant value, i.e., value of m was entered
under a specific file name. The collected data was then formatted as shown in
figure 8.1 to generate the graph of the cup height ratios v/s deformation as
shown in fig.8.2.
In the Fig. 8.1 below the step number in the computer simulation is arrived at as
follows:
• The time taken for the ram to reach zero velocity (at the bottom of the stroke)
is found by plotting the velocity against time in the equipment specification
menu. For the experimental set up is 0.1295 min.
• This time interval is divided by 100 (arbitrary number – this number is
suggested by the software developer) to specify the time step value in
specifying the run parameters before submitting the problem to the solver.
64
Time step value requires to be specified to prompt the solver to check for
convergence of the computations. This number for the simulation of the
experimental setup was chosen to be 1.12e-3. This number was arrived at
after fine-tuning to ensure the simulation to run to completion.
• Space (any shape for that matter) is finite and is infinitely divisible. A
continuous quantity is therefore made up of divisible elements. Similarly time
is also continuous and is infinitely divisible. This divisibility of shape and time
allows one to divide continuos things into smaller components or finite
elements. Convergence can be described as the process of successively
moving to the exact or correct solution of the computations required to
quantify the change in shape.
• The simulation solver then requires the save interval of all the iterations in
which the computations converge. Data associated with every time step at
which convergence is reached can be saved. This results in a very large
database in which not all the information is useful. Therefore only every 10th
step is saved in the setup. This is how the step number is specified.
• CHR in the table stands for “Cup Height Ratio” which the ratio of the extruded
upper cup height to the extruded lower cup height.
8.2 Discussion on shape of calibration curves
The computer simulations of the test setup using different shear friction
coefficients yielded data of the extruded cup heights as a function of the
deformation stroke of the press. As discussed before, the cup heights were
recorded for increments of the Ram stroke. The plot of the cup height ratio v/s
the Ram deformation stroke was expected to be smooth curve in which the curve
of cup height ratio would linearly grow to reach a maximum and gradually taper
downwards. The expectation for curve reaching a maximum was due the lower
cup growth being hindered by the presence of the extrusion land on the lower
anvil.

65
When curves generated using different shear friction coefficients were overlaid all
on the same graph, the expectation was that there would be clear demarcation
between curves. Curves of cup height ratios generated using a higher shear
friction coefficient “m” were expected to have a higher slope.
However, the plotted results yielded curves that were wavy and at some places
even intersected other curves generated using a different shear friction
coefficient. Curves of cup height ratios generated using a higher shear friction
coefficient “m” as expected did have higher slope until it reached a maximum.
These errors in the calibration curves could be attributed to two factors:
1. Volume loss in the extruded billet during ANTARES simulations. This
occurs due to the penetration of the mesh area into the punch surfaces
at the sharp corner of the radius. After a certain amount of strain and a
corresponding distortion of the mesh the solver in the software pauses
the simulation to remesh the new deformed geometry profile. The
volume associated with the mesh that has penetrated the punch/die
geometry is lost. This causes the changes in the cup height ratios.
2. The cup heights from the simulation setup were recorded using a
geometry-tracking tool available in the software. Recording the cup
heights, especially in the early parts of the deformation stroke, was
more prone to error because of poor resolution of the mesh in the
software. This also lent to the waviness of the calibration curves.
8.3 Actual test results
The cup height ratios from the deformed billets were measured using a “depth
mike” (a dial type micrometer with a tail to measure depth). The tail of the “depth
mike” was used to measure the depth of the cup and the larger and the smaller
cup heights/depths were measured sequentially for each formed billet and
entered into a table prepared for this purpose. Individual results of this
measurement are shown in Appendix A. The cup height ratios derived from the

66
actual tests for each lubricant type is shown in table format in fig. 8.3. Lower (h1 /
h2) ratio indicates lower friction factor, and therefore better lubricity. The ‘X’ mark
means that results for that lubricant at the corresponding ‘relative stroke’ are not
tabulated or unavailable. (The tests were discontinued and no data recorded
either due the parts repeatedly getting stuck to the upper punch or due to the
“loading up” of the upper punch).
STEP NO. STROKE h1(in.) h2 (in.) CHR1 0.104 0.056 0.038 1.4892 0.172 0.100 0.052 1.9313 0.271 0.155 0.084 1.8534 0.335 0.205 0.105 1.9425 0.367 0.242 0.108 2.2406 0.460 0.357 0.116 3.0647 0.521 0.433 0.118 3.6748 0.580 0.501 0.129 3.8779 0.667 0.595 0.148 4.020
10 0.722 0.665 0.148 4.47911 0.736 0.683 0.148 4.59812 0.817 0.784 0.154 5.10113 0.869 0.849 0.154 5.50614 0.920 0.910 0.168 5.41215 0.994 0.985 0.182 5.40716 1.041 1.034 0.197 5.24417 1.109 1.102 0.225 4.89718 1.153 1.146 0.235 4.87219 1.217 1.210 0.255 4.73620 1.257 1.250 0.269 4.64621 1.315 1.310 0.286 4.58722 1.352 1.347 0.297 4.54323 1.404 1.400 0.314 4.45924 1.473 1.433 0.324 4.41825 1.485 1.480 0.340 4.35626 1.514 1.510 0.349 4.32127 1.556 1.552 0.363 4.27328 1.582 1.578 0.372 4.24229 1.618 1.614 0.384 4.20230 1.641 1.636 0.391 4.18031 1.672 1.667 0.402 4.14732 1.690 1.685 0.408 4.12633 1.716 1.710 0.417 4.10434 1.731 1.726 0.422 4.09335 1.751 1.745 0.428 4.07336 1.762 1.756 0.432 4.06337 1.776 1.770 0.438 4.04538 1.784 1.777 0.440 4.03839 1.793 1.785 0.444 4.02640 1.797 1.789 0.445 4.02141 1.800 1.792 0.446 4.01842 1.800 1.793 0.446 4.017
Fig. 8.1 Table showing format used for recording simulation data

67
Fig. 8.2 Calibration curves generated from the results of simulation of the double cup backward extrude friction test method
GRAPH OF EXTRUDED CUP HEIGHT RATIOS V/S DEFORMATION STROKE
0
2
4
6
8
10
12
0 13 23 32 41 48 54 58 60
% DEFORMATION
m=0.19
m=0.17
m=0.15
m=0.13
m=0.11
m=0.09
m=0.07
m=0.05

68
Table 8.1 - FRICTION TEST RESULTS
Material % Rel.Stroke
IRMCO1
IRMCO2
IRMCO3
IRMCO4
AC3
POLYMER AC2
KARST FITCH AC1
“BLACKLUBE”
30 3.547 3.983 4.417 4.462 5.030 5.6216 5.7443 6.059 6.060 6.887 9.245
8620 40 5.236 X X X 8.011 6.820 X 6.931 6.756 7.750 10.394
50 5.817 X X X X 6.751 X 8.016 7.441 X 9.889
• Data listed above are the average (h1 / h2) ratios of the cup heights from the extruded samples.Table 8.1: Results of the actual test.

69
8.4 Discussion of friction test results
From table 8.1, it appears that the coating “IRMCO -- 1” provided by IRMCO
showed promise. It performed very well at the lower as well as the higher
percentages of ‘relative stroke’. The coating was a polymer lubricant applied on
to a phosphated surface. The only drawbacks of the IRMCO --1 were that the
lubricant coating liquefied at the temperatures encountered during the
deformation processes and that it left a “gummy” residue on the surface of the
die containers that needed to be regularly cleaned with a special solution. None
of the other coatings provided by IRMCO could be evaluated due to the coatings
breaking down at higher percentages of ‘relative stroke’.
None of the coatings provided by ACHESON COLLOIDS withstood a ‘relative
stroke’ of 50%. The coatings withstood lower ‘relative stroke’ values, however the
corresponding cup height ratios were higher than both the coatings currently
used here and from IRMCO, indicating that their lubricity was lower than the
coatings currently in use.
The “POLYMER” lubricant used at plant #5 performed much better than the
FITCH & KARST coater at plant #4. That result is very encouraging, and
suggests replacement of the current Phoscoater at #4 with the “polymer
lubricant” line. Additionally, the polymer coatings from plant #5 are cleaner and
have lesser tendency of leaving a residue, either inside the dies or on the parts.
Interestingly, the FITCH performed better than the KARST at higher percentages
of ‘relative stroke’, while there was no difference between the two at lower
percentages of ‘relative stroke’.
Shown below is the correlation of the simulation results and the actual test
results. The cup height ratios from the actual test are plotted on the m - curves
generated with the results from the simulations.
The table 8.2 shown contains data both from the simulations and the
experimental samples. The first column shows the ram stroke increments (in
inches) in the computer simulation at which the cup height ratios have been

70
computed. The maximum ram stroke used for the simulations is 1.8 inches. The
second column computes the corresponding percentage deformation at each
step of the ram stroke increment. The percentage deformation varies from 0% to
60%. Columns 3-11 show cup height ratios from the computer simulations for
different shear friction coefficient values at the corresponding percentage
deformation. The shear friction coefficient “m” is varied in the simulation from
0.05 to 0.19 in increments of 0.02. This data is used to generate the calibration
curves.
The cup height ratio data obtained from the billets backward extruded in the test
are entered in rows at the appropriate percentage deformation / relative stroke of
the punch in the simulation. The graph with the superimposed extruded CHR
data from the test is shown in fig. 8.3.
The graph shows that while the friction conditions i.e. the friction factor m of the
lubricants KARST, FITCH and POLYMER are around m=0.09 the friction
coefficient of the black lubricant used in plant 5 is around m=0.19. This clearly
shows that the black lubricant is worse than the other three lubricants.
The lubricant that is worthy of attention is the IRMCO 1. This lubricant shows
friction coefficients around m=0.05 and m=0.07 which are really very low for cold
forging lubricants. This shows that the IRMCO 1 coating is a lubricant that has
high slip properties and is worthy of further investigation.

71
Table 8.2 showing the format used to record the correlated results
STROKE% DEFORMATIONm=0.05 m=0.06 m=0.07 m=0.09 m=0.11 m=0.13 m=0.15 m=0.17 m=0.19 Karst Fitch PolymerBlack Lube AC-1 AC-2
0 0 0 0 0 0 0 0 0 0 00.104 3 1.489 1.254 1.436 1.466 1.484 1.493 1.498 1.508 1.5090.172 6 1.931 2.008 1.998 2.020 2.048 2.061 2.117 2.163 2.1600.271 9 1.853 2.295 2.029 2.217 2.370 2.539 2.662 2.834 2.9200.303 10 1.942 2.487 2.247 2.576 2.490 2.791 2.990 4.056 4.0200.398 13 2.240 3.234 2.573 3.215 3.724 3.947 4.268 5.440 5.2300.430 14 3.064 3.959 3.476 4.037 4.182 4.396 4.771 6.258 6.0140.521 17 3.674 4.333 3.816 4.633 5.221 5.403 5.928 6.284 6.4060.551 18 3.877 4.512 4.270 5.108 5.272 5.722 6.175 6.441 6.4410.638 21 4.020 4.526 4.487 5.698 5.583 5.812 6.090 6.772 7.0030.695 23 4.479 4.397 5.029 6.146 6.186 6.408 6.681 7.515 7.3220.736 25 4.598 4.400 5.117 6.094 6.585 6.802 7.391 8.072 8.1220.763 25 5.101 4.485 4.986 5.994 7.023 7.345 7.809 8.521 8.7400.843 28 5.506 4.544 4.959 6.143 7.336 7.735 8.204 9.065 9.0730.895 30 5.412 4.678 5.164 6.494 7.622 7.966 8.746 9.552 9.093 6.059 6.060 5.622 9.246 6.887 5.7440.969 32 5.407 4.641 5.439 6.683 7.990 8.405 9.221 9.816 9.5231.018 34 5.244 4.685 5.742 7.003 8.077 8.551 9.479 9.928 9.8561.041 35 4.897 4.741 5.956 6.989 8.026 8.510 9.702 9.901 9.9171.109 37 4.872 4.703 5.952 7.002 7.991 8.508 9.586 9.848 10.0341.153 38 4.736 4.718 5.992 6.995 7.894 8.439 9.497 9.869 10.1311.217 41 4.646 4.736 5.882 6.942 7.385 7.968 9.495 9.796 10.185 6.931 6.756 6.820 10.394 7.749 XXXXXXX1.257 42 4.587 4.666 5.635 6.871 7.261 7.874 9.389 9.768 10.1001.315 44 4.543 4.598 5.510 6.579 7.086 7.856 9.317 9.147 10.0081.352 45 4.459 4.544 5.345 6.438 7.051 7.601 8.714 8.917 10.0591.404 47 4.418 4.489 5.265 6.231 6.790 7.591 8.414 8.450 9.4221.437 48 4.356 4.436 5.153 6.120 6.648 7.351 8.006 8.203 9.0801.485 49 4.321 4.399 5.089 5.960 6.445 7.223 7.789 7.867 8.6081.514 50 4.273 4.362 4.997 5.912 6.334 6.990 7.707 7.641 8.3581.556 52 4.242 4.327 4.945 5.791 6.186 6.849 7.444 7.596 8.1141.582 53 4.202 4.297 4.875 5.732 6.113 6.671 7.337 7.398 8.0931.618 54 4.180 4.270 4.841 5.649 5.998 6.571 7.131 7.284 7.8321.641 55 4.147 4.250 4.784 5.575 5.933 6.441 7.013 7.141 7.6831.672 56 4.126 4.228 4.752 5.532 5.844 6.361 6.862 7.056 7.4931.690 56 4.104 4.212 4.704 5.477 5.788 6.274 6.769 6.955 7.3761.716 57 4.093 4.198 4.674 5.446 5.728 6.223 6.668 6.896 7.2501.731 58 4.073 4.186 4.645 5.404 5.690 6.157 6.610 6.823 7.1771.751 58 4.063 4.173 4.620 5.379 5.648 6.115 6.535 6.778 7.0831.762 59 4.045 4.164 4.597 5.350 5.622 6.071 6.489 6.735 7.0251.776 59 4.038 4.156 4.583 5.334 5.597 6.044 6.440 6.710 6.9651.784 59 4.026 4.154 4.571 5.321 5.583 6.022 6.411 6.690 6.9301.793 60 4.021 4.151 4.563 5.309 5.573 6.008 6.386 6.681 6.899 8.016 7.441 6.751 9.889 XXXXXXX XXXXXXX1.797 60 4.018 4.151 4.556 5.301 5.564 6.002 6.372 6.679 6.8821.800 60 4.017 4.550 5.564 6.001 6.366 6.8741.800 60 4.550 6.365 6.874

72
OVERLAY OF RESULTS FROM EXPERIMENTS ON CALIBRATION CURVES
0
2
4
6
8
10
12
0 0.2 0.4 0.6 0.8 1 1.2 1.4 1.6 1.8
Deformation Stroke of Punch (in.)
Cup
Hei
ght R
atio
(C
HR
)
m=0.19
m=0.17
m=0.15
m=0.13
m=0.11
m=0.09
m=0.07
m=0.06
Karst
Fitch
Polymer
Black Lube
AC-1
AC-2
AC-3
IRMCO-1
IRMCO-2
Fig. 8.3 Graph showing the superimposed results of results from the simulation and actual tests

73
CHAPTER 9 - OVERALL CONCLUSIONS
9.1 Conclusions
The double cup backward extrusion friction test method is an effective way of
determining the lubricity of coatings in “near” production conditions. The
preparations required for running this test closely simulated the production
processes. The heat treatment and coating processes were exactly replicated.
Billet manufacture was the only activity that was not from the production process.
This was due to the fact that no billets off of the current production processes
had the required billet geometry. The expectation was that in the future, if this
test were to be used as the standard test for determining quality of coatings, then
billets with required geometry would be sheared, coated and tested as and when
needed.
However, as can be seen from the results and the graphs, the test method is not
sensitive enough to distinguish between good and bad coatings. This can be
partly attributed to the small sample of test billets used for testing.
The coatings used were a snap shot of coatings used in every day operations of
the plants in Delphi Saginaw Steering Systems. The coating quality does vary on
a day to day basis. More testing over a longer period of time incorporating more
samples would be required to validate this test method as a tool to distinguish the
quality of particular coating.
9.2 Contributions
This thesis along with the experimental work has explored in depth the domain of
friction testing of cold forging lubricants with special emphasis on the double cup
backward extrusion friction test method. The main contribution of this thesis is in
investigating the “robustness” of the double cup backward extrusion friction test
method under “near” production conditions. While past work has been in the area
of computer simulations to generate friction coefficient calibration curves and

74
limited testing in laboratory conditions, this is the first attempt to investigate the
method under “near” production conditions.
The experimental work establishes the lubricity of coatings that are currently in
use. It compares the lubricity of all the coatings used in Delphi Saginaw Steering
Systems. In addition it presents a tool that can be used to explore the lubricity of
new coatings that are being formulated to either substitute or replace current
coating methods.
9.3 Recommendations
The results indicate that the test is not sensitive enough to distinguish within a
coating type to aid in the decision to either run production or re-coat parts that
have come off of a coating line. Additional testing with large sample sizes would
be required to establish the “lubricity band” – the “m” values that a specific
coating would vary within. This would help boundary samples for “good” and
“bad” coatings.
This experimental setup explored one specific reduction ratio e = 0.26. Future
testing should include other reduction ratios to determine if better sensitivity in
the test method can be achieved.
A length to diameter ratio of 1.53 was used for this setup. Testing that explores
using billets from a production process (which would have a different length to
diameter ratio) would be beneficial. It would avoid having to specially
manufacture billets. Appropriate changes to the die design would have to be
made in order to accommodate new length to diameter ratios.
This test lends itself to an ideal situation for conducting a complete design of
experiments to study, in addition to the lubricity of coatings, the effect of punch
design on pressure required for backward extrusion, design of die tooling, etc.
Possible modifications to this test method could also be explored to improve the
sensitivity of the test.

75
REFERENCES
1. Kobayashi, Oh S, Altan T., "Metal Forming And The Finite Element Method", Oxford Univ.
Press, 1989.
2. Altan, Oh S., Gegel H., "Metal Forming - Fundamentals and Applications", ASM, 1983.
3. “ANTARES - Theory of Metalworking Analysis”
4. Schey J.A, "Tribology in Metal working, Friction, Lubrication and Wear" Carnes Publication
Services, 1983.
5. Lange, "Handbook of Metal Forming", McGraw-Hill, 1985.
6. Witron, "Applied Metal Working", 1979, vol.1, no.1.
7. Nam P. Suh, "Tribophysics", Prentice-Hall, 1986.
8. Bowden and Tabor D., "The Friction and Lubrication of Solids", vol.1, Oxford Clarendon
Press, 1953.
9. Kuhn and Lynn Ferguson B., "Powder Forging", MP1F, 1990.
10. Wanheim, Bay N., "A Model for friction in metal forming processes," Annals of CIRP, 27: 189.
11. Kamaekers and Kals J.A.G., "Mathematical representation of friction in Metal forming
Analysis", Annals of the CIRP, vol. 35111, 1986.
12. Danckert and Wanheim T., "The friction shear stress distribution at the material-tool interface,
when upsetting flat circular cylinder between flat parallel platens", Proc. Modeling -
Fundamentals and applications to metals, ASM, 1980.
13. Wilson, "Friction Modeling in, forging", ASM Materials Science Seminar, Florida, 1986.
14. Byner T.B., Ed. by, "Forging Handbook", FIA, ASM, 1985.
15. Lee and Altan T., "Influence of flow stress and friction upon metal flow in upset forging of
Rings and Cylinders", Trans. ASME, J. of Engr. Industry vol.94, no.3, 1972.
16. Male and DePierre W., ''The Validity of Mathematical solutions for determining friction from
the Ring Compression Test.", Trans. ASME, J. of Lubrications Technology, vol.92, 1978.
17. Douglas and Altan T., "Flow stress determination for Metals at Forging Rates and
Temperatures," Trans. ASME, J. of Engr. Industry, Feb. 1975.
18. Avitzur, "Metalforming: Processes and Analyses", New York, McGraw-Hill, 1968.
19. Hawkyard, Johnson W., "An analysis of the changes in geometry of a short hollow cylinder
during axial compression", Int. J. of Mech. Sci., vol. 9, 1967.
76
20. Male, DePierre V., and G. Sand, ASLE Trans., vol.16, 1973.
21. Misra N., Pope M.H. and Berry J.T., "Lubricant selection in the warm-working of sheet-
material using the ring deformation test", Spring Lubrication Symposium, Boston, MASS,
1972.
22. Polakowski and Schmitt C.B., Trans. AIME, 218, 1960.
23. Sachs, Metallwirstchaft, 9, 1950.
24. Nittel, "A new method of lubricant evaluation for deformation processes by measuring
friction", 1968.
25. Doege, Melching R., and Kowallick G., "Investigation into the behavior of lubricants and the
wear resistance of die materials in Hot and Warm Forging" J. Mech. Work Tech., 2, 1978.
26. Pawelski "A new device for measuring friction in plastic deformation", Stahl U. Eisen, 84,
1964.
27. Kropp E., Udagawa T., and Altan T., "Investigation of Metal flow and lubrication in Isothermal
precision forging of aluminum alloys", Report No. EREJNSM-B-89-03.
28. Shen, WedhanaYagam A., Kropp E., and Altan T., "Evaluation of lubrication for forging of
aluminum-lithium alloy by ring and bucket tests", ERB/NSM-B-90-50.
29. Renaudin, Batit G., Bournicon O., "A simulation of cold forging operations for testing the
tribological properties of solid lubricant coatings", Adv. Tech of Plasticity, vol. 1, 1990.
30. Male, "Metal working lubrication ', Spring lubrication symposium, June 1972.
31. Male, "Variations in friction coefficients of metals during compressive deformation", J. Institute
of Metals, 2347s, vol. 94, 1966.
32. Verson Allsteel press company, “Impact machining”, 1969.
33. Buschhausen A., Weinmann K. and Lee J.Y. and Altan T., “Evaluation of lubrication in cold
forging using a double backward extrusion process”, J. of Materials Processing Technology,
33, 1992
34. Ghobrial M.I., Lee J.Y., Altan T., Bay N, Hansen B.G., “Factors affecting the double cup
extrusion test for evaluation of friction in cold and warm forging”, 1993

77
APPENDIX A - TABLES OF EXTRUDED CUP HEIGHTS FROM ACTUAL TESTING
S l. No .:
Type o f Steel
Type o f coat ing
% Rel. Strk.
Expt. No .: h1 h2
y i
(h1/h2) A v g . Std. Dev .
1 8 6 2 0 K A R S T 3 0 1 0 .759 0 .116 6 .5432 8 6 2 0 K A R S T 3 0 2 0 .758 0 .135 5 .6153 8 6 2 0 K A R S T 3 0 3 0 .758 0 .128 5 .922 6 .059 0 .3054 8 6 2 0 K A R S T 3 0 4 0 .759 0 .126 6 .0245 8 6 2 0 K A R S T 3 0 5 0 .784 0 .129 6 .0786 8 6 2 0 K A R S T 3 0 6 0 .759 0 .123 6 .1717 8 6 2 0 K A R S T 4 0 7 0 1 .162 0 .157 6 .0788 8 6 2 0 K A R S T 4 0 7 1 1 .16 0 .148 6 .1719 8 6 2 0 K A R S T 4 0 7 2 1 .16 0 .161 7 .401
1 0 8 6 2 0 K A R S T 4 0 7 3 1 .151 0 .167 7 .838 6 .931 0 .6971 1 8 6 2 0 K A R S T 4 0 7 4 1 .16 0 .16 7 .2051 2 8 6 2 0 K A R S T 4 0 7 5 1 .155 0 .172 6 .8921 3 8 6 2 0 K A R S T 5 0 1 1 7 1 .535 0 .18 7 .2501 4 8 6 2 0 K A R S T 5 0 1 1 8 1 .535 0 .175 6 .7151 5 8 6 2 0 K A R S T 5 0 1 1 9 1 .529 0 .162 8 .5281 6 8 6 2 0 K A R S T 5 0 1 2 0 1 .519 0 .203 8 .7711 7 8 6 2 0 K A R S T 5 0 1 2 1 1 .515 0 .196 9 .438 8 .016 0 .8901 8 8 6 2 0 K A R S T 5 0 1 2 2 1 .528 0 .186 7 .4831 9 8 6 2 0 K A R S T 5 0 1 2 3 1 .517 0 .201 7 .7302 0 8 6 2 0 K A R S T 5 0 1 2 4 1 .522 0 .195 8 .215
S tandard D e v iation ( )
( )1
2
−−
= ∑n
yy iσ
y

78
Sl. No.: Type of
Steel Type of coating
% Rel. Strk.
Expt. No.: h1 h2
yi
(h1/h2) Avg. Std. Dev.
40 8620 POLYMER 30 13 0.756 0.144 5.25041 8620 POLYMER 30 14 0.763 0.12 6.35842 8620 POLYMER 30 15 0.77 0.137 5.62043 8620 POLYMER 30 16 0.772 0.141 5.475 5.622 0.44744 8620 POLYMER 30 17 0.761 0.148 5.14245 8620 POLYMER 30 18 0.759 0.129 5.88446 8620 POLYMER 40 82 1.175 0.148 7.93947 8620 POLYMER 40 83 1.155 0.162 7.13048 8620 POLYMER 40 84 1.151 0.174 6.61549 8620 POLYMER 40 85 1.138 0.186 6.118 6.820 0.63750 8620 POLYMER 40 86 1.141 0.172 6.63451 8620 POLYMER 40 87 1.148 0.177 6.48652 8620 POLYMER 50 132 1.507 0.215 7.00953 8620 POLYMER 50 133 1.498 0.232 6.45754 8620 POLYMER 50 134 1.493 0.235 6.35355 8620 POLYMER 50 135 1.482 0.238 6.22756 8620 POLYMER 50 136 1.505 0.225 6.689 6.751 0.62957 8620 POLYMER 50 137 1.522 0.19 8.01158 8620 POLYMER 50 138 1.511 0.211 7.16159 8620 POLYMER 50 139 1.476 0.242 6.099
Standard Deviation
y
( )( )1
2
−−
= ∑n
yy iσ

79
Sl. No.: Type of
Steel Type of coating
% Rel. Strk.
Expt. No.: h1 h2
y i
(h1/h2) Avg. Std. Dev.
21 8620 FITCH 30 7 0.765 0.126 6.07122 8620 FITCH 30 8 0.76 0.125 6.08023 8620 FITCH 30 9 0.755 0.123 6.138 6.060 0.13224 8620 FITCH 30 10 0.763 0.129 5.91525 8620 FITCH 30 11 0.756 0.121 6.24826 8620 FITCH 30 12 0.762 0.129 5.90727 8620 FITCH 40 76 1.146 0.176 6.51128 8620 FITCH 40 77 1.146 0.175 6.54929 8620 FITCH 40 78 1.151 0.173 6.65330 8620 FITCH 40 79 1.156 0.164 7.049 6.756 0.27731 8620 FITCH 40 80 1.16 0.162 7.16032 8620 FITCH 40 81 1.144 0.173 6.61333 8620 FITCH 50 125 1.51 0.208 7.26034 8620 FITCH 50 126 1.522 0.206 7.38835 8620 FITCH 50 127 1.511 0.21 7.19536 8620 FITCH 50 128 1.518 0.199 7.628 7.441 0.20937 8620 FITCH 50 129 1.523 0.2 7.61538 8620 FITCH 50 130 1.515 0.208 7.28439 8620 FITCH 50 131 1.528 0.198 7.717
Standard Deviation
y
( )( )1
2
−−
= ∑n
yy iσ

80
Sl. No.:
Type of Steel
Type of coating
% Rel. Strk.
Expt. No.: h1 h2
y i
(h1/h2) Avg. Std. Dev.
60 8620 CONVENTIONAL 30 19 0.813 0.09 9.03361 8620 CONVENTIONAL 30 20 0.812 0.105 7.73362 8620 CONVENTIONAL 30 21 0.836 0.08 10.450 9.246 0.90463 8620 CONVENTIONAL 30 22 0.818 0.087 9.40264 8620 CONVENTIONAL 30 23 0.829 0.085 9.75365 8620 CONVENTIONAL 30 24 0.81 0.089 9.10166 8620 CONVENTIONAL 40 88 1.197 0.112 10.68867 8620 CONVENTIONAL 40 89 1.21 0.108 11.20468 8620 CONVENTIONAL 40 90 1.188 0.127 9.35469 8620 CONVENTIONAL 40 91 1.198 0.116 10.328 10.394 0.64770 8620 CONVENTIONAL 40 92 1.204 0.12 10.03371 8620 CONVENTIONAL 40 93 1.205 0.112 10.75972 8620 CONVENTIONAL 50 140 1.559 0.146 10.67873 8620 CONVENTIONAL 50 141 1.552 0.156 9.94974 8620 CONVENTIONAL 50 142 1.536 0.164 9.36675 8620 CONVENTIONAL 50 143 1.544 0.16 9.650 9.889 1.04777 8620 CONVENTIONAL 50 144 1.523 0.172 8.85578 8620 CONVENTIONAL 50 145 1.562 0.137 11.40179 8620 CONVENTIONAL 50 146 1.51 0.181 8.34380 8620 CONVENTIONAL 50 147 1.555 0.143 10.874
Standard Deviation
y
( )( )1
2
−−
= ∑n
yy iσ

81
Sl. No.: Type of
Steel Type of coating% Rel. Strk.
Expt. No.: h1 h2
yi
(h1/h2) Avg. Std. Dev.
81 8620 AC - 1 (GM - 66273) 30 25 0.782 0.113 6.92082 8620 AC - 1 (GM - 66273) 30 26 0.789 0.127 6.21383 8620 AC - 1 (GM - 66273) 30 27 0.783 0.126 6.21484 8620 AC - 1 (GM - 66273) 30 28 0.784 0.107 7.327 6.887 0.57885 8620 AC - 1 (GM - 66273) 30 29 0.786 0.103 7.63186 8620 AC - 1 (GM - 66273) 30 30 0.786 0.112 7.01887 8620 AC - 1 (GM - 66273) 40 94 1.16 0.156 7.43688 8620 AC - 1 (GM - 66273) 40 95 1.169 0.151 7.74289 8620 AC - 1 (GM - 66273) 40 96 1.168 0.158 7.39290 8620 AC - 1 (GM - 66273) 40 97 1.17 0.154 7.597 7.749 0.34991 8620 AC - 1 (GM - 66273) 40 98 1.178 0.146 8.06892 8620 AC - 1 (GM - 66273) 40 99 1.181 0.143 8.25993 8620 AC - 1 (GM - 66273) 5094 8620 AC - 1 (GM - 66273) 5095 8620 AC - 1 (GM - 66273) 5096 8620 AC - 1 (GM - 66273) 5097 8620 AC - 1 (GM - 66273) 5098 8620 AC - 1 (GM - 66273) 5099 8620 AC - 1 (GM - 66273) 50
100 8620 AC - 1 (GM - 66273) 50
Standard Deviation
* Blackened cells are those experiments in which the double cup extrusion were stopped midway through the stroke the press due to breakdown of the lubricant film at these percentages of deformation stroke
y
( )( )1
2
−−
= ∑n
yy iσ

82
Sl. No.: Type of
Steel Type of coating% Rel. Strk.
Expt. No.: h1 h2
y i
(h1/h2) Avg. Std. Dev.
101 8620 AC - 2 (GM - 66270) 30 31 0.748 0.132 5.667102 8620 AC - 2 (GM - 66270) 30 32 0.774 0.145 5.338103 8620 AC - 2 (GM - 66270) 30 33 0.781 0.138 5.659104 8620 AC - 2 (GM - 66270) 30 34 0.79 0.131 6.031 5.744 0.323105 8620 AC - 2 (GM - 66270) 30 35 0.772 0.139 5.554106 8620 AC - 2 (GM - 66270) 30 36 0.771 0.124 6.218107 8620 AC - 2 (GM - 66270) 40 100 1.169 0.155108 8620 AC - 2 (GM - 66270) 40 101 1.151 0.167109 8620 AC - 2 (GM - 66270) 40110 8620 AC - 2 (GM - 66270) 40111 8620 AC - 2 (GM - 66270) 40112 8620 AC - 2 (GM - 66270) 40113 8620 AC - 2 (GM - 66270) 50114 8620 AC - 2 (GM - 66270) 50115 8620 AC - 2 (GM - 66270) 50116 8620 AC - 2 (GM - 66270) 50117 8620 AC - 2 (GM - 66270) 50118 8620 AC - 2 (GM - 66270) 50119 8620 AC - 2 (GM - 66270) 50120 8620 AC - 2 (GM - 66270) 50
Standard Deviation
* Blackened cells are those experiments in which the double cup extrusion were stopped midway through the stroke the press due to breakdown of the lubricant film at these percentages of deformation stroke
y
( )( )1
2
−−
= ∑n
yy iσ

83
Sl. No.: Type of
Steel Type of coating% Rel. Strk.
Expt. No.: h1 h2
yi
(h1/h2) Avg. Std. Dev.
121 8620 AC - 3 (GM - 66273J) 30 37 0.692 0.19 3.642122 8620 AC - 3 (GM - 66273J) 30 38 0.74 0.157 4.713123 8620 AC - 3 (GM - 66273J) 30 39 0.76 0.13 5.846124 8620 AC - 3 (GM - 66273J) 30 40 0.747 0.132 5.659 5.030 0.793125 8620 AC - 3 (GM - 66273J) 30 41 0.753 0.149 5.054126 8620 AC - 3 (GM - 66273J) 30 42 0.753 0.143 5.266127 8620 AC - 3 (GM - 66273J) 40 102 1.165 0.154 7.565128 8620 AC - 3 (GM - 66273J) 40 103 1.175 0.137 8.577129 8620 AC - 3 (GM - 66273J) 40 104 1.168 0.145 8.055130 8620 AC - 3 (GM - 66273J) 40 105 1.169 0.143 8.175 8.012 0.355131 8620 AC - 3 (GM - 66273J) 40 106 1.164 0.146 7.973132 8620 AC - 3 (GM - 66273J) 40 107 1.159 0.15 7.727133 8620 AC - 3 (GM - 66273J) 50 156 1.55 0.161134 8620 AC - 3 (GM - 66273J) 50 157 1.472 0.235135 8620 AC - 3 (GM - 66273J) 50136 8620 AC - 3 (GM - 66273J) 50137 8620 AC - 3 (GM - 66273J) 50138 8620 AC - 3 (GM - 66273J) 50139 8620 AC - 3 (GM - 66273J) 50140 8620 AC - 3 (GM - 66273J) 50
Standard Deviation
* Blackened cells are those experiments in which the double cup extrusion were stopped midway through the stroke of the press due to breakdown of the lubricant film at these percentages of deformation stroke
y
( )( )1
2
−−
= ∑n
yy iσ

84
Sl. No.: Type of
Steel Type of coating% Rel. Strk.
Expt. No.: h1 h2
yi
(h1/h2) Avg. Std. Dev.
141 8620 IRMCO - 1 (601A - PHOS) 30 43 0.701 0.195 3.595142 8620 IRMCO - 1 (601A - PHOS) 30 44 0.674 0.209 3.225143 8620 IRMCO - 1 (601A - PHOS) 30 45 0.709 0.185 3.832144 8620 IRMCO - 1 (601A - PHOS) 30 46 0.71 0.18 3.944 3.547 0.293145 8620 IRMCO - 1 (601A - PHOS) 30 47 0.689 0.205 3.361146 8620 IRMCO - 1 (601A - PHOS) 30 48 0.682 0.205 3.327147 8620 IRMCO - 1 (601A - PHOS) 40 108 1.1 0.219 5.023148 8620 IRMCO - 1 (601A - PHOS) 40 109 1.132 0.205 5.522149 8620 IRMCO - 1 (601A - PHOS) 40 110 1.142 0.206 5.544150 8620 IRMCO - 1 (601A - PHOS) 40 111 1.111 0.217 5.120 5.236 0.260151 8620 IRMCO - 1 (601A - PHOS) 40 112 1.112 0.226 4.920152 8620 IRMCO - 1 (601A - PHOS) 40 113 1.116 0.211 5.289153 8620 IRMCO - 1 (601A - PHOS) 50 148 1.495 0.22 5.120154 8620 IRMCO - 1 (601A - PHOS) 50 149 1.479 0.229 4.920156 8620 IRMCO - 1 (601A - PHOS) 50 150 1.464 0.247 5.289158 8620 IRMCO - 1 (601A - PHOS) 50 151 1.467 0.244 6.012159 8620 IRMCO - 1 (601A - PHOS) 50 152 1.47 0.242 6.795 5.817 0.657160 8620 IRMCO - 1 (601A - PHOS) 50 153 1.467 0.243 6.459161 8620 IRMCO - 1 (601A - PHOS) 50 154 1.462 0.25 5.927162 8620 IRMCO - 1 (601A - PHOS) 50 155 1.464 0.246 6.012
Standard Deviation
y
( )( )1
2
−−
= ∑n
yy iσ

85
Sl. No.: Type of
Steel Type of coating% Rel. Strk.
Expt. No.: h1 h2
yi
(h1/h2) Avg. Std. Dev.163 8620 IRMCO - 2 (601++ - PHOS) 30 49 0.678 0.215 3.153164 8620 IRMCO - 2 (601++ - PHOS) 30 50 0.73 0.155 4.710165 8620 IRMCO - 2 (601++ - PHOS) 30 51 0.7 0.185 3.784166 8620 IRMCO - 2 (601++ - PHOS) 30 52 0.723 0.165 4.382 3.983 0.578167 8620 IRMCO - 2 (601++ - PHOS) 30 53 0.698 0.195 3.579168 8620 IRMCO - 2 (601++ - PHOS) 30 54 0.725 0.169 4.290169 8620 IRMCO - 2 (601++ - PHOS) 40170 8620 IRMCO - 2 (601++ - PHOS) 40171 8620 IRMCO - 2 (601++ - PHOS) 40172 8620 IRMCO - 2 (601++ - PHOS) 40173 8620 IRMCO - 2 (601++ - PHOS) 40174 8620 IRMCO - 2 (601++ - PHOS) 40175 8620 IRMCO - 2 (601++ - PHOS) 50 158 1.463 0.25176 8620 IRMCO - 2 (601++ - PHOS) 50 159 1.489 0.22177 8620 IRMCO - 2 (601++ - PHOS) 50 160 1.462 0.257178 8620 IRMCO - 2 (601++ - PHOS) 50179 8620 IRMCO - 2 (601++ - PHOS) 50180 8620 IRMCO - 2 (601++ - PHOS) 50181 8620 IRMCO - 2 (601++ - PHOS) 50182 8620 IRMCO - 2 (601++ - PHOS) 50
Standard Deviation
* Blackened cells are those experiments in which the double cup extrusion were stopped midway through the stroke the press due to breakdown of the lubricant film at these percentages of deformation stroke
y
( )( )1
2
−−
= ∑n
yyiσ

86
APPENDIX B - COMPUTER SIMULATION (ANTARES) GENERATEDDATA
For shear coefficient m=0.05
STEP NO. STROKE H1(in.) H2 (in.) CHR1 0.104 0.056 0.038 1.4892 0.172 0.100 0.052 1.9313 0.271 0.155 0.084 1.8534 0.335 0.205 0.105 1.9425 0.367 0.242 0.108 2.2406 0.460 0.357 0.116 3.0647 0.521 0.433 0.118 3.6748 0.580 0.501 0.129 3.8779 0.667 0.595 0.148 4.02010 0.722 0.665 0.148 4.47911 0.736 0.683 0.148 4.59812 0.817 0.784 0.154 5.10113 0.869 0.849 0.154 5.50614 0.920 0.910 0.168 5.41215 0.994 0.985 0.182 5.40716 1.041 1.034 0.197 5.24417 1.109 1.102 0.225 4.89718 1.153 1.146 0.235 4.87219 1.217 1.210 0.255 4.73620 1.257 1.250 0.269 4.64621 1.315 1.310 0.286 4.58722 1.352 1.347 0.297 4.54323 1.404 1.400 0.314 4.45924 1.473 1.433 0.324 4.41825 1.485 1.480 0.340 4.35626 1.514 1.510 0.349 4.32127 1.556 1.552 0.363 4.27328 1.582 1.578 0.372 4.24229 1.618 1.614 0.384 4.20230 1.641 1.636 0.391 4.18031 1.672 1.667 0.402 4.14732 1.690 1.685 0.408 4.12633 1.716 1.710 0.417 4.10434 1.731 1.726 0.422 4.09335 1.751 1.745 0.428 4.07336 1.762 1.756 0.432 4.06337 1.776 1.770 0.438 4.04538 1.784 1.777 0.440 4.03839 1.793 1.785 0.444 4.02640 1.797 1.789 0.445 4.02141 1.800 1.792 0.446 4.01842 1.800 1.793 0.446 4.017

87
For shear coefficient m=0.06
STEP NO. STROKE H1(in.) H2(in.) CHR1 0.009 0.045 0.036 1.2542 0.172 0.101 0.050 2.0083 0.254 0.154 0.067 2.2954 0.335 0.220 0.089 2.4875 0.398 0.299 0.093 3.2346 0.475 0.395 0.100 3.9597 0.550 0.482 0.111 4.3338 0.623 0.565 0.125 4.5129 0.694 0.642 0.142 4.52610 0.763 0.714 0.162 4.39711 0.830 0.786 0.179 4.40012 0.894 0.859 0.192 4.48513 0.957 0.929 0.204 4.54414 1.017 0.999 0.214 4.67815 1.075 1.062 0.229 4.64116 1.131 1.124 0.240 4.68517 1.185 1.184 0.250 4.74118 1.236 1.240 0.264 4.70319 1.295 1.294 0.274 4.71820 1.333 1.346 0.284 4.73621 1.378 1.392 0.298 4.66622 1.420 1.435 0.312 4.59823 1.461 1.475 0.325 4.54424 1.499 1.513 0.337 4.48925 1.535 1.549 0.349 4.43626 1.569 1.583 0.360 4.39927 1.600 1.614 0.370 4.36228 1.629 1.644 0.380 4.32729 1.656 1.670 0.389 4.29730 1.681 1.695 0.397 4.27031 1.703 1.717 0.404 4.25032 1.723 1.737 0.411 4.22833 1.741 1.754 0.417 4.21234 1.756 1.770 0.422 4.19835 1.769 1.782 0.426 4.18636 1.780 1.793 0.430 4.17337 1.788 1.801 0.432 4.16438 1.795 1.807 0.435 4.15639 1.798 1.810 0.436 4.15440 1.800 1.812 0.436 4.15141 1.800 1.812 0.436 4.151

88
For shear coefficient m = 0.07
STEP NO. STROKE H1(in.) H2(in.) CHR1 0.104 0.056 0.039 1.4362 0.172 0.101 0.051 1.9983 0.271 0.160 0.079 2.0294 0.335 0.214 0.095 2.2475 0.367 0.253 0.098 2.5736 0.460 0.368 0.106 3.4767 0.491 0.406 0.106 3.8168 0.551 0.477 0.112 4.2709 0.638 0.576 0.128 4.48710 0.695 0.647 0.129 5.02911 0.736 0.695 0.136 5.11712 0.763 0.722 0.145 4.98613 0.843 0.810 0.163 4.95914 0.895 0.873 0.169 5.16415 0.969 0.964 0.177 5.43916 1.018 1.024 0.178 5.74217 1.087 1.108 0.186 5.95618 1.109 1.134 0.191 5.95219 1.175 1.209 0.202 5.99220 1.217 1.253 0.213 5.88221 1.277 1.313 0.233 5.63522 1.315 1.351 0.245 5.51023 1.370 1.406 0.263 5.34524 1.404 1.441 0.274 5.26525 1.454 1.490 0.289 5.15326 1.485 1.521 0.299 5.08927 1.529 1.565 0.313 4.99728 1.556 1.593 0.322 4.94529 1.595 1.631 0.335 4.87530 1.618 1.655 0.342 4.84131 1.651 1.688 0.353 4.78432 1.672 1.708 0.360 4.75233 1.699 1.736 0.369 4.70434 1.716 1.752 0.375 4.67435 1.738 1.774 0.382 4.64536 1.751 1.787 0.387 4.62037 1.767 1.803 0.392 4.59738 1.776 1.812 0.395 4.58339 1.787 1.823 0.399 4.57140 1.793 1.828 0.401 4.56341 1.798 1.834 0.402 4.55642 1.800 1.835 0.403 4.55043 1.800 1.836 0.403 4.550
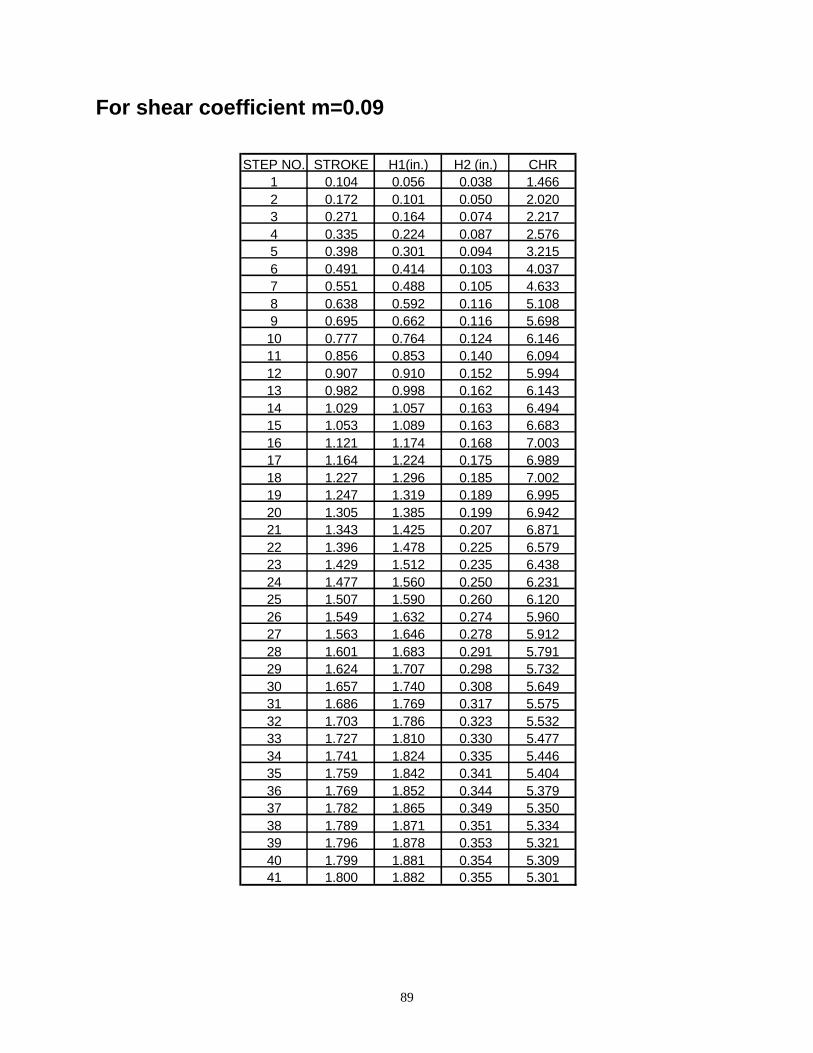
89
For shear coefficient m=0.09
STEP NO. STROKE H1(in.) H2 (in.) CHR1 0.104 0.056 0.038 1.4662 0.172 0.101 0.050 2.0203 0.271 0.164 0.074 2.2174 0.335 0.224 0.087 2.5765 0.398 0.301 0.094 3.2156 0.491 0.414 0.103 4.0377 0.551 0.488 0.105 4.6338 0.638 0.592 0.116 5.1089 0.695 0.662 0.116 5.69810 0.777 0.764 0.124 6.14611 0.856 0.853 0.140 6.09412 0.907 0.910 0.152 5.99413 0.982 0.998 0.162 6.14314 1.029 1.057 0.163 6.49415 1.053 1.089 0.163 6.68316 1.121 1.174 0.168 7.00317 1.164 1.224 0.175 6.98918 1.227 1.296 0.185 7.00219 1.247 1.319 0.189 6.99520 1.305 1.385 0.199 6.94221 1.343 1.425 0.207 6.87122 1.396 1.478 0.225 6.57923 1.429 1.512 0.235 6.43824 1.477 1.560 0.250 6.23125 1.507 1.590 0.260 6.12026 1.549 1.632 0.274 5.96027 1.563 1.646 0.278 5.91228 1.601 1.683 0.291 5.79129 1.624 1.707 0.298 5.73230 1.657 1.740 0.308 5.64931 1.686 1.769 0.317 5.57532 1.703 1.786 0.323 5.53233 1.727 1.810 0.330 5.47734 1.741 1.824 0.335 5.44635 1.759 1.842 0.341 5.40436 1.769 1.852 0.344 5.37937 1.782 1.865 0.349 5.35038 1.789 1.871 0.351 5.33439 1.796 1.878 0.353 5.32140 1.799 1.881 0.354 5.30941 1.800 1.882 0.355 5.301

90
For shear coefficient m=0.11
STEP NO. STROKE H1(in.) H2 (in.) CHR1 0.104 0.056 0.038 1.4842 0.172 0.102 0.050 2.0483 0.271 0.167 0.071 2.3704 0.303 0.194 0.078 2.4905 0.398 0.310 0.083 3.7246 0.430 0.350 0.084 4.1827 0.521 0.463 0.089 5.2218 0.580 0.527 0.100 5.2729 0.667 0.627 0.112 5.58310 0.722 0.697 0.113 6.18611 0.763 0.749 0.114 6.58512 0.843 0.848 0.121 7.02313 0.895 0.911 0.124 7.33614 0.969 1.003 0.132 7.62215 1.018 1.063 0.133 7.99016 1.087 1.146 0.142 8.07717 1.109 1.172 0.146 8.02618 1.175 1.247 0.156 7.99119 1.217 1.295 0.164 7.89420 1.277 1.356 0.184 7.38521 1.315 1.397 0.192 7.26122 1.370 1.457 0.206 7.08623 1.404 1.495 0.212 7.05124 1.454 1.545 0.227 6.79025 1.485 1.576 0.237 6.64826 1.529 1.620 0.251 6.44527 1.556 1.647 0.260 6.33428 1.595 1.686 0.272 6.18629 1.618 1.710 0.280 6.11330 1.651 1.743 0.291 5.99831 1.672 1.763 0.297 5.93332 1.699 1.790 0.306 5.84433 1.716 1.807 0.312 5.78834 1.738 1.829 0.319 5.72835 1.751 1.842 0.324 5.69036 1.767 1.858 0.329 5.64837 1.776 1.867 0.332 5.62238 1.787 1.878 0.336 5.59739 1.793 1.884 0.337 5.58340 1.798 1.889 0.339 5.57341 1.800 1.891 0.340 5.56442 1.800 1.891 0.340 5.564

91
For shear coefficient m=0.13
STEP NO. STROKE H1(in.) H2 (in.) CHR1 0.104 0.056 0.038 1.4932 0.172 0.102 0.049 2.0613 0.271 0.171 0.067 2.5394 0.303 0.201 0.072 2.7915 0.398 0.314 0.079 3.9476 0.430 0.352 0.080 4.3967 0.521 0.465 0.086 5.4038 0.580 0.532 0.093 5.7229 0.667 0.630 0.108 5.81210 0.722 0.699 0.109 6.40811 0.763 0.751 0.110 6.80212 0.843 0.851 0.116 7.34513 0.895 0.916 0.118 7.73514 0.920 0.948 0.119 7.96615 0.994 1.039 0.124 8.40516 1.018 1.069 0.125 8.55117 1.087 1.151 0.135 8.51018 1.153 1.229 0.144 8.50819 1.196 1.278 0.151 8.43920 1.257 1.343 0.169 7.96821 1.315 1.408 0.179 7.87422 1.352 1.451 0.185 7.85623 1.404 1.507 0.198 7.60124 1.437 1.545 0.203 7.59125 1.485 1.594 0.217 7.35126 1.514 1.625 0.225 7.22327 1.556 1.667 0.238 6.99028 1.582 1.693 0.247 6.84929 1.618 1.729 0.259 6.67130 1.641 1.751 0.267 6.57131 1.672 1.782 0.277 6.44132 1.690 1.801 0.283 6.36133 1.716 1.826 0.291 6.27434 1.731 1.841 0.296 6.22335 1.751 1.861 0.302 6.15736 1.762 1.872 0.306 6.11537 1.776 1.887 0.311 6.07138 1.784 1.894 0.313 6.04439 1.793 1.903 0.316 6.02240 1.797 1.907 0.317 6.00841 1.800 1.910 0.318 6.00242 1.800 1.911 0.318 6.001

92
For shear coefficient m=0.15
STEP NO. STROKE H1(in.) H2 (in.) CHR1 0.104 0.056 0.038 1.4982 0.172 0.103 0.048 2.1173 0.271 0.174 0.065 2.6624 0.303 0.205 0.069 2.9905 0.398 0.319 0.075 4.2686 0.430 0.358 0.075 4.7717 0.521 0.472 0.080 5.9288 0.551 0.507 0.082 6.1759 0.638 0.604 0.099 6.09010 0.695 0.673 0.101 6.68111 0.777 0.778 0.105 7.39112 0.856 0.875 0.112 7.80913 0.907 0.940 0.115 8.20414 0.982 1.034 0.118 8.74615 1.029 1.093 0.119 9.22116 1.053 1.124 0.119 9.47917 1.121 1.208 0.125 9.70218 1.164 1.259 0.131 9.58619 1.227 1.332 0.140 9.49720 1.247 1.356 0.143 9.49521 1.305 1.423 0.152 9.38922 1.343 1.466 0.157 9.31723 1.396 1.519 0.174 8.71424 1.429 1.553 0.185 8.41425 1.477 1.601 0.200 8.00626 1.507 1.631 0.209 7.78927 1.521 1.645 0.213 7.70728 1.563 1.687 0.227 7.44429 1.588 1.713 0.234 7.33730 1.624 1.749 0.245 7.13131 1.646 1.771 0.253 7.01332 1.676 1.801 0.263 6.86233 1.695 1.820 0.269 6.76934 1.720 1.845 0.277 6.66835 1.734 1.859 0.281 6.61036 1.753 1.879 0.287 6.53537 1.764 1.890 0.291 6.48938 1.778 1.903 0.296 6.44039 1.786 1.911 0.298 6.41140 1.794 1.919 0.300 6.38641 1.797 1.922 0.302 6.37242 1.800 1.925 0.302 6.36643 1.800 1.925 0.302 6.365

93
For shear coefficient m=0.17
STEP NO. STROKE H1(in.) H2 (in.) CHR1 0.104 0.057 0.038 1.5082 0.172 0.103 0.048 2.1633 0.271 0.177 0.062 2.8344 0.367 0.281 0.069 4.0565 0.460 0.399 0.073 5.4406 0.521 0.474 0.076 6.2587 0.580 0.541 0.086 6.2848 0.667 0.640 0.099 6.4419 0.695 0.675 0.100 6.77210 0.777 0.779 0.104 7.51511 0.856 0.879 0.109 8.07212 0.907 0.944 0.111 8.52113 0.982 1.038 0.114 9.06514 1.029 1.097 0.115 9.55215 1.053 1.128 0.115 9.81616 1.121 1.211 0.122 9.92817 1.164 1.263 0.128 9.90118 1.227 1.336 0.136 9.84819 1.247 1.361 0.138 9.86920 1.305 1.429 0.146 9.79621 1.343 1.472 0.151 9.76822 1.396 1.527 0.167 9.14723 1.429 1.562 0.175 8.91724 1.477 1.610 0.191 8.45025 1.507 1.640 0.200 8.20326 1.549 1.682 0.214 7.86727 1.588 1.722 0.225 7.64128 1.613 1.749 0.230 7.59629 1.646 1.783 0.241 7.39830 1.667 1.803 0.248 7.28431 1.695 1.832 0.256 7.14132 1.712 1.848 0.262 7.05633 1.734 1.871 0.269 6.95534 1.747 1.884 0.273 6.89635 1.764 1.901 0.279 6.82336 1.774 1.911 0.282 6.77837 1.786 1.922 0.285 6.73538 1.791 1.928 0.287 6.71039 1.797 1.934 0.289 6.69040 1.799 1.936 0.290 6.68141 1.800 1.937 0.290 6.679

94
For shear coefficient m=0.19
STEP NO. STROKE H1(in.) H2 (in.) CHR1 0.104 0.057 0.038 1.5092 0.172 0.103 0.048 2.1603 0.271 0.179 0.061 2.9204 0.303 0.281 0.070 4.0205 0.398 0.397 0.076 5.2306 0.430 0.472 0.078 6.0147 0.521 0.543 0.085 6.4068 0.551 0.641 0.100 6.4419 0.638 0.710 0.101 7.00310 0.695 0.745 0.102 7.32211 0.736 0.848 0.104 8.12212 0.763 0.913 0.104 8.74013 0.843 0.961 0.106 9.07314 0.895 0.976 0.107 9.09315 0.969 1.066 0.112 9.52316 1.018 1.125 0.114 9.85617 1.041 1.207 0.122 9.91718 1.109 1.261 0.126 10.03419 1.153 1.336 0.132 10.13120 1.217 1.361 0.134 10.18521 1.257 1.383 0.137 10.10022 1.315 1.450 0.145 10.00823 1.352 1.494 0.149 10.05924 1.404 1.547 0.164 9.42225 1.437 1.581 0.174 9.08026 1.485 1.627 0.189 8.60827 1.514 1.657 0.198 8.35828 1.556 1.700 0.209 8.11429 1.582 1.729 0.214 8.09330 1.618 1.765 0.225 7.83231 1.641 1.787 0.233 7.68332 1.672 1.817 0.243 7.49333 1.690 1.835 0.249 7.37634 1.716 1.860 0.257 7.25035 1.731 1.875 0.261 7.17736 1.751 1.894 0.267 7.08337 1.762 1.905 0.271 7.02538 1.776 1.919 0.276 6.96539 1.784 1.926 0.278 6.93040 1.793 1.935 0.280 6.89941 1.797 1.938 0.282 6.88242 1.800 1.941 0.282 6.87443 1.800 1.941 0.282 6.874

95
APPENDIX C: CONTACT TOOLING FOR DOUBLE CUP BACKWARD EXTRUSION FRICTION TEST

96

97

98

99

100

101

102

103

104
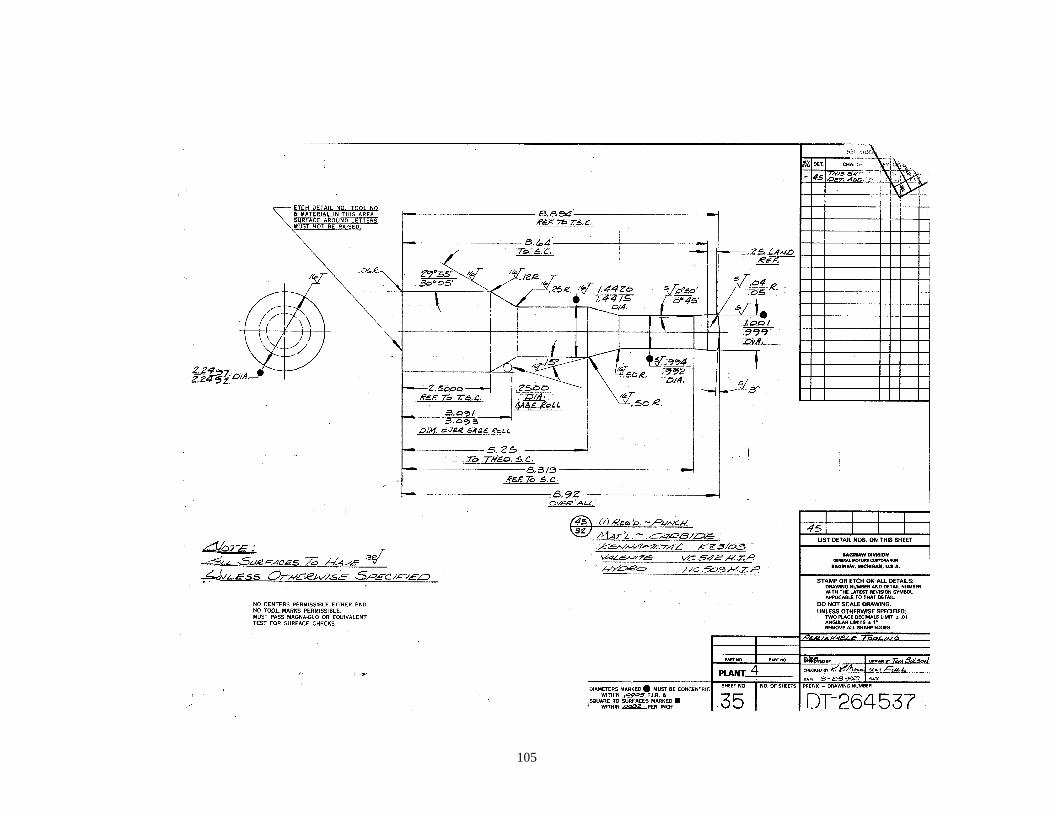
105

106
Recommended