SMAP Cal/Val Workshop # 9
[22nd – 23rd October 2018]
George Mason University, Fairfax Campus, Virginia, USA
Project funded by :
Kuwait Foundation for the Advancement of Science, Kuwait
Evaluation of passive microwave brightness temperatures simulations
across multiple microwave frequencies and polarization over the test site
of Kuwait Desert
Hala K Al Jassar, Physics Department, Kuwait University
Dara Entekhabi, Massachusetts Institute of Technology, Cambridge, MA, USA
Marouane Temimi, Masdar Institute, Masdar City, Abu Dhabi, UAE
Peter Petrov, Kuwait Institute for Scientific Research, Kuwait
Hussain Al Saraff , American University of Kuwait, Kuwait
Panagiotis Kokkalis, Physics Department, Kuwait University, Kuwait
Roshni Nair, Physics Department, Kuwait University, Kuwait
Outlines
Objectives
SM variations
Intensive Field campaigns
Simulation of Tb’s for Bare Soil Model
(SMAP/SMOS/AMSR2/SSM/I)
Input / Output Parameters for TB Simulation
Observed and Simulated Brightness Temperature
Conclusions
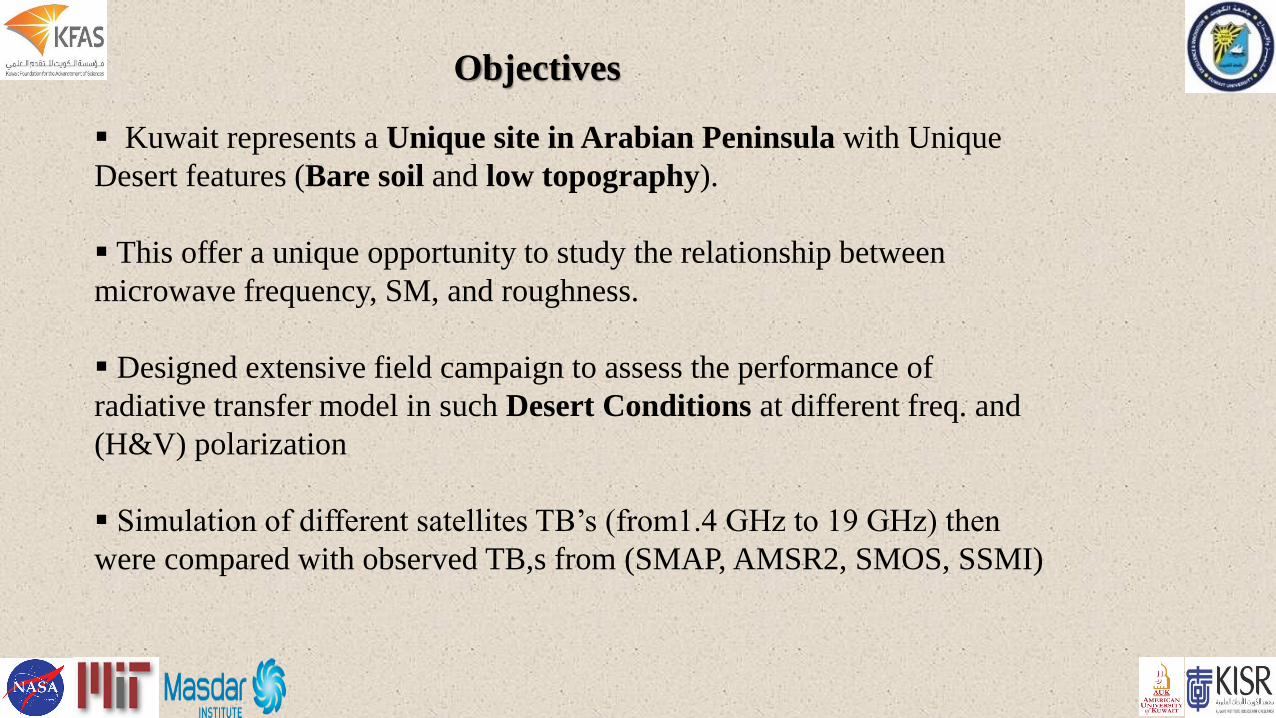
Objectives
Kuwait represents a Unique site in Arabian Peninsula with Unique
Desert features (Bare soil and low topography).
This offer a unique opportunity to study the relationship between
microwave frequency, SM, and roughness.
Designed extensive field campaign to assess the performance of
radiative transfer model in such Desert Conditions at different freq. and
(H&V) polarization
Simulation of different satellites TB’s (from1.4 GHz to 19 GHz) then
were compared with observed TB,s from (SMAP, AMSR2, SMOS, SSMI)
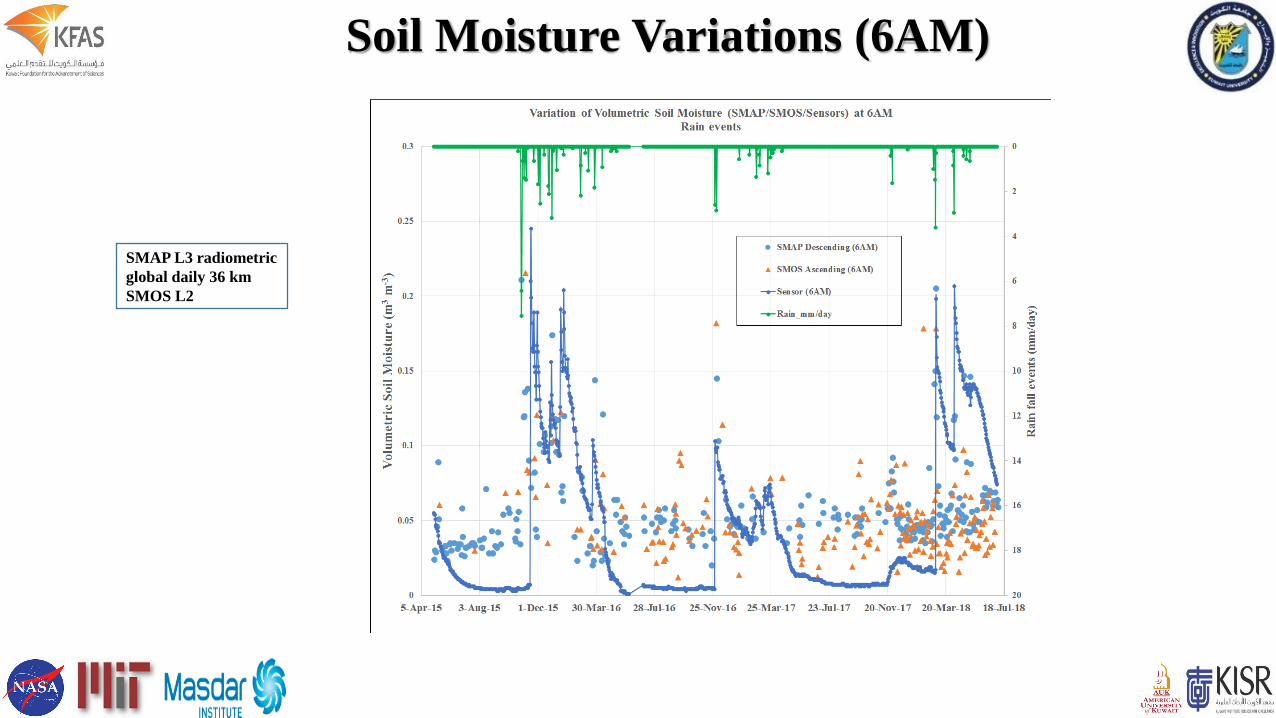
Soil Moisture Variations (6AM)
SMAP L3 radiometric
global daily 36 km
SMOS L2
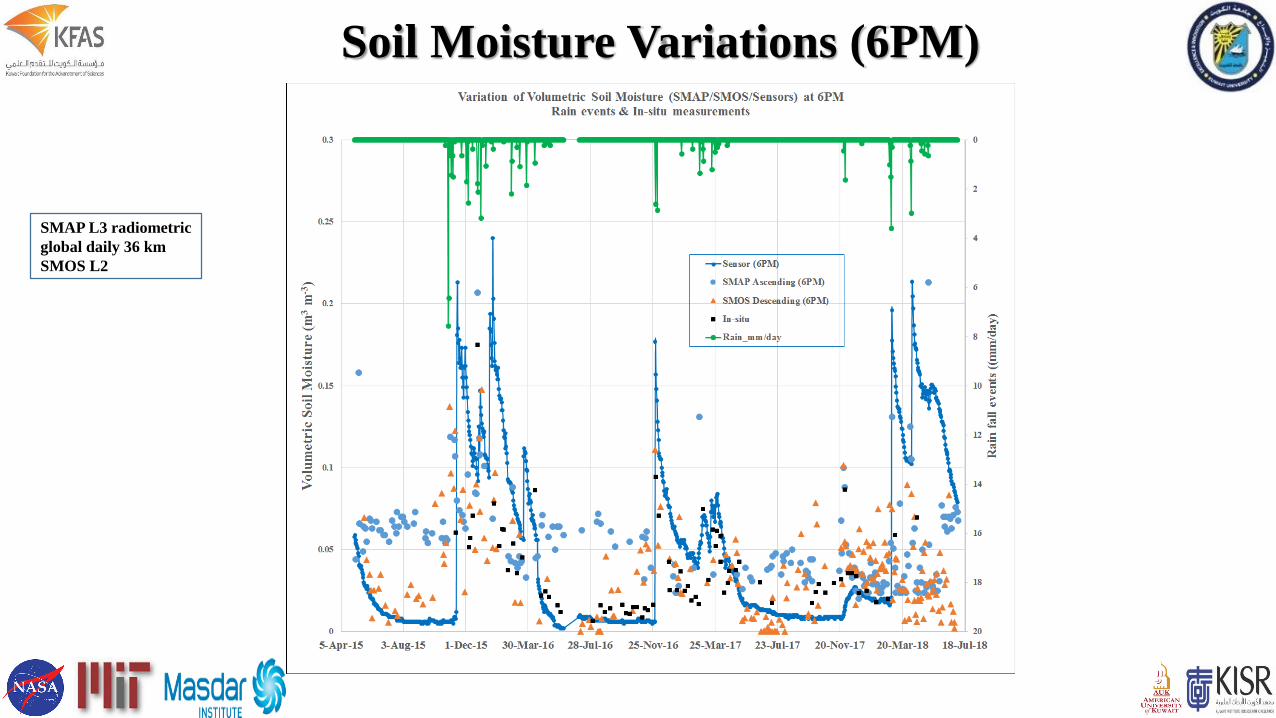
Soil Moisture Variations (6PM)
SMAP L3 radiometric
global daily 36 km
SMOS L2
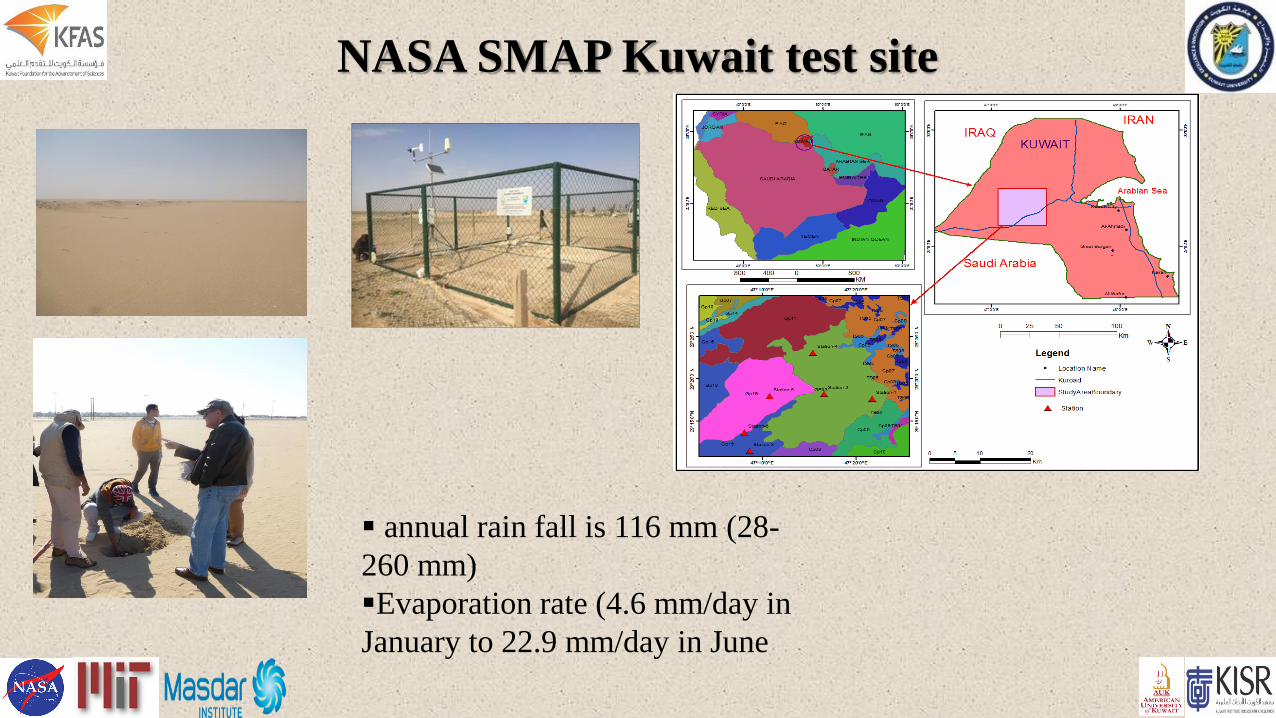
NASA SMAP Kuwait test site
annual rain fall is 116 mm (28-
260 mm)
Evaporation rate (4.6 mm/day in
January to 22.9 mm/day in June
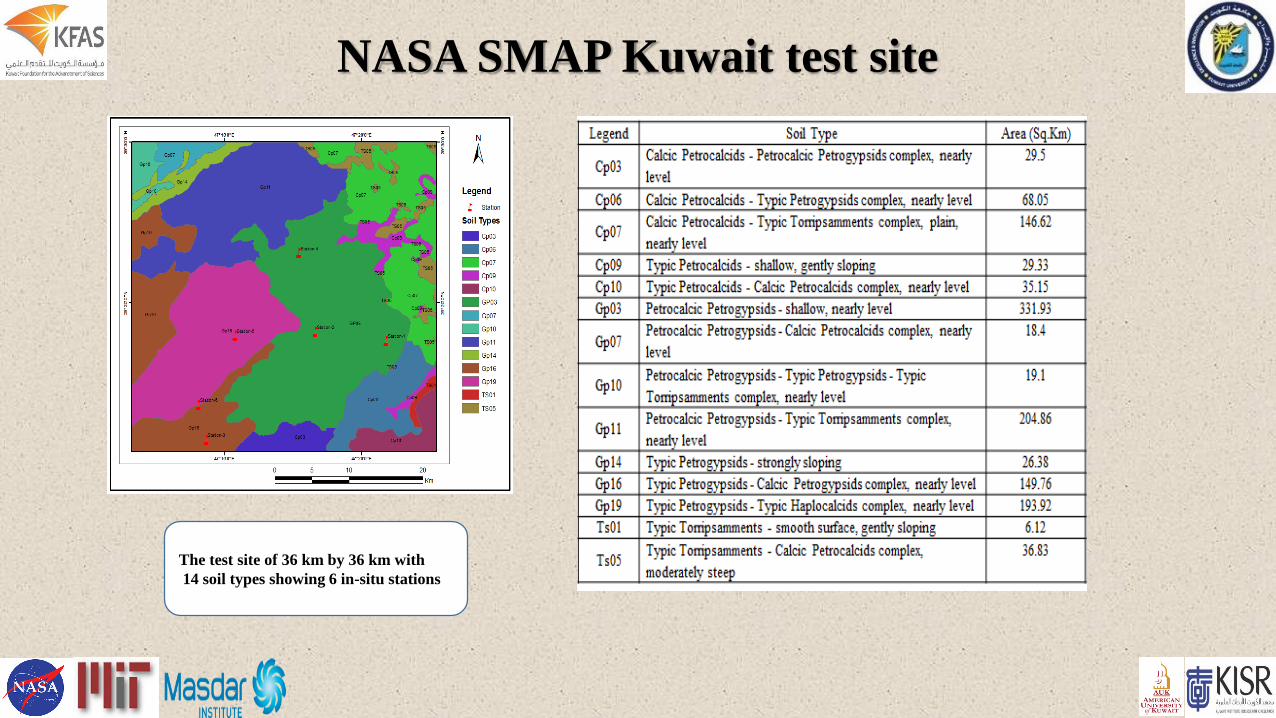
The test site of 36 km by 36 km with
14 soil types showing 6 in-situ stations
NASA SMAP Kuwait test site
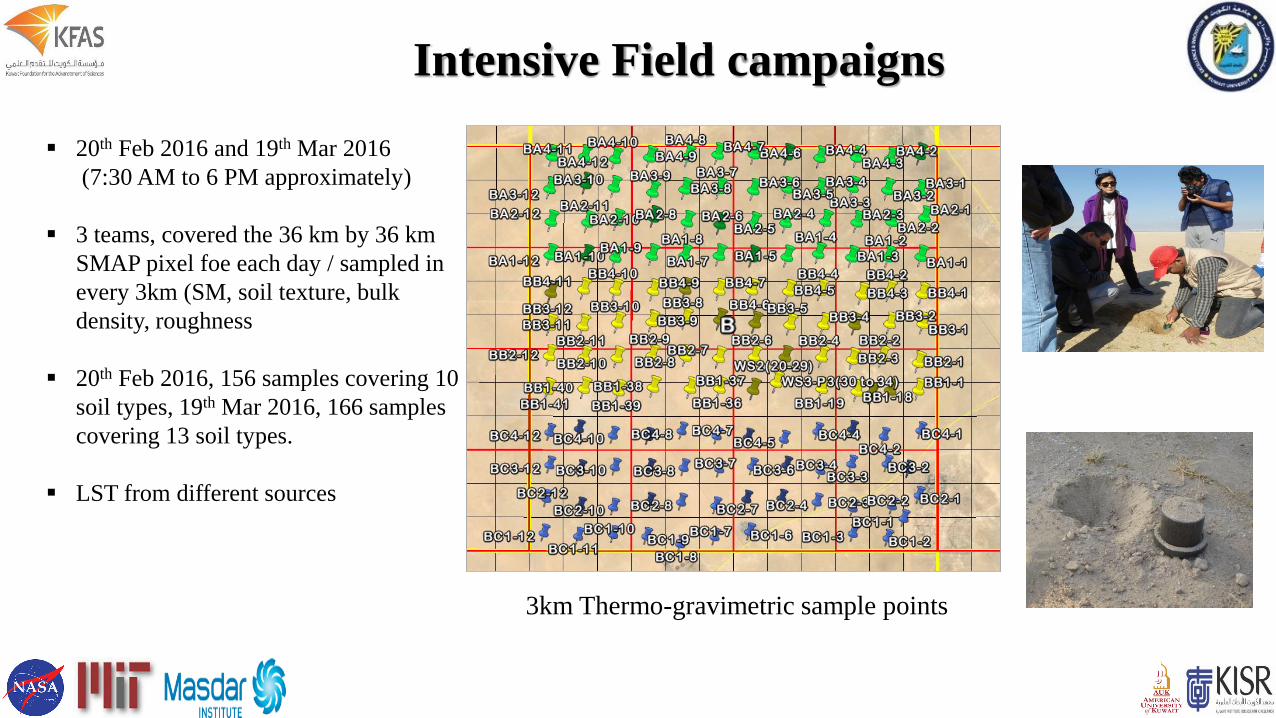
3km Thermo-gravimetric sample points
Intensive Field campaigns
20th Feb 2016 and 19th Mar 2016
(7:30 AM to 6 PM approximately)
3 teams, covered the 36 km by 36 km
SMAP pixel foe each day / sampled in
every 3km (SM, soil texture, bulk
density, roughness
20th Feb 2016, 156 samples covering 10
soil types, 19th Mar 2016, 166 samples
covering 13 soil types.
LST from different sources

Spatial Variation of Soil Moisture
0.000
0.010
0.020
0.030
0.040
0.050
0.060
0.070
0.080
0.090
100
120
140
160
180
200
220
240
260
1 61
11
62
12
63
13
64
14
65
15
66
16
67
17
68
18
69
19
61
01
106
111
116
121
126
131
136
141
Vo
lum
etri
c S
oil
mo
istu
re (
m3
m-3
)
Ele
va
tio
n (
m)
Grid Number
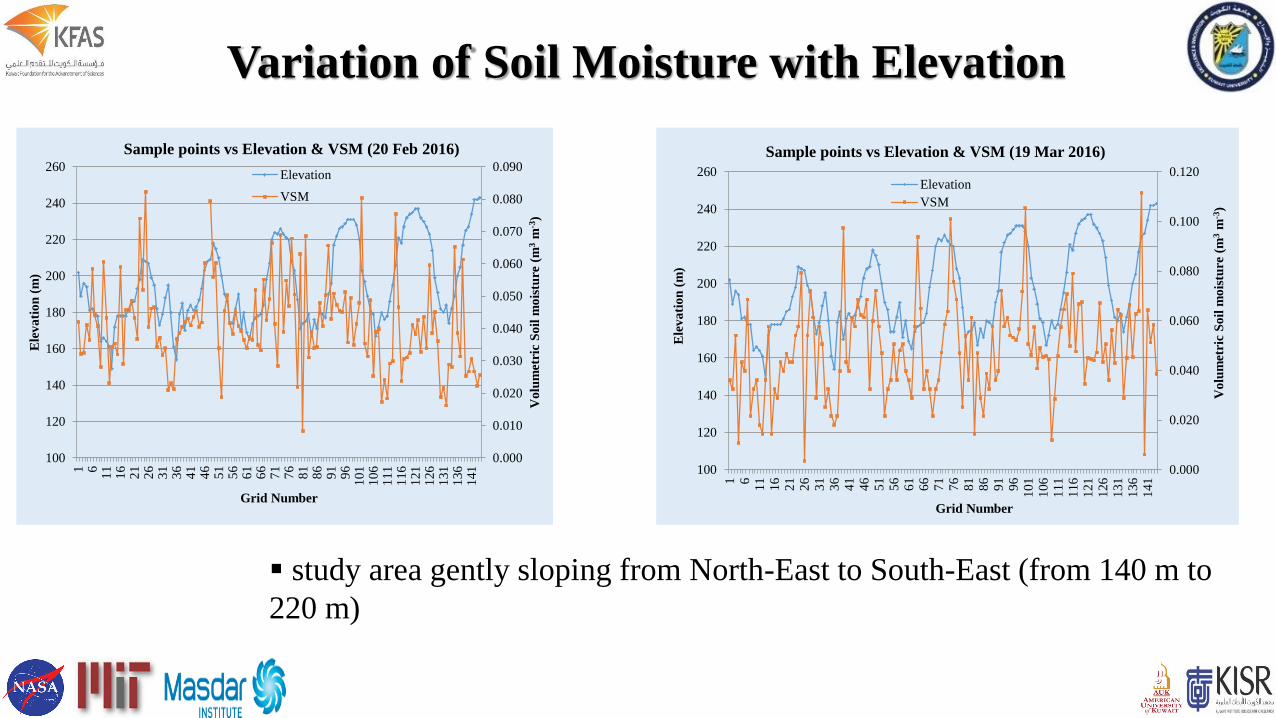
Sample points vs Elevation & VSM (20 Feb 2016)
Elevation
VSM
0.000
0.020
0.040
0.060
0.080
0.100
0.120
100
120
140
160
180
200
220
240
260
1 61
11
62
12
63
13
64
14
65
15
66
16
67
17
68
18
69
19
61
01
106
111
116
121
126
131
136
141
Vo
lum
etri
c S
oil
mo
istu
re (
m3
m-3
)
Ele
va
tio
n (
m)
Grid Number
Sample points vs Elevation & VSM (19 Mar 2016)
Elevation
VSM
Variation of Soil Moisture with Elevation
study area gently sloping from North-East to South-East (from 140 m to
220 m)
-0.020
-0.015
-0.010
-0.005
0.000
0.005
0.010
0.015
0.020
0.025
0 30 60 90 120 150
Mea
n R
ela
tive D
iffe
ren
ce (
MR
D)
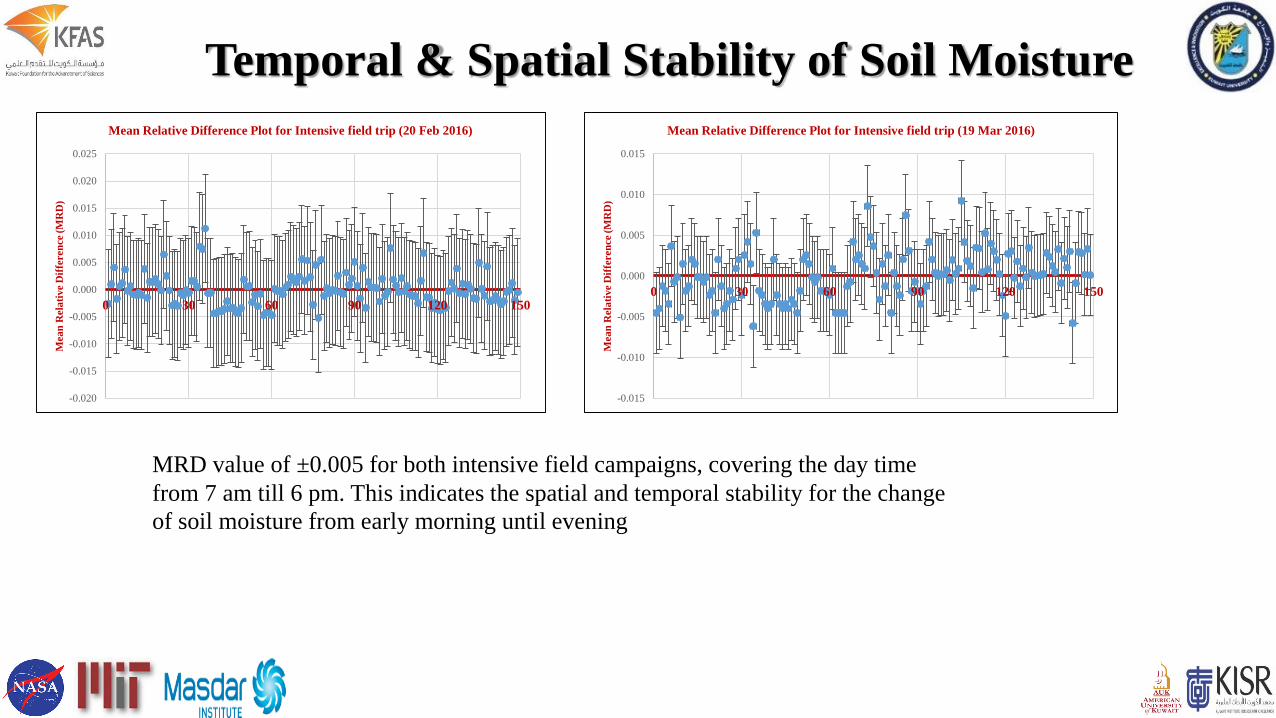
Mean Relative Difference Plot for Intensive field trip (20 Feb 2016)
-0.015
-0.010
-0.005
0.000
0.005
0.010
0.015
0 30 60 90 120 150
Mea
n R
ela
tive D
iffe
ren
ce (
MR
D)
Mean Relative Difference Plot for Intensive field trip (19 Mar 2016)
Temporal & Spatial Stability of Soil Moisture
MRD value of ±0.005 for both intensive field campaigns, covering the day time
from 7 am till 6 pm. This indicates the spatial and temporal stability for the change
of soil moisture from early morning until evening
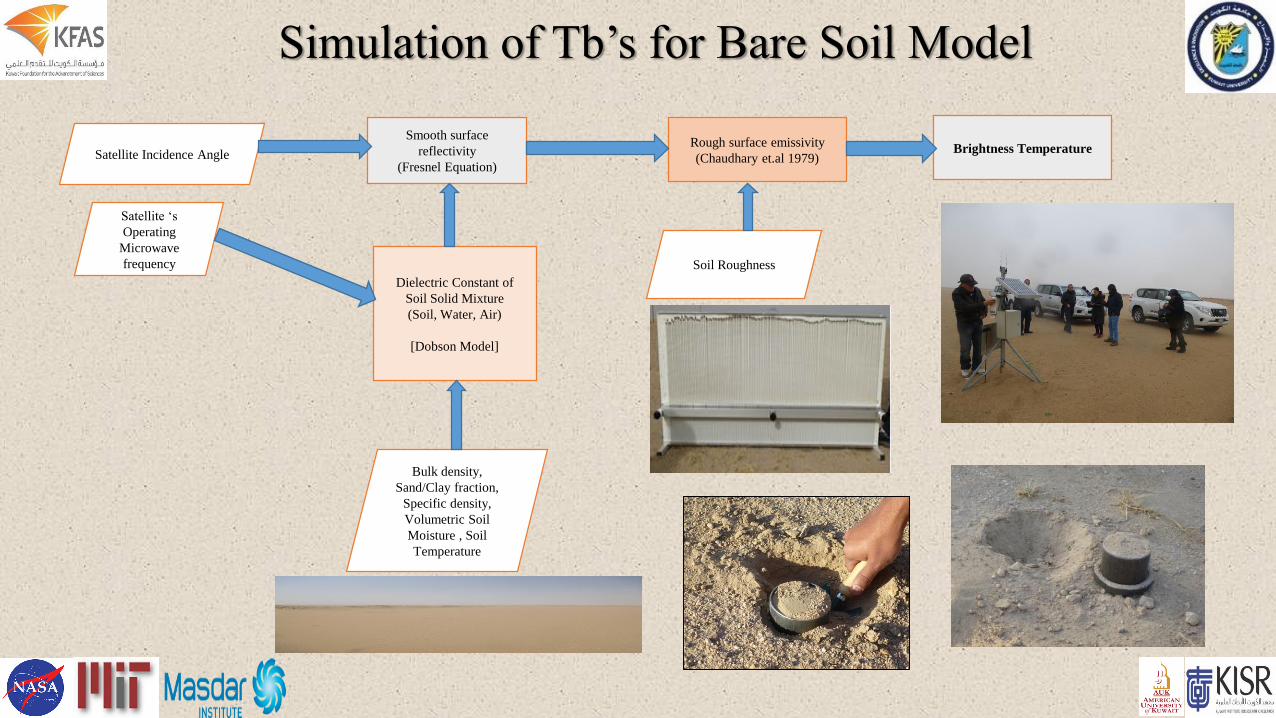
Bulk density,
Sand/Clay fraction,
Specific density,
Volumetric Soil
Moisture , Soil
Temperature
Dielectric Constant of
Soil Solid Mixture
(Soil, Water, Air)
[Dobson Model]
Smooth surface
reflectivity
(Fresnel Equation)Satellite Incidence Angle
Rough surface emissivity
(Chaudhary et.al 1979)
Satellite ‘s
Operating
Microwave
frequency Soil Roughness
Brightness Temperature
Simulation of Tb’s for Bare Soil Model
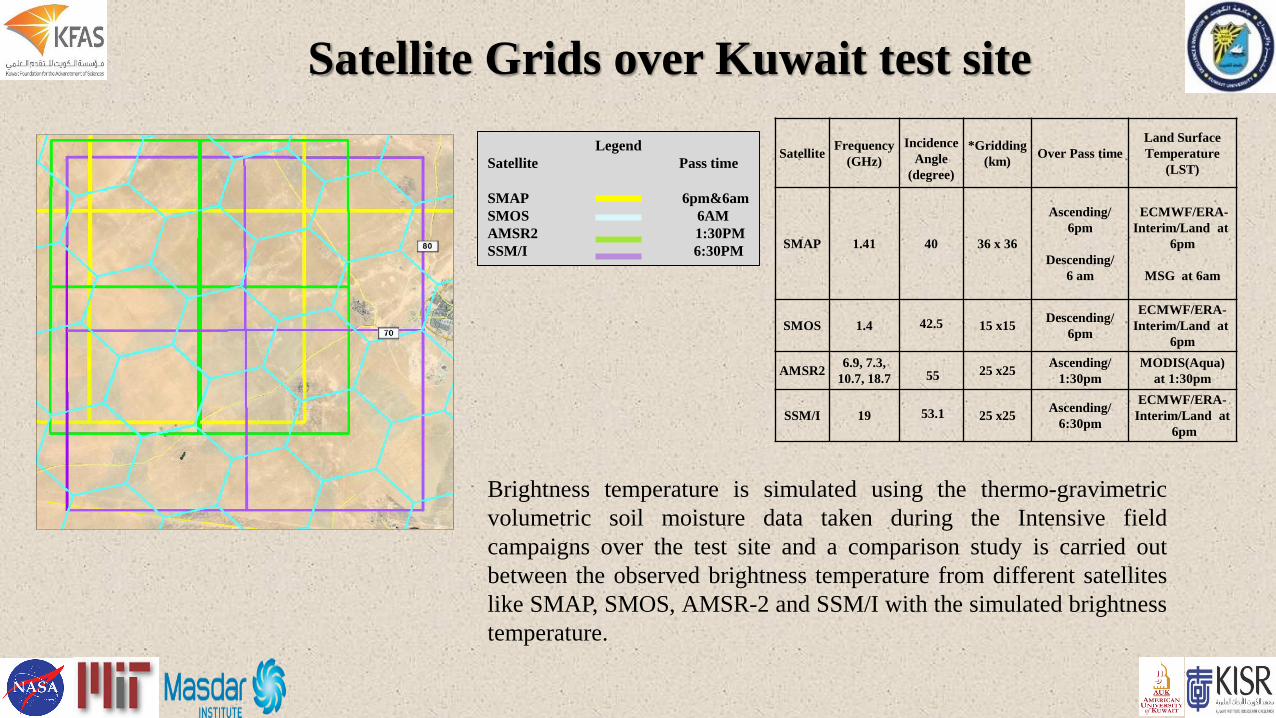
Legend
Satellite Pass time
SMAP 6pm&6am
SMOS 6AM
AMSR2 1:30PM
SSM/I 6:30PM
SatelliteFrequency
(GHz)
Incidence
Angle
(degree)
*Gridding
(km)Over Pass time
Land Surface
Temperature
(LST)
SMAP 1.41 40 36 x 36
Ascending/
6pm
Descending/
6 am
ECMWF/ERA-
Interim/Land at
6pm
MSG at 6am
SMOS 1.4 42.5 15 x15Descending/
6pm
ECMWF/ERA-
Interim/Land at
6pm
AMSR26.9, 7.3,
10.7, 18.7 55 25 x25Ascending/
1:30pm
MODIS(Aqua)
at 1:30pm
SSM/I 19 53.1 25 x25Ascending/
6:30pm
ECMWF/ERA-
Interim/Land at
6pm
Satellite Grids over Kuwait test site
Brightness temperature is simulated using the thermo-gravimetric
volumetric soil moisture data taken during the Intensive field
campaigns over the test site and a comparison study is carried out
between the observed brightness temperature from different satellites
like SMAP, SMOS, AMSR-2 and SSM/I with the simulated brightness
temperature.

Comparison between ECMWF & MERRA_2
The results shows a cold bias of
1.6 to 2 degree.
This result agrees with Trigo and
Viterbo, 2003, and Trigo et al.,
2015 for 6am and 6pm.

Input /Output Parameters for TB Simulation20 FEB 2016
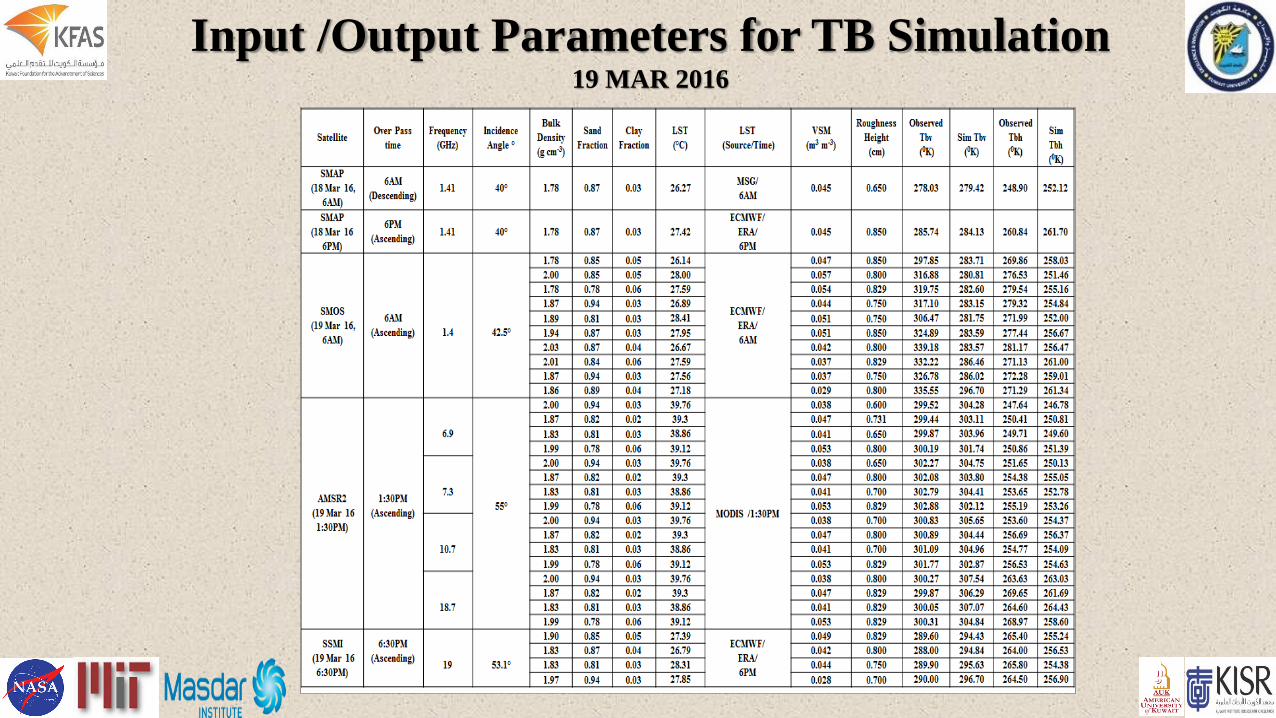
Input /Output Parameters for TB Simulation19 MAR 2016
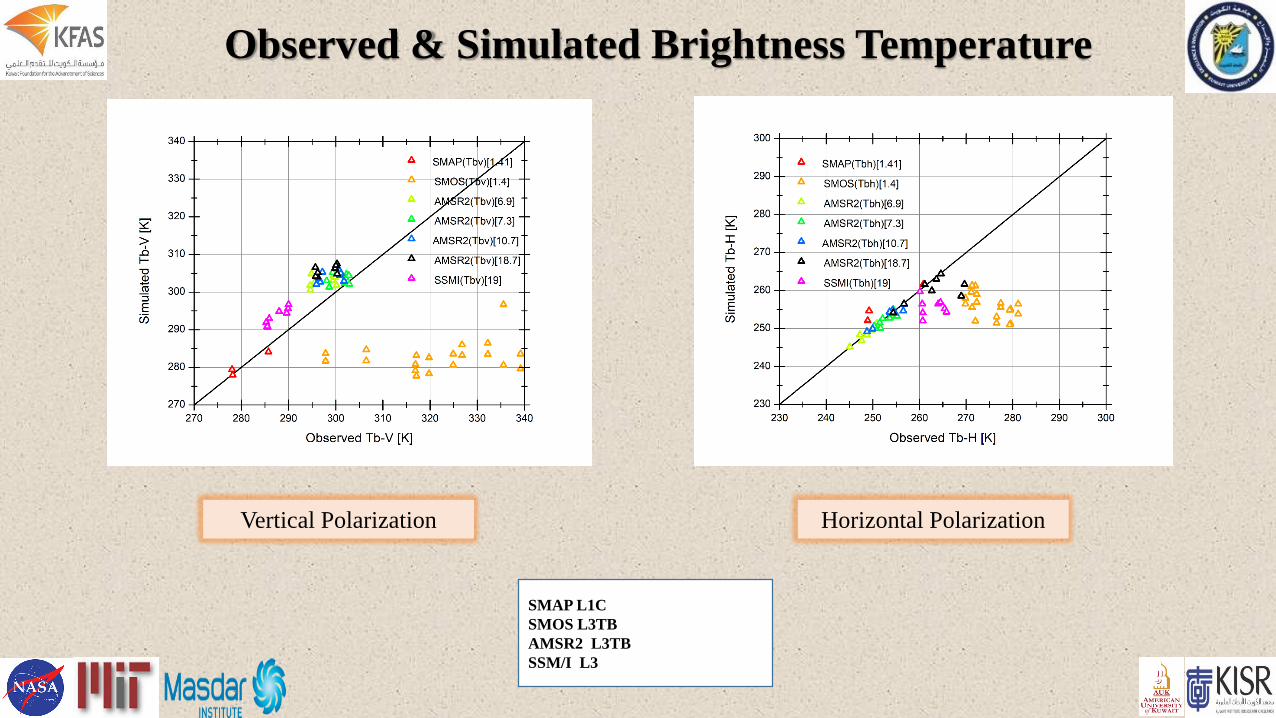
Vertical Polarization
Observed & Simulated Brightness Temperature
Horizontal Polarization
SMAP L1C
SMOS L3TB
AMSR2 L3TB
SSM/I L3

RFI Probability / SMOS blog
Radio-Frequency Interference (RFI) in SMOS
context are artificial emissions made within the
1400-1427 MHz band
RFI presence
blue very low probability
red very high probability

RFI Characterization / SMOS blog
o The color of each RFI is proportional to its averaged BT.
o As RFI BTs are the sum of the natural thermal noise and the
artificial emission, BT lower than 300K are not represented.
o The maximum of the color bar is fixed at 10000K in all
images for consistency, but in many cases stronger RFI are
present.
o The size of each point is proportional to RFI persistence in
SMOS data, i.e. the number of times the RFI was detected.
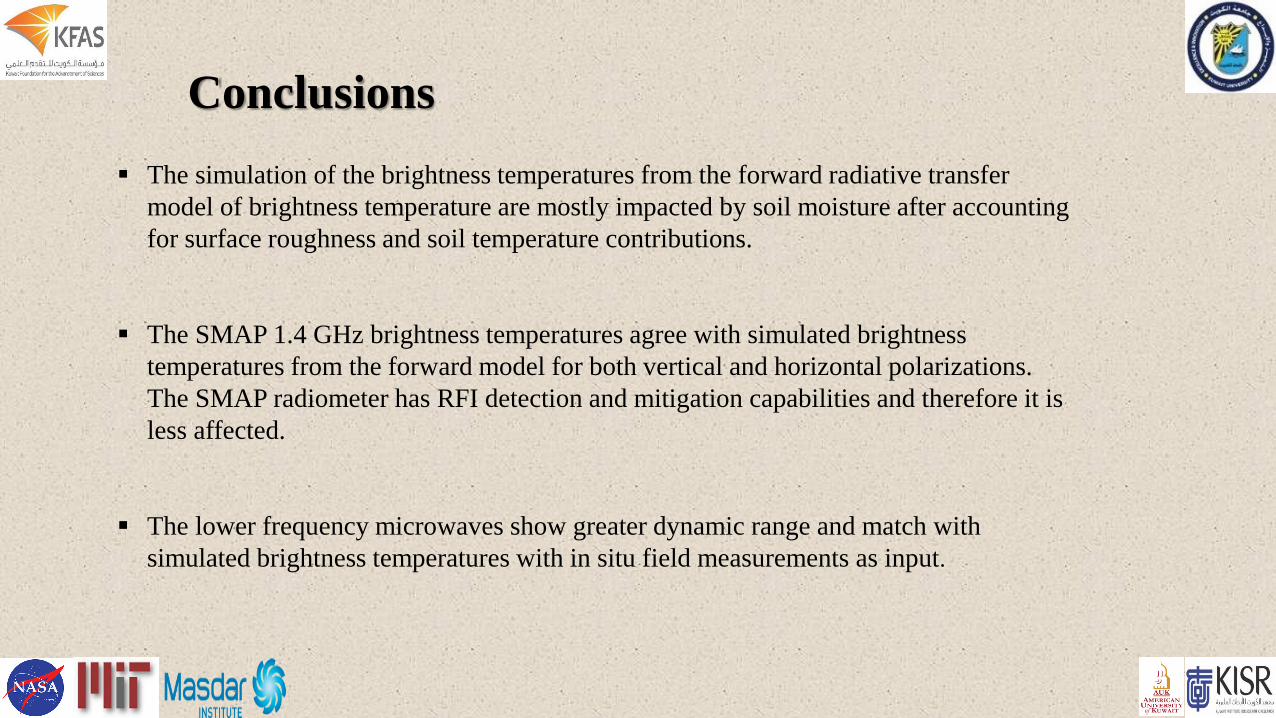
The simulation of the brightness temperatures from the forward radiative transfer
model of brightness temperature are mostly impacted by soil moisture after accounting
for surface roughness and soil temperature contributions.
The SMAP 1.4 GHz brightness temperatures agree with simulated brightness
temperatures from the forward model for both vertical and horizontal polarizations.
The SMAP radiometer has RFI detection and mitigation capabilities and therefore it is
less affected.
The lower frequency microwaves show greater dynamic range and match with
simulated brightness temperatures with in situ field measurements as input.
Conclusions

Conclusions
NASA SMAP Kuwait test site / only Test Site in Arabian
Peninsula /Unique Desert features and Electromagnetic Noise
The SMOS 1.4 GHz measurements are apparently affected by RFI and have considerably
higher brightness temperatures.
At mid-range microwave AMSR2 frequencies, the vertical channel measurements are
uncorrelated with the forward model simulations with in situ inputs but the horizontal
polarization satellite measurements are well correlated.
At the highest AMSR2 and SSMI frequencies (18.7 and 19 GHz respectively), even for bare
soils, the satellite measurements at both polarizations cannot track changes in surface soil
moisture due to both model sensitivity and atmospheric effect.
Acknowledgement
The authors are thankful to Kuwait Foundation for the Advancement of Sciences
(KFAS) for sponsoring this Project no. P21544SP01. Also grateful to Kuwait
University (KU) for their continuous support.
Recommended