Evaluation of the DIAL technique for studies on NO2 using amobile lidar system
Kent A. Fredriksson and Hans M. Hertz
The DIAL technique for remote monitoring of nitrogen dioxide is evaluated. A comprehensive field testand evaluation program was performed to determine the measuring capability for this pollutant. The po-tential sources of error are discussed and these are analyzed for the mobile lidar system used in the work.This system employs a dye laser pumped by a Nd:YAG laser; a laser source which has improved the measur-ing accuracy compared with earlier work on nitrogen dioxide. The accuracies are found to be good enoughfor measuring needs in many studies on air pollution problems. A few typical examples of measurementsfrom the field test program are given.
1. Introduction
The DIAL technique has proved to be useful for re-mote monitoring of atmospheric pollutants. Researchteams have demonstrated measurements on severalmolecules, e.g., SO2, 03, NO2 , Hg, NO, C2H4 , CO, H 20,and CH4.1 The lidar research within our group wasinitiated in 1975 and several early field tests were car-ried out.2 In 1979 a mobile lidar system was con-structed which was presented in a detailed paper. 3 Thesystem was evaluated and tested for two and a half yearsand a summary report containing a number of conclu-sions was written.4 A paper focused on strategies androutines for DIAL measurements on SO2 has also beenpresented.5 In this work the DIAL technique was an-alyzed with special regard to measurements on NO2.Several field tests and experiments to determine themeasurement accuracies were made and examples fromthese are presented in this paper. Potential systematicerrors and signal-to-noise ratios in DIAL measurementsare discussed, and comparisons are made with the mo-bile system in practical applications.
The first DIAL experiments on NO2 were made in1973-74 by Rothe et al.6 and by Grant et al.7 In 1979Baumgartner et al. 8 conducted a study on NO2 in whichthe DIAL measurements were compared to a conven-tional point monitoring system. These early studieswere all made with flashlamp-pumped dye lasers and,
The authors are with Lund Institute of Technology, Physics De-partment, Center for Laser Studies of the Environment, P.O. Box 725,S-220 07 Lund, Sweden.
Received 18 October 1983.0003-6935/84/091403-09$02.00/0.© 1984 Optical Society of America.
with respect to the high consumption of coumarin dyesin such lasers, it is not likely that such lasers can be usedfor routine measurements on NO2. In addition evalu-ations of the NO2 measurement accuracy were pre-sented, which were quite discouraging in view of themeasurement needs (e.g., Ref. 9). NO2 DIAL mea-surements were made by our group in 1976 employinga dye laser pumped by a nitrogen laser. The limitationin this case was the low laser pulse power, which madedaytime measurements difficult. With the availabilityof Nd:YAG laser-pumped dye lasers, which we obtainedin 1979, the practical aspects of the NO2 DIAL tech-nique were improved. It is now possible to do daytimemeasurements of source emissions, background con-centrations, and concentrations in metropolitan areas,and the detection limits and accuracies of the remotesensing is comparable with those of conventional pointmonitoring instruments.
II. NO 2 Pollutant
During the last few decades nitrogen oxides haveemerged as one of our major air pollution problems.The emissions of nitrogen oxides were estimated to havedoubled in the major Swedish cities from 1960 to 1980.Except for their direct toxicity, they cause acidificationof water, play an important role in the formation ofphotochemical smog, and are active in atmosphericchemical reactions.
The nitrogen oxides are emitted primarily from threetypes of source: the burning of fossil fuels, industrialprocesses at nitric acid plants, e.g., artificial fertilizerplants and explosives plants, and motor vehicle traffic.The bulk of the nitrogen oxides (NO.,) is emitted as thenontoxic compound NO, which is formed in high tem-perature reactions between nitrogen and oxygen.When NO is emitted into the atmosphere, it is oxidized
1 May 1984 / Vol. 23, No. 9 / APPLIED OPTICS 1403
with 02 and 03 to NO2. The reaction with 03 is nearlyinstantaneous, whereas oxidization with 02 is slow anddepends strongly on the NO concentration. The half-life of 1-ppm NO is -100 h and of 0.1 ppm ten timeslonger.'0 In the atmosphere the NO and NO2 are en-gaged in a complicated set of reactions forming com-pounds such as HNO2 , HNO3 , and NO3 . The complexNO. chemistry is currently under investigation by manygroups.
It has been shown that NO2 causes plant injuries atconcentrations below 500 Aug/m
3 and may cause dif-ficulties in breathing at 200 /ug/m
3 . Some investigationsconnect the increased occurrence of cancer in metro-politan areas with NO2. In rain, the gas is dissolved inwater forming nitric acid, which has been found tosubstantially contribute to the acidification problem.
111. Differential Absorption Lidar Technique forMeasurements on NO 2
The principle of the differential absorption lidar(DIAL) technique has been described before (e.g., Ref.11). In this paper the theory is briefly outlined and thedetails which are important for the accuracy in thepractical work are discussed more thoroughly.
In a DIAL measurement the lidar return, backscat-tered from the atmosphere or a target and collected viaa telescope, is studied at two or more wavelengths. Thepower P of the lidar signal for a wavelength X from arange interval AR at the distance R can be expressed ina simplified form as
Px(R,AR) = C(R)WabN(R) RR
X exp {-2 S [,()X)n(r) + .aN(r)]dr}. (1)
In this equation C(R) is a system function, W is thetransmitted laser pulse power, 0
b is the average back-scattering cross section of the N(R) scattering objectsper unit volume, and the exponential is due to the at-tenuation by molecules, n(r), and particles, N(r), withabsorption cross sections o(X) and oa, respectively.When NO2 is studied, the lidar signal at a wavelengthof the absorption spectrum in the blue region, typically448.1 nm, is measured. A reference measurement ismade at a close-lying wavelength, e.g., 446.8 nm, wherethe absorption cross section for the gas is much lower.Since there are no atmospheric gases with interferingabsorption spectra in this spectral region, it is in prac-tical cases sufficient to measure at two wavelengths.The evaluation of the DIAL measurement is made bydividing the two lidar signals for each distance R:
pXb.(. = C'exp{-2 [of(448.1) - (446.8)In'(r)dr}s (2)Pxref(R) I
where C' is a new system constant, u(448.1) and (446.8)are the absorption cross sections at the wavelengthsstudied, and n'(r) is the NO2 concentration at the dis-tance r, which is the integration parameter in the inte-gral. The quotient will decrease at the distances wherethe gas is present and the slope is determined by theconcentration.
From the DIAL equation, Eq. (2), the mean concen-tration of NO2 is calculated for range intervals R2 -R,according to the equation
n'(r) = 2(R 2 - Rl)[o(448.1) - o(446.8)]K-
X In PXabs (R)Pref(R2)Pxref(Rl)PXabJ(R2)
(3)
The range interval is swept with the distance R to obtainthe concentration profile along the measurement di-rection. The selected length of the range interval in thecalculation, which is the distance resolution in themeasurement, depends on the physical situation in thestudy. When a distinct plume is measured, 10 m canbe appropriate, but when an ambient air concentrationis studied an interval of several hundred meters ischosen. The detection limit in a DIAL recording canbe expressed as the measurable concentration multi-plied by the range interval in mg/m3 - m or ppm m.
The accuracy in a DIAL measurement depends di-rectly, according to Eqs. (2) and (3), on the accuracy inthe determination of the differential absorption crosssection of the gas at the two wavelengths. In the caseof NO2 this factor, which also demands an accurateknowledge of the measurement wavelengths, can bereduced to a minor source of error. When gases suchas NO and Hg with narrow absorption lines in the UVregion or gases with spectra in the IR region are mea-sured, the determination of the cross section can be ofcrucial importance for the accuracy.
In the ideal case the DIAL equation has no distancedependence except for the dependence on the NO2concentration along the measurement direction, whichis expressed by the integral in Eq. (2). In the actualsituation this is not always the case and there may beanother differential distance dependence in the lidarsignal at the two wavelengths. This dependence, whichcan be described by C'(R) in Eq. (2), might cause asystematic error in the measurements. The sources forsuch a dependence will be discussed here, and in thefollowing sections our special system and applicationsof the technique will be discussed in this respect.
A very important detail to consider in a DIAL systemis the overlap of the transmitted laser beam with thetelescope field of view. The overlap generally has adistance dependence, which is included in the systemfunction C(R) in the lidar equation. In principle aslight misalignment of the laser beam compared to thetelescope gives no systematic error in a DIAL mea-surement but merely reduces the signal-to-noise ratiobecause of the lost efficiency in the detection. However,if one of the two wavelengths has a different overlapwith the telescope field of view compared with the otherwavelength, a systematic error is introduced. It can bedifficult to align the two laser beams exactly if differentlaser sources are used for the two wavelengths, but evenif the same laser is used, differences in the beam direc-tion may occur. Prisms and other wavelength disper-sive elements in the laser beam path in the system area potential source of differential misalignment. For
1404 APPLIED OPTICS / Vol. 23, No. 9 / 1 May 1984
close-lying wavelengths these effects are normally verysmall, and with a field of view somewhat larger than thelaser beam divergence the problem is negligible.However, in measurements at short distances it is alsoessential that the spatial intensity distribution of thelaser beam be the same for the two wavelengths, sincethe telescope field of view is limited at short distances.In a coaxial lidar the backscattering at short distancesis partly blocked by the folding mirror in the telescope,and thus the overlap will depend on the spatial intensitydistribution of the beam. This effect is more importantif the two laser beams are generated by differentsources. When frequency shifting crystals are em-ployed, e.g., in DIAL measurements on 03 or SO2, thespatial distribution is changed, and then the same dif-ferential effect exists even with a single-laser source.
The reduced overlap of the laser beam and the tele-scope field of view at shorter distances is sometimesreferred to as geometrical compression of the lidar sig-nal, and the dependence can be described with anoverlap or crossover function.' 2 ' 5 By changing theoverlap function the dynamic range of the signal can bereduced. However, in a DIAL system the effect mustbe dealt with carefully to avoid systematic errors.
In some cases a topographic target can be utilized toincrease the measurement range in a DIAL study.Then a similar problem may appear if the topographictarget is nonuniform and if the laser beam cross sectionis not exactly the same for the two wavelengths.
In the division of the two lidar expressions leading toEq. (2) it is assumed that the backscattering functionclbN(r) and the attenuation exponential are exactly thesame except for the NO2 dependence. This presump-tion is true on the average, since there is, in practice, nostrong wavelength dependence in the backscatteringand there are no interfering absorbing gases at thestudied wavelengths. The scattering and attenuationfrom particles generally have a smooth wavelength de-pendence as they are well distributed over different sizesand shapes. However, each single lidar signal is uniqueand reflects the time-varying atmospheric conditions.Thus, one pair of lidar signals should be measured at thesame time or at least within tens of microseconds tofulfill the requirements for Eq. (2), and this in turnusually requires two laser sources. If only one laser isused and the lidar signals are separated in time, someperiod of signal averaging is needed to give comparablerecordings. Practically, this means that the laser isalternately tuned to the two wavelengths and with a10-Hz laser the signals are then 0.1 sec apart. In thiswork we have shown that this procedure does not causeany difficulties in most measurements on emissions orthe ambient air. Some period of averaging is neededanyway to gather enough statistics and to perform ameasurement which is representative for the pollutionsituation.
However, the averaging itself may be a systematicsource of error. Generally the lidar signal in the formof Eq. (1) is averaged, but the NO2 concentration isproportional to minus the logarithm of the signal.When a stable atmospheric situation is present no error
is introduced, but if the concentration varies greatly alower value than the actual mean concentration will bemeasured. The remedy for this is to avoid measure-ments of fluctuating high concentrations. If, for ex-ample, the flow of a stack plume with high concentrationof the studied gas is to be measured, the measurementshould be made at some hundred meters from, thesource, where the plume has spread somewhat and theconcentration is lower. Alternatively the logarithm ofthe signal can be taken before the averaging. In thiswork the latter technique was not applied but it will betested in the continuing study. A similar error canoccur if the relative power of the two laser beamschanges during the averaging. This is not likely tohappen in a single-laser system measuring NO2, but ina system with two lasers or if optical frequency shiftingis employed in, e.g., SO2 measurements, it has to beconsidered. The effect is of special importance whenstudying an inhomogeneous atmosphere, e.g., in an in-dustrial area with several diffuse particle plumes.
The DIAL equation, Eq. (2), is based on the as-sumption that the lidar signals are made up of single-scattering events in the atmosphere. However, inhigh-turbidity atmospheres multiple scattering con-tributes considerably to the collected lidar signals,which can introduce a systematic error. When a gas-eous content in a dense plume is measured, Eq. (3) thenimplies a too-low value for the concentration, since thelidar signal representing the distances behind the plume[R2 in Eq. (3)] is to some extent made up of multiplescattering in the plume. The remedy is to avoid mea-surements in the dense plume and measure thespreading plume instead. The same source of errorappears in studies on distributed gases in very hazy andfoggy atmospheres which makes measurements diffi-cult. The multiple scattering can be partly discrimi-nated by placing a polarizer in the detection system,taking advantage of the fact that the plane polarizationof an incident laser beam is retained only in the singlescattering from spherical particles.1 6417 To ourknowledge there have been no systematic studies of sucha detection scheme in DIAL measurements, but we planto test the technique in our continuing work.
Linearity of the signal detection system is essential.In principle a photomultiplier tube, which is used forthe detection of the returning light, does not give asignal strictly proportional to the detected number ofphotons. The nonlinearity is worse for strong signalsand must be compensated for. This can be done afterthe averaging if the signal does not fluctuate apprecia-bly. For weak lidar signals the detection signal is verynearly linear. In nighttime measurements the back-ground level can be extremely low and then a weaksignal can be captured in a linear photon countingmanner. The transient recorder of the lidar systemmust be carefully adjusted for a linear response, and itis also essential that the triggering of the recorder isexact. If the gain of the photomultiplier tube is mod-ulated or gated, which it often is to increase the dynamicrange of the detection system, it is also important thatthe modulation be synchronized with the laser pulse.
1 May 1984 / Vol. 23, No. 9 / APPLIED OPTICS 1405
LY
V 1 DII
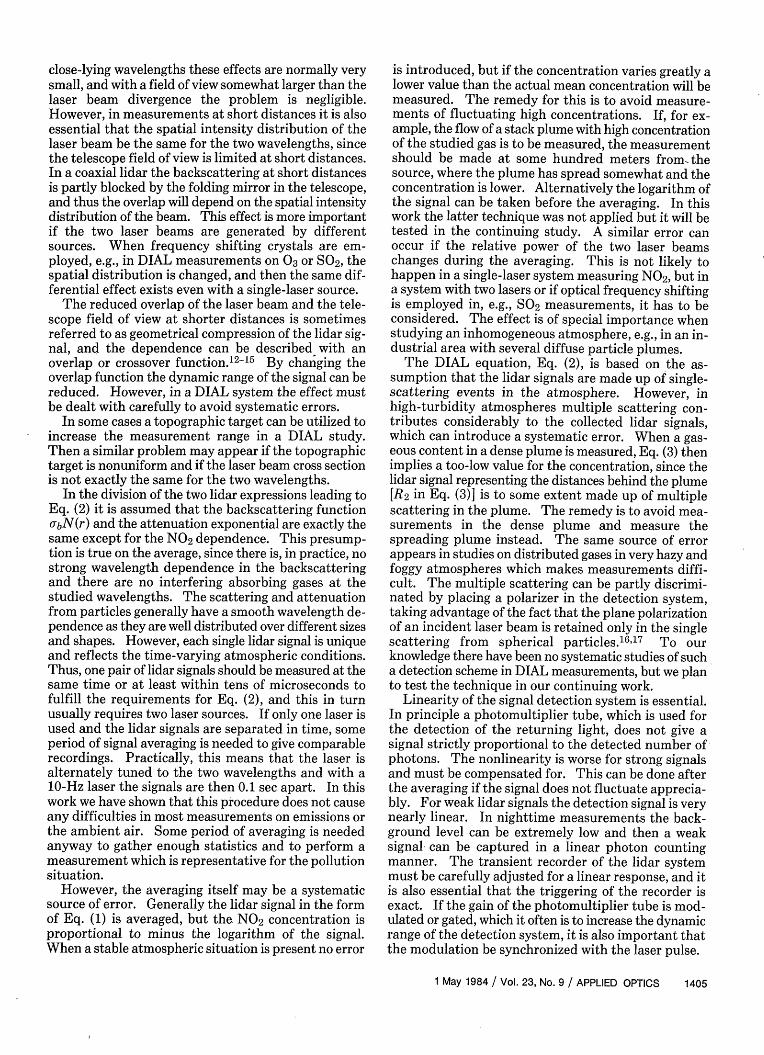
Fig. 1. Schematic diagram of the electronic and optical arrangements of the mobile DIAL system.
IV. Mobile System for NO2 DIAL Measurements
A mobile lidar system was constructed in 1979 at theChalmers University in Gothenburg, which at that timewas the base for our activities. Figure 1 is a schematicdiagram of the system, which has been described in adetailed paper.3 Some basic parameters for the lidarsystem are given in Table I. Here we will only discussthe details which are of special interest in applicationsof the DIAL technique for measurements on NO2 . Theaccuracies of the technique, which were determined inthis work, are typical for those attainable with a dedi-cated mobile NO2 DIAL system intended for mea-surements performed on a routine basis. In some casesthe accuracies and especially the measurement rangesmay be further improved, but we think that this workis a useful example, which describes the technical andpractical capability in routine work on air pollution.
The Nd:YAG laser-pumped dye laser of the mobilesystem is wavelength calibrated by studying the ab-sorption spectrum of NO2 in the wavelength region inquestion. The calibration routine is simple, employinga gas cell which contains a mixture of NO2 and N2 atatmospheric pressure, and the procedure is run throughbefore each study. The linearity of the wavelengthscale of the laser has also been checked with a mono-
Table 1. Basic Parameters of the NO2 DIAL System
Transmitted pulse energy 1-4 mJPulse duration -7 nsecPulse repetition rate 10 HzLaser beam divergence 0.7 mradDiameter of the receiving telescope 30 cmMaximum transmission of the interference filter 54%Bandwidth of the interference filter 5 nmQuantum efficiency of the photomultiplier tube 17%Sample interval of the detection electronics 10 nsec
chromator and recently a hollow cathode discharge unithas been included for very precise calibration employingthe optogalvanic effect. The spectrum of neon has beenutilized for calibration in the 560-600-nm wavelengthregion, and we are planning to apply a similar techniqueto other parts of the visible spectrum.
The rapid wavelength tuning of the dye laser, whichchanges the wavelength between each shot, is made witha rotating eccentric wheel coupled to the grating of thelaser. The laser is fired when the wheel and the tuningangle of the grating are at preset positions. The wheelis turned by a stepping motor with a resolution of 400steps/revolution.
In the calculations of NO2 concentrations the ab-sorption cross sections measured by Woods and Jol-
1406 APPLIED OPTICS / Vol. 23, No. 9 / 1 May 1984
M lf t
I
liffe18 are employed. Since the spectral bandwidth inthese measurements was larger than the bandwidth ofthe laser in our system, we have made some comple-mentary tests.
To confirm the accuracy in the DIAL measurements,the studies of the differential NO2 spectra were madein a similar way as for an ordinary DIAL recording withexactly the same equipment. A gas cell with 6 g/m3 ofNO2 in N2 at atmospheric pressure was put into thelaser beam before entering the output optics of thesystem. The backscattered lidar signal from the at-mosphere at a close distance was collected while thecomputer shifted the wavelength between each lasershot as in a DIAL recording. The wavelength shift was1.3 nm, which is the usual shift in our NO2 measure-ments. The DIAL signal was calculated for differentpairs of wavelengths in the region of interest. Themeasurement points were changed by the basic settingof the dye laser grating, whereas the preset positions ofthe rapid wavelength shifting unit were the samethroughout the test. The interval between the pointswas chosen to be 8 or 16 pm, which is of the same orderof magnitude as the bandwidth of the laser. Additionaltests were made to study the small interference effectsof the laser intensity which were introduced by the gascell windows. In this simulation of a DIAL measure-ment all uncertainties in the differential absorptioncross-sectional value were exploited. The differentialspectral dependence was compared with the spectrumof Woods and Jolliffe. The conclusion from the studyis that the parameter of the differential absorption inour NO2 measurements is 8.3 (0.5) cm-' atm 1. Theerror limit also includes the uncertainties in the wave-length calibration and the rapid wavelength shiftingsystem, which together were <0.1 nm. It is possible tofurther increase the accuracy by determining the exactwavelengths in the measurement, which will be done byoptogalvanic calibration.
Since the two laser beams are generated by the samelaser and transmitted through the same optical com-ponents before leaving the system, they are collinearand there should be no distance dependence in thesystem parameter C' in Eq. (2). However, there arewavelength dispersive elements in the dye laser andthere are two right-angle prisms in the beam path,where the beam might deviate from an exact perpen-dicular incidence, giving rise to a small wavelength de-pendence in the beam direction. These effects havebeen calculated and studied in the practical work andthey are found to be negligible at distances larger than200 m. To make doubly sure, the aperture in the tele-scope is kept wide enough so that the telescope field ofview is somewhat larger than the laser beam divergence.This can be easily checked and adjusted during themeasurements. At distances shorter than 200 m wehave observed a wavelength dependence of the lidarsignal which varies with the precise adjustment of thelaser beam direction. A slight misalignment of the twobeams or a small difference in the intensity distributionmay give a distance dependence since the overlapfunction of the beam and the telescope field of view maythen change drastically. In NO2 measurements it is
possible to carefully adjust the beam direction and avoidthis problem with our system. However, in a typicalroutine measurement such a precise adjustment is notdone. In an SO2 or 03 DIAL measurement involvingdifferent optical components for the two beams, theproblem is more difficult to solve.
The photomultiplier tubes in the system are the EMI9817 type and the units were selected to give a morelinear response than average tubes. The one used inthis work is equipped with a dynode chain which can bemodulated to increase the dynamic range of the mea-surements. The linearity of the detection system wasfound to be very good when tested with optical neutraldensity filters. Furthermore, the fact that the laserpower on the two wavelengths is always kept equal en-sures that there is no source of systematic error due toany nonlinearity. These tests also involved the tran-sient recorder of the system, a Biomation 8100 unit,which needed an accurate adjustment in order to makeit linear when it was included in the system. Since thisunit has a dynamic range of 256 steps (8 bits) only, themodulated gain of the photomultiplier tube is essential.In the single-photon detection domain for weak lidarsignals it is important that each detected'photon givesrise to a few steps. The transient digitizer might oth-erwise introduce systematic errors in the form of ir-regularities in the averaged lidar curve.
The transient recorder is triggered by a pulse gener-ator which also triggers the Q-switch of the Nd:YAGlaser. There is an adjustable delay from the triggerpulse to the Q-switch pulse and therefore the signal ofthe PMT can be stored 200 nsec before the laser is fired.Thus, each captured lidar signal contains a distinct startindication coming from laser beam scattering by theoutput optics. From these indications it is ensured thatthe triggering of the transient recorder is exact. In theevaluation of the measurement results the time scale isautomatically compensated for the time delay in therecorded data. The triggering of the PMT gain mod-ulation, which in turn is made by the transient recorder,and the shape of the modulation pulse have also beencarefully examined and were found to be very repro-'ducible.
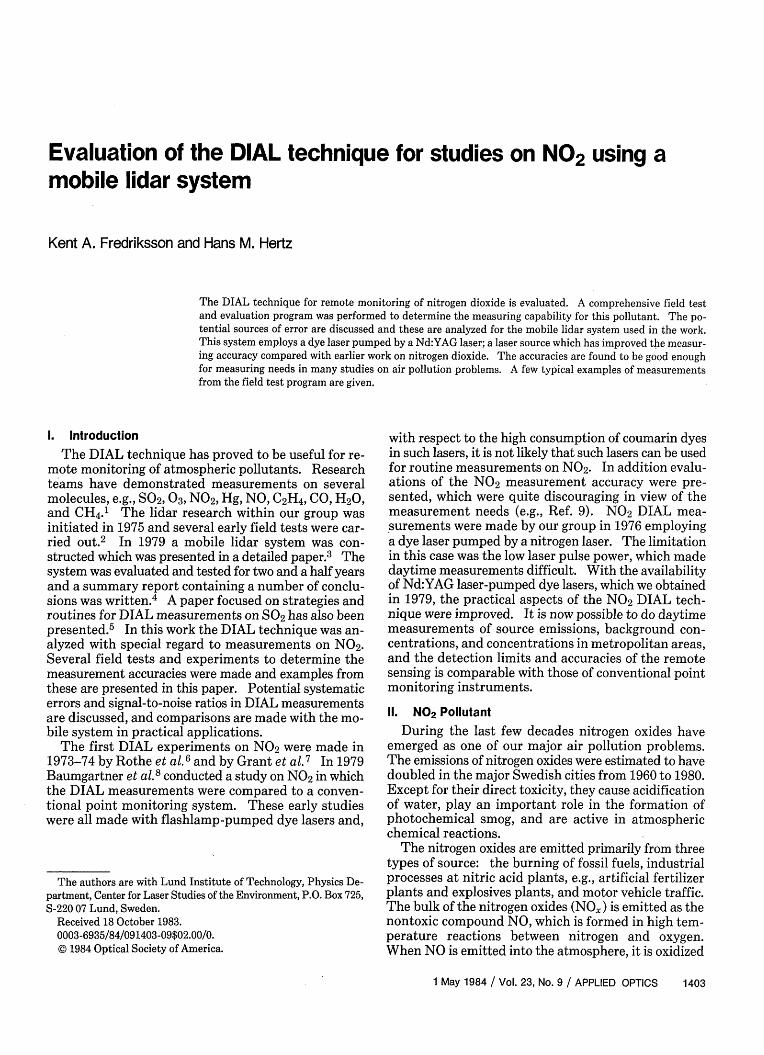
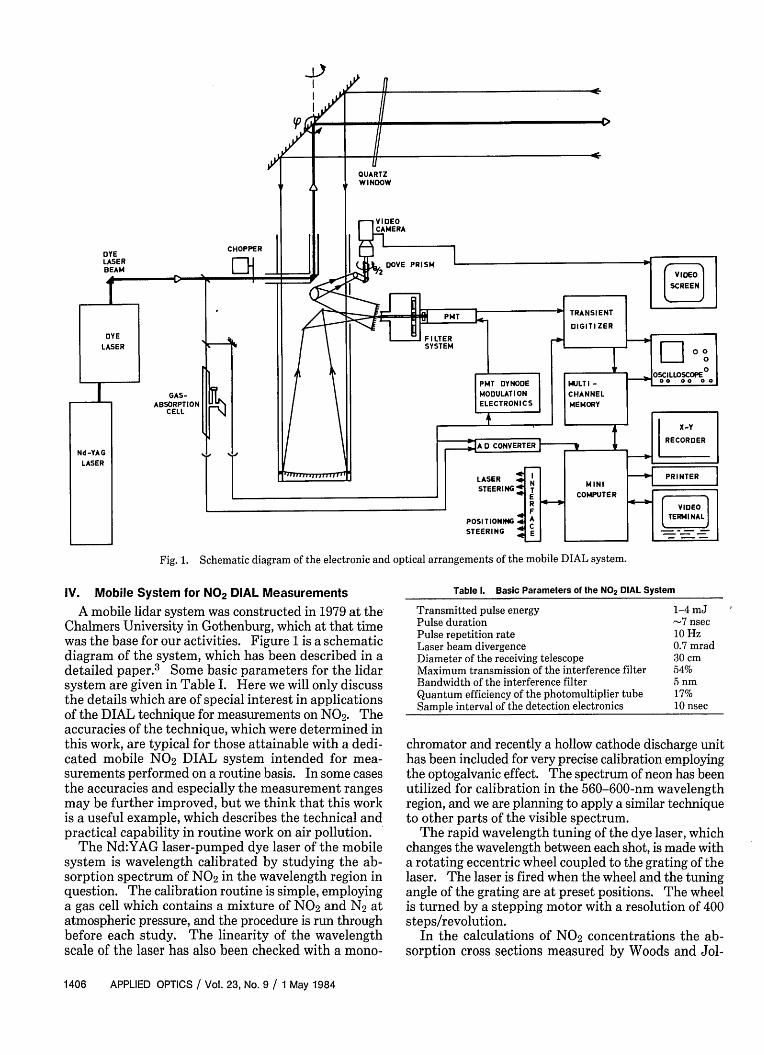
Tests were made to determine the signal-to-noiseratio in the NO2 DIAL measurements. The laser powerwas comparatively low, 1-2 mJ/pulse, and the studieswere made in different industrial and urban environ-ments. In one of the tests the DIAL wavelengths werechanged from the absorption and reference wavelengthsto two close-lying wavelengths with the same interval,but with an equal NO2 absorption cross section. Weaveraged 280 pairs of lidar signals and the DIAL signalswere calculated as in an ordinary NO2 measurement.The program routine for concentration calculations wasapplied to the result with the differential absorptioncross-sectional value normally used, 8.3 cm-' atm 1.The absolute value of the result is an indication of theabsolute error in a concentration determination. Therecordings also provide information on systematic errorsin the DIAL measurements. Figure 2 is a diagram ofresults from the studies. The absolute statistical erroris plotted as a function of the distance for two typical
1 May 1984 / Vol. 23, No. 9 / APPLIED OPTICS 1407
500 1000 1500 2000 2500
DISTANCE (m)
Fig. 2. Absolute statistical error introduced by noise during daytimeNO2 DIAL measurements toward the sky for two typical cases. Theerror in a measurement of a concentration at a specific distance isgiven by the value in the diagram divided by the measurement pathlength. The diagram shows an experimental determination of the
error for a low laser power, 1-2 mJ/pulse.
measurement situations, a dry day with a blue sky anda dry day with a cloudy sky. The visibility was esti-mated to 10 and 4 km, respectively. The systematicerror, which is not included in Fig. 2, was found to bevery low; much less than the statistical error at thelonger distances and definitely <3 mg/M2 below 1 km.The uncertainty in the exact differential absorptioncross section gives, in addition, an accuracy limit of 6%.From the investigations we conclude that the absoluteerror in a 1-min NO2 measurement at a distance of 1 kmon a dry day with a cloudy sky is 10 mg/M2 , and the ac-curacy is 6%. The corresponding figures for a mea-surement with a clear sky background are 13 mg/M2 andthe same accuracy. In some cases when the sky isbright, the lidar can be directed against some distanttarget to reduce the background light and improve theresult. The examples of the statistical error given hereare typical for most of the measurement situationsstudied in this work. In industrial environments withseveral diffuse plumes and when there is fog, rain, orsnow, the signal-to-noise ratio can be worse and thereare even uncommon weather conditions when it is notmeaningful to do DIAL measurements at all. On theother hand, on clear nights when the background lightis extremely low the results can be improved a great dealat the larger distances. Improvements are also madewith more laser power, but then at the cost of largersafety ranges, which in some cases can be a restric-tion.
V. Examples of NO 2 Measurements
During a two and a half-year period the capabilitiesof the mobile lidar system were extensively investigatedin a number of field tests. Measurements were per-formed in many different measurement situations anda variety of measurement strategies were employed. Afew examples of DIAL measurements on NO2 in in-dustrial and in urban areas will be given here.
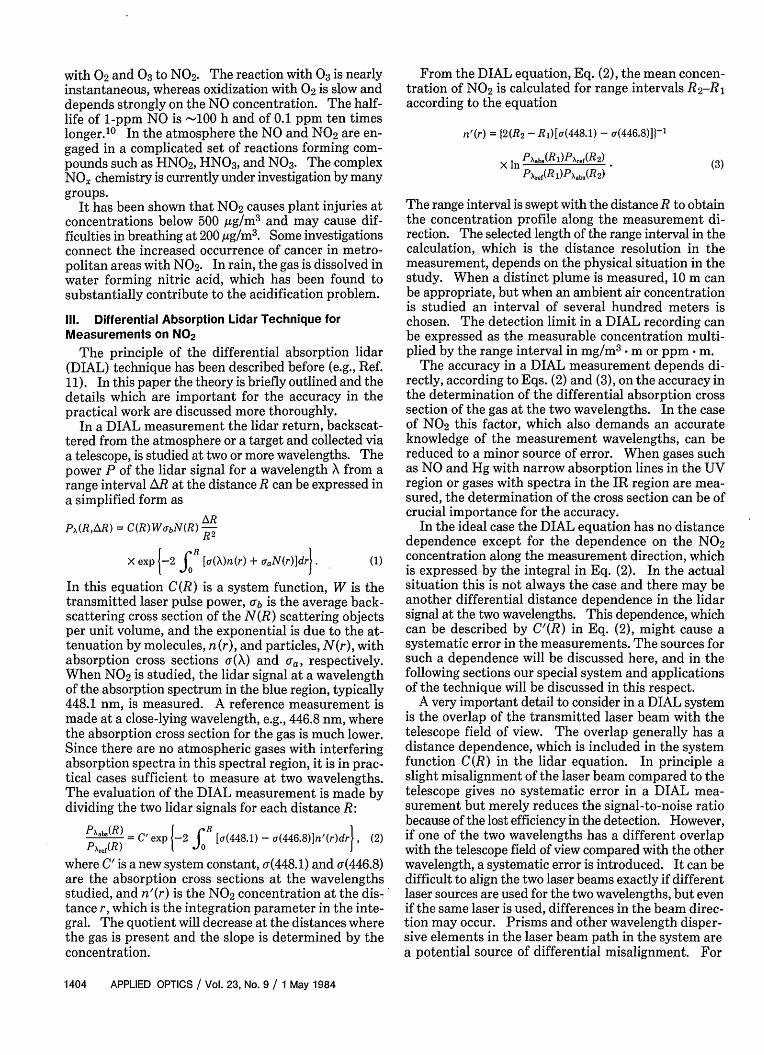
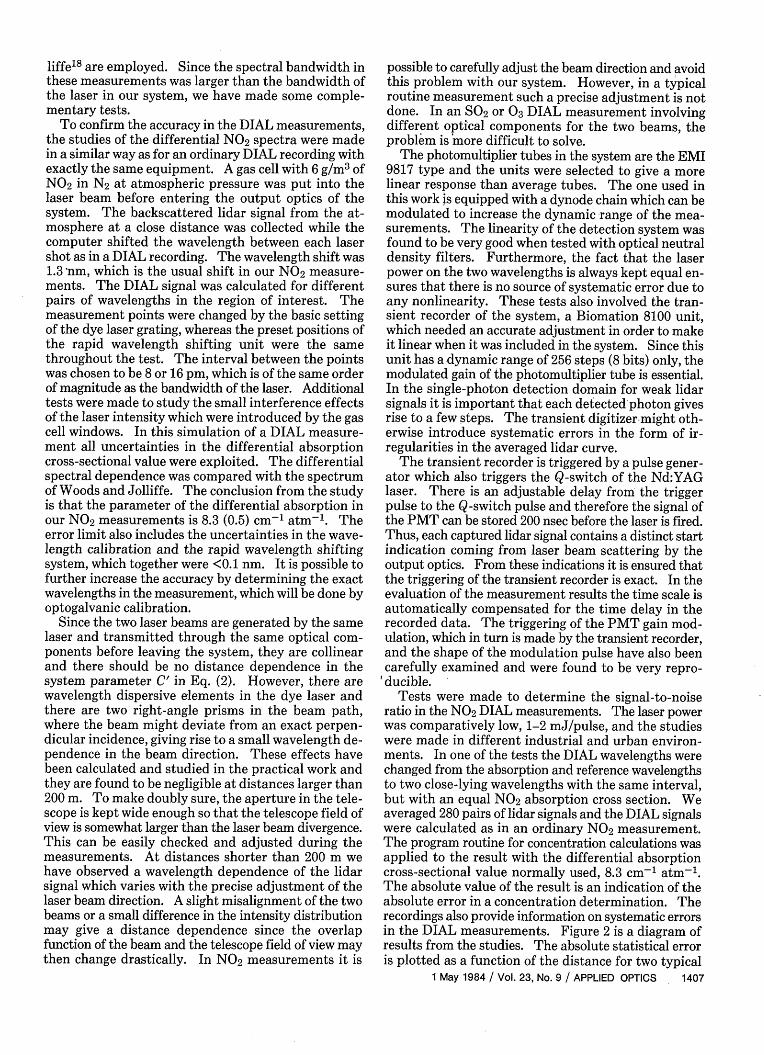
Figure 3 shows a daytime NO2 measurement in a di-rection through a spreading plume from a nitric acidplant. The lidar system was placed 400 m from theplume. The two diagrams to the left show the back-scattered lidar signals at the absorption and reference
I
0
200 400 600 mz
I'
1.0
as
1.0
0.5
200 400 600 m
200 400 600 m I 1 I I- I 1200 400 600 m
Fig. 3. Example of an NO2 DIAL measurement through the plumefrom a stack of a nitric acid plant. The lidar signals at the absorptionand reference wavelengths are shown at left, and at upper right theDIAL curve is displayed. The concentration is evaluated with a 50-m
path length in the fourth diagram.
LIDAR SYSTEM
100 200 300 400 500DISTANCE (m)
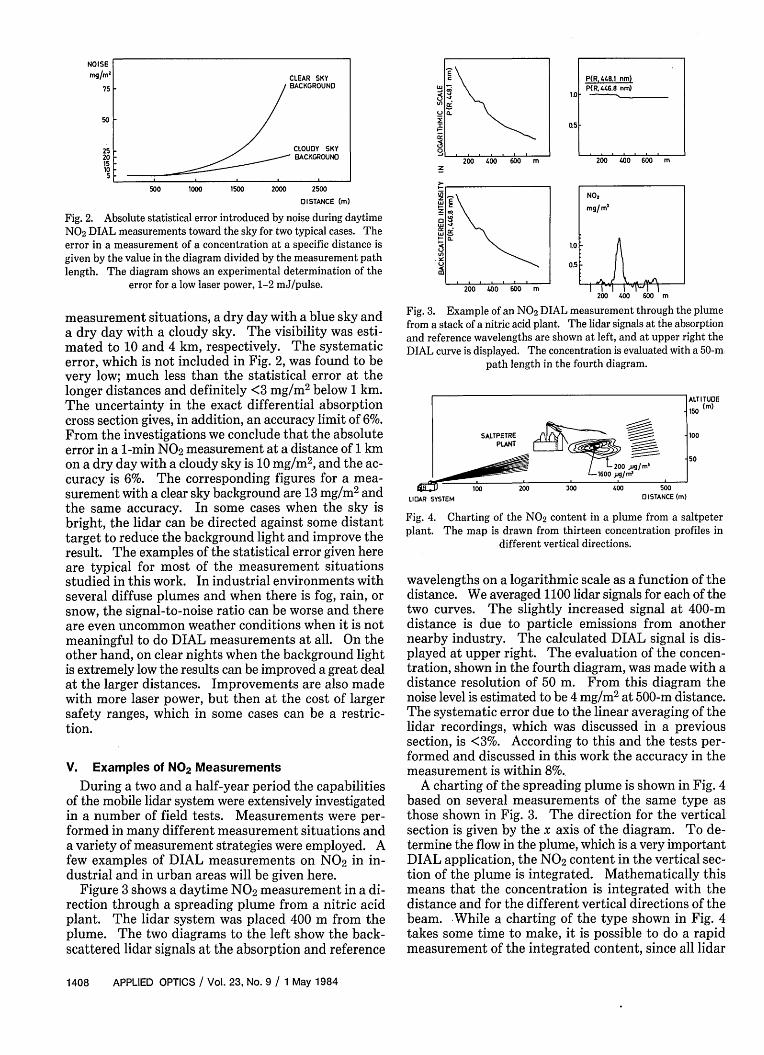
Fig. 4. Charting of the NO2 content in a plume from a saltpeterplant. The map is drawn from thirteen concentration profiles in
different vertical directions.
wavelengths on a logarithmic scale as a function of thedistance. We averaged 1100 lidar signals for each of thetwo curves. The slightly increased signal at 400-mdistance is due to particle emissions from anothernearby industry. The calculated DIAL signal is dis-played at upper right. The evaluation of the concen-tration, shown in the fourth diagram, was made with adistance resolution of 50 m. From this diagram thenoise level is estimated to be 4 mg/M2 at 500-m distance.The systematic error due to the linear averaging of thelidar recordings, which was discussed in a previoussection, is <3%. According to this and the tests per-formed and discussed in this work the accuracy in themeasurement is within 8%.
A charting of the spreading plume is shown in Fig. 4based on several measurements of the same type asthose shown in Fig. 3. The direction for the verticalsection is given by the x axis of the diagram. To de-termine the flow in the plume, which is a very importantDIAL application, the NO2 content in the vertical sec-tion of the plume is integrated. Mathematically thismeans that the concentration is integrated with thedistance and for the different vertical directions of thebeam. While a charting of the type shown in Fig. 4takes some time to make, it is possible to do a rapidmeasurement of the integrated content, since all lidar
1408 APPLIED OPTICS / Vol. 23, No. 9 / 1 May 1984
a.S
P(R, 448.1 nm)P(R.446.8 nr*O
NO,
mg/rnm
CZa.
17 18 19 20 21HOUR
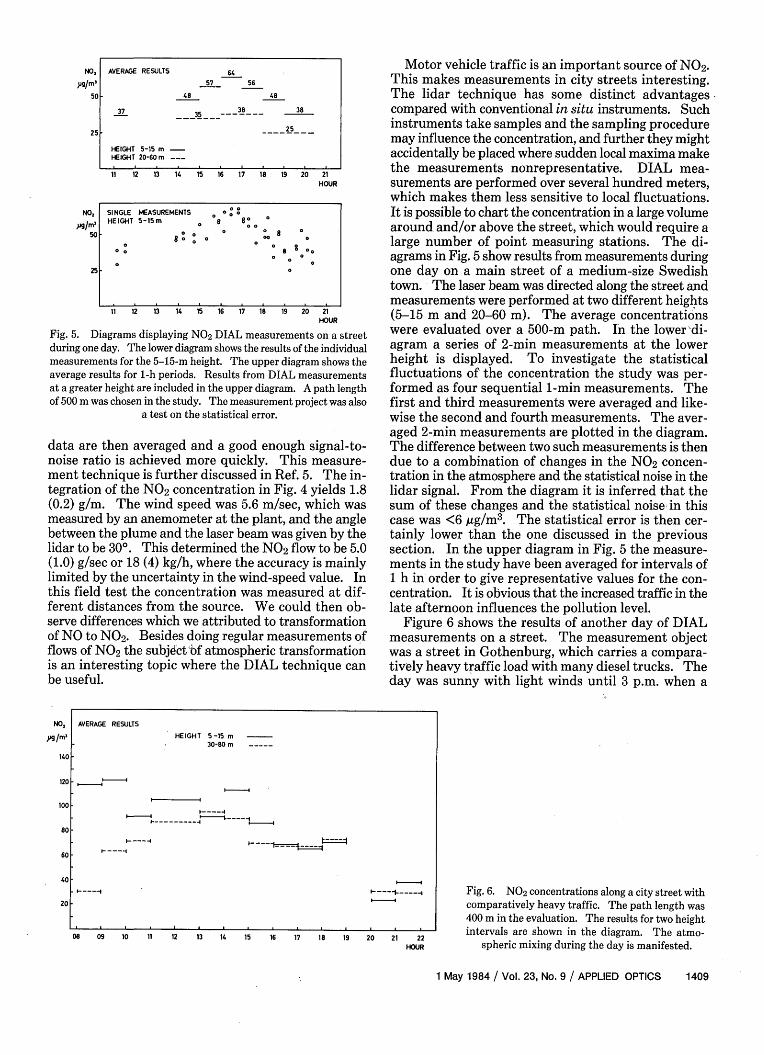
Fig. 5. Diagrams displaying NO2 DIAL measurements on a streetduring one day. The lower diagram shows the results of the individualmeasurements for the 5-15-m height. The upper diagram shows theaverage results for 1-h periods. Results from DIAL measurementsat a greater height are included in the upper diagram. A path lengthof 500 m was chosen in the study. The measurement project was also
a test on the statistical error.
data are then averaged and a good enough signal-to-noise ratio is achieved more quickly. This measure-ment technique is further discussed in Ref. 5. The in-tegration of the NO2 concentration in Fig. 4 yields 1.8(0.2) g/m. The wind speed was 5.6 m/sec, which wasmeasured by an anemometer at the plant, and the anglebetween the plume and the laser beam was given by thelidar to be 30°. This determined the NO2 flow to be 5.0(1.0) g/sec or 18 (4) kg/h, where the accuracy is mainlylimited by the uncertainty in the wind-speed value. Inthis field test the concentration was measured at dif-ferent distances from the source. We could then ob-serve differences which we attributed to transformationof NO to NO2 . Besides doing regular measurements offlows of NO2 the subject bf atmospheric transformationis an interesting topic where the DIAL technique canbe useful.
08 09 10 11 12 13 14 15 16 17 18 19
Motor vehicle traffic is an important source of NO2.This makes measurements in city streets interesting.The lidar technique has some distinct advantagescompared with conventional in situ instruments. Suchinstruments take samples and the sampling proceduremay influence the concentration, and further they mightaccidentally be placed where sudden local maxima makethe measurements nonrepresentative. DIAL mea-surements are performed over several hundred meters,which makes them less sensitive to local fluctuations.It is possible to chart the concentration in a large volumearound and/or above the street, which would require alarge number of point measuring stations. The di-agrams in Fig. 5 show results from measurements duringone day on a main street of a medium-size Swedishtown. The laser beam was directed along the street andmeasurements were performed at two different heights(5-15 m and 20-60 m). The average concentrationswere evaluated over a 500-m path. In the lower'di-agram a series of 2-min measurements at the lowerheight is displayed. To investigate the statisticalfluctuations of the concentration the study was per-formed as four sequential 1-min measurements. Thefirst and third measurements were averaged and like-wise the second and fourth measurements. The aver-aged 2-min measurements are plotted in the diagram.The difference between two such measurements is thendue to a combination of changes in the NO2 concen-tration in the atmosphere and the statistical noise in thelidar signal. From the diagram it is inferred that thesum of these changes and the statistical noise in thiscase was <6 yg/m 3. The statistical error is then cer-tainly lower than the one discussed in the previoussection. In the upper diagram in Fig. 5 the measure-ments in the study have been averaged for intervals of1 h in order to give representative values for the con-centration. It is obvious that the increased traffic in thelate afternoon influences the pollution level.
Figure 6 shows the results of another day of DIALmeasurements on a street. The measurement objectwas a street in Gothenburg, which carries a compara-tively heavy traffic load with many diesel trucks. Theday was sunny with light winds until 3 p.m. when a
20 21 22HOUR
Fig. 6. NO2 concentrations along a city street withcomparatively heavy traffic. The path length was400 m in the evaluation. The results for two heightintervals are shown in the diagram. The atmo-
spheric mixing during the day is manifested.
1 May 1984 / Vol. 23, No. 9 / APPLIED OPTICS 1409
NO,
pug/rn'
50
25
NO,
pg/rn'50
25
AVERAGE RESULTS 6457 56
48 48
37 38___ 38
HEIGHT -15 i -HEIGHT 20-60 in
11 12 13 14 15 16 17 18 19 20 21HOUR
SINGLE MEASUREMENTS o 0
HEIGHT 5-1Sm 0 8 80 °
80:0~~~~~~~
0 0 OO
11 12 13 14 15 16
NO,
140
120
100
80
60
40
20
AVERAGE RESULTS
HEIGHT 5-1S m30-80 m
----- 4
I- … -4~~~~~~f
- -_-__-
- ,---4
ALTITUDE(n)
200
100
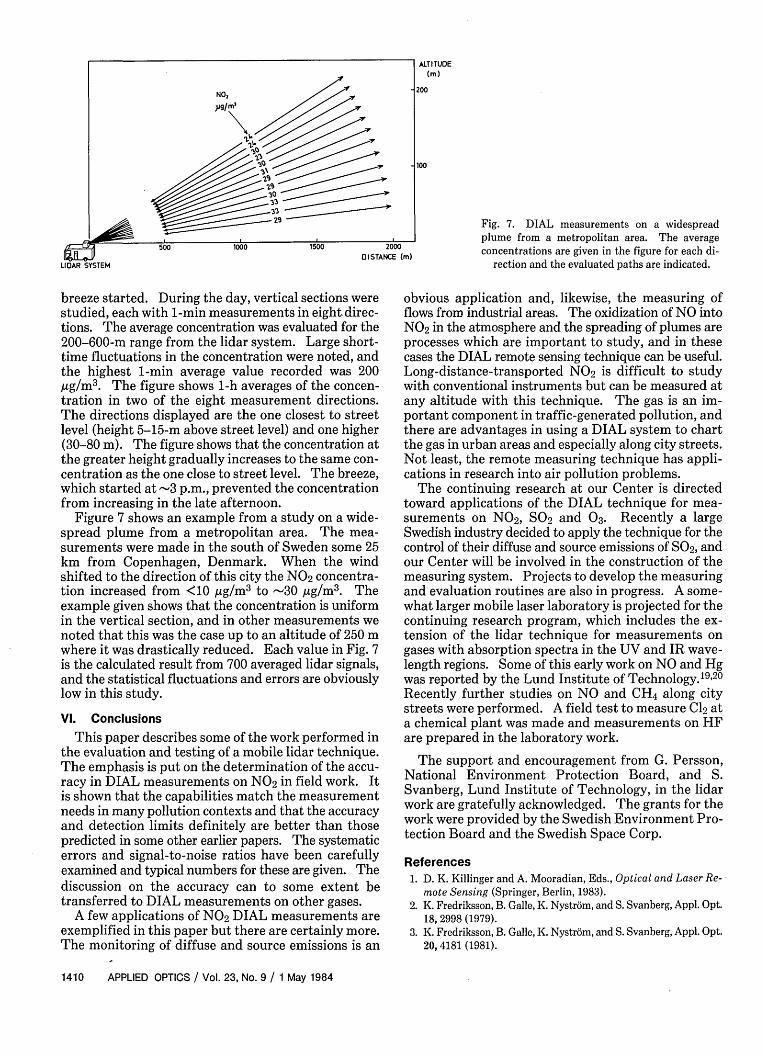
Fig. 7. DIAL measurements on a widespreadplume from a metropolitan area. The averageconcentrations are given in the figure for each di-
rection and the evaluated paths are indicated.
breeze started. During the day, vertical sections werestudied, each with 1-min measurements in eight direc-tions. The average concentration was evaluated for the200-600-m range from the lidar system. Large short-time fluctuations in the concentration were noted, andthe highest 1-min average value recorded was 200/ug/m
3 . The figure shows 1-h averages of the concen-tration in two of the eight measurement directions.The directions displayed are the one closest to streetlevel (height 5-15-m above street level) and one higher(30-80 m). The figure shows that the concentration atthe greater height gradually increases to the same con-centration as the one close to street level. The breeze,which started at -3 p.m., prevented the concentrationfrom increasing in the late afternoon.
Figure 7 shows an example from a study on a wide-spread plume from a metropolitan area. The mea-surements were made in the south of Sweden some 25km from Copenhagen, Denmark. When the windshifted to the direction of this city the NO2 concentra-tion increased from <10 ,ug/m3 to -30 /,g/m 3. Theexample given shows that the concentration is uniformin the vertical section, and in other measurements wenoted that this was the case up to an altitude of 250 mwhere it was drastically reduced. Each value in Fig. 7is the calculated result from 700 averaged lidar signals,and the statistical fluctuations and errors are obviouslylow in this study.
VI. Conclusions
This paper describes some of the work performed inthe evaluation and testing of a mobile lidar technique.The emphasis is put on the determination of the accu-racy in DIAL measurements on NO2 in field work. Itis shown that the capabilities match the measurementneeds in many pollution contexts and that the accuracyand detection limits definitely are better than thosepredicted in some other earlier papers. The systematicerrors and signal-to-noise ratios have been carefullyexamined and typical numbers for these are given. Thediscussion on the accuracy can to some extent betransferred to DIAL measurements on other gases.
A few applications of NO2 DIAL measurements areexemplified in this paper but there are certainly more.The monitoring of diffuse and source emissions is an
obvious application and, likewise, the measuring offlows from industrial areas. The oxidization of NO intoNO2 in the atmosphere and the spreading of plumes areprocesses which are important to study, and in thesecases the DIAL remote sensing technique can be useful.Long-distance-transported NO2 is difficult to studywith conventional instruments but can be measured atany altitude with this technique. The gas is an im-portant component in traffic-generated pollution, andthere are advantages in using a DIAL system to chartthe gas in urban areas and especially along city streets.Not least, the remote measuring technique has appli-cations in research into air pollution problems.
The continuing research at our Center is directedtoward applications of the DIAL technique for mea-surements on NO2 , SO2 and 03. Recently a largeSwedish industry decided to apply the technique for thecontrol of their diffuse and source emissions of SO2 , andour Center will be involved in the construction of themeasuring system. Projects to develop the measuringand evaluation routines are also in progress. A some-what larger mobile laser laboratory is projected for thecontinuing research program, which includes the ex-tension of the lidar technique for measurements ongases with absorption spectra in the UV and IR wave-length regions. Some of this early work on NO and Hgwas reported by the Lund Institute of Technology.19'20
Recently further studies on NO and CH4 along citystreets were performed. A field test to measure Cl2 ata chemical plant was made and measurements on HFare prepared in the laboratory work.
The support and encouragement from G. Persson,National Environment Protection Board, and S.Svanberg, Lund Institute of Technology, in the lidarwork are gratefully acknowledged. The grants for thework were provided by the Swedish Environment Pro-tection Board and the Swedish Space Corp.
References1. D. K. Killinger and A. Mooradian, Eds., Optical and Laser Re-
mote Sensing (Springer, Berlin, 1983).2. K. Fredriksson, B. Galle, K. Nystr6m, and S. Svanberg, Appl. Opt.
18, 2998 (1979).3. K. Fredriksson, B. Galle, K. Nystr6m, and S. Svanberg, Appl. Opt.
20, 4181 (1981).
1410 APPLIED OPTICS / Vol. 23, No. 9 / 1 May 1984
LIDAR SYSTEM
500 1000 1MUu LUVU
DISTANCE ()----
4. K. Fredriksson, National Environment Protection Board ReportSNV PM 1639 (1982).
5. A.-L. Egebtick, K. Fredriksson, and H. M. Hertz, Appl. Opt. 23,722 (1984).
6. K. W. Rothe, U. Brinkman, and H. Walther, Appl. Phys. 3, 116(1974); 4, 181 (1975).
7. W. B. Grant, R. D. Hake, E. M. Liston, R. C. Robbins, and E. K.Proctor, Appl. Phys. Lett. 24, 550 (1974).
8. R. A. Baumgartner, L. D. Fletcher, and J. G. Hawley, J. Air Pollut.Control Assoc. 29, 1162 (1979).
9. N. Takeuchi, H. Shimizu, and M. Okuda, Appl. Opt. 17, 2734(1978).
10. P.-I. Grennfelt, Institute of Air and Water Research, Goteborg;private communication.
11. E. D. Hinkley, Ed., Laser Monitoring of the Atmosphere(Springer, Berlin, 1976).
12. T. Halldorsson and J. Langerholc, Appl. Opt. 17, 240 (1978).13. J. Harms, Appl. Opt. 18, 1559 (1979).14. K. Sassen and G. C. Dodd, Appl. Opt. 21, 3162 (1982).15. W. S. Heaps, inProceedings,EleventhInternational LaserRadar
Conference, NASA Conf. Publ. 2228, 75 (1982).16. S. R. Pal and A. I. Carswell, Appl. Opt. 15, 1990 (1976).17. A. I. Carswell, Can. J. Phys. 61, 378 (1983).18. P. T. Woods and B. W. Jolliffe, Opt. Laser Technol. 10, 25
(1978).19. M. Alden, H. Edner, and S. Svanberg, Opt. Lett. 7, 543 (1982);
H. Edner, K. Fredriksson, H. Hertz, and S. Svanberg, Lund Re-ports on Atomic Physics, LRAP-21 (1983).
20. M. Alden, H. Edner, and S. Svanberg, Opt. Lett. 7, 221 (1982).
Meetings Calendar continued from page 1398
1984June23-27 Synthetic Aperture Radar Tech. & Applications course,
Ann Arbor U. Mich., Eng. Summer Conf., 200Chrysler Center, North Campus, Ann Arbor, Mich.48109
25-26 Optical Communication Systems NSF Mtg., San DiegoJ. Lukas, Electrical Eng. & Computer Sciences Dept.,C-014, U. Calif. San Diego, La Jolla, Calif. 92093
25-27 Flow Visualization Techniques course, Ann Arbor U.Mich., Eng. Summer Conf., 200 Chrysler Center,North Campus, Ann Arbor, Mich. 48109
25-27 Forefronts of Large-Scale Computational Problems Conf.,Gaithersburg H. Raveche, A311, Physics Bldg., NBS,Wash., D.C. 20234
25-28 Ocean Optics VII Conf., Monterey SPIE, P.O. Box 10,Bellingham, Wash. 98227
25-29 Measurement of Laser Output Characteristics course, LasVegas Eng. Tech., Inc., P.O. Box 8859, Waco, Tex.76714
25-29 Advances in Color Tech. course, Rochester B. Reimherr,One Lomb Memorial Dr., Rochester, N. Y. 14623
25-29 Computer Vision & Image Processing course, Ann ArborU. Mich., Eng. Summer Conf., 200 Chrysler Center,North Campus, Ann Arbor, Mich. 48109
25-29 NSF Regional Conf.: Factorization of Linear Operators& Geometry of Banach Spaces, U. Missouri, ColumbiaNSF, Math. Sciences, Wash., D.C. 20550
25-29 Advanced Infrared Tech. course, Ann Arbor U. Mich.,Eng. Summer Conf., 200 Chrysler Center, NorthCampus, Ann Arbor, Mich. 48109
26-28 Defense Systems Analysis course, Wash., D.C. Con-tinuing Eng. Ed. Program, Geo. Wash. U., Wash., D.C.20052
26-28 Applications of Optical Digital Data Disk Storage Sys-tems Tech. Mtg., Brussels SPIE, P.O. Box 10, Bel-lingham, Wash. 98227
27-3 July Int. Conf. on Plasma Physics, Lausanne M. Tran, Centrede Recherches en Physique des Plasmas, Ecole Poly-technique Federale, 21, av. des Bains, CH-1007Lau-sanne, Switzerland
Jiuly2-4 2nd Inter. Symp. on Applications of Laser Anemometry
to Fluid Mechanics, Lisbon D. Durao, Dept. of Me-chanical Engineering, Instituto Superior Tecnico,Avenida Rovisco Pais, 1096 Lisbon, Portugal
2-5 Int. Conf. on the Physics of Highly Ionized Atoms, OxfordP. Hoyng, Astronomical Inst. at Utrecht, Space Re-search Lab., Beneluxlaan 21-3527 HS, Utrecht, TheNetherlands
2-13 Applied Optics Summer course, London J. Dainty,Optics Section, Blackett Lab., Imperial College,London SW7, 2BZ, U.K.
9-12 Radar Signal Processing & Automatic Detection course,Wash., D.C. Continuing Eng. Ed. Program, Geo.Wash. U., Wash., D.C. 20052
9-13 Infrared Spectroscopy I: Interpretation of Spectracourse, Brunswick D. Mayo, Chem. Dept., BowdoinColl., Brunswick, Maine 04011
9-13 Mapping From Space: Techniques & Applicationscourse, Wash., D.C. Continuing Eng. Ed. Program,Geo. Wash. U., Wash., D.C. 20052
9-13 Laser Fundamentals & Systems course, Wash., D.C.Eng. Tech., Inc., P.O. Box 8859, Waco, Tex. 76714
9-20 Lasers & Optics for Applications course, Cambridge S.Ezekiel, MIT, Elect. Eng. & Computer Science Dept.,Cambridge, Mass. 02139
15-19 Int. Conf. on Laser Processing & Diagnostics-Applica-tions in Electronic Materials, Linz P. Hoyng, Astro-nomical Inst. at Utrecht, Space Research Lab., Be-neluxlaan 21-3527HS, Utrecht, The Netherlands
16-20 NSF Regional Conf.: Geometric Algebra & Ends ofMaps, U. Notre Dame, Notre Dame NSF, Math.Sciences, Wash., D.C. 20550
16-20 Infrared Spectroscopy II: Instrumentation, PolymerSpectra, Sample Handling & Computer AssistedSpectroscopy course, Brunswick D. Mayo, Chem.Dept., Bowdoin Coll., Brunswick, Maine 04011
16-27 Contemporary Optics course, Rochester E. Snyder, Inst.Optics, U. Rochester, Rochester, N. Y. 14627
16-27 Optical Metrology course, Viana Do Castelo 0. Soares,Laboratorio de Fisica, Faculdade de Ciencias, Univ-ersidade do Porto, 4 000 Porto, Portugal
22-25 2nd Int. Conf. on Photographic Papers, Vancouver R.Wood, SPSE, 7003 Kilworth Lane, Springfield, Va.22151
23-27 9th Int. Conf. on Atomic Physics, Seattle G. Wood, Nat.Res. Council Assembly of Mathematical & PhysicalSciences, 2101 Constitution Ave., N.W., Wash., D.C.20418 continued on page 1424
1 May 1984 / Vol. 23, No. 9 / APPLIED OPTICS 1411
Recommended