Running head: DIAGNOSTIC UTILITY SCATTER 1
Evidence-based assessment and Cognitive Profile Scatter: Clinical Acumen or Clinical
Illusion?
Ryan J. McGill
The College of William and Mary
Author Note
Paper presented at the 2017 annual meeting of the Southeastern Psychological Association, Atlanta, GA.
Standardization data from the Kaufman Assessment Battery for Children, Second Edition
(KABC-II). Copyright © 2004 NCS Pearson, Inc. Used with permission. All rights reserved.
Correspondence concerning this paper should be addressed to Ryan J. McGill, School of Education, The College of William and Mary, P. O. Box 8795 Williamsburg, VA. 23187. E-Mail: [email protected]
DIAGNOSTIC UTILITY SCATTER 2
Abstract
Within the professional literature, it is frequently suggested that interpretation of cognitive
profile scatter may be useful for clinical and/or diagnostic decision-making. To wit, Hale and
colleagues (2008) posit that cognitive scatter is a defining characteristic of learning disabilities
and that individuals with learning disabilities may have higher levels of scatter than normal
controls. To investigate the tenability of this claim, the present study employed diagnostic
efficiency statistics and other psychometric methods for examining the utility of proposed
diagnostic indicators (e.g., receiver operative characteristic curve, Bayesian nomogram) to
determine the degree to which cognitive scatter accurately discriminated between individuals
with and without a known learning disability diagnosis in the Kaufman Assessment Battery for
Children-Second Edition (KABC-II; Kaufman & Kaufman, 2004a) normative sample. Results
indicated that the diagnostic utility of cognitive profile scatter was no better than chance
regardless of the level of scatter that was observed. The current negative results suggest that
practitioners who interpret cognitive profile scatter may risk diagnostic overconfidence and in
the case of SLD identification, unacceptable levels of false positive decisions attributable to
error. Implications for evidence-based assessment in clinical and school psychology are
discussed.
Keywords: Cognitive scatter, KABC-II, Evidence-based practice
DIAGNOSTIC UTILITY SCATTER 3
Evidence-based assessment and Cognitive Profile Scatter: Clinical Acumen or Clinical
Illusion?
The clinical use of scatter-analysis presage debate about its relationship to the nature of
learning disorders (Kavale, 2002). Over 70 years ago, Rapaport, Gil, and Schafer (1945)
proposed an interpretive framework that provided clinicians with a step-by-step process for
analyzing intra-individual cognitive strengths and weaknesses based upon the belief that
variability in cognitive test performance serves as a marker for the presence of behavioral
pathology and a multitude of related approaches have been developed within the psychological
assessment literature (e.g., Kaufman, 1994; Naglieri, 2000; Priftera & Dersh, 1993). In fact, it
has been argued that Kaufman’s (1994) intelligent testing approach (which bears many
similarities to the approach articulated by Rapaport et al., 1945), in which test users are
encouraged to use the analytical powers of a “master detective” to interpret the meaning of
significant scatter and its potential implications for the clinical utility of obtained scores, serves
as a proverbial lingua franca for IQ test interpretation in clinical practice (McGill, 2016). To wit,
the technical and interpretive manuals for all contemporary IQ tests encourage clinicians to
engage in some variant of the intelligent testing approach when interpreting the scores provided
by those instruments. Thus, it is not surprising that in a survey of 354 national certified school
psychologists 70% of respondents reported that they found profile analysis to be clinically useful
(Pfeiffer et al., 2000).
However, despite the popularity and perceived clinical utility of these methods in
psychological science, their scientific support has long been found wanting. Previous
investigations of several popular profile analytic methods (i.e., ipsative analysis, subtest-level
profiles, individual cognitive weakness models) have consistently found that unique cognitive
DIAGNOSTIC UTILITY SCATTER 4
profiles are psychometrically weak, lacking adequate reliability and validity for confidant
clinical interpretation. (e.g., Macmann & Barnett, 1997; Watkins, 2000, 2003). More germane to
the present discussion, in a quantitative meta-analysis, Kavale and Forness (1984) found that the
average PIQ-VIQ difference for children with SLD was only 3.5 points, a difference found in
approximately 79% of the normal population. As a result, it was concluded that scatter was of
“little value in LD diagnosis” (p. 139).
In spite of these findings, proponents of scatter-based methods continue to advance
claims that the interpretation of intra-individual scatter is clinical useful and that the mere
presence of scatter renders some composite scores (i.e., FSIQ) invalid (Canivez, 2013; McGill,
2016). As an example, Hale and colleagues (2008) suggest that cognitive scatter is a defining
characteristic of individuals with academic disorders, noting that individuals with learning
disabilities typically have higher levels of scatter when compared to normal controls. Following
this logic, it is hypothesized that higher and/or statistically significant levels of cognitive scatter
may serve as a diagnostic sign for the diagnosis of academic disorders (see Flanagan and
Alfonso, 2010 for a review of several diagnostic models that align with this premise). This is an
empirical question that can be addressed using a diagnostic utility approach (Wiggins, 1988).
According to Hunsley and Mash (2007), evidence-based assessment (EBA) emphasizes
the use of research and theory to inform the selection of assessment targets in clinical practice.
EBA guidelines stress that the diagnostic techniques employed by mental health professionals
must be supported with appropriate psychometric evidence that examines their potential
accuracy. Determining the accuracy of scatter as a diagnostic sign for SLD requires the
computation of sensitivity and specificity statistics from a 2 x 2 contingency table that cross-
tabulates decisions made from scatter with those from a gold standard diagnosis (a sample
DIAGNOSTIC UTILITY SCATTER 5
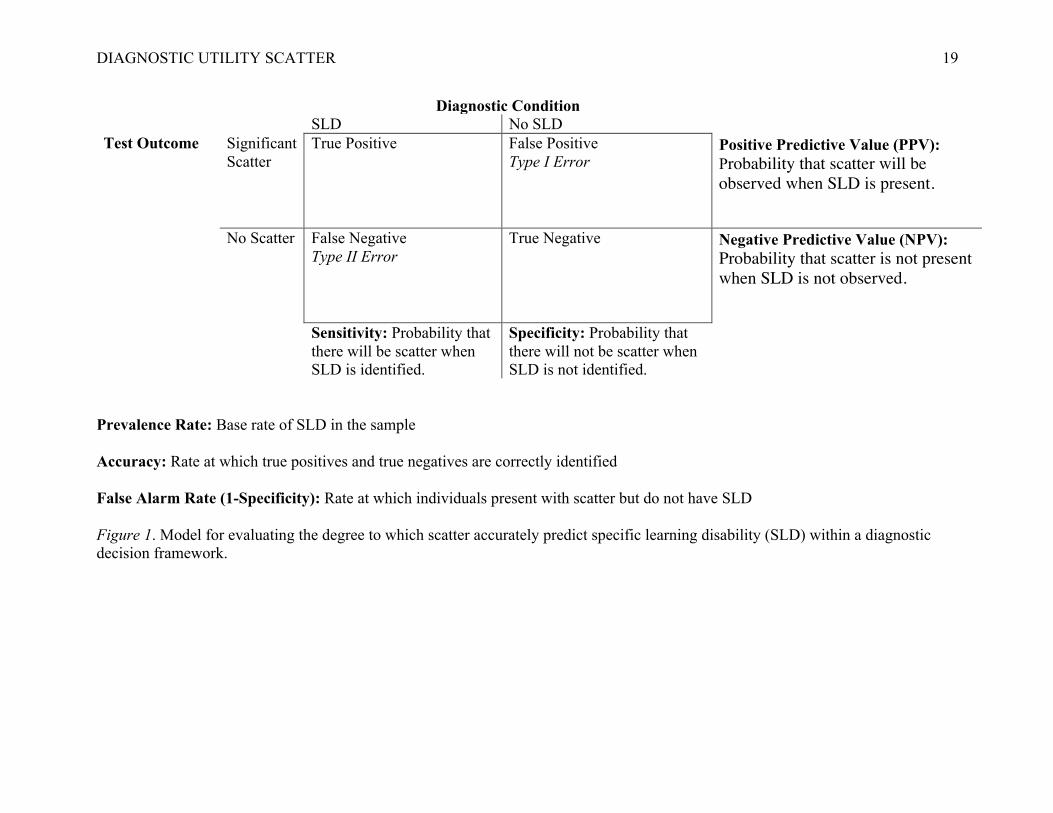
diagnostic contingency array is provided in Figure 1). Sensitivity is the proportion of individuals
with SLD who exhibit meaningful scatter (i.e., true positive decisions). Specificity represents the
proportion of individuals without SLD who are not marked with psychoeducational profiles that
contain significant scatter (i.e., true negative decisions). Diagnostic accuracy is often represented
as the rate of “hits” (i.e., true positive and true negative decisions) in a selected population. It is
important to note that while a highly sensitive and highly specific test is desired, there is a
tradeoff between sensitivity and specificity: as one increases the other decreases (McFall &
Treat, 1999). However, for diagnostic tests, it has been argued that protection against making a
Type I error or a false positive decision is preferred (Meehl & Rosen, 1955). Unfortunately, the
potential diagnostic utility of cognitive scatter, as produced from a contemporary measure of
cognitive ability, has thus far evaded empirical scrutiny.
Purpose of the Current Investigation
To address this gap in literature, the present investigation employed diagnostic utility
statistics (e.g., Kessel & Zimmerman, 1993; McFall & Treat, 1999; Swets, 1998) to determine
whether significant profile scatter could accurately distinguish between participants ages 6-18 in
the Kaufman Assessment Battery for Children-Second Edition (KABC-II; Kaufman & Kaufman,
2004a) normative sample with (n = 107) and without (n = 2,116) a known diagnosis of specific
learning disability (SLD). Given the fact that cognitive variability is endemic in the population, it
is important to determine the degree to which the distributions of cognitive attributes for clinical
and non-clinical groups may overlap (McGill, Styck, Palomares., & Hass, 2016).
As recommended by Youngstrom et al. (2015), Bayesian methods were also used to
determine the degree to which scatter improved posterior probabilities and diagnostic likelihood
ratios from a priori base rates of SLD prevalence in the population. It is believed that the
DIAGNOSTIC UTILITY SCATTER 6
information furnished from this investigation will be instructive for evaluating the tenability of
the claims made by Hale et al. (2008) and for advancing evidence-based assessment in clinical
practice.
Method
Participants
Participants were children and adolescents ages 6 to 18 (N = 2,223) drawn from the
KABC-II standardization sample. The standardization sample was obtained using stratified
proportional sampling across demographic variables of age, sex, race/ethnicity, parent
educational level, and geographic region. Examination of the tables in the manual (Kaufman &
Kaufman, 2004b) revealed a close correspondence to the 2001 U. S. census estimates across the
stratification variables.
Measurement Instrument
The KABC-II (Kaufman & Kaufman, 2004a) measures the processing and cognitive
abilities of children and adolescents between the ages of 3 years and 18 years. The KABC-II
features 10 core subtests, which combine to yield five first-order factor scale scores (Short-Term
memory, Long-Term Storage and Retrieval, Visual Processing, Fluid Reasoning, and
Crystallized Ability), and a second-order Fluid Crystallized Index (FCI) that is thought to
represent psychometric g. Extensive normative and psychometric data can be found in the
KABC-II manual (Kaufman & Kaufman, 2004b).
Data Analyses
Data analyses involved several steps. First, pairwise comparisons for all KABC-II factor
score permutations were created in the normative dataset to determine the degree of scatter in
individual cognitive profiles (i.e., difference between the highest and lowest scores). The

DIAGNOSTIC UTILITY SCATTER 7
resulting scatter index allowed for analyses to proceed without the imposition of an arbitrary cut-
point (i.e., MacCallum, Zhang, Preacher, & Rucker, 2002). A one-way analysis of variance
(ANOVA) was used to determine the degree to which KABC-II scores differed between SLD
and non-SLD samples. The Levine’s test of homogeneity of variances was examined to test the
degree to which score variances were statistically different and the Welch approximate F test
was used to evaluate the omnibus test. Next, diagnostic utility statistics (e.g., Kessel &
Zimmerman, 1993) were also computed for different thresholds of scatter using the Diagnostic
Utility program by Watkins (2002). A number of attributes of a test, collectively known as
diagnostic efficiency statistics, can be derived from these numbers. The sensitivity of a test is
defined as the proportion of people who have SLD who are detected by the test. The specificity
of a test is the proportion of people without SLD who are correctly labeled by the test. Sensitivity
and specificity can be combined into a single number called the likelihood ratio (LR). According
to Streiner (2003), LR+ and LR- that are ≥ 1 indicate the test is useless as a rule-in/out indictor
of an attribute. Positive predictive power and negative predictive power refer to the ratio of
individuals who are correctly classified as having SLD based upon the presence or absence of
meaningful scatter.
Because diagnostic statistics are influenced by prevalence rates, these statistics were also
plotted on a receiver operating characteristic curve (ROC) and the area under the curve (AUC)
was used to quantify the ROC (McFall & Treat, 1999; Swets, 1988). A nonparametric approach
was used to fit the curve in SPSS version 23.0. Youngstrom (2014) recommend the following
guidelines for interpreting AUC: values between 0.50 and 0.70 characterize low accuracy, values
between 0.70 and 0.90 represent medium accuracy, and values between 0.90 and 1.00
characterize high accuracy. Finally, Bayesian methods were employed to construct a probability
DIAGNOSTIC UTILITY SCATTER 8
nomogram using the evidence-based assessment framework advocated by Youngstrom and
colleagues (2015).
Results
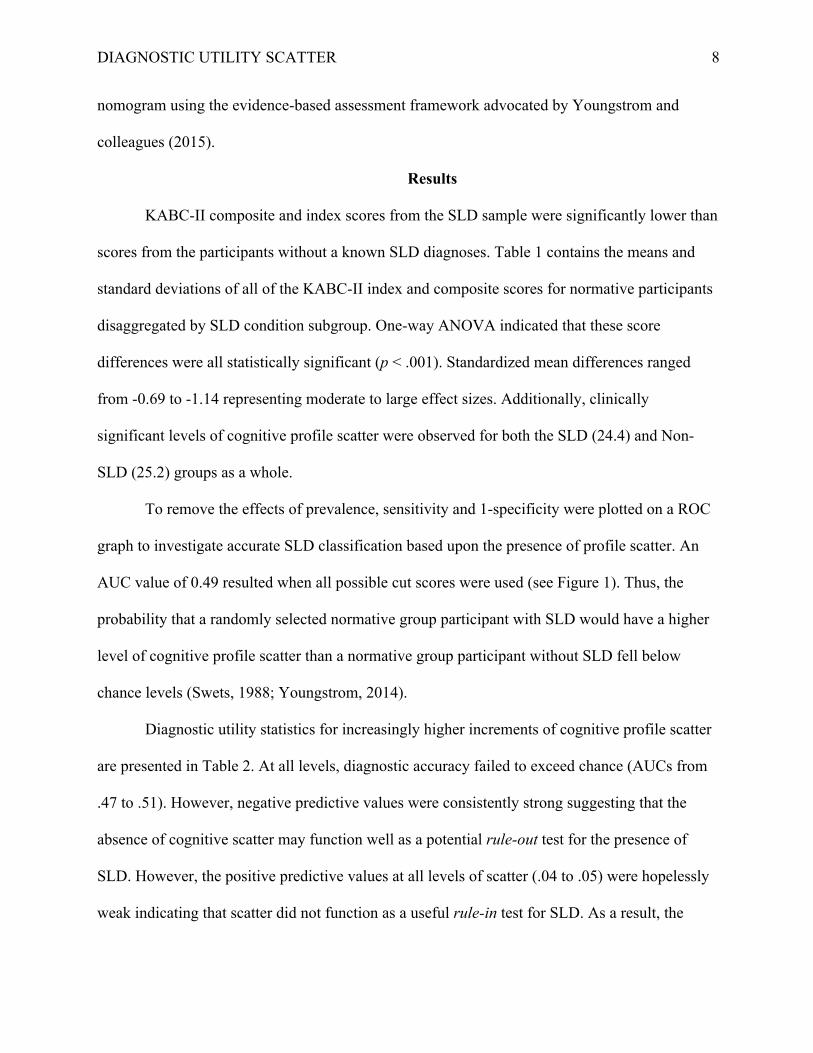
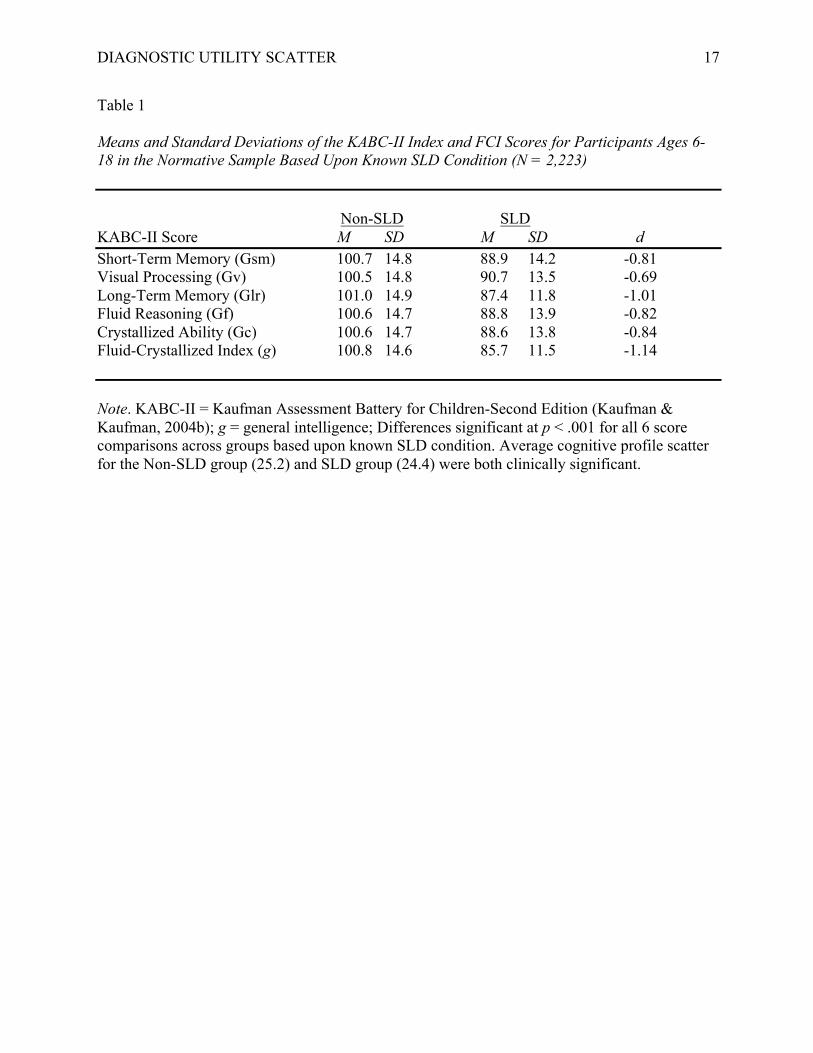
KABC-II composite and index scores from the SLD sample were significantly lower than
scores from the participants without a known SLD diagnoses. Table 1 contains the means and
standard deviations of all of the KABC-II index and composite scores for normative participants
disaggregated by SLD condition subgroup. One-way ANOVA indicated that these score
differences were all statistically significant (p < .001). Standardized mean differences ranged
from -0.69 to -1.14 representing moderate to large effect sizes. Additionally, clinically
significant levels of cognitive profile scatter were observed for both the SLD (24.4) and Non-
SLD (25.2) groups as a whole.
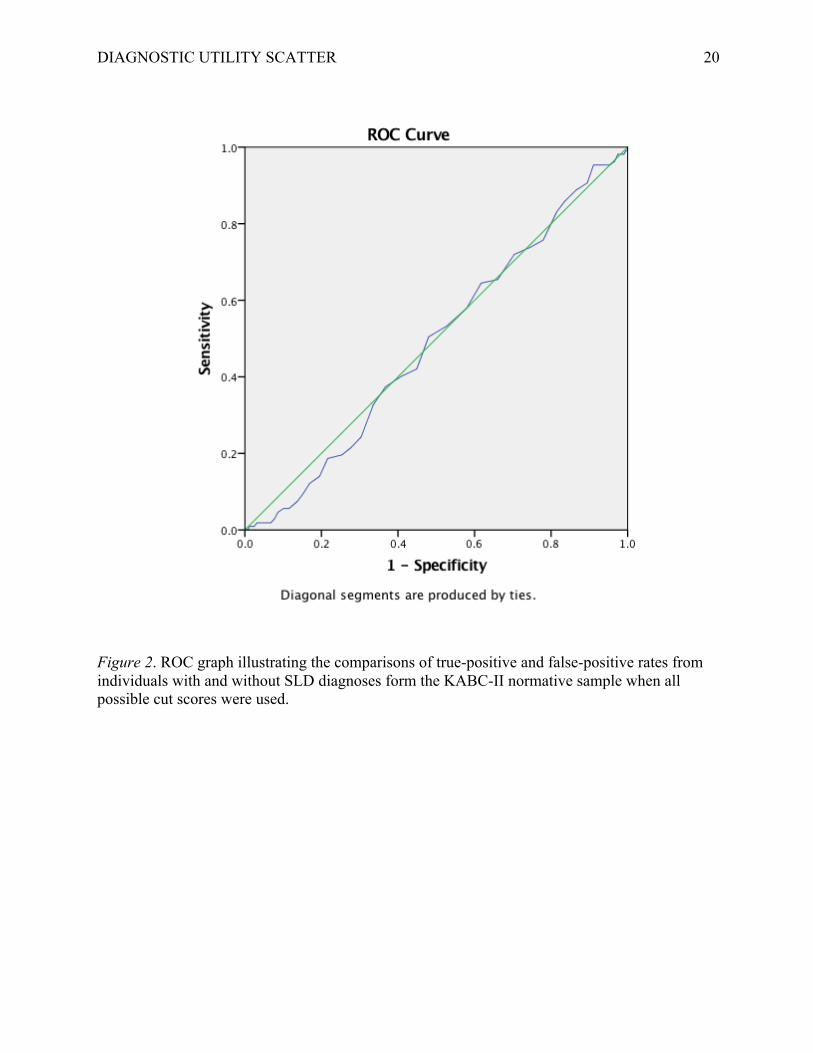
To remove the effects of prevalence, sensitivity and 1-specificity were plotted on a ROC
graph to investigate accurate SLD classification based upon the presence of profile scatter. An
AUC value of 0.49 resulted when all possible cut scores were used (see Figure 1). Thus, the
probability that a randomly selected normative group participant with SLD would have a higher
level of cognitive profile scatter than a normative group participant without SLD fell below
chance levels (Swets, 1988; Youngstrom, 2014).
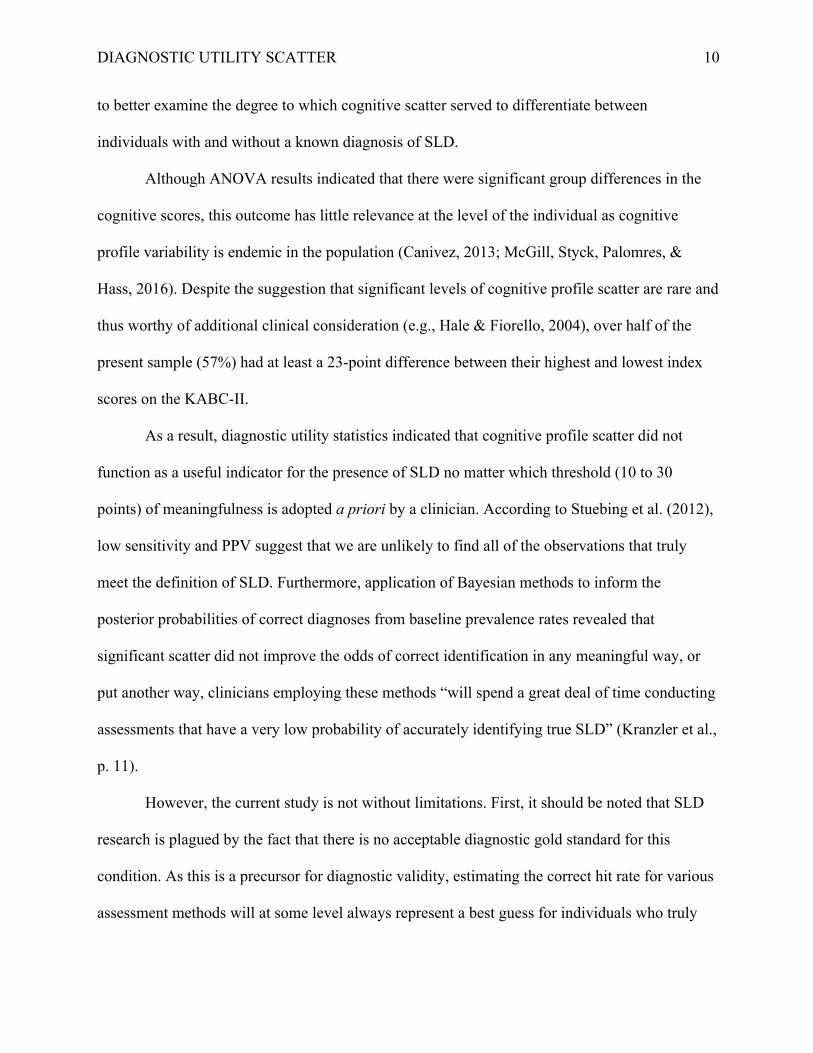
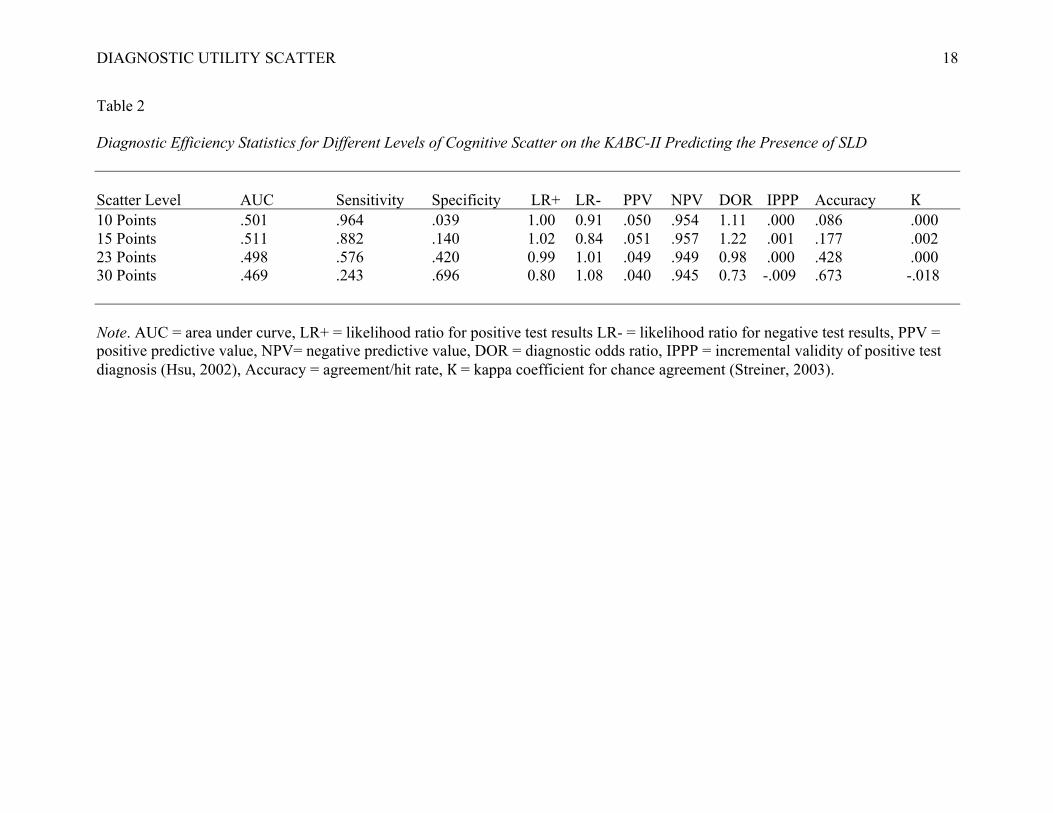
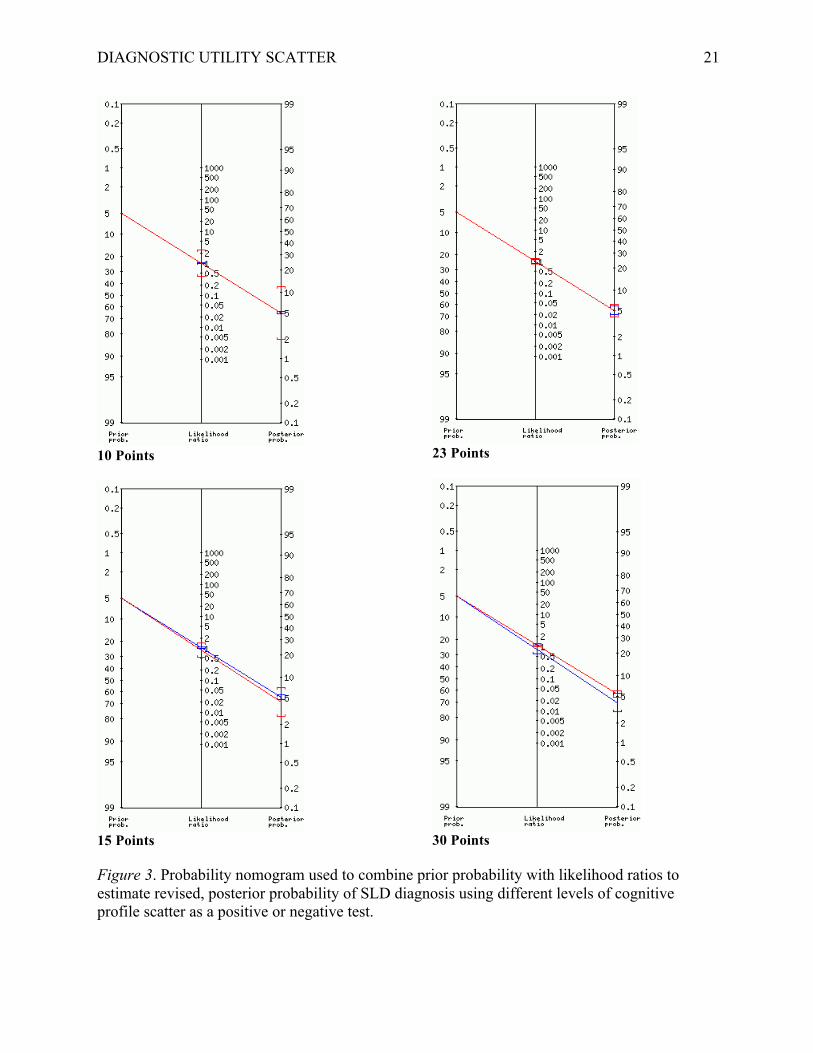
Diagnostic utility statistics for increasingly higher increments of cognitive profile scatter
are presented in Table 2. At all levels, diagnostic accuracy failed to exceed chance (AUCs from
.47 to .51). However, negative predictive values were consistently strong suggesting that the
absence of cognitive scatter may function well as a potential rule-out test for the presence of
SLD. However, the positive predictive values at all levels of scatter (.04 to .05) were hopelessly
weak indicating that scatter did not function as a useful rule-in test for SLD. As a result, the
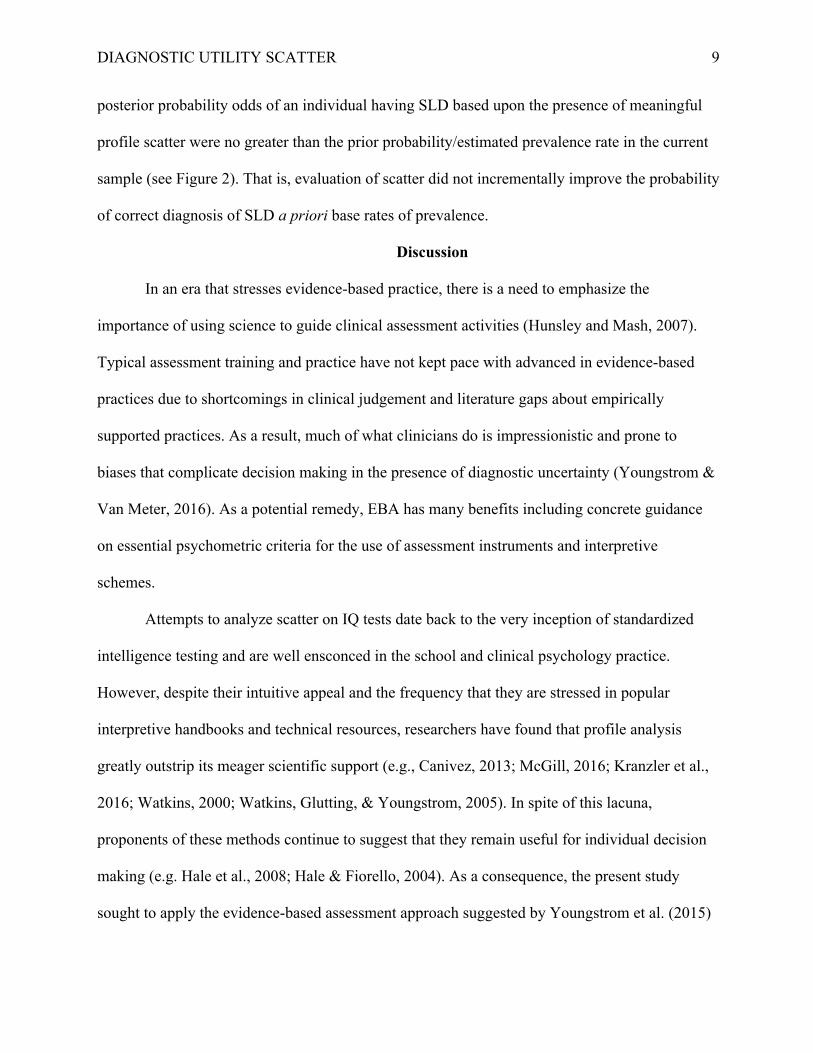
DIAGNOSTIC UTILITY SCATTER 9
posterior probability odds of an individual having SLD based upon the presence of meaningful
profile scatter were no greater than the prior probability/estimated prevalence rate in the current
sample (see Figure 2). That is, evaluation of scatter did not incrementally improve the probability
of correct diagnosis of SLD a priori base rates of prevalence.
Discussion
In an era that stresses evidence-based practice, there is a need to emphasize the
importance of using science to guide clinical assessment activities (Hunsley and Mash, 2007).
Typical assessment training and practice have not kept pace with advanced in evidence-based
practices due to shortcomings in clinical judgement and literature gaps about empirically
supported practices. As a result, much of what clinicians do is impressionistic and prone to
biases that complicate decision making in the presence of diagnostic uncertainty (Youngstrom &
Van Meter, 2016). As a potential remedy, EBA has many benefits including concrete guidance
on essential psychometric criteria for the use of assessment instruments and interpretive
schemes.
Attempts to analyze scatter on IQ tests date back to the very inception of standardized
intelligence testing and are well ensconced in the school and clinical psychology practice.
However, despite their intuitive appeal and the frequency that they are stressed in popular
interpretive handbooks and technical resources, researchers have found that profile analysis
greatly outstrip its meager scientific support (e.g., Canivez, 2013; McGill, 2016; Kranzler et al.,
2016; Watkins, 2000; Watkins, Glutting, & Youngstrom, 2005). In spite of this lacuna,
proponents of these methods continue to suggest that they remain useful for individual decision
making (e.g. Hale et al., 2008; Hale & Fiorello, 2004). As a consequence, the present study
sought to apply the evidence-based assessment approach suggested by Youngstrom et al. (2015)
DIAGNOSTIC UTILITY SCATTER 10
to better examine the degree to which cognitive scatter served to differentiate between
individuals with and without a known diagnosis of SLD.
Although ANOVA results indicated that there were significant group differences in the
cognitive scores, this outcome has little relevance at the level of the individual as cognitive
profile variability is endemic in the population (Canivez, 2013; McGill, Styck, Palomres, &
Hass, 2016). Despite the suggestion that significant levels of cognitive profile scatter are rare and
thus worthy of additional clinical consideration (e.g., Hale & Fiorello, 2004), over half of the
present sample (57%) had at least a 23-point difference between their highest and lowest index
scores on the KABC-II.
As a result, diagnostic utility statistics indicated that cognitive profile scatter did not
function as a useful indicator for the presence of SLD no matter which threshold (10 to 30
points) of meaningfulness is adopted a priori by a clinician. According to Stuebing et al. (2012),
low sensitivity and PPV suggest that we are unlikely to find all of the observations that truly
meet the definition of SLD. Furthermore, application of Bayesian methods to inform the
posterior probabilities of correct diagnoses from baseline prevalence rates revealed that
significant scatter did not improve the odds of correct identification in any meaningful way, or
put another way, clinicians employing these methods “will spend a great deal of time conducting
assessments that have a very low probability of accurately identifying true SLD” (Kranzler et al.,
p. 11).
However, the current study is not without limitations. First, it should be noted that SLD
research is plagued by the fact that there is no acceptable diagnostic gold standard for this
condition. As this is a precursor for diagnostic validity, estimating the correct hit rate for various
assessment methods will at some level always represent a best guess for individuals who truly
DIAGNOSTIC UTILITY SCATTER 11
have SLD. Also, it should be noted that the prevalence rate in the current sample (5%) is
somewhat lower than the estimated prevalence rate for SLD in the population (10% to 15%).
Thus, it is possible that the current results may be an artifact of under-sampling. Finally, whereas
the present results indicate that consideration of scatter in aggregate lacked diagnostic utility,
more focal consideration of the patterns of cognitive performance may be more useful. However,
a recent empirical investigation by Kranzler et al. (2016) found similar psychometric
shortcomings associated with these approaches.
Conclusion
According to Watkins, Glutting, and Youngstrom (2005), “scientific psychological
practice cannot be sustained by clinical conjectures, personal anecdotes, and unverifiable
personal beliefs that have consistently failed empirical validation” (p. 265). Consistent with
previous research, these results suggest that despite their intuitive appeal and popularity in
clinical practice, psychodiagnostic inferences generated from significant profile scatter should
not be employed for SLD identification until sufficient scientific evidence is furnished to support
their use in these circumstances. Practitioners who fail to heed this exhortation risk diagnostic
overconfidence and in the case of SLD identification, a potentially unacceptable level of
diagnostic error (Lilienfeld, Ammirati, & David, 2012; Meehl, 1978; Watkins, 2009).
DIAGNOSTIC UTILITY SCATTER 12
References
Canivez, G. L. (2013). Psychometric versus actuarial interpretation of intelligence and related aptitude batteries. In D. H. Saklofske, C. R. Reynolds, & V. L. Schwean (Eds.). The Oxford handbook of child psychological assessment (pp. 84-112). New York: Oxford University Press. Flanagan, D. P., & Alfonso, V. C. (Eds.). (2010). Essentials of specific learning disability
identification. Hoboken NJ: Wiley. Hale, J. B., & Fiorello, C. A. (2004). School neuropsychology: A practitioner’s handbook. New
York: Guilford. Hale, J. B., Fiorello, C. A., Dumont, R., Willis, J. O., Rackley, C, & Elliot, C. (2008).
Differential Ability Scales-Second Edition (neuro)psychological predictors of math performance for typical children and children with math disabilities. Psychology in the Schools, 45, 838-858. doi: 10.1002/pits.20330
Hunsely, J., & Mash, E. J. (2007). Evidence-based assessment. Annual Review of Clinical
Psychology, 3, 29-51. doi: 10.1146/annurev.clinpsy.3.022806.091419 Katz, D. L. (2001). Clinical epidemiology & evidence-based medicine. Thousand Oaks, CA:
Sage. Kaufman, A. S. (1994). Intelligent testing with the WISC-III. New York: John Wiley. Kaufman, A. S., & Kaufman, N. L. (2004a). Kaufman Assessment Battery for Children (2nd ed.).
Circle Pines, MN: American Guidance Service. Kaufman, A. S., & Kaufman, N. L. (2004b). Kaufman Assessment Battery for Children manual
(2nd ed.). Circle Pines, MN: American Guidance Service. Kavale, K. A. (2002). Discrepancy models in the identification of learning disability. In R.
DIAGNOSTIC UTILITY SCATTER 13
Bradley, L. Donaldson, & D. Hallahan (Eds.), Identification of learning disabilities: Research to practice (pp. 369-426). Mahwah, NJ: Erlbaum.
Kavale, K. A., & Forness, S. R. (1984). A meta-analysis of the validity of Wechsler scale
profiles and recategorizations: Patterns or parodies? Learning Disability Quarterly, 7, 136-156. doi: 10.2307/1510314
Kessel, J. B., & Zimmerman, M. (1993). Reporting errors in studies of the diagnostic
performance of self-administered questionnaires: Extent of the problem, recommendations for standardized presentation of results, and implications for the peer review process. Psychological Assessment, 5, 395-399. doi: 10.1037/1040-3590.5.4.395
Kranzler, J. H., Floyd, R. G., Benson, N., Zaboski, B., & Thibodaux, L. (2016). Classification
agreement analysis of cross-battery assessment in the identification of specific learning disorders in children and youth. International Journal of School & Educational Psychology, 4, 124-136. doi: 10.1080/21683603.2016.1155515
Lilienfeld, S. O., Ammirati, R., & David, M. (2012). Distinguishing between science
pseudoscience in school psychology: Science and scientific thinking as safeguards against human error. Journal of School Psychology, 50, 7-36. doi: 10.1016/j.jsp.2011.09.006
MacCallum, R. C., Zhang, S., Preacher, K. J., Rucker, D. D. (2002). On the practice of
dichotomization of quantitative variables. Psychological Methods, 7, 19-40. doi: 10.1037/1082-989X.7.1.19
Macmann, G. M., & Barnett, D. W. (1997). Myth of the master detective: Reliability of
interpretations for Kaufman’s “intelligent testing” approach to the WISC-III. School Psychology Quarterly, 12, 197-234. doi: 10.1037/h0088959
DIAGNOSTIC UTILITY SCATTER 14
McFall, R. M., & Treat, T. A. (1999). Quantifying the information value of clinical assessments
with signal detection theory. Annual Review of Psychology, 50, 215-241. doi: 10.1146/annurev.psych.50.1.215
McGill, R. J. (2016). Invalidating the full scale IQ score in the presence of significant factor
score variability: Clinical acumen or clinical illusion? Archives of Assessment Psychology, 6 (1), 49-79.
McGill, R. J., Styck, K. S., Palomares, R. S., & Hass, M. R. (2016). Critical issues in specific
learning disability identification: What we need to know about the PSW model. Learning Disability Quarterly, 39, 159-170. doi: 10.1177/0731948715618504
Meehl, P. E. (1978). Theoretical risks and tabular asterisks: Sir Karl, Sir Ronald, and the slow
progress of soft psychology. Journal of Consulting and Clinical Psychology, 46, 806- 834. doi: 10.1037/0022-006X.46.4.806
Meehl, P. E., & Rosen, A. (1955). Antecedent probability and the efficiency of psychometric
signs, patterns, or cutting scores. Psychological Bulletin, 52, 194-216. doi:: 10.1037/h0048070
Naglieri, J. A. (2000). Can profile analysis of ability test scores work? An illustration using the
PASS theory and CAS with an unselected cohort. School Psychology Quarterly, 15, 419- 433. doi: 10.1037/h0088798
Pfeiffer, S. I., Reddy, L. A., Kletzel, J. E., Schmelzer, E. R., & Boyer, L. M. (2000). The
practitioner’s view of IQ testing and profile analysis. School Psychology Quarterly, 15, 376-385. doi: 10.1037/h0088795
Prifitera, A., & Dersh, J. (1993). Base rates of WISC-III diagnostic subtest patterns among
normal, learning-disabled, and ADHD samples. Journal of Psychoeducational
DIAGNOSTIC UTILITY SCATTER 15
Assessment Monograph Series, 43-55.
Rapaport, D., Gil, M., & Schafer, R. (1945). Diagnostic psychological testing: The theory,
statistical evaluation, and diagnostic application of a battery of tests (Vol. 1). Chicago: Yearbook Medical.
Streiner, D. L. (2003). Diagnosing test: Using and misusing diagnostic and screening test.
Journal of Personality Assessment, 81, 209-219. doi: 10.1207/S15327752JPA8103_03 Stuebing, K. K., Fletcher, J. M., Branum-Martin, L., & Francis, D. J. (2012). Evaluation of the
technical adequacy of three methods for identifying specific learning disability. School Psychology Review, 41, 3-22.
Swets, J. A. (1988). Measuring the accuracy of diagnostic systems. Science, 240, 1285-1293.
doi: 10.1126/science.3287615 Watkins, M. W. (2000). Cognitive profile analysis: A shared professional myth. School
Psychology Quarterly, 15, 465-479. doi: 10.1037/h0088802 Watkins, M. W. (2002). Diagnostic Utility Statistics [Computer software]. Phoenix, AZ: Ed &
Psych Associates.
Watkins, M. W. (2003). IQ subtest analysis: Clinical acumen or clinical illusion? The Scientific
Review of Mental Health Practice, 2, 118-141.
Watkins, M. W. (2009). Errors in diagnostic decision making and clinical judgment. In T. B.
Gutkin & C. R. Reynolds (Eds.), Handbook of school psychology (4th ed.; pp. 210-229). New York, NY: Wiley.
Watkins, M. W., Glutting, J. J., & Youngstrom, E. A. (2005). Issues in subtest profile analysis.
In D. P. Flanagan & P. L. Harrison (Eds.), Contemporary intellectual assessment: Theories, tests, and issues (2nd ed.; pp. 251-268). New York: Guilford Press.
DIAGNOSTIC UTILITY SCATTER 16
Wiggins, J. S. (1988). Personality and prediction: Principles of personality assessment. Malabar,
FL: Krieger Publishing. Youngstrom, E. A. (2014). A primer on receiver operating characteristic analysis and diagnostic
efficiency statistics for pediatric psychology: We are ready to ROC. Journal of Pediatric Psychology, 39, 204-221. doi: 0.1093/jpepsy/jst062
Youngstrom, E. A., Choukas-Bradley, S., Calhoun, C. D., & Jensen-Doss, A. (2015). Clinical
guide to the evidence-based assessment approach to diagnosis and treatment. Cognitive and Behavioral Practice, 22, 20-35. doi: 10.1016/j.cbpra.2013.12.005
Youngstrom, E. A., & Van Meter, A. (2016). Empirically supported assessment of children and
adolescents. Clinical Psychology: Science and Practice, 23, 327-347. doi:
10.1111/cpsp.12172
DIAGNOSTIC UTILITY SCATTER 17
Table 1 Means and Standard Deviations of the KABC-II Index and FCI Scores for Participants Ages 6-18 in the Normative Sample Based Upon Known SLD Condition (N = 2,223) Non-SLD SLD KABC-II Score M SD M SD d Short-Term Memory (Gsm) 100.7 14.8 88.9 14.2 -0.81 Visual Processing (Gv) 100.5 14.8 90.7 13.5 -0.69 Long-Term Memory (Glr) 101.0 14.9 87.4 11.8 -1.01 Fluid Reasoning (Gf) 100.6 14.7 88.8 13.9 -0.82 Crystallized Ability (Gc) 100.6 14.7 88.6 13.8 -0.84 Fluid-Crystallized Index (g) 100.8 14.6 85.7 11.5 -1.14 Note. KABC-II = Kaufman Assessment Battery for Children-Second Edition (Kaufman & Kaufman, 2004b); g = general intelligence; Differences significant at p < .001 for all 6 score comparisons across groups based upon known SLD condition. Average cognitive profile scatter for the Non-SLD group (25.2) and SLD group (24.4) were both clinically significant.
DIAGNOSTIC UTILITY SCATTER 18
Table 2 Diagnostic Efficiency Statistics for Different Levels of Cognitive Scatter on the KABC-II Predicting the Presence of SLD Scatter Level AUC Sensitivity Specificity LR+ LR- PPV NPV DOR IPPP Accuracy Κ 10 Points .501 .964 .039 1.00 0.91 .050 .954 1.11 .000 .086 .000 15 Points .511 .882 .140 1.02 0.84 .051 .957 1.22 .001 .177 .002 23 Points .498 .576 .420 0.99 1.01 .049 .949 0.98 .000 .428 .000 30 Points .469 .243 .696 0.80 1.08 .040 .945 0.73 -.009 .673 -.018 Note. AUC = area under curve, LR+ = likelihood ratio for positive test results LR- = likelihood ratio for negative test results, PPV = positive predictive value, NPV= negative predictive value, DOR = diagnostic odds ratio, IPPP = incremental validity of positive test diagnosis (Hsu, 2002), Accuracy = agreement/hit rate, Κ = kappa coefficient for chance agreement (Streiner, 2003).
DIAGNOSTIC UTILITY SCATTER 19
Diagnostic Condition SLD No SLD Test Outcome Significant
Scatter True Positive False Positive
Type I Error Positive Predictive Value (PPV): Probability that scatter will be observed when SLD is present.
No Scatter False Negative
Type II Error True Negative Negative Predictive Value (NPV):
Probability that scatter is not present when SLD is not observed.
Sensitivity: Probability that
there will be scatter when SLD is identified.
Specificity: Probability that there will not be scatter when SLD is not identified.
Prevalence Rate: Base rate of SLD in the sample Accuracy: Rate at which true positives and true negatives are correctly identified False Alarm Rate (1-Specificity): Rate at which individuals present with scatter but do not have SLD Figure 1. Model for evaluating the degree to which scatter accurately predict specific learning disability (SLD) within a diagnostic decision framework.
DIAGNOSTIC UTILITY SCATTER 20
Figure 2. ROC graph illustrating the comparisons of true-positive and false-positive rates from individuals with and without SLD diagnoses form the KABC-II normative sample when all possible cut scores were used.
DIAGNOSTIC UTILITY SCATTER 21
10 Points
15 Points
23 Points
30 Points
Figure 3. Probability nomogram used to combine prior probability with likelihood ratios to estimate revised, posterior probability of SLD diagnosis using different levels of cognitive profile scatter as a positive or negative test.
Recommended