Evolving Management of Multiple Myeloma: 2015Todd M. Zimmerman, M.D.Associate Professor of MedicineSection of Hematology/Oncology

MULTIPLE MYELOMA
• Estimated 24,050 cases and 11,090 deaths in 2014[1]
• Median age at diagnosis: 69 yrs[2]
• 5-yr survival has improved substantially (45% in 2004-2010 vs 28% in 1987-1989[2]) due to novel agents
• Sensitive to treatment, but not curable
2
1. American Cancer Society. Cancer facts & figures. 2014. 2. SEER stat fact sheet: myeloma. 2013.`

Incidence over time of multiple myeloma vs overall cancer incidence in the US
Year of diagnosis Year of diagnosis
All cancersMyeloma
SEER 9 Delay‐Adj. IncidenceSEER 13 Delay‐Adj. Incidence
National Cancer Institute. Surveillance Epidemiology and End Results. www.seer.cancer.gov. Accessed March 4, 2013.

Etiology of multiple myeloma has not been clearly defined
Alexander DD et al. Int J Cancer. 2007;120(suppl 12):40-61.
Accepted risk factors Possible risk factors
Increasing age Obesity
Male sex Low fish/green vegetable consumption
African/ African‐American race AIDS
Family history Herpes zoster/shingles
MGUS
Inconsistent data on risk Do not appear to be risk factors
Hair dye use Smoking
Farming occupation Alcohol
Wood dust exposure Pesticides
Chronic immune stimulation conditions Organic solvents
Autoimmune diseases Radiation
Asbestos
Allergic conditions
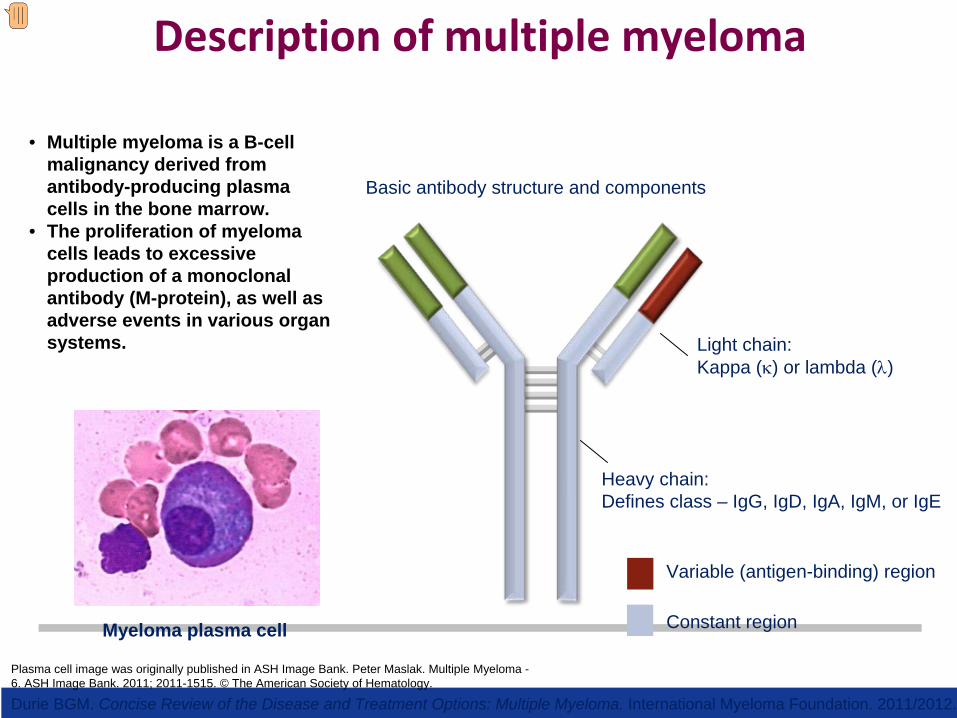
Description of multiple myeloma
Heavy chain:Defines class – IgG, IgD, IgA, IgM, or IgE
Light chain:Kappa (κ) or lambda (λ)
Constant region
Variable (antigen-binding) region
Plasma cell image was originally published in ASH Image Bank. Peter Maslak. Multiple Myeloma - 6. ASH Image Bank. 2011; 2011-1515. © The American Society of Hematology.
Myeloma plasma cell
Basic antibody structure and components
• Multiple myeloma is a B-cell malignancy derived from antibody-producing plasma cells in the bone marrow.
• The proliferation of myeloma cells leads to excessive production of a monoclonal antibody (M-protein), as well as adverse events in various organ systems.
Durie BGM. Concise Review of the Disease and Treatment Options: Multiple Myeloma. International Myeloma Foundation. 2011/2012.
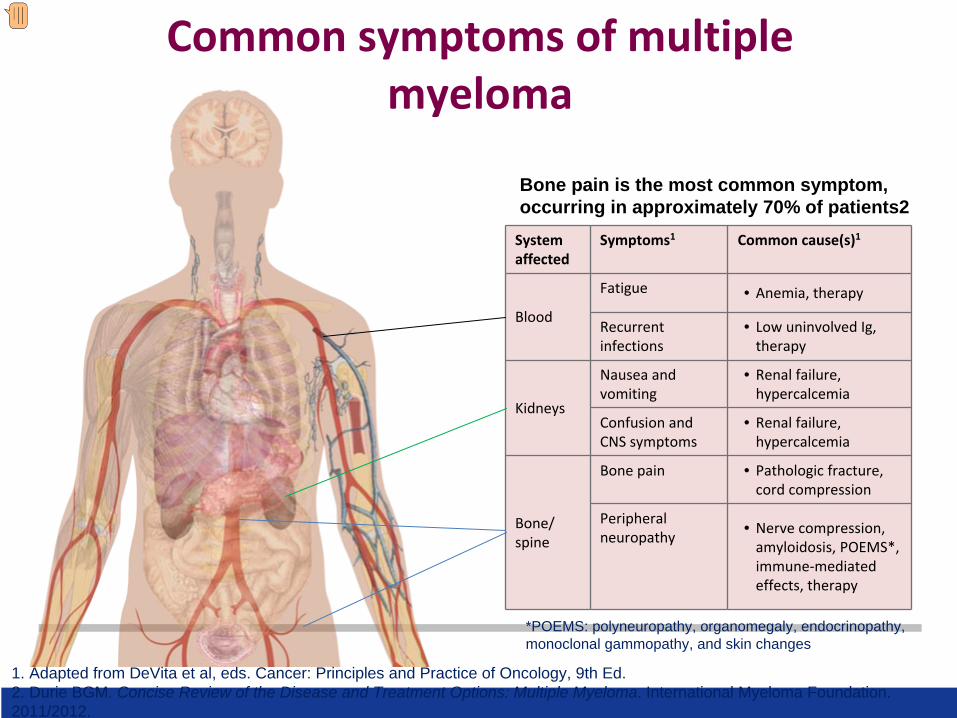
Common symptoms of multiple myeloma
System
affectedSymptoms1 Common cause(s)1
Blood
Fatigue • Anemia, therapy
Recurrent
infections• Low uninvolved Ig,
therapy
Kidneys
Nausea and
vomiting• Renal failure,
hypercalcemia
Confusion and
CNS symptoms• Renal failure,
hypercalcemia
Bone/
spine
Bone pain • Pathologic fracture,
cord compression
Peripheral
neuropathy • Nerve compression,
amyloidosis, POEMS*,
immune‐mediated
effects, therapy
*POEMS: polyneuropathy, organomegaly, endocrinopathy, monoclonal gammopathy, and skin changes
Bone pain is the most common symptom, occurring in approximately 70% of patients2
1. Adapted from DeVita et al, eds. Cancer: Principles and Practice of Oncology, 9th Ed.2. Durie BGM. Concise Review of the Disease and Treatment Options: Multiple Myeloma. International Myeloma Foundation. 2011/2012.

Recommended workup
Blood specimen Urine specimen Bone (marrow) specimen
• Chemistry screen, including
calcium and creatinine
• Serum β2
‐microglobulin,
albumin, and lactate
dehydrogenase
• Serum protein
electrophoresis (SPEP),
immunofixation
• Measurement of serum‐free
light chains
• Nephelometric quantification
of serum immunoglobulins
• Routine urinalysis, 24‐hour
urine collection for
electrophoresis and
immunofixation
• Bone marrow aspirate and/or
biopsy
• Cytogenetics (metaphase
karyotype and FISH)
• Radiologic skeletal bone
survey; magnetic resonance
imaging in certain
circumstances
Adapted from Dimopoulos M et al. Blood. 2011;117:4701-4705.Image: Steven Fruitsmaak
Normal SPEP
Abnormal SPEP showing M-spike of myeloma (arrow)

Recommended workup (cont’d)
Blood specimen Urine specimen Bone (marrow) specimen
• Chemistry screen, including
calcium and creatinine
• Serum β2
‐microglobulin,
albumin, and lactate
dehydrogenase
• Serum protein
electrophoresis (SPEP),
immunofixation
• Measurement of serum‐free
light chains
• Nephelometric quantification
of serum immunoglobulins
• Routine urinalysis, 24‐hour
urine collection for
electrophoresis and
immunofixation
• Bone marrow aspirate and/or
biopsy
• Cytogenetics (metaphase
karyotype and FISH)
• Radiologic skeletal bone
survey; magnetic resonance
imaging in certain
circumstances
Adapted from Dimopoulos M et al. Blood. 2011;117:4701-4705.
Skeletal survey image was originally published in ASH Image Bank. Peter Maslak. Multiple Myeloma - 1. ASH Image Bank. 2011; 2011-1510. © The American Society of Hematology
Fluorescence in situ hybridization (FISH)
Skeletal survey

Differential diagnosis
Adapted from Dimopoulos M et al. Blood. 2011;117:4701-4705.
C: Serum Calcium ≥11.5 mg/dLR: Renal insufficiency: serum creatinine >2 mg/dLA: Anemia: Hb <10 g/dL or 2 g/dL below normalB: Bone lesions: lytic or osteopenic, or pathologic fractures
Monoclonal
gammopathy of
undetermined
significance
(MGUS)
Asymptomatic
(smoldering)
myeloma Symptomatic myeloma
Serum
monoclonal
protein
<3 g/dL ≥3 g/dL Presence of serum and/or
urinary monoclonal protein
Clonal BM
plasma cells <10% ≥10% ≥10%
End‐organ
damage Absent Absent
Present;Can be attributed to the
underlying plasma cell
proliferative disorder (CRAB
symptoms)
And/or

Durie‐Salmon Staging System for MM
Stage Criteria Myeloma Cell Mass
(x1012
cells/m2)
I All of the following:Hemoglobin >10 g/dL; normal serum calcium or <10.5
mg/dL; normal bone/solitary plasmacytoma; low M
protein (lgG <5 g/dL; IGA <3 g/dL; Bence‐Jones protein <4
g/24 h)
<0.6 (low)
II Not fitting stage I or III 0.6‐1.2 (intermediate)
III Any of the following:Hemoglobin <8.5 g/dL; serum calcium >12 mg/dL; multiple
lytic bone lesions; high M protein (lgG >7 g/dL; IgA >5 g/dL;
Bence‐Jones protein >12 g/24 h)
>1.2 (high)
Subclassification Criterion
AB
Normal renal function (serum creatinine level <2.0 mg/dL)Abnormal renal function (serum creatinine level ≥2.0 mg/dL
M = monoclonal.International Myeloma Foundation. Available at: http://myeloma.org/pdfs/Durie‐SalmonSS.pdf. Accessed
August 25, 2014.

New MM Staging
New International Staging System
Stage CriteriaMedian Survival
(months)I Serum β2 -microglobulin <3.5 mg/L
Serum albumin ≥3.5 g/dL62
II Not stage I or III* 44
III Serum β2 -microglobulin ≥5.5 mg/L 29
*There are two categories for stage II: serum β2
‐microglobulin <3.5 mg/L but serum albumin <3.5 g/dL; or serum β2
‐microglobulin 3.5 to <5.5 mg/L irrespective of the serum albumin
level.Greipp PR et al. J Clin Oncol. 2005;23:3412‐3420.

mSMART 2.0: Classification of Active MM
FISHDel 17pt(14;16)t(14;20)
GEP High-risk
signature
All others including:Hyperdiploidt(11;14)t(6;14)
FISHt(4;14)*
Cytogenetic deletion 13 or hypodiploidy
PCLI >3%
High-risk 20% Intermediate-risk 20% Standard-risk 60%
3 years 4-5 years 8-10 years Mikhael J, et al. Management of Newly Diagnosed Symptomatic Multiple Myeloma: Updated Mayo Stratification of Myeloma and Risk-Adapted Therapy (mSMART) Consensus Guidelines 2013. Mayo Clin Proc. 2013;88:360-376.

MM Classification Over Time
www.upci.upmc.edu/
research/clinical/myeloma/ Fonseca R et al. Cancer Res. 2004;64:1546‐1558
Zhou Y et al. Leukemia. 2009;23:1941‐1956.M Rossi, J Kowalski, L Boise

6 unique clones at diagnosis
Variable chemotherapy response
Minor drug-resistant clone lethal
Clonal Tides Define Myeloma
15

Implications
Multiple clones with variable drug sensitivity (Combination chemotherapy a necessity and continuous
therapy logical)
Re‐emergence of drug‐sensitive clones (Once resistant not always resistant)
Minor clone is lethal (CR is a goal)
–
16
1
2
3

Minimal Residual Disease: New Definitions for CR
S.S. Patient
1 x 10¹²
Stringent CR
Molecular/flow CR
?Cure?
Disease burden
Newly diagnosed
1 x 10⁸
1 x 10⁴
0.0
CR
Sequencing CR

Redefining Symptomatic Myeloma
1 8

Smoldering Myeloma• No symptoms; no related organ/tissue
impairment• 10% to 20% of newly diagnosed myeloma[1]
• Can remain indolent for yrs• Progression rate: ~ 50% at 5 yrs[2]
– Progression rate in high‐risk subgroup: 50% at 2 yrs[3]
• Current question: Who
should be treated?[4]
1. Kyle RA. ASCO Connection. 2012. 2. Kyle RA, et al. Br J Haematol. 2007;139:730-743. 3. Mateos MV, et al. N Engl J Med. 2013;369:438-447. 4. Mateos MV, et al. Curr Hematol Malig Rep. 2013;8:270-276.
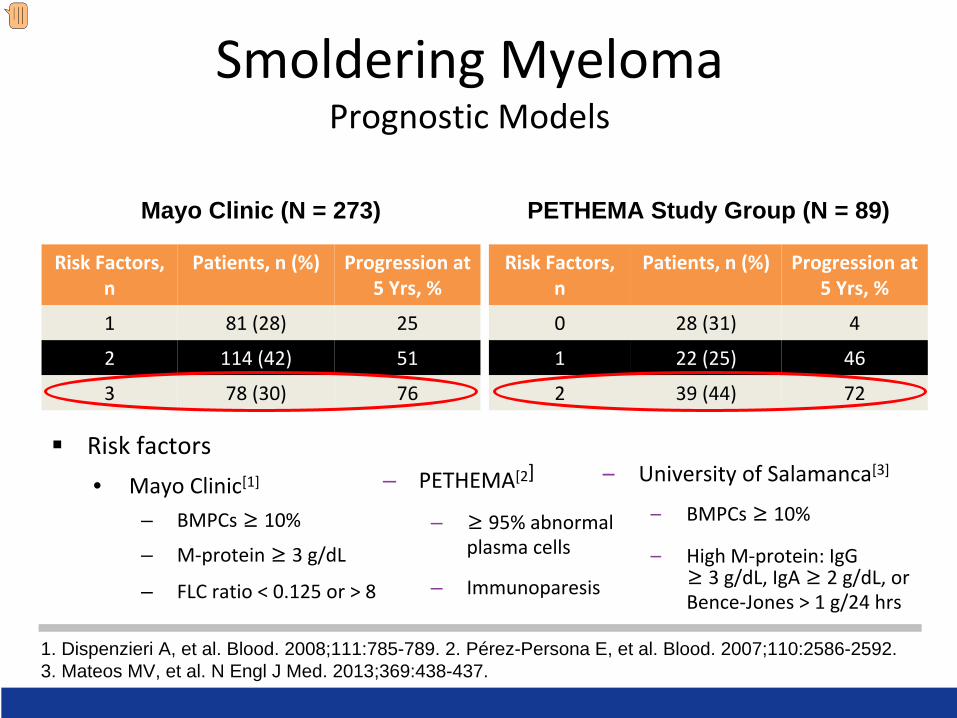
Smoldering Myeloma Prognostic Models
Risk factors• Mayo Clinic[1]
– BMPCs ≥ 10%
– M‐protein ≥ 3 g/dL
– FLC ratio < 0.125 or > 8
1. Dispenzieri A, et al. Blood. 2008;111:785-789. 2. Pérez-Persona E, et al. Blood. 2007;110:2586-2592. 3. Mateos MV, et al. N Engl J Med. 2013;369:438-437.
– PETHEMA[2]
– ≥ 95% abnormal
plasma cells
– Immunoparesis
–
University of Salamanca[3]
–
BMPCs ≥ 10%
–
High M‐protein: IgG
≥ 3 g/dL, IgA ≥ 2 g/dL, or
Bence‐Jones > 1 g/24 hrs
Risk Factors,
n
Patients, n (%) Progression at
5 Yrs, %
1 81 (28) 25
2 114 (42) 51
3 78 (30) 76
Risk Factors,
n
Patients, n (%) Progression at
5 Yrs, %
0 28 (31) 4
1 22 (25) 46
2 39 (44) 72
Mayo Clinic (N = 273) PETHEMA Study Group (N = 89)

PETHEMA Phase III Trial: Len/Dex vs Observation in High‐Risk SM
• Study limitation in assessing
OS: patients received
treatment off‐protocol at the
time of disease progression to
symptomatic myeloma– 53% treated with either
bortezomib‐based regimens – 28% treated with induction
therapy followed by
autologous stem‐cell
transplantation– 19% treatment not reported
Mateos MV, et al. N Engl J Med. 2013;369:438-447.
100
80
60
40
20
06050403020100
Mos
0 0
17 17
26 27
48 46
55 57
57 60
57 62
No. at Risk Treatment group Observation group
Hazard ratio for death, 0.31 P = 0.03
Observation group
Treatment group
Ove
rall
Surv
ival
sin
ce
Stud
y In
clus
ion
(%)

Active Myeloma
Not CRAB but now SLiM CRAB•S
(60% Plasmacytosis)
•Li
(Light chains I/U >100)•M (MRI 1 or more focal lesion)•C
(Calcium elevation)
•R
(Renal insufficiency)•A
(Anemia)
•B
(Bone disease)
Rajkumar et al. IMWG updated criteria for the diagnosis of multiple myeloma. Lancet Oncol. 2014;15:e538‐e548

Untreated Active Multiple Myeloma

Approved agents in multiple myeloma
Bortezomib1
Carfilzomib6
PLD4,5*
Thalidomide2
Cyclophosphamide & Melphalan
Lenalidomide3 Pomalidomide7

1960-651965-701970-751975-801980-851985-901990-951995-002000-052005-10
Improving Survival in MM

Lenalidomide15–25 mg/d
MyelosuppressionSkin rash
DVT
NNHO O
O
NH2
NN
O
O
O
O
Thalidomide100–200 mg/d
NeuropathyConstipation
SedationDVT
Pomalidomide 2–4 mg/d
Myelosuppression
Chemical Structure of Thalidomide, Lenalidomide, and Pomalidomide
26
Side effects Potency

Comparison of Proteasome Inhibitors
Bortezomib (reversible)Carfilzomib (irreversible)CEP 18770 (reversible)
MLN9708 (reversible)NPI-0052 (irreversible)
b1 Post-glutamyl Tryptic
Chymo-tryptic
NPI
b2
b3
b4
b5
b6
b7
NPI NPIPost-
glutamyl Tryptic
Chymo-tryptic
b3
b4
b5
b6
b7
Bortezomib
b1
NPI

Initial Approach to Treatment of Myeloma
Nontransplant Candidate (based on age, performance
status, and comorbidities)
Induction treatment
TransplantCandidate
Induction treatment (4-6 cycles)
Stem cell harvest
Stem cell transplantation
Maintenance
Maintenance
Consolidation therapy?

Len + LoDex ContinuouslyLenalidomide 25 mg Days 1-21/28LoDex 40 mg Days 1, 8, 15, 22/28
FIRST: Lenalidomide/Dexamethasone vs MPT in NDMM SCT-Ineligible Patients
Arm BRd18
Arm CMPT
Len + LoDex 18 cycles (72 weeks) Lenalidomide 25 mg Days 1-21/28LoDex 40 mg Days 1, 8, 15, 22/28
Mel + Pred + Thal 12 cycles2 (72 weeks)Melphalan 0.25 mg/kg Days 1-4/42Prednisone 2 mg/kg Days 1-4/42Thalidomide 200 mg Days 1-42/42
Active treatment + PFS follow-up phase1
Patients >75 years: LoDex 20 mg Days 1, 8, 15, 22/28; Thal3 100 mg Days 1-42/42; Mel3 0.2 mg/kg Days 1-4 Stratification: age, country, and ISS stage
Arm AContinuous Rd
NDMM = newly diagnosed MM; SCT = stem cell transplant.1. Facon T et al. ASH 2013 Annual Meeting. Abstract 2; 2. Facon T et al. Lancet. 2007;370:1209-1218; 3. Hulin C et al. J Clin Oncol. 2009;27:3664-3670.
Phase 3N = 1623

FIRST Trial: Efficacy Analysis of Len/Dex vs MPT in SCT-Ineligible Patients With MM
Benboubker L et al. N Engl J Med. 2014;371:906-917. Copyright © 2014. Reprinted with permission from Massachusetts Medical Society.
No. at RiskContinuous Ld 535 488 457 433 403 338 224 121 43 5 0LD18 541 505 465 425 393 324 209 124 44 6 0MPT 547 484 448 418 375 312 205 106 30 3 0
No. at RiskContinuous Ld 535 400 319 265 218 168 105 55 19 2 0LD18 541 391 319 265 167 108 56 30 7 2 0MPT 547 380 304 244 170 116 58 28 6 1 0
MedianProgression-Free
Survival(mo)
Continuous Ld (N = 535)
Hazard ratio:Continuous Ldvs MPT, 0.72; P<0.001Continuous Ldvs Ld18, 0.70; P<0.001
25.5
LD18 (N = 541)MPT (N = 547)
20.7
21.2
MedianProgression-Free
Survival(mo)
Continuous Ld (N = 535)
Hazard ratio:Continuous Ldvs MPT, 0.78; P = 0.02Continuous Ldvs LD18, 0.90; P = 0.31
59
LD18 (N = 541)MPT (N = 547)
56
51

Relapsed Multiple Myeloma
3 2
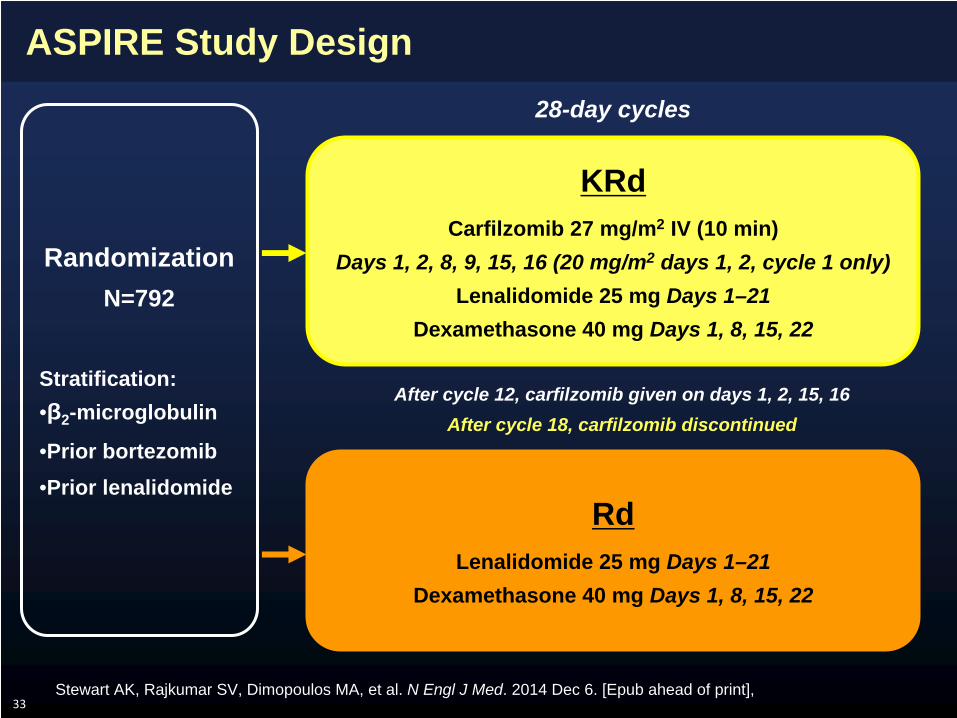
ASPIRE Study Design
33
RdLenalidomide 25 mg Days 1–21
Dexamethasone 40 mg Days 1, 8, 15, 22
KRdCarfilzomib 27 mg/m2 IV (10 min)
Days 1, 2, 8, 9, 15, 16 (20 mg/m2 days 1, 2, cycle 1 only) Lenalidomide 25 mg Days 1–21
Dexamethasone 40 mg Days 1, 8, 15, 22
Randomization N=792
Stratification:•β2 -microglobulin
•Prior bortezomib •Prior lenalidomide
After cycle 12, carfilzomib given on days 1, 2, 15, 16After cycle 18, carfilzomib discontinued
28-day cycles
Stewart AK, Rajkumar SV, Dimopoulos MA, et al. N Engl J Med. 2014 Dec 6. [Epub ahead of print],

Primary Endpoint: Progression-Free Survival ITT Population (N=792)
34
1.0
0.8
0.6
0.4
0.2
0.0
Pro
porti
on S
urvi
ving
With
out P
rogr
essi
on
KRdRd
0 6 12 18 24 30 36 42 48Months Since Randomization
KRd Rd(n=396) (n=396)
Median PFS, mo 26.3 17.6HR (KRd/Rd) (95% CI) 0.69 (0.57–0.83)P value (one-sided) <0.0001
No. at Risk:KRd
Rd396 332 279 222 179 112 24 1396 287 206 151 117 72 18 1
Stewart AK, Rajkumar SV, Dimopoulos MA, et al. N Engl J Med. 2014 Dec 6. [Epub ahead of print],

Secondary Endpoints: Response
35
P<0.0001
P<0.0001
sCR 14.1% vs 4.3%
P<0.0001
Median duration of response was 28.6 months in the KRd group and 21.2 months in the Rd group
Stewart AK, Rajkumar SV, Dimopoulos MA, et al. N Engl J Med. 2014 Dec 6. [Epub ahead of print],

Secondary Endpoints: Interim Overall Survival Analysis Median Follow-Up 32 Months
36
Median OS was not reached; results did not cross the prespecified stopping boundary (P=0.005) at the interim analysis
1.0
0.8
0.6
0.4
0.2
0.0
Pro
porti
on S
urvi
ving
KRdRd
0 6 12 18 24 30 36 42 48Months Since Randomization
KRd Rd(n=396) (n=396)
Median OS, mo NE NEHR (KRd/Rd) (95% CI) 0.79 (0.63–0.99)P value (one-sided) 0.018
No. at Risk:KRd
Rd396 369 343 315 280 191 52 2396 356 313 281 237 144 39 3
Stewart AK, Rajkumar SV, Dimopoulos MA, et al. N Engl J Med. 2014 Dec 6. [Epub ahead of print],

Health-Related Quality-of-Life
37
EORTC Global Health Status improved
in the KRd group vs the Rd group over
18 cycles of treatment (P=0.0001)
70
65
60
55
50
EORT
C QLQ
‐C30
Global H
ealth
Status/Quality‐of‐Life
Score
Cycle 1(Baseline) Assessment Time Point (Day 1)
Carfilzomib groupControl group
Cycle 3 Cycle 6 Cycle 12 Cycle 18
Stewart AK, Rajkumar SV, Dimopoulos MA, et al. N Engl J Med. 2014 Dec 6. [Epub ahead of print],

Relapsed/Refractory Myeloma
3 8

Once Treatment Fails, Trouble Begins
Kumar SK. Mayo Clin Proc. 2004;79:867-874.Reprinted by permission from Macmillan Publishers Ltd: Kumar SK et al. Leukemia. 2012;26:149-157. © 2012.
Overall Survival From Start of Therapy by Regimen Number
0
0.2
0.4
0.6
0.8
1.0
0 2 4 6 8 10
Cum
ulat
ive
Prob
abili
ty (%
)
Years From Start of Regimen
Regimen 1Regimen 2Regimen 3Regimen 4Regimen 5Regimen 6
0
20
40
60
80
100
0 12 24 36 48 60
Months From Time Zero
Survival With Bz/Len Refractory Disease
Overall Survival 173/231 9 (7, 11)
Event-Free Survival 222/291 5 (4, 6)
Events/NMedian
(months)
Surv
ival
(%)

1960-651965-701970-751975-801980-851985-901990-951995-002000-052005-10
Improving Survival in MM
25% of patients live less than 3 years

Ixazomib (MLN9708)
• Ixazomib (MLN9708) is an investigational oral, reversible, and specific 20S proteasome inhibitor
– The first oral proteasome inhibitor in clinical development– Physiochemical properties distinct from bortezomib– Activity in preclinical models of MM
41

Oral Ixazomib – Phase 1 Weekly
• Oral weekly administration• 60 patients with heavily
pretreated disease• DLTs due to nausea, vomiting,
diarrhea, and rash• AEs – thrombocytopenia,
diarrhea, nausea, fatigue, vomiting
• Neuropathy 20% (but only 1 grade 3)
• 18% response rate (PR or better), 27% at MTD
Kumar SK, et al. Blood. 2014;124(7):1047-1055.

Ixazomib Treatment Duration and Response
Kumar SK, et al. Blood. 2014;124:1047-1055.
©2014 by American Society of Hematology

Ixazomib Summary
• Well tolerated• Single-agent activity in both weekly and twice
weekly administration• Less effective than bortezomib?• Low neuropathy rate is encouraging• Attractive oral regimen (esp in combination) – see
next slide

% c
hang
e fro
m b
asel
ine
to b
est
M-p
rote
in re
spon
se
Phase 1, 1.68 mg/m2 Phase 1, 2.97 mg/m2
RP2D, 2.23 mg/m2 / 4.0 mg Phase 1, 3.95 mg/m2
IRd (Ixazomib/Lenalidomide/Dex)- Best Percent Change in M-protein From Baseline in Response- Evaluable Patients
• 48% of patients achieved 100% reduction in M-protein• Reductions were seen at multiple dose levels
45

Elotuzumab: Background
ADCC = antibody-dependent cellular cytotoxicity; DMSO = dimethyl sulfoxide; mAb = monoclonal antibody; MED = maximum efficacious dose; MoA = mechanism of action; NK = natural killer.1. Hsi ED et al. Clin Cancer Res. 2008;14:2775-2784. Reproduced with permission from AACR. © 2008; 2. Tai YT et al. Blood. 2008;112:1329-1337; 3. Van Rhee F et al. Mol Cancer Ther. 2009;8:2616-2624; 4. Lonial S et al. ASH 2009 Annual Meeting. Abstract 432.

Daratumumab: A Human CD38 MAb With Broad-Spectrum Killing Activity
Plesner T. ASCO 2012 Annual Meeting. Abstract 8019.

Maximal Reduction of Serum M-Component (Part 1)
C* C A A A A A A C A A C
A A B A C* A A A B A A B A B A A C*
Maximal Change in Paraprotein
≤1 mg/kg 2 mg/kg 4 mg/kg 8 mg/kg 16 mg/kg
*Data at baseline below limits for measurable disease. Results are before database lock.A = serum M-component; B = urine M-component; C = free light chains (FLC). Plesner T. Annual Meeting. Abstract 8019.

CD38 Expressed in Hematological Malignancies
• Transmembrane glycoprotein and ectoenzyme• High receptor density on MM cells
CD38 Expressed in Hematological Malignancies
1. Lin P et al. Am J Clin Pathol. 2004;121:482-488; 2. Angelopoulou MK et al. Eur J Haematol. 2002;68:12-21; 3. Schwonzen M et al. Br J Haematol. 1993:83;232-239; 4. Keyhani A et al. Leukemia Res. 1999;24:153-159; 5. Domingo-Domenech E et al. Haematologica. 2002;87:1021-1027.
Disease CD38 + Expression (%)Multiple myeloma 80-1001
Non-Hodgkin lymphoma 30-802,3
Acute myeloid leukemia 584
B chronic lymphocytic leukemia 20-255

SAR650984: Maximal Change in Paraprotein Myeloma Patients Treated at Doses of 1 mg/kg or Higher Every 2 Weeks
A A A A A A A C A AA A A A A A A B C C C A A
1 mg/kg q2w
3 mg/kg q2w
5 mg/kg q2w
10 mg/kg q2w
10 mg/kg qw
20 mg/kg qw
A = serum M component; B = urine M component; C = free light chains (FLC).One patient at 3 mg/kg and 20 mg/kg with 0% change; one patient at 20 mg/kg not-evaluable.Martin TG III et al. ASH Annual Meeting. Abstract 284.

Blockade of Ubiquitinated Protein Catabolism
Tai YT et al. Cancer Res. 2005;65:5898-5906; Hideshima T et al. Clin Cancer Res. 2005;11:8530-8533. Reproduced with permission from AACR. © 2005; Catley L et al. Blood. 2006;108:3441-3449.
HDAC6
HDAC6
HDAC6
Protein
Protein aggregates(toxic)
Ub
26S Proteasome
Ub UbUb
Aggresome
TubacinLBH, vorinostat
Dynein
Dynein
MicrotubuleAutophagy
Bortezomib
Ub UbUb
Lysosome
Ub
Ub
UbUb
UbUb
Ub
Ub Ub

PANORAMA 2 Study Design: Phase 2, Simon 2-Stage Study in BTZ-Refractory MM
*Response measured according to modified European Group for Blood and Marrow Transplantation 1998 criteria.1. Anderson KC et al. Leukemia. 2008;22:231-239; Richardson PG et al. ASH 2011 Annual Meeting Abstract 814.
Treatment Phase 1 Eight 3-week cycles
Treatment Phase 2 6-week cycles until PD
• Adult patients• Relapsed and BTZ-
refractory MM• ≥2 prior lines of
therapy• Exposed to IMiDs
Panobinostat
Bortezomib
Dexamethasone
Panobinostat
Bortezomib
Dexamethasone
Screening
After 8 cycles, continuation into treatment Phase 2 in patients with clinical benefit
Primary endpoint: ORR (CR + nCR + PR)*
BTZ-refractory disease defined as relapse on or within 60 days of last BTZ-containing line of therapy1

Preliminary Response Data: Activity in Patients With Bortezomib-Refractory MM
Best confirmed response (confirmed at 6 weeks) N = 55Overall response (CR + nCR + PR) 16 (29%)
Complete response –
Near complete response 2 (4%)
Partial response 14 (25%)
Clinical benefit (CR + nCR + PR + MR) 27 (49%)
Minimal response 11 (20%)
VGPR 3 (6%)
• Responses were typically observed after 1 to 2 cycles• Stable disease observed in 2 patients; progressive disease in 10
patientsRichardson PG et al. ASH 2011 Annual Meeting Abstract 814.

PANORAMA 1 Study Design: Randomized, Double-Blind, Phase 3 Study in Relapsed or RRMM
Follow -up
Treatment Phase 1 Treatment Phase 2Eight 21-day cycles (24 weeks) Four 42-day cycles (24 weeks)
Panobinostat + Bortezomib +
Dexamethasone
Placebo + Bortezomib +
Dexamethasone
Panobinostat + Bortezomib +
Dexamethasone
Placebo + Bortezomib +
Dexamethasone
Patients with clinical benefit* in Treatment Phase 1 can proceed to Treatment Phase 2
• Primary endpoint: PFS (per modified EBMT criteria; confirmed by IRC)1,2
• Key secondary endpoint: OS• Other secondary endpoints: ORR, nCR/CR rate, DoR, TTR, TTP, QoL, and safety
Patients (N = 768)
•Relapsed or Relapsed/Refractory MM (BTZ-refractory excluded)
•1-3 prior lines of therapy
•Stratification factors– Prior lines of
therapy– Prior BTZ
*Achieving ≥no change according to modified EBMT criteria (SD or better).1. Blade J et al. Br J Haematol. 1998;102:1115-1123.2. Richardson PG et al. N Engl J Med. 2003;348:2609-2617.Richardson PG et al. ASCO 2014 Annual Meeting. Abstract 8510.
Study conducted at 215 centers across 34 countries

PANORAMA 1: Primary Endpoint Met (PFS)
• Primary endpoint was met (P<0.0001), with clinically relevant increase in median PFS of 3.9 months for PAN-BTZ-Dex arm
100
80
60
40
20
0
0 2 4 6 8 10 12 14 16 18 20 22 24 26 28 30 32 34 36
387 288 241 202 171 143 113 89 69 52 44 35 26 18 13 10 5 3 0381 296 235 185 143 114 89 64 42 32 24 18 12 5 5 3 2 0 0
MonthsNo. at RiskPAN-BTZ-DexPbo-BTZ-Dex
Prog
ress
ion-
Free
Sur
viva
l Pro
babi
lity
(%) Events
Median PFS months (95% CI) HR
(95% CI) P value
PAN-BTZ-Dex 207/387 12.0 (10.3, 12.9) 0.63
(0.52-0.76)<0.0001
Pbo-BTZ-Dex 260/381 8.1 (7.6, 9.2)
PAN-BTZ-Dex Pbo-BTZ-Dex
Richardson PG et al. ASCO 2014 Annual Meeting. Abstract 8510.

Conclusions
• Prolonged duration of therapy results in longer remission duration and potentially improved overall survival.
– FIRST Trial– Maintenance therapy post transplant
• Combination therapy results in improved progression free survival and potentially overall survival.
– ASPIRE Trial– Clonal Tides Theory
• Novel agents will help transform relapsed/refractory disease.
– Oral proteasome inhibitors– Monoclonal antibodies
56
Recommended