Examples of Poor Power Point Practice
The Practitioners’ Guide to HEA
Chapter 5: Translating Outcomes into Action, Annex D

Juxtaposing Poverty & Aid Traps
Poverty Traps in S. Africa Look at changes over time
in asset bundles measured in Poverty Line Units (PLUs)
Key findings:– Divergent dynamics– Repelling ‘Micawber
Threshold’ at ~2 PLUs– Poverty trap equilibrium at
0.9 PLUs Shocks & Productive
Safety Net at the Micawber Threshold
0 1 2 31993 Asset Index, (Poverty Line Units)
0
1
2
3
1998 A
sset In
dex,
(P
ove
rty
Lin
e U
nits
)
Poverty Trap
Expected Asset Dynamics95% Confidence Bands
Micawber Threshold
Source: Adato, M., M.R. Carter and J. May (2006), “Exploring Poverty Traps and Social Exclusion in South Africa Using Qualitative and Quantitative Data”, J of Development Studies, 42 (2): 226-247.
The labels on this graphic The labels on this graphic are impossible to readare impossible to read
The labels on this graphic The labels on this graphic are impossible to readare impossible to read

Civil InsecurityIDPs
AWD Case Fatality Rate (%) Unacceptable Levels (>2%) Combined with Concentrated Displacement (May 3, 2007)
• Galgadud, Dhuusamareeb (3.4%)
• Hiran, Belet Weyne (3.6%)
• Shabelle, Marka (3.4%,) Afgoye (5.3%), Brava (2.6%)
Loss of Livelihoods, Income & Assets Combined with Sharp Food Price Increases (between mid-March & end April)
Import Commodities Local Cereal
• Central 11-25% no change
• M. Shabelle 25-50% 9%• L. Shabelle 15-60% 15-40% • Hiran 20-25% no change
• Bay 25-60% 40-160%
There is too There is too much information much information
on this pageon this page
There is too There is too much information much information
on this pageon this page

The title font The title font is too smallis too small
Too many Too many ‘messages’‘messages’
The title font The title font is too smallis too small
Too many Too many ‘messages’‘messages’

These are talking points These are talking points for the presenter, not for the presenter, not
bullet points for a slidebullet points for a slide
These are talking points These are talking points for the presenter, not for the presenter, not
bullet points for a slidebullet points for a slide
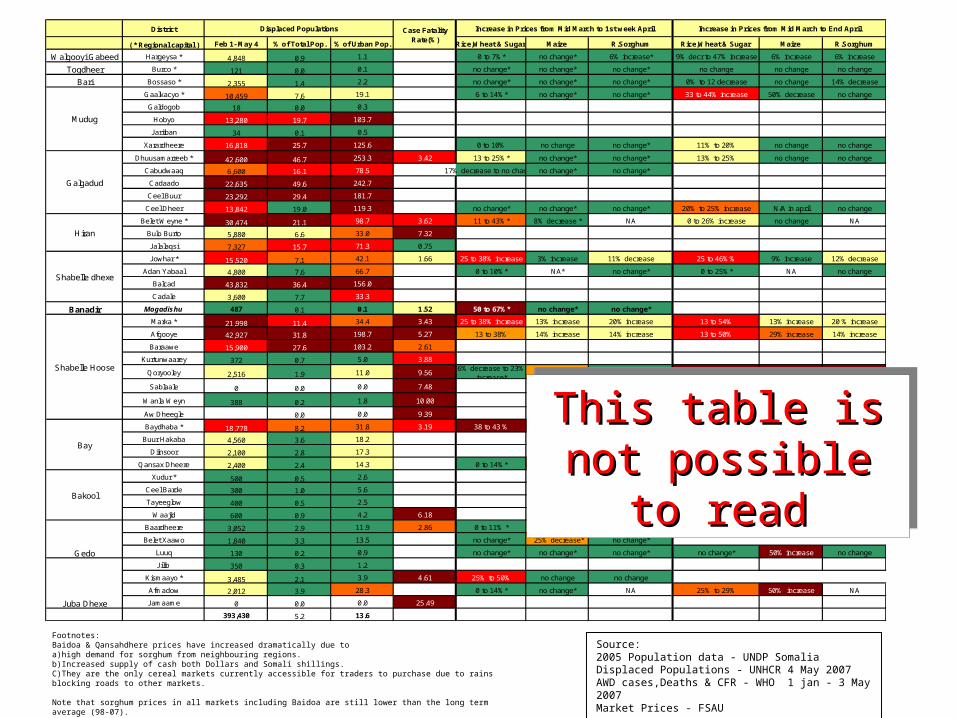
District
( * Regional capital ) Feb 1- May 4 % of Total Pop. % of Urban Pop. Rice,Wheat & Sugar Maize R.Sorghum Rice,Wheat & Sugar Maize R.Sorghum
Walgooyi Gabeed Hargeysa * 4,848 0.9 1.1 0 to 7%* no change* 6% increase* 9% decr to 47% increase 6% increase 6% increase
Togdheer Burco * 121 0.0 0.1 no change* no change* no change* no change no change no change
Bari Bossaso * 2,355 1.4 2.2 no change* no change* no change* 0% to 12 decrease no change 14% decrease
Gaalkacyo * 10,459 7.6 19.1 6 to 14%* no change* no change* 33 to 44% increase 50% decrease no change
Galdogob 18 0.0 0.3
Hobyo 13,280 19.7 103.7
Jariiban 34 0.1 0.5
Xarardheere 16,818 25.7 125.6 0 to 10% no change no change* 11% to 20% no change no change
Dhuusamarreeb * 42,600 46.7 253.3 3.42 13 to 25%* no change* no change* 13% to 25% no change no change
Cabudwaaq 6,600 16.1 78.5 17% decrease to no change*no change* no change*
Cadaado 22,635 49.6 242.7
Ceel Buur 23,292 29.4 181.7
Ceel Dheer 13,842 19.0 119.3 no change* no change* no change* 20% to 25% increase N/A in april no change
Belet Weyne * 30,474 21.1 98.7 3.62 11 to 43%* 8% decrease * NA 0 to 26% increase no change NA
Bulo Burto 5,880 6.6 33.0 7.32
Jalalaqsi 7,327 15.7 71.3 0.75
Jowhar * 15,520 7.1 42.1 1.66 25 to 38% increase 3% increase 11% decrease 25 to 46%% 9% increase 12% decrease
Adan Yabaal 4,800 7.6 66.7 0 to 10%* NA* no change* 0 to 25%* NA no change
Balcad 43,832 36.4 156.0
Cadale 3,600 7.7 33.3
Banadir Mogadishu 487 0.1 0.1 1.52 50 to 67%* no change* no change*
Marka * 21,998 11.4 34.4 3.43 25 to 38% increase 13% increase 20% increase 13 to 54% 13% increase 20 % increase
Afgooye 42,927 31.8 198.7 5.27 13 to 38% 14% increase 14% increase 13 to 50% 29% increase 14% increase
Baraawe 15,900 27.6 103.2 2.61
Kurtunwaarey 372 0.7 5.0 3.88
Qoryooley 2,516 1.9 11.0 9.566% decrease to 23%
increase*25%increase* no change* 18% to 69%increase 41 %increase 50% increase
Sablaale 0 0.0 0.0 7.48
Wanla Weyn 388 0.2 1.8 10.00
Aw Dheegle 0.0 0.0 9.39
Baydhaba * 18,778 8.2 31.8 3.19 38 to 43 % 67% increase no change 25% to 57% incr. 288% increase 160% increase
Buur Hakaba 4,560 3.6 18.2
Diinsoor 2,100 2.8 17.3
Qansax Dheere 2,400 2.4 14.3 0 to 14%* 44% increase* no change* 33% to 57% increase 100% increase 40% increase
Xudur * 500 0.5 2.6
Ceel Barde 300 1.0 5.6
Tayeeglow 400 0.5 2.5
Waajid 600 0.9 4.2 6.18
Baardheere 3,052 2.9 11.9 2.86 0 to 11% * 17%decrease* 40% decrease* 22% to 57% increase 67% increase 34% decrease
Belet Xaawo 1,840 3.3 13.5 no change* 25% decrease* no change*
Luuq 130 0.2 0.9 no change* no change* no change* no change* 50% increase no change
Jilib 350 0.3 1.2
Kismaayo * 3,485 2.1 3.9 4.61 25% to 50% no change no change
Afmadow 2,012 3.9 28.3 0 to 14%* no change* NA 25% to 29% 50% increase NA
Jamaame 0 0.0 0.0 25.49
393,430 5.2 13.6
Increase in Prices from Mid March to End AprilDisplaced Populations Case Fatality Rate(%)
Increase in Prices from Mid March to 1st week April
Juba Dhexe
Gedo
Bakool
Bay
Mudug
Shabelle Hoose
Shabelle dhexe
Hiran
Galgadud
Footnotes:Baidoa & Qansahdhere prices have increased dramatically due to a)high demand for sorghum from neighbouring regions.b)Increased supply of cash both Dollars and Somali shillings.C)They are the only cereal markets currently accessible for traders to purchase due to rains blocking roads to other markets.
Note that sorghum prices in all markets including Baidoa are still lower than the long term average (98-07).April '07 maize prices in Lower & Middle Shabelle are still lower than the April prices since 2004.
Source: 2005 Population data - UNDP Somalia Displaced Populations - UNHCR 4 May 2007AWD cases,Deaths & CFR - WHO 1 jan - 3 May 2007Market Prices - FSAU
This table is not This table is not possible to readpossible to readThis table is not This table is not possible to readpossible to read

There is too much There is too much information on this slide information on this slide – better as a hand out– better as a hand out
There is too much There is too much information on this slide information on this slide – better as a hand out– better as a hand out

The National Solidarity Programme
• Rural Reconstruction and Development project Implemented by MRRD • 4 years from 2003 to 2007• Funding and Assistance from World Bank and International Donors• Covering all Provinces of Afghanistan • 3 phases each year, covering averagely 16 villages in each ”batch”
1st year: 5506 CDCs elected, and ongoing facilitation in 5917 Villages • Planned target, end of the project by 2007: 20.000 villages in the whole country
• Main Objectives:• Reducing Poverty through Reconstruction and Development with Equal and
Inclusive Participation – Gender, Ethnicity, Wealth and Social Status• Improved Local Governance with Empowerment of the People through Inclusive
Participation in Reconstruction and Development
– Building Institutions on Local Level and Linkage with the Sub-Government Structures – Learning Democracy through Participatory Co-operation and Shared Responsibility in the
Planning of Community Development
The font size on this slide is too The font size on this slide is too small – there is too much textsmall – there is too much text
The font size on this slide is too The font size on this slide is too small – there is too much textsmall – there is too much text

Service Delivery
Local Government seeks to provide much-needed
services and peace dividends to its people. In order to
meet this goal, it needs to:• Provide its communities with a secure environment• Improve its own capacity to jointly identify, plan,
prioritize, implement and monitor/evaluate humanitarian, recovery and development projects with its communities and partners
• Coordinate existing UN and NGO activities (“service delivery”)
• Reduce its dependency on external support through a gradual process of fund raising, capacity building, absorption & direct execution of projects
The text The text color choice color choice is poor – not is poor – not
enough enough contrast with contrast with background background
making it making it hard to readhard to read
The text The text color choice color choice is poor – not is poor – not
enough enough contrast with contrast with background background
making it making it hard to readhard to read
Recommended