Exploring Linkages in the Cognitive-Emotional Model Within the Context of Organizational Change
by
Eric Brian Gresch
A dissertation submitted to the Graduate Faculty of Auburn University
in partial fulfillment of the requirements for the Degree of
Doctor of Philosophy
Auburn, Alabama May 9, 2011
Keywords: organizational change, emotion, cognition, change message strategies, influence
Copyright 2011 by Eric Brian Gresch
Approved by
Stanley G. Harris, Chair, Torchmark Professor of Management Achilles A. Armenakis, Pursell Professor of Management
Kevin W. Mossholder, C. G. Mills Professor of Management

ii
Abstract
To better understand linkages between cognition and emotion within the context of an
organizational change, a study of employees was conducted in a public university during the
introduction of a technological change. Quantitative supervisor and subordinate self-report data
are analyzed from survey questionnaires. Results support a number of relationships proposed in
cognitively-based models of emotion including relationships between change beliefs and felt
emotion. Additionally, the impact of change message strategies on change recipient beliefs is
assessed. HLM analysis suggests supervisor beliefs about a change influence subordinate
beliefs.
iii
Acknowledgements In reaching this milestone, I am happy to take the opportunity to thank the many
remarkable individuals who helped me to reach this point. I have heard the analogy that the
process of earning one’s doctoral degree is like completing a marathon; perseverance and steady
pacing are essential. My observations and first-hand experiences lead me to believe that the
process is often more akin to a combination of a marathon and the Chutes and Ladders board
game; almost everyone experiences unexpected setbacks. Fortunately, in navigating the process,
I’ve been blessed by invaluable support from faculty, graduate student peers, friends and family.
I first wish to thank my dissertation chair, Stan Harris, without whom this would not have
been possible. I also thank my dissertation committee, Achilles Armenakis, Kevin Mossholder,
and Malissa Clark, all of whom were exceptionally supportive. Additionally, I wish to recognize
Bill Giles and Junior Feild, who have also greatly facilitated my academic endeavors.
I thank Steve Brown and Viraj Varma; we began the program together as cohort peers
and I now count them as talented collaborators and lifelong friends. I also thank Dean Vitale for
including me in numerous academic collaborations. I thank Stephanie Rivale for serving as my
unofficial doctoral program coach, providing invaluable perspective and encouragement.
My parents, Sig and Shirley Gresch, have always supported me in whatever goal I have
set out to accomplish, and the pursuit of my PhD has been no exception. The love and
unwavering support they have shown for me throughout the process has made all the difference.
iv
Table of Contents Abstract ........................................................................................................................................... ii
Acknowledgements ........................................................................................................................ iii
List of Tables ................................................................................................................................ vii
List of Figures .............................................................................................................................. viii
Chapter 1: Theory and Hypotheses ................................................................................................. 1
Emotional Reactions to Organizational Change ......................................................................... 4
The Dimensional Structure of Emotion ...................................................................................... 5
Cognitive Appraisal Theory ........................................................................................................ 7
Five Key Change Appraisals and Pleasure and Activation ....................................................... 10
Change Beliefs and Discrete Emotions ..................................................................................... 15
Emotions and Change Support .................................................................................................. 19
Change Message Strategies and Change Beliefs ....................................................................... 22
Persuasive communication. ................................................................................................... 22 Human resource practices ...................................................................................................... 23 Vicarious learning. ................................................................................................................ 25
Leader Influences on Change Beliefs ........................................................................................ 26
Leader-member exchange. .................................................................................................... 27 Supervisor change beliefs. ..................................................................................................... 28

v
Chapter 2: Method ........................................................................................................................ 31
Organizational Context ............................................................................................................. 31
Sample and Data Collection ...................................................................................................... 32
Non-supervisory employees. ................................................................................................. 33 Supervisors. ........................................................................................................................... 34 Responses. ............................................................................................................................. 35
Measures .................................................................................................................................... 35
Change beliefs ....................................................................................................................... 35 Felt pleasure and arousal ....................................................................................................... 37 Discrete emotions .................................................................................................................. 38 Change message strategies .................................................................................................... 38 Self-rated change adoption behavior ..................................................................................... 39 Supervisor-rated change adoption behavior .......................................................................... 39 Dispositional optimism .......................................................................................................... 39
Chapter 3: Results ......................................................................................................................... 42
Measurement Models ................................................................................................................ 42
Change Beliefs Related to Pleasure and Positive Discrete Emotions ....................................... 51
Change Beliefs Related to Positive Discrete Emotions ............................................................ 53
Change Beliefs and Arousal ...................................................................................................... 53
Change Beliefs and Negative Discrete Emotions...................................................................... 54
Pleasure and Activation Related to Change Adoption Behavior .............................................. 57
Change Message Strategies, LMX, and Supervisor Beliefs Related to Change Beliefs ........... 59
vi
Chapter 4: Discussion ................................................................................................................... 67
Predicting Felt Emotion ............................................................................................................ 67
Antecedents of Change Beliefs ................................................................................................. 72
Future research .......................................................................................................................... 75
Limitations ................................................................................................................................ 76
References ..................................................................................................................................... 78
Appendix A: Survey for Non-Supervisory Employees ............................................................... 92
Appendix B: Survey for Supervisors ............................................................................................ 99
Appendix C: Revised Items for LMX and OCRBS scales ........................................................ 108

vii
List of Tables Table 1 CFA of Change Beliefs .................................................................................................. 44
Table 2 CFA of Change Message Strategies ............................................................................. 46
Table 3 CFA of Discrete Emotions ............................................................................................. 48
Table 4 Means, Standard Deviations, and Correlations among Employee-level Variables ....... 49
Table 5 Hierarchical Multiple Regression Analysis for Pleasure and Positive Discrete Emotions ........................................................................................................................ 52
Table 6 Hierarchical Multiple Regression Analysis of Activation on Change Beliefs .............. 54
Table 7 Hierarchical Multiple Regression Analysis for Negative Discrete Emotions ............... 56
Table 8 Hierarchical Multiple Regression Analysis for Change-Related Behaviors ................. 57
Table 9 Hierarchical Linear Modeling Models and Results ....................................................... 60
Table 10 Summary of Significant Predictors for Subordinate Five Change Beliefs .................. 62
Table 11 Summary of Hypotheses and Results .......................................................................... 64

viii
List of Figures
Figure 1 Activation as a Moderator between Pleasure and Change-related Behavior Adoption ....................................................................................................................... 58
1
Chapter 1: Theory and Hypotheses
Organizational changes can disrupt the fabric of organizational life including
interpersonal relationships, reporting lines, group boundaries, employee and work unit status,
and the social identities associated with group memberships (Jones, et al., 2008; Paulsen, et al.,
2005). As a result, implementing organizational change has long been recognized as a challenge
for change agents (Duck, 2001).
Besides the technical aspects related to implementing a change, change agents must
contend with the emotional reactions of change recipients (Liu & Perrewé, 2005). Because of
their consequences and general uncertainty surrounding them, organizational changes frequently
provoke strong emotional reactions from organizational members (Coch & French, 1948; Liu &
Perrewé, 2005; Piderit, 2000). The impact of negative emotions on change efforts should not be
underestimated. For example, research has found that negative emotions are correlated with
unwillingness to support a change (Judson, 1991; Kiefer, 2005). Furthermore, the inability to
manage the type and strength of emotions resulting from organizational change can be an
important cause of change program failure (Liu & Perrewé, 2005; Paterson & Hartel, 2002).
Therefore, to promote change success, change agents should help organization members process
and label their change-related emotions as positive rather than negative in tone (Mossholder,
Settoon, Armenakis, & Harris, 2000).
What mechanisms are available to help change agents in this emotional management
responsibility? The dominant theoretical approach to emotional reactions emphasizes the role of
cognitive appraisal (Scherer, Schorr, & Johnstone, 2001). Appraisals of a stimulus relative to its
implications for the individual shapes that person’s emotional reactions; appraisals of a change
inform organizational members’ emotional responses to that change (Elfenbein, 2007; Liu &

2
Perrewé, 2005). Therefore, to the extent that change agents can influence change appraisals, they
should be able to influence the emotional reactions to those changes. But what change
appraisals are most important and therefore warrant our attention? I believe the five key beliefs
underlying change commitment identified by Armenakis, Harris, and Feild (1999) provides an
excellent starting point.
Armenakis, Harris, and Feild (1999) argue that five key change beliefs (appraisals) drive
individual motivation to support or resist change. Their five beliefs build off expectancy theories
of motivation and include discrepancy (change is needed), appropriateness (the specific change
chosen is appropriate), efficacy (I/we can accomplish the change), principal support (key parties
will support change efforts), and valence (I will benefit from the change). They argue that
change agents can design interventions that communicate and reinforce these beliefs and, in turn,
create change readiness and facilitate adoption of, and commitment to, the change.
While preliminary research seems to support the importance of the five belief model,
much more is needed. First, little research has examined the five beliefs simultaneously nor
examined their relative importance for diverse outcomes (Armenakis & Harris, 2009). In this
dissertation, I address this shortcoming by examining the relationships between the five beliefs
and general and discrete emotional reactions and change behavior adoption. I build on earlier
research by examining all five beliefs and their relationships with pleasure and key discrete
emotions including happiness, hope, excitement, sadness, anger, worry, and fear.
Discriminating between discrete emotions can provide valuable insights into change
recipients’ reactions to a change, as different emotions contain particular action tendencies
(Frijda, 1993; Weiss, 2002a). For example, while fear, sadness, and anger are all motive-
inconsistent (negative) emotions, each has very different implications for behavior related to the

3
change. This study contributes to the field by investigating which specific appraisals are most
strongly related to individual discrete emotions. Ultimately, emotions felt toward the change
influence the attitudes and behavior exhibited toward the change (Elfenbein, 2007). Prior
research had provided evidence that felt pleasure is positively related to job satisfaction and
negatively related to turnover intentions (Harris & Gresch, 2010). This study extends our
understanding of this area by examining the relationships between felt emotions and the adoption
of change compliant behavior.
Armenakis, Harris, and Feild (1999) suggest six specific explicit and implicit message
strategies that change agents can use to influence the five change beliefs. However, research has
not been conducted which explores empirically the relative impact of individual strategies on
change recipient appraisals. In the current study, I help fill this void by examining the role of
four strategies (persuasive communication, enactive mastery, vicarious learning, and lecture
training) in shaping the five change beliefs.
In addition to these message strategies, Armenakis, Harris, and Feild (1999) cited the
importance of change agent credibility. I examine the contagion effect of supervisor change
beliefs on those of their subordinates. Supervisors are mediators of sources of information about
the phenomenon (Moscovici, 1976). This study seeks to explore the degree to which employees
share beliefs about a change held by their supervisor. Another important part of credibility
revolves around trust and the quality of the dyadic relationship between the agent and others. As
supervisors are often viewed as agents of change, I examine the relationship between leader-
member exchange (LMX) and change beliefs.
The research reported here holds promise for both change and emotion scholars and
organizational change agents. This research offers emotion scholars additional insights into the

4
relationships between cognitions and felt emotion, measured in both discrete and dimensional
forms. Having such knowledge can inform change agents of the beliefs that are most important
to address in their efforts to increase positive emotions or decrease negative emotions felt toward
a change. Additionally, the research findings can further illuminate the nature of the relationship
between felt emotion and change acceptance behavior. The assessment of these relationships
helps to further clarify the process of emotional experiences, contributing to the emotion
literature.
In addition, this research offers insights into how change recipient beliefs may be shaped
by a number of different change message strategies. The results can inform change planners of
particular change message strategies that are influential in shaping specific beliefs regarding a
change. Additionally, this research highlights how supervisors may influence subordinate
change beliefs by exploring the roles that supervisor-subordinate relationship quality and
supervisor change beliefs play in shaping the beliefs of subordinates.
Emotional Reactions to Organizational Change
Emotions are intrinsic to the workplace (Ashkanasy, Zerbe, & Hartel, 2002) and impact
attitudes and behavior such as trust and commitment, turnover intentions, and work slowdowns
(George & Jones, 1997; Kiefer, 2005; Weiss, 2002b; Weiss & Cropanzano, 1996). Affective
Events Theory (AET; Weiss & Cropanzano, 1996) provides insights into the nature of the
emotional experience in the workplace. AET argues that aspects of the work environment,
including environmental conditions, roles and job design, initiate emotions in organizational
settings (Ashkanasy, et al., 2002). Experiences in the workplace are a series of work events that
can either be pleasing and invigorating or stressful and frustrating (Ashkanasy, et al., 2002;
Weiss & Cropanzano, 1996). These work experiences thus comprise affective events, also

5
referred to as “hassles and uplifts” that determine affective states (Ashkanasy, et al., 2002; Basch
& Fisher, 2000).
Recognizing that workplace events prompt emotions and that organizational change
generates significant events that can greatly advance or undermine an individual’s goals, it is of
little surprise that organizational changes often elicit strong emotional reactions from change
recipients. Fundamental changes in personnel, strategy, organizational identity, or established
work roles and interests often trigger intense emotions (Bartunek, 1984; Huy, 2002). Change
can offer positive opportunities for personal and career growth, improved salary, benefits, and
working conditions, and enhanced employment security. Negative consequences of change often
include the high costs of establishing new relationships, skills and patterns of activity
(Cartwright & Cooper, 1992; Kiefer, 2005; Kotter, 1995), reduced income, increased workload,
and job loss. In addition to the known consequences of organizational change, there is often a
general uncertainty surrounding the change, which frequently prompts strong emotional
reactions among organizational members (Coch & French, 1948; Liu & Perrewé, 2005; Piderit,
2000).
The Dimensional Structure of Emotion
Emotion and mood are two different types of affect, which refers to a broad range of
feelings that people experience. Although emotion and mood are closely related, each has
differentiating characteristics. Often, moods and emotions are distinguished by both intensity
and duration of the affective state (Frijda, 1993; Larsen, 2000; Morris & Schnurr, 1989; Weiss,
2002a). Moods are generally conceptualized as less intense and of longer duration than
emotions, and are characterized by their diffusiveness (Weiss, 2002a). While emotions are
always felt in relation to a particular object or event (I am sad because I did not receive a job
6
offer; I am angry with my spouse), moods are not clearly associated with an object or defining
event. As such, moods exist more as background affective states (Weiss, 2002a).
Emotion represents a constellation of physiological, subjective, and behavioral responses
that relate to a unified construct (Weiss, 2002a). Frijda (1993) summarizes four components of
emotions for which there is a general consensus among emotion researchers. First, there is the
experiential aspect of affect; that is the positive/negative feeling of the emotional state. Second,
the experiential aspect is always connected to a focal object, person, or event. Third, an
emotional state includes recognizable physiological, bodily changes. Last, discrete emotions
motivate particular action tendencies.
When describing how one feels emotionally, individuals tend to use specific, discrete
emotions such as happy, sad, angry, or worried. In order to provide an organized framework in
which to conceptualize emotions, researchers have sought to determine an underlying
dimensional structure that captures the relationships among these affective states. Most
frequently, the two dimensions of pleasure and activation are utilized to visualize the structure of
emotion (Larsen & Diener, 1992; Liu & Perrewé, 2005; Russell, 1989). The pleasure dimension
(also sometimes referred to as valence, hedonic tone, or evaluation) varies from feelings of high
displeasure to high pleasure. The second dimension, activation (sometimes referred to as
arousal), reflects the intensity and energy level associated with emotion and varies along a
continuum from low activation (e.g., quietness) to high activation (e.g., excitement). Activation
serves to magnify the underlying affective experience of pleasure and provide the motivation for
action (Carver & Scheier, 1981; Kluger, Lewinsohn, & Aiello, 1994). As such, affective states
are sometimes characterized by a high degree of activation, such as elation and anger, and at
other times characterized by low activation, as in serenity and sadness (Weiss, 2002a).

7
A circle, called the affect circumplex, can geometrically represent the structure of affect.
Using the circumplex model, the location of any emotion can be determined using the two
dimensions of pleasure and activation (Russell, 1980; Weiss, 2002a). An alternative dimensional
conceptualization is the 45° rotated circumplex model (see Watson & Tellegen, 1985, fig. 1).
The rotated model was proposed after factor analytic research (Bradburn & Noll, 1969)
suggested that positive affective (PA) states and negative affective (NA) states appeared to be
two separate dimensions (Weiss, 2002a). This proposition gave rise to the development of the
PANAS scale (Watson, Clark, & Tellegen, 1988; Watson & Tellegen, 1985). While the PANAS
is frequently utilized, others have pointed out that the PA and NA scales of the PANAS only
assess the high-activation poles of the theoretically bipolar PA and NA dimensions, and as a
result, only cover only one half of the PA–NA space (Ekkekakis, Hall, & Petruzzello, 2005;
Larsen & Diener, 1992; Mossholder, Kemery, Harris, Armenakis, & Mcgrath, 1994).
The choice in whether to utilize the unrotated circumplex or the rotated PANAS models
should be based on external criteria. The overall evaluative structure based on bipolar pleasure
appears to be an ever-present component of attitude and meaning, supporting use of the
unrotated circumplex model (Weiss, 2002a). Weiss, Nicholas, and Daus (1999) found that
pleasure, but not activation, predicted job satisfaction, suggesting the utility of keeping these
dimensions separate. Overall, research appears to indicate that when appropriate measures are
created and latent variables are examined, pleasure and activation seem to be the most useful for
describing momentary affect (Weiss, 2002a) and will be used in this dissertation.
Cognitive Appraisal Theory
There are multiple theoretical traditions on emotion in psychology: evolutionary,
physiological, social constructivist, and cognitive, each having its own set of assumptions about

8
how to define, construct theories about, and conduct research on emotion. Cornelius (1996)
notes that the evolutionary tradition focuses on the function of emotions in the context of
evolution by natural selection, with much research focused on exploring the display and adaptive
functions of emotions. In contrast, the physiological tradition consists of multiple theories
proposing that bodily changes prompt the experience of emotion. Alternatively, the social
constructivist tradition perceives emotions as a cultural construction that serves particular social
and individual ends, and presumes that all individually experienced emotions are socially shaped
(Kusstatscher & Cooper, 2005).
Lastly, the cognitive tradition calls attention to the role of thought in the generation of
emotion and focuses on how appraisal of events in the environment leads to the experience of
emotions (Cornelius, 1996). The core of the cognitive approach is recognition that in order to
understand emotions, it is necessary to understand how individuals make judgments about events
in their environment, because emotions are generated by judgments about the world. The
cognitive tradition is recognized as the current dominant perspective as much of the research in
social psychology and other areas of psychology is either explicitly cognitive in nature or
implicitly accounts for the appraisal process (Bagozzi, Gopinath, & Nyer, 1999; Cornelius,
1996). Cognition is widely recognized in current research as an important if not critical aspect of
emotions.
Cognitive appraisal theories assert emotions are elicited and differentiated by an
individual’s subjective evaluation of important events or situations (Scherer, et al., 2001). Most
appraisal theories agree that events are evaluated in relation to a person’s goals, needs or
concerns (Roseman, 2001). Appraising an event as consistent with one’s goals will generate a
positive emotion, while appraising an event to be undermining one’s goals will generate a

9
negative emotion (Roseman & Smith, 2001). Appraisal theory is seen as having two core theses
(Frijda & Zeelenberg, 2001). The first is that appraisal is responsible for emotions; without
appraisal there is no emotion. The second is that appraisal is responsible for the differentiation
of emotions; different appraisals cause different emotions, and different emotions are caused by
different appraisals. Because the perceptual system is designed to notice change (e.g., Ornstein,
1991), organizational changes are events that trigger a process of appraisal and subsequent
emotion (Roseman, 2001).
In the modern cognitive tradition, Lazarus (2001) asserted that emotions are in a
continuous state of flux, in that cognitions shaping emotional reactions are affected by the
interaction between emotion eliciting conditions and coping processes (Schorr, 2001). There are
two major types of appraisal in Lazarus’ cognitive-meditational theory: primary appraisal,
which evaluates the significance or meaning of the event to the individual and, secondary
appraisal, which evaluates the ability of the individual to cope with the consequences of the
event (Lazarus, 1968, 2001; Lazarus, Averill, & Opton, 1970).
In primary appraisal, an individual assesses if they have anything at stake by asking, “Are
any of my goals involved here, or any of my core beliefs and values?” (Lazarus, 2001, p. 42). If
the answer to this primary appraisal is “no,” additional consideration is not warranted. However,
if an individual appraises a situation as personally goal incongruent; they will experience a
negative emotion. In contrast, if the situation is evaluated as goal congruent, the emotion
experienced will be positive. Roseman and Smith (2001) point out this assumption is found in
all theories claiming that emotions are generated by appraisals of event relevance to a person’s
motives, goals, or concerns (see e.g., Frijda, 1986; Ortony, Clore, & Collins, 1988; Roseman,
1979; Scherer, 1993; Smith & Ellsworth, 1987; Weiner, 1985).

10
If an individual decides that the situation is relevant to them, the individual conducts a
secondary appraisal which assesses locus of causality, coping potential and future expectancies
(Lazarus, 1991b; Liu & Perrewé, 2005). Particular combinations of assessments, in turn, are
associated with the different emotions one experiences in response to an event (Roseman, 2001).
The full range of emotions, including fear, anger, joy, sadness, and relief are associated with
different assessments of the situation, its causes, and implications for the individual.
Five Key Change Appraisals and Pleasure and Activation
Armenakis and Harris, and their colleagues (Armenakis, et al., 1999; Armenakis, Harris,
& Mossholder, 1993), developed a model of change that articulates the role of five key beliefs in
facilitating change readiness, adoption, commitment, and institutionalization. The five beliefs
are discrepancy, appropriateness, efficacy, principal support, and valence. Discrepancy refers to
the belief that a change from the current state is necessary. Appropriateness is the belief that the
specific change proposed will effectively address perceived problems with the current state.
Efficacy refers to the belief that the change recipient and the organization are capable of
successfully implementing the proposed change. Principal support concerns an individual’s
belief that top executives and managers support the change and are committed to taking actions
which will ensure its success. Lastly, valence refers to an individual’s belief that the change
offers desirable intrinsic and extrinsic personal outcomes. A review of historic and
contemporary change related publications conducted by Armenakis, Bernerth, Pitts, and Walker
(2007) provide evidence that each of the five change beliefs are recognized by practitioners and
researchers as useful in planning and evaluating organization change efforts.
Armenakis and Harris (2009) provide a recent review of research and writing about their
model. Currently, much of this research has focused on the validity of the model and case

11
examples. The preliminary empirical research generally supports the utility of the model. In
investigations relating to discrepancy and appropriateness (Armenakis, Bedeian, & Niebuhr,
1979; Cole, Harris, & Bernerth, 2006; Oswald, Mossholder, & Harris, 1994, 1997) results
revealed the positive impact of these two change beliefs on change recipient attitudes including
job satisfaction and organizational commitment. Strategic vision considered appropriate by
managers prompted higher levels of job involvement, affective reactions, and perceived
competitive strengths. Varma and Harris (2008) found beliefs of principal support and valence
regarding a merger to be correlated with identification with the post-merger organization. Cole,
Harris and Bernerth (2006) found assessment of the appropriateness of a major change was
associated with greater organizational commitment and lower levels of role ambiguity.
Obviously, the change beliefs that Armenakis, Harris, and Feild (1999) identify are
emotionally relevant appraisals. Appraisals shape the positivity or negativity of hedonic tone
experienced by change recipients. In fact, the boundary between motive-consistency (goal
congruence) and motive-inconsistency (goal incongruence) serves as a dividing line that
determines whether a positive emotion versus a negative emotion will be experienced (Roseman,
2001). Because discrepancy, valence, appropriateness, efficacy and principal support all reflect
on the favorableness of the change and its outcomes, they clearly reflect motive-relevant
appraisals key to primary appraisal.
In their research, Harris and Gresch’s (2010) examination of three of Armenakis et al.’s
(1999) change beliefs also recognized substantial overlap with the secondary appraisal criteria
outlined by Liu and Perrewé (2005) originally set forth in Lazarus’ (1968) appraisal theory.
Specifically, the appraisal of goal congruence refers to an assessment of whether or not an
individual’s goals are congruent with the goals of the planned change. One’s goals can include
12
both individual personal and professional goals as well as those goals held for the organization.
The appraisal factor of valence corresponds closely to the emotional-cognitive model’s concept
of individual goals, while the belief of appropriateness aligns with organizational goals.
Perceived potential success refers to the degree of confidence that one has for the future
success of the proposed change. Efficacy appears to mirror this appraisal criterion. The belief of
efficacy assesses the degree to which an individual perceives sufficient personal and
organizational capabilities exist to successfully implement the change.
Extending the arguments of Harris and Gresch (2010), discrepancy is also consistent with
Liu and Perrewé’s secondary appraisal criteria. In Liu and Perrewé’s appraisal criteria,
involvement with current strategy refers to the investment in and faith in the existing strategy.
The appraisal factor of discrepancy can be understood as the opposite of involvement with
current strategy as discrepancy assesses the belief that a change from the status quo is necessary.
While the change belief of principal support does not directly correspond with the
secondary appraisals outline by Liu and Perrewé, other appraisal theorists readily call attention to
the influence of social appraisal, a process in which individuals appraise the reactions of others
to an event, which, in turn influence one’s own appraisal of the change (see Manstead & Fischer,
2001). In sum, given their consistency with both primary and secondary appraisals, I
hypothesize the following:
Hypothesis 1: The five change beliefs—discrepancy, appropriateness, valence, efficacy,
and principal support --will each positively relate to the emotional dimension of felt
pleasure toward a change.
In addition to influencing pleasure, the five change beliefs are also expected to influence
the emotional dimension of activation as well. Appraisal theory posits that emotional activation

13
varies in direct proportion to the degree to which the change affects one’s goals (Lazarus, 1991a;
Liu & Perrewé, 2005). As such, highly negative or positive change beliefs are expected to
correspond with high levels of activation, while neutral evaluations for each of the change beliefs
are expected to correspond with lower levels of activation. The variation in levels of activation
corresponding with negative, neutral, and positive appraisals of the five change beliefs suggests a
“U” shaped relationship. The inflection point of the “U” occurs when an individual assesses the
change’s impact on one’s goals to be neutral (neither positive, nor negative), evoking the lowest
levels of activation.
Prior research by Harris and Gresch (2008) examined the relationships between three
beliefs concerning a merger (valence, appropriateness and efficacy) and emotional activation felt
toward the merger. They found that valence and appropriateness beliefs concerning the merger
had a “U” shaped curvilinear relationship with activation felt toward the organizational change.
That is, highly negative valence and appropriateness beliefs corresponded with higher levels of
activation, while neutral appropriateness and valence beliefs corresponded with decreased
activation. Likewise, as valence and appropriateness beliefs reached highly positive levels,
higher levels of activation resulted.
In the current study, in addition to assessing the relationships that valence,
appropriateness, and efficacy have with activation, I also assess relationships that discrepancy
and principal support have with activation. In the context of performance feedback (i.e.,
midterm grades), Kluger, Lewinsohn, and Aiello (1994) found such a U-shaped relationship with
the activation dimension of emotion but not with pleasure. Building off Carver and Scheier’s
(1981) Control Theory, Kluger et. al (1994) suggest that extreme deviations (good or bad)
generate the activation needed to fuel motivated action to respond. In the context of our change
14
beliefs, extremely negative change beliefs should generate the activation fueling active resistance
efforts, while positive beliefs should generate activation for supportive behaviors. If a change is
evaluated to be either highly obstructive (negative evaluation) or highly facilitative (positive
evaluation) with regards to an individual’s goals, high activation levels are expected to result. A
highly negative valence belief (“this change is bad for me”) therefore is expected to correspond
with a high level of activation. A neutral valence belief (“this change doesn’t affect me”) is
expected to correspond with decreased activation. However, as valence beliefs reach high levels
(“this change is great for me”), the outcomes associated with the change become very attractive,
resulting in a heightened level of activation. Because appropriateness reflects valence for the
organization (“the change is good for the organization”), highly negative and highly positive
appropriateness beliefs are expected to correspond with higher levels of activation as well.
Similarly, because discrepancy represents the perceived need for a change, highly negative and
highly positive discrepancy beliefs are expected to correspond with higher levels of activation
related to a change.
Efficacy is also expected to have a similar curvilinear relationship with activation, as
individuals who evaluate themselves as unable to cope with the demands of a given change
(negative efficacy appraisal) will tend to fixate on personal deficiencies, magnifying the severity
and difficulty of the task/change at hand. Such self-doubt and worry elevate activation (Bandura,
1982; Beck, 1976; Bernerth, 2004; Meichenbaum, 1977). In contrast, high-self efficacy beliefs
regarding the change (positive efficacy appraisal) will divert attention to the demands of the
situation and incite greater effort to succeed (Bernerth, 2004), resulting in an elevated level of
activation as well.

15
Likewise, a similar curvilinear relationship between principal support and activation is
anticipated. Principal support refers to whether relevant others (one’s peers, one’s supervisor,
and top management) like and support a change being implemented. In this way, principal
support represents one’s evaluation of others’ beliefs and emotional reactions to the change. An
appraisal of high principal support recognizes others have a strong liking and support for the
change, and is associated high levels of emotional activation by others. An appraisal of neutral
principal support recognizes others do not have a strong opinion about the change, and should be
associated with low levels of activation felt by others. An appraisal of low principal support
recognizes others strongly dislike and oppose to the change and should be associated with high
levels of activation.
Hypothesis 2: The five change beliefs—discrepancy, appropriateness, valence, efficacy,
and principal support --will each have a U-shaped relationship with activation such that
negative and positive beliefs will correspond to higher activation.
Change Beliefs and Discrete Emotions
To gain a deeper understanding of emotion, it is important to not only study broad
emotional dimensions, but also increase our understanding of discrete (specific) emotions. The
study of discrete emotions is valuable because predictive utility is lost when reducing discrete
states to dimensions (Weiss, 2002a). For example, although anger and guilt are near to each
other on the circumplex model, they have very different subjective meaning and behavioral
implications (Weiss, Suckow, & Cropanzano, 1999). While both are negative emotions, anger
has shown to relate to aggression (Baron & Richardson, 1994), while guilt has not. Likewise,
guilt can induce feelings of helplessness (Freedman, Wallington, & Bless, 1967; Wallington,
1973) in a way anger does not.
16
According to the cognitive tradition, discrete emotions differ from one another as a result
of different cognitive appraisals. Appraisal refers to the process of judging the personal
significance of an event as supporting or impeding progress towards one’s goals (Cornelius,
1996). In an effort to differentiate appraisals, Roseman (1984, 1996, 2001) developed and
refined a hypothesized structure of the emotion system. Dimensions in this hypothesized
structure include appraisals of (1) unexpectedness (unexpected/not unexpected); (2) situational
state (motive-consistent/motive-inconsistent); (3) motivational state (aversive/appetitive); (4)
probability (uncertain/certain); (5) control potential (low/high); (6) problem type
(instrumental/intrinsic); and (7) agency (circumstances/other person/self caused).
Unexpectedness relates to whether the event was anticipated or not. Situational state
refers to appraising an event as to whether it is advancing (motive-consistent) or undermining
(motive-inconsistent) one’s goals. Motivational state refers to whether an individual's motive in
a given situation is aversive (a punishment that he or she seeks to avoid) or appetitive (a reward
that he or she seeks to attain). Probability refers to the probability an event will occur. An event
that is highly probable (or has already occurred) is appraised as certain; while less probable
events are appraised as uncertain. Control potential refers to the appraisal of the degree of
control one has over a situation. In a high-control appraisal, an individual believes they can do
something about a motive-inconsistent event, while a low-control appraisal is associated with the
belief that there is nothing one can do to change a motive-inconsistent event. In appraisals of
problem type, instrumental appraisal is attributed when one views a motive-inconsistent event as
unwanted because it blocks attainment of a goal, while intrinsic appraisal is attributed when one
views a motive inconsistent event as unwanted because of some inherent characteristic. Agency
appraises who or what is responsible for the event occurring, with possible responsibility falling

17
either on circumstances, another person, or oneself (Roseman, 1996). As an example of
appraisals associated with a specific emotion, anger would result from appraisals of an event as
not unexpected, certain, motive-inconsistent, other-caused, appetitive in nature (the individual is
desires to obtain a reward, rather than avoid a punishment) and having high control (the
individual believes they can take action regarding the motive-inconsistent event).
Roseman and Evdokas (2004) found support for the relationship between appraisals of
motivational state and certainty with the experience of joy, relief, and hope. Similarly, Siemer,
Mauss, and Gross (2007) found support for the model, with anger being associated with
responsibility to another person, sadness associated with a lack of control and considering
oneself responsible, and shame and guilt were associated with a lack of control.
In addition to having relationships with the emotional dimensions of pleasure and
activation, each of the change cognitions is anticipated to have a relationship with particular
discrete emotions as well. Although organizational change can result in any number emotional
reactions, Kiefer (2002) acknowledges that the traditional literature focuses primarily on
negative emotions and their adverse impact during change. Positive emotions, on the other hand
are rarely discussed. While many studies have included affective aspects of organizational
change, most of this research has discussed affective components and emotional processes
indirectly, such as the affect-laden constructs of unfairness, resistance, and job insecurity (Kiefer,
2005). For example, although research has shown feelings of unfairness are associated with
emotions such as anger and frustration (Conlon & Shapiro, 2002; Weiss, Suckow, et al., 1999),
they are not emotions in and of themselves. Only a few studies examined emotion directly in
change, and they have been primarily qualitative in nature (Kiefer, 2005). The limited
quantitative research on emotions during organizational change has often explored positive and

18
negative emotional dimensions (i.e. Avey, Wernsing, & Luthans, 2008; Kiefer, 2005); while
neglecting discrete emotions such as fear, anger, and joy (see Kiefer, 2002). The current study
seeks to explore relationships between the change beliefs and a full range of discrete emotions,
both negative emotions of anger, sadness, fear, worry, as well as positive emotions, including
joy, excitement, and hope/optimism.
In considering how the five change beliefs might relate to specific emotions felt toward a
change, the framework proposed by Roseman (1996) describing how appraisal dimensions relate
to specific emotions provides a useful reference. In Roseman’s framework, a key appraisal
dimension is that of situational state. The situational state dimension includes motive-consistent
appraisals and motive-inconsistent appraisal analogous to primary appraisal relating to goals
described by Lazarus (2001). A motive-consistent appraisal occurs when an event is believed to
be consistent with one’s goals, while a motive-inconsistent appraisal occurs when an event is
perceived to undermine one’s goals.
Motive-consistent appraisals are associated with positive discrete emotions, while
motive-inconsistent appraisals are associated with negative discrete emotions (Roseman, 1996).
This classification is consistent with the circumplex model, in which emotions fall along the
dimension of pleasure, which varies from low pleasure to high pleasure. Low pleasure or
negative emotions include anger, fear, worry, and sadness. High pleasure or positive, emotions
include joy, hope/optimism, and excitement. An emotion that is neutral regarding the dimension
of pleasure, but characterized by activation and a sense of unexpectedness is that of surprise.
Recognizing that discrete emotions fall along the continuum of the dimension of
pleasure, I anticipate the change beliefs will be positively associated with motive-consistent
discrete emotions characterized by high pleasure, and negatively associated with motive-

19
inconsistent discrete emotions characterized by low pleasure. Although all change beliefs
represent assessments of the change, the beliefs of valence and efficacy assess the direct impact
of the change on an individual and one’s ability to adapt. These beliefs relating to oneself are
anticipated to more strongly influence resulting emotions relative to beliefs not directly
impacting oneself (discrepancy, appropriateness, and principal support). As such, while all
change beliefs are anticipated to have relationships with discrete emotions, the change beliefs
most directly related to one’s self (valence and efficacy) are anticipated to be more strongly
related to discrete emotions than the other beliefs.
Hypotheses 3a-c: The five change beliefs - discrepancy, appropriateness, valence,
efficacy, and principal support will be positively associated with the motive-consistent
emotions of a) optimism/hope, b) joy and c) excitement.
Hypotheses 3d-g: Valence and efficacy will have stronger relationships with d) pleasure,
e) optimism/hope, f) joy, and g) excitement than the other change beliefs.
Hypotheses 4a-d: The five change beliefs - discrepancy, appropriateness, valence,
efficacy, and principal support - will be negatively associated with the motive-
inconsistent emotions of a) sadness, b) anger, c) fear, and d) worry.
Hypotheses 4e-h: Valence and efficacy will have stronger relationships with e) anger, f)
sadness, g) fear, and h) worry than the other change beliefs.
Emotions and Change Support
While frameworks such as Roseman’s identify particular appraisals that lead to specific
emotions, other valuable insights can be gained by increasing our understanding of the process
that leads to the experience and display emotions. To this end, Elfenbein (2007) proposed the
Integrated Intrapersonal Process Framework for Emotion in Organizations. The framework

20
provides an integrative view of the individual emotional process and recognizes that part of this
process is automatic (e.g., emotional experience) while part is controlled (e.g., emotional display
regulation). Stimuli initiate the process by eliciting sensemaking efforts (emotional registration)
which, in turn, drive emotional experience. Emotional experience, in turn, is proposed to be a
major influence on emotional expression and postemotional attitudinal and behavioral responses.
Similar to Elfenbein’s framework, Liu and Perrewé (2005) presented a cognitive-
emotional model of individual reactions to planned organizational change. Liu and Perrewé’s
model differs in that is focused specifically on change as the organizational stimuli. Liu and
Perrewé suggest that the appraisal of change leads to emotional reactions which, in turn generate
coping behaviors related to the change. In the context of change, Liu and Perrewé’s (2005)
coping behaviors and Elfenbein’s (2007) expressions and responses have important implications
for change support and implementation.
One of the main reasons organizational change fails is due to employee resistance to
change (Jones, et al., 2008). Resistance to change may take several forms, including withholding
participation, attempts to postpone implementation, and efforts to convince decision makers that
the proposed change is not appropriate for the situation (Armenakis & Bedeian, 1999; Jaffe,
Scott, & Tobe, 1994).
The emotions that change recipients experience as a result of an organizational change
have important implications as to whether individuals will support or undermine the change.
Some studies on resistance to change have indicated that negative emotions are correlated with
unwillingness to support a change and a reason for change failure (Judson, 1991; Kiefer, 2005;
Nippa, 1996). These findings are consistent with emotion-centered theoretical explorations of
the change process, which suggest that the inability to manage the type and strength of emotions

21
resulting from organizational change can be an important reason for change program failure (Liu
& Perrewé, 2005; Paterson & Hartel, 2002). To this end, research suggests that an important part
of the change process includes helping organization members process and label the emotional
turmoil of a transformation process as positive rather than negative in tone (Mossholder, et al.,
2000).
Although change is generally implemented for the benefit of the organization and its
employees, such as changes made to adapt to changing environmental conditions, employees
often respond negatively toward change and resist it (Jones, et al., 2008). Negative reactions
often occur because change brings increased pressure, stress, and uncertainty for employees
(Armenakis & Bedeian, 1999; Jones, et al., 2008; McHugh, 1997). Because second order change
requires individuals to act in new ways and adopt new values, such change is often perceived as
potentially harmful or threatening. Therefore, it is of little surprise that large change initiatives
are met with a great deal of resistance by recipients of the change.
As part of the process of experiencing emotion, ultimately, felt emotions may directly
influence one’s behavior or indirectly influence one’s behavior through attitudes (Elfenbein,
2007; Liu & Perrewé, 2005). As such, a high level of pleasure felt toward a change would likely
be associated with behaviors that support the change. Likewise, a high level of displeasure felt
toward the change would likely be associated with behaviors that undermine the change, such as
non-compliant behaviors (Judson, 1991; Kiefer, 2005; Nippa, 1996).
Hypothesis 5: Felt pleasure will be positively related to the adoption of change-related
behavior, as (a) self-assessed by change recipients and (b) assessed by their supervisor.
Activation represents the energy level associated with felt emotion (Weiss, 2002b), and

22
provides the motivation for action (Carver & Scheier, 1981; Kluger, et al., 1994). Because
individuals experiencing higher energy levels are more likely to act on their emotions, it is
anticipated that high activation levels will strengthen the relationship between pleasure and
change adoption behavior, acting a moderator.
Hypothesis 6: Activation will moderate the relationship between pleasure and change
adoption behavior. Higher levels of activation are anticipated to strengthen the
relationship between pleasure and (a) self-rated and (b) supervisor-rated change
adoption behavior.
Change Message Strategies and Change Beliefs
The five–belief change framework recognizes a number of influence strategies that
change agents may utilize to shape the change beliefs held by change recipients (Armenakis, et
al., 1999). The actions taken to execute the influence strategies have both real and symbolic
consequences in communicating and reinforcing the five change beliefs.
Persuasive communication. The persuasive communication strategy involves the
efficient communication of information relevant to all five core change recipient beliefs
(Armenakis, et al., 1999). For example, in support of the relationship between the change
strategy of persuasive communication and the change beliefs of discrepancy appropriateness, and
principal support, Schweiger and Denisi (1991) found that in the context of a merger, the
presence of a comprehensive organizational communication plan resulted in significantly lower
perceived uncertainty and significantly higher job satisfaction, commitment, and perceptions of
the company's trustworthiness, honesty, and caring. Persuasive communication may take many
forms including oral and written. Oral communication includes formal communication, such as
speeches, and informal communication, such as face-to-face discussions. Oral communications

23
may take place live or through recorded message (i.e., podcasts, streaming video, DVDs, etc.).
Written message forms include memos, email, formal reports, letters, and newsletters. All forms
of communication can be used to address any one of the change recipient beliefs by relaying why
a change is necessary, why the proposed change is appropriate, providing reassurance that the
individual and organization are both capable of executing the change, reiterating the personal
benefits individuals will realize as part of the change, and communicating how top management,
supervisors, and peers support the change.
Hypothesis 7: Persuasive communication will be positively related to the five change
beliefs of discrepancy, appropriateness, valence, efficacy, and principal support.
Human resource practices. Human resource (HR) practices are yet another strategy
that can be used to influence change recipient beliefs. While HR practices include selection,
performance appraisal, compensation and training and development, of particular interest to this
study is the human resource function of training and development. Training and development is
a human resource management practice that has been shown to contribute to the
institutionalization of new behavior (Parsons, Liden, O'Connor, & Nagao, 1991). Training and
development, when integrated into an organization change, can strengthen all five change beliefs
of organizational members (Armenakis, et al., 1999). In this study, I focus on two forms of
training: enactive mastery and traditional lecture training practices.
Enactive mastery. Enactive mastery is an active participation tactic originally recognized
by Bandura (1977, 1997) as a principle source of information relating to self-efficacy. Active
participation influence strategies are utilized to deliver and support the change by enhancing the
relationship between change agent(s) and recipients, increasing the credibility of the change
agent, and instill a sense of ownership in and reinforce commitment to the organizational change

24
(Armenakis, et al., 1999; Nutt, 1986). The effectiveness of active participation stems from the
concept of self-discovery, in which personal experiences result in learning. Enactive mastery
refers to personal engagement in an activity which results in the building of skills related to the
activity and serves as an indicator of capability (Bandura, 1997). Bandura (1997) acknowledges
that enactive mastery experiences are the most influential source of efficacy information because
they provide the most personally valid substantiation that one is becoming sufficiently capable to
succeed at the task in question. Strategies for successfully applying enactive mastery include
engaging in simpler tasks until they are successfully mastered before moving on to more
challenging tasks, akin to the idea of ensuring in small wins (Armenakis & Bedeian, 1999;
Weick, 1984). Linking enactive mastery to self-efficacy, Tompson and Dass (2000) found
hands-on computer simulations resulted in greater student self-efficacy relating to business
strategy case studies. Through regular practice and exposure, enactive mastery can also serve as
a source of demonstrating the appropriateness of a change (Armenakis, et al., 1999). Enactive
mastery is often associated with “hands-on” training, in which training participants physically
engage in the activity they are attempting to master (Palmer, 2006). The intent of enactive
mastery activities is to increase efficacy; additionally, management is recognized as
demonstrating commitment to a change by providing necessary resources to training relating to
the change. As such employee assessments of enactive mastery are expected to be most strongly
linked to efficacy and principal support.
Hypothesis 8: Enactive mastery will be positively related to efficacy and principal
support beliefs.
Lecture-based training. Training practices, if linked to the organization change, can
reinforce all message components (Armenakis, et al., 1999). Training can demonstrate the

25
superiority of the change over the previous method, influencing discrepancy and appropriateness
beliefs. Traditional lecture-based lecture training practices can also increase the trainee’s
efficacy beliefs in performing tasks related to the change, because the knowledge, skills, and
abilities in training will be related to the new tasks. The expenditure of funds and other
resources to include conducting lecture-based employee training on company time should
increase beliefs regarding organizational support from management. Furthermore, change
recipient beliefs regarding valence and influence by linking tangible and intangible rewards to
successful performance on the job. Like enactive mastery, the intent of lecture-based training is
to increase efficacy; additionally, management is recognized as demonstrating commitment to a
change by providing necessary resources to lecture-based training relating to the change. As
such employee assessment of lecture-based training is to be most strongly linked to efficacy and
principal support.
Hypothesis 9: Lecture training will be positively related to efficacy and principal support
beliefs.
Vicarious learning. Vicarious learning utilizes experiences to enhance efficacy beliefs
in part through comparison of one’s own capabilities with the capabilities of others who model
the desired behavior (Bandura, 1997). In the context of an organizational change, vicarious
experiences occur when a change recipient observes others, most preferably respected
colleagues, in the performance of the new change-related behaviors. In observing like-others
successfully engage in a new task, an increase in self efficacy results when an individual believes
“If they can do it, so can I.” In support of the relationship between vicarious learning and
efficacy, research has found support for the use of modeling behavior and improved performance
for both performance and self-efficacy (Compeau & Higgins, 1995; Gist, 1988). In addition to

26
enhancing self efficacy, Armenakis, et al. (1999) propose that vicarious learning enables
individuals to observe any advantages to new methods, increasing beliefs regarding the change’s
appropriateness. Additionally, vicarious learning facilitates increased beliefs of principal
support, as individuals observe respected colleagues initiate and continue the adoption of the
organization. The intent of vicarious learning is to increase efficacy. However, in contrast to
enactive mastery and lecture training, vicarious learning experiences are less likely to be
associated with formal, change-related activities supported by management resources. As such,
it is anticipated that vicarious learning will be positively associated with efficacy.
Hypothesis 10: Vicarious learning will be positively related to efficacy beliefs.
Leader Influences on Change Beliefs
The significance of change agent credibility is recognized in the delivery of the change
message in Armenakis et al’s (1999; 1993) models of organizational change readiness and
institutionalization. Credibility is the single most important attribute that a change agent should
possess (Armenakis, et al., 1999) as a message will have greater influence is the change agent
delivering the message is seen as credible (Armenakis, et al., 1993; Gist, 1987). The
effectiveness of any change message strategies is contingent upon the change agent utilizing
them (Armenakis, et al., 1993). Slater and Rouner (1992) found changes in cognitions of
organizational members were empirically linked to the credibility of the change agent. While
individuals in all levels of leadership have a role in helping drive the change in organizations,
lower level supervisors who fulfill the role of local change agents have a very influential part to
play. Frontline supervisors are generally viewed as the preferred information source of
employees in large organizations (Larkin & Larkin, 1996). As such, the quality of the

27
relationship between a frontline supervisor and her subordinate can influence change recipient
receptiveness to the change message.
Leader-member exchange. Leader member exchange (LMX) theory is based upon social
exchange (Blau, 1964). LMX acknowledges that leaders develop unique dyadic relationships with
each of their subordinates. Leader-subordinate relationships that are positive and strong, involving
social exchanges that go beyond those mandated by the employment contract are called high-quality
LMX relationships. High-quality leader-subordinate relationships, are characterized by mutual trust,
liking, respect, and reciprocal influence (Campbell, 2000). Employees in high-quality exchanges are
likely to invest their energy, time, personal resources, and effort because they expect that they will be
rewarded (intrinsically or extrinsically), based upon the social exchange norm of reciprocity (Coyle-
Shapiro & Conway, 2005). In high-quality LMX relationships, followers receive support and
encouragement from their leader, are given more responsibility, and receive more challenging, or
developmental, assignments (Boies & Howell, 2006). Previous research has found high-quality
LMX relationships to be a valuable predictor of job effectiveness, extrarole behaviors, open and honest
communication, job satisfaction, and greater access to resources (Gerstner & Day, 1997).
Relationships that lack respect, liking, admiration, trust, and a sense of obligation are called low-
quality exchanges. In low LMX relationships, work is performed according to a formal set of
rules and the employment contract; information is communicated downward, and relationships
are characterized by distance between the leader and follower (Boies & Howell, 2006). These are
simple exchanges between the subordinate and leader that do not go beyond the requirements of the
employment contract. Low-quality exchange relationships have been linked to less access to
supervisors, restricted information, job dissatisfaction, lower organizational commitment, employee
turnover, and lower access to resources (Gerstner & Day, 1997).
28
Individuals seek predictability in their environment (Lind & van den Bos, 2002). In an
uncertain environment, such as that created by an organizational change, individuals look to the
social context to supply information they can use to successfully manage the uncertainty. In
relationships characterized by low-quality LMX, subordinates do not have as much access to
information, support, or resources from their supervisors as do employees with high-quality
LMX relationships (Liden, Sparrowe, & Wayne, 1997; Rosen, Harris, & Kacmar, 2010). As
such, employees benefiting from support and resources relating to the change provided by their
supervisor are more likely to develop more favorable beliefs regarding the change than
employees who do not benefit from such support and resources.
Hypothesis 11: LMX is anticipated to be positively related to the five change beliefs of
discrepancy, appropriateness, valence, efficacy and principal support.
Supervisor change beliefs. The influence of the beliefs held by others on one’s own
beliefs has been recognized in several models relating to influence and belief internalization,
including the social information processing model (Rice & Aydin, 1991; Salancik & Pfeffer,
1978) and the extended Technology Acceptance Model (TAM2) (Venkatesh & Davis, 2000).
The social information processing model was developed to explain an individual’s reactions to
workplace phenomena and applies theories of social influence to the organizational setting (Rice
& Aydin, 1991; Salancik & Pfeffer, 1978). This model recognizes that an individual’s
perceptions are likely to be influenced by the opinions, information, and behaviors of salient
others. As such, an individual may be influenced by sources on the basis of affiliation,
resources, or authority, or by individuals who are mediators to sources of information about the
phenomenon (Moscovici, 1976). This influence may be in the form of cues from others
29
regarding what information should be attended to and how to value the relevant dimensions of
workplace phenomena (Salancik & Pfeffer, 1978).
Similarly, the TAM2 (Venkatesh & Davis, 2000) acknowledges the concept of social
influence internalization. Internalization (Kelman, 1958; Warshaw, 1980) refers to a process by
which, when one perceives that an important referent subscribes to a certain belief, one
incorporates the referent’s belief into one’s own belief structure. Deutsch and Gerard (1955)
referred to the concept as informational social influence, which is the influence to accept
information provided by a referent as evidence of reality. In the present context, if a supervisor
makes known his or her beliefs regarding a change, a subordinate may come to take on those
same beliefs. As such, I believe that the five change beliefs held by a supervisor will relate
positively to their subordinate’s beliefs regarding the change. In support of this model,
Venkatesh and Davis (2000) found internalization was significantly positively related to
perceived usefulness of new technology.
Hypothesis 12: Supervisor beliefs of discrepancy, appropriateness, valence, efficacy,
and principal support will relate positively to the corresponding subordinate beliefs.
While items in discrepancy, appropriateness, and principal support assess the impact of
the change as it relates to the organization as a whole, valence and efficacy more directly assess
the personal impact of the change. These differences are anticipated to affect the relative the
strength between particular supervisor and subordinate beliefs. While supervisors’ opinions
regarding the overall impact of the change on the organization may be fairly readily accepted by
subordinates, the personal impact of change is felt much more personally and powerfully. As
such, supervisor beliefs are expected to influence subordinate beliefs of valence and efficacy to a
lesser degree than other beliefs.

30
Hypothesis 13: Supervisor beliefs of discrepancy, appropriateness, and principal
support will relate more strongly to subordinate beliefs than supervisor beliefs of valence
and efficacy.

31
Chapter 2: Method
Organizational Context
The study was conducted at a small public university in the Southeastern United States.
As part of a state-mandated cost-savings effort, every college and university in the state’s
university system was required to replace their paper-based timesheet reporting system for
hourly employees with a common electronic timesheet reporting system (eTime). Part of
eTime’s adoption required each non-salaried employee to utilize a computer and web-based
software to report and approve time worked for each two-week pay period. Prior to the adoption
of the electronic timesheet reporting system, a paper timesheet reporting system was used by the
university for reporting and approving time worked.
Prior to the change, a hourly employee would complete a paper timesheet form by hand
by writing their start and end time for each day they worked in a two week period and calculating
hours worked each day. At the end of the two week period, the employee would complete the
paper timesheet by filling in the total sum of the hours worked in the appropriate box in the form
and signing their name as approval. As a result of the change, employees were required to log
into a computer in their work area with a username and password in order to input their time
using the web-based system. At the end of the two week period, employees were required to
utilize the system to confirm the time they input was correct and submit it for approval by their
supervisor.
The adoption of a web-based software reporting system by hourly employees posed a
challenge because many hourly employees had no or minimal experience with computers prior to
the introduction of the change. Prior to the introduction of the change almost half (46.5 percent)
of survey respondents indicated they used a computer once a week or less, with nearly a quarter
32
(24.1 percent) of respondents indicating they had never used a computer. This change also
represented a shift in responsibility. In the old paper form-based timesheet system, it was
possible for supervisors to prepare the paper timesheet for a given employee such that their
subordinate only needed to sign her name to the form. After the change, this was not possible, as
only employees could input their own time. As such, employees possessed sole responsibility
for reporting hours worked, accounting for time not worked (including sick leave, holidays, and
vacation days), and correcting any errors relating to mistakes in times entered.
The transition to the new system for hourly employees took place over a three month
period. The transition for these employees roughly coincided with the start of the academic year,
with the electronic system “going live” and elimination of paper timesheet forms occurring
simultaneously. In preparation for the change, starting two months prior to going live, all
employees were required to attend at least one lecture-based training session. In addition many
employees attended optional additional “hands-on” training sessions. The “hands-on” training
sessions including practicing logging into the system, entering hours worked, and approving time
sheets. In the two pay periods in the month that followed the “go live” date, support was
provided to hourly employees in the form of a temporary computer lab help center staffed by
administrators trained to assist employees log in and input and approve their time. On the dates
that timesheet approvals were due, supervisors escorted all their hourly subordinates to the help
center during the employees’ shift. At the help center, employees entered their time using with
eTime system and were able to obtain help from the trained staff.
Sample and Data Collection
Data was collected during a two week time period that occurred four months after the “go
live” date when the use of paper timesheets ended and use of electronic timesheets began. All

33
113 full time, non-supervisory hourly employees working in the departments of campus safety,
housing, outreach, building maintenance, grounds, and cleaning services were invited to
complete the survey. In addition, their 13 immediate supervisors were also asked to participate.
The number of non-supervisory employees assigned to each supervisor ranged from 1 to 35, with
an average of 8.70 non-supervisory employees per supervisor (SD = 10.01).
To enable matching of employee surveys with their supervisors, I assigned each
employee and supervisor a unique code number. In preparing employee surveys for
administration, each survey was numbered with an employee’s code before being placed into an
envelope with the corresponding employee’s name. After the surveys were distributed, each
employee removed their survey from its associated envelope, with the result that names and
codes were no longer associated. Envelopes were discarded by the employees and only the
coded surveys were returned, minimizing the risk of breach of confidentiality.
Because supervisor surveys included rating sheet for assessing subordinate change
behaviors, a separate code sheet was provided to each supervisor listing the names of each
subordinate and an associated code number. On the rating sheet, only subordinate codes were
listed. After completing the rating sheet using the code sheet to match employees and their
codes, supervisors were directed by survey instructions to destroy their code sheet.
Non-supervisory employees. A total population of 113 non-supervisory employees
were contacted to complete a paper-and-pencil survey regarding the change (the employee
survey is shown in Appendix A). Relating to survey participant recruitment, non-supervisory
employees were first notified of the opportunity to participate in the study through e-mails sent
by the Director of Human Resources. To encourage participation, employees completing the
survey were entered in a raffle for a gift card to a major general merchandise retailer.

34
Non-supervisory employee surveys were administered following a regular staff meeting
in each department. At the end of the meeting, Department heads asked supervisors to leave and
introduced me. I then explained the study, provided employees with an information and
informed consent letter, explained the coding done to preserve anonymity, explained the raffle,
and made clear their participation was voluntary. Individuals choosing not to complete the
survey were advised they were free to leave. I provided questionnaires to all individuals
choosing to stay and participate in the survey. I was in the room during the administration of the
survey and two separate, well-marked boxes with insert openings for participants to return
surveys and raffle forms were placed at the front of the room. Pre-addressed and stamped
mailing envelopes were provided to employees who preferred to complete the survey and raffle
form at home and mail it to the researcher. Envelopes were pre-addressed with a secure, off-site
address.
Supervisors. All 13 supervisors were contacted to complete a paper-and-pencil survey
regarding the change (the supervisor survey is shown in Appendix B). Supervisors were first
informed of the opportunity to participate in the study by an e-mail from the organization's
Director of Human Resources. Afterward, I followed up with a phone call explaining the study to
each supervisor and asking if he or she were willing to participate in the study. All supervisors
agreed to participate in the study and were sent packets including surveys and raffle forms
through campus mail.
The supervisor survey was slightly different from that of non-supervisory employees in
that supervisors were asked to assess each subordinate’s behavior relating to adoption of the
change. Surveys packet included a pre-stamped envelope so the supervisors could mail their

35
responses. Survey packets also included raffle entry forms for supervisors to complete and
return with completed survey. Envelopes were pre-addressed with a secure, off-site address.
Responses. Of the 13 supervisors and 113 non-supervisory employees invited to
participate in the study, useable responses were obtained from all (100%) supervisors and 90
(80%) non-supervisors. The number of subordinates returning surveys ranged from 1 to 24 per
supervisor, with an average of 7.50 returned surveys per supervisor (SD = 6.57). The mean
length of reported university employment was 6.2 years (SD = 7.2 years), with non-supervisory
employees reporting a mean tenure of 5.21 years (SD = 5.9 years) and supervisory employees
reporting a mean tenure of 11.5 years (SD =10.7).
Regarding formal training attendance among non-supervisory employees, 5.9% reported
attending no sessions, 42.6% attended 1 session, 36.8% attended 2 sessions, and 14.7% attended
more than 2 sessions. Among supervisory employees, 45.5% attended 2 sessions, and 54.5%
attended more than 2 sessions. Relating to frequency of computer use among non-supervisory
employees at work prior to the introduction of eTime, the following frequencies were reported:
never = 24.4%, one time a month or less = 8.1%, one time a week or less = 14.0%, several times
a week = 25.6%, and everyday = 27.9%. Among supervisors, the following frequencies were
reported: one time a week or less = 7.7%, several times a week = 7.7% and everyday = 84.6%.
Measures
Unless otherwise noted, each item was assessed with a 5 point Likert-response format
(1=strongly disagree; 2= disagree, 3=Neutral, 4=agree, 5=strongly agree).
Change beliefs. Change discrepancy, appropriateness, valence, efficacy, and principal
support beliefs were assessed by both supervisors and their employees with the Organizational
Change Recipient’s Belief Scale (OCRBS; Armenakis, et al., 2007). One or more of the five
36
portions of this scale were previously utilized in research conducted by Harris and Gresch
(2010), Varma and Harris (2008), and Cole, Harris and Bernerth (2006).
The scale items were modified to reflect the specific change context and improve
readability. Rephrasing the items to make them easier to read was determined to be appropriate
due to the relatively high comprehension level of the items and the relatively low reading level
proficiency among some respondents. Utilizing the Microsoft Word readability statistics of the
Flesch reading ease scale (0 to 100 scale) and the Flesch-Kincaid grade level scale
(corresponding to U.S. school grade levels), modifications to the phrasing and word choices were
made. For example, the item “I believe the proposed organizational change will have a favorable
effect on our operations” was changed to “I believe the change to eTime is good for this
university.” Higher Flesch reading ease scales scores and low Flesch-Kincaid grade level scores
indicate greater ease of comprehension. Prior to modification, the scale items scored 55.4 on the
Flesch reading ease scale and 8.0 on the Flesch-Kincaid grade level. After revising the items, the
modified OCRBS scale items scored 78.0 on the Flesch reading ease scale, and 5.3 on the
Flesch-Kincaid grade level. See appendix C for a complete comparison of revised items.
Discrepancy, the belief that the status quo is deficient and that some type of change is
necessary, was assessed with 4 items (α =.89). Sample items include, “A change was needed to
improve the way time was reported,” and “We needed to improve how we were reporting our
time.” Appropriateness, the belief that one perceives a change to be beneficial to the
organization as a whole, was assessed with six items (α =.94). “The change to eTime is correct
for (University name),” and “When I think about the change to eTime, I realize it is right for
(University name)” are examples of items included. Valence, the belief that a change is
associated with a positive personal impact, was assessed with five items (α =.92), two of which
37
were, “The change in how I enter my time makes me feel good about myself,” and “It is more
convenient for me to enter my time using eTime.” Efficacy, the belief in one’s ability to
successfully enact the change, was assessed with three items (α =.93). Sample items included, “I
can do a good job of entering my hours using eTime,” and “It is easy for me to enter my time
using eTime.” Finally, principal support, the belief that one’s peers, manager, and
organizational leaders support of the change, was assessed with six items (α =.90). “Most of my
co-workers want the change to eTime to work,” and “My direct supervisor is in favor of the
change to eTime,” and “The top leaders support the change to eTime,” are examples of items
included.
Felt pleasure and arousal. Supervisor and employee emotional reactions to the change
were evaluated using the “P” (pleasure) and “A” (arousal) portions of the PAD semantic
differential scale developed by Mehrabian and Russell (1974). Respondents were asked to think
about the mood the change put them in and then rate their feelings. Pleasure was measured
using 6 semantic pairs separated by 9 blank boxes. For each pair, respondents were asked to put
a check mark in the box closest to the adjective that best described their feelings. The six
semantic pairs for pleasure were: “happy/unhappy,” “pleased/displeased,” “satisfied/unsatisfied,”
“contented/discontented,” “hopeful/despairing,” and “relaxed/bored.” Likewise, arousal
(activation) was measured using another set of 5 six semantic word pairs separated by 7 blank
boxes: “relaxed/stimulated,” “calm/excited,” “sluggish/frenzied,” “dull/jittery,” and
“sleepy/wide-awake.” Answers were coded 1-9 with higher ratings associated with higher
pleasure and activation. Coefficient alpha for felt pleasure was .98. Coefficient alpha for
activation was .79.

38
Discrete emotions. Supervisor and employee discrete emotional reactions to the change
were evaluated using the Richins’ (1997) Consumption Emotions Set (CES). Respondents were
asked to think about the change, and then rate how the change made them feel. Each item was
assessed with a 5 cell Likert-response format (1 = Not at all; 2 = A little, 3 = Moderately, 4 =
Quite a bit, 5 = Extremely). Anger (α =.92) was assessed with the items “frustrated,” “angry,”
and “irritated.” Sadness (α =.93) was measured with items “depressed,” “sad,” and “miserable.”
Fear (α =.92) was measured with the items “scared,” “afraid,” and “panicky.” Worry (α =.93)
was measured with items “nervous,” “worried,” and “tense.” Optimism/hope (α =.74) was
measured with items “optimistic,” “encouraged,” and “hopeful.” Joy (α =.96) was measured
with items “happy,” “pleased,” and “joyful.” Excitement (α =.92) was measured with items
“excited,” “thrilled,” and “enthusiastic.”
Change message strategies. The change message strategies of persuasive
communication, enactive mastery, lecture training, and vicarious learning were assessed using
items developed from literature descriptions (cf. Armenakis & Harris, 2002; Armenakis, et al.,
1999; Armenakis, et al., 1993). Persuasive communication involves direct communication
efforts about the change (Armenakis & Harris, 2002) and was assessed with 4 items (α =.88).
Sample items included “The University did a good job explaining why entering time by
computer is a good thing,” and “I received a lot of information about the change to eTime.”
Enactive mastery, which involves the building of skills, knowledge and efficacy through practice
(Armenakis & Harris, 2002), was assessed with 3 items (α =.90). Sample enactive mastery items
included “It was helpful to go through the process of entering my time at the computer lab,” and
“I felt more certain I could enter my time correctly after the ‘hands on’ training.” Lecture
training was assessed with 5 items (α =.92); sample items included “The eTime training was

39
helpful,” and “After training, I understood what I needed to do to use eTime.” Vicarious
learning, (α =.95) which entails observing and learning from others (Armenakis & Harris, 2002),
was assessed with 3 items; sample items included “A co-worker helped me by showing me how
to enter my time on the computer,” and “I learned how to use eTime from a co-worker.”
Leader-member exchange. Leader-Member Exchange (LMX), which focuses on the
two-way relationship between supervisors and subordinates, was assessed by employees only
using the LMX 7 scale (Hofmann, Morgeson, & Gerras, 2003). As in the OCRBS, items were
revised slightly to improve the ease of reading. Prior to modification, the LMX scale items
scored 56.4 on the Flesch reading ease scale and 7.8 on the Flesch-Kincaid grade level. After
revising, the modified LMX scale items scored 60.6 on the Flesch reading ease scale, and 6.9 on
the Flesch-Kincaid grade level. Item revisions are shown in Appendix D. Coefficient alpha for
the resulting scale was .88.
Self-rated change adoption behavior. Non-supervisory employees rated their adoption
of change consistent behavior with three items: “I easily adapted to the eTime system of entering
my hours using by computer,” “I have made no mistakes when entering my time on eTime,” and
“I have been able to enter my hours on time with the new system.” Coefficient alpha for self-
rated change adoption behavior was .80.
Supervisor-rated change adoption behavior. Supervisors rated their agreement to
statements pertaining to the change adoption behavior displayed by each subordinate with five
items (α =.80). Sample items included “Consistently submits timesheets on time using eTime,”
and “Made the transition to eTime easily.”
Dispositional optimism. To control for its effect on change cognitions and emotion felt
toward the change, dispositional optimism (α =.83) was assessed using two items from the

40
measure developed by Scheier and Carver (1985). Controlling for dispositional optimism allows
for the influence of an individual’s generally positive or negative outlook to be controlled for
when assessing an individual’s evaluations. The items were “I always look on the bright side of
things” and “I’m always optimistic about my future”.
Analyses
In order to test the hypotheses, several analyses were conducted. First, a series of
dimension-level confirmatory factor analyses (CFAs) were conducted to verify the
distinctiveness of the five change beliefs. Confirmatory factor analysis was also used to verify
the four change message strategies were also distinct.
Multiple hierarchical regression analyses were utilized to assess a number of
hypothesized relationships including hypotheses 1, 3a-g, 4a-4h, with pleasure and individual
discrete emotions serving as criterion variables. In the first step of each of these analyses,
dispositional optimism was entered as a control. In the second step, all five change beliefs were
entered together.
Multiple hierarchical regression analyses were also used to test hypothesis 2, relating to
the criterion variable of activation. In the first step, dispositional optimism was entered as a
control. In the second step, all of the centered five change beliefs were entered. The terms
represented a centering around the mean of each change belief. Third, the squared centered
terms of all five change beliefs were entered together.
Multiple hierarchical regression analysis was also used to test hypotheses 5a-b and 6a-b
with self rated and supervisor-rated change adoption behavior serving as the criterion variables.
In the first step of each of these regression analyses, dispositional optimism was entered as a
control. In the second step, centered pleasure and activation terms were entered, thus testing
41
Hypotheses 5a and 5b. In the third step, the pleasure x activation interaction term was entered,
thereby testing hypotheses 6a and 6b.
Last, hierarchical linear modeling (HLM) was employed to test hypotheses 7, 8, 9, 10, 11,
12 and 13, all relating to the relationships between the criterion variables of subordinate change
beliefs and the predictor variables of change message strategies, LMX, and supervisor change
beliefs. HLM was appropriate due to the multi-level nature of the data. Dispositional optimism
was entered as an individual-level control variable, and the four change message strategies and
LMX were entered as individual-level predictor variables. In predicting each specific
subordinate change belief, the corresponding supervisor change belief was entered as a group-
level variable.

42
Chapter 3: Results
Measurement Models
A series of dimension-level confirmatory factor analyses (CFAs) were conducted using
the non-supervisory data, incorporating the five change beliefs (discrepancy, appropriateness,
valence, efficacy, and principal support) to determine if these variables were distinct from one
another. A lack of multivariate normality among the data, which is common in many fields of
study (Byrne, 2001; Micceri, 1989), was indicated by Mardia’s (1970) multivariate kurtosis
coefficient (Mardia’s coefficient = 80.29, z = 16.87). To handle the nonnormal data, I utilized
Bollen and Stine’s (1992) bootstrapping technique to compute a new critical value of the chi-
square test for overall model fit. Evaluations of Bollen and Stine’s approach have shown
reasonable performance compared to the values expected from statistical theory for the chi-
square test statistic and the standard errors of direct and indirect effects under conditions of
multivariate normality (West, Finch, & Curran, 1995).
Parcels were developed for the latent constructs of discrepancy (3 manifest indicators),
appropriateness (3 manifest indicators), valence (3 manifest indicators), and principle support (3
manifest indicators). Items were assigned to parcels utilizing the high-to-low loadings procedure
described by Little, Cunningham, Shahar and Windaman (2002). To scale each of the latent
variables, we set a path equal to 1 from each latent construct to a respective manifest indicator
(Bollen, 1989).
Against the five-belief model, I tested two alternative models: model 1 was a three-factor
model in which the most highly correlated beliefs (appropriateness, valence, and efficacy) were
combined into one factor; and model 2 was a one-factor model in which all five beliefs were
43
combined into one general response bias factor (cf. Barger & Grandey, 2006; Cole, et al., 2006).
As shown in Table 1, the fit indices supported the hypothesized five-factor model, and provided
initial evidence of the distinctiveness of discrepancy, appropriateness, valence, efficacy and
principal support. The five-factor measurement model provided an acceptable fit to the data [(χ2
= 151.40, df = 80, normal-theory p < 0.001, Bollen-Stine bootstrapped, p =0.20); CFI = .95;
SRMR = .05; RMSEA = .10]. The three-factor model had a generally worse fit with the data [(χ2
= 388.30, df = 87, normal-theory p < 0.001, Bollen-Stine bootstrapped, p = 0.001); CFI =.77;
SRMR = .12; RMSEA = .20]. The one-factor model had a poor fit with the data [(χ2 = 547.31, df
= 90, normal-theory p < 0.001, Bollen-Stine bootstrapped, p = 0.001); CFI = .66; SRMR = .13;
RMSEA = .24].
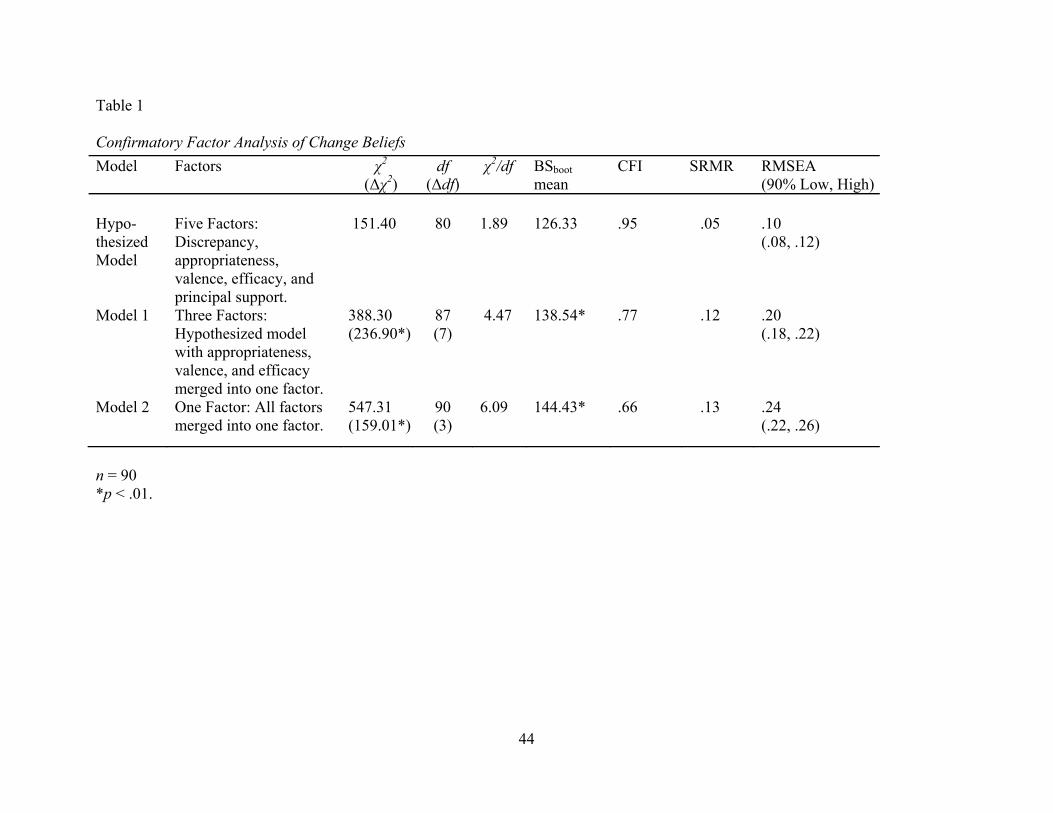
44
Table 1
Confirmatory Factor Analysis of Change Beliefs
n = 90 *p < .01.
Model Factors χ2 (Δχ2)
df (Δdf)
χ2/df
BSboot mean
CFI SRMR RMSEA (90% Low, High)
Hypo- thesized Model
Five Factors: Discrepancy, appropriateness, valence, efficacy, and principal support.
151.40 80 1.89 126.33
.95
.05 .10 (.08, .12)
Model 1
Three Factors: Hypothesized model with appropriateness, valence, and efficacy merged into one factor.
388.30 (236.90*)
87 (7)
4.47
138.54*
.77 .12 .20 (.18, .22)
Model 2 One Factor: All factors merged into one factor.
547.31 (159.01*)
90 (3)
6.09 144.43* .66 .13 .24 (.22, .26)

45
Next, a similar series of dimension-level confirmatory factor analyses (CFAs) were
conducted for the four change message strategies (persuasive communication, vicarious learning,
enactive mastery, and lecture training) to determine if these variables were distinct from one
another. Given the lack of multivariate normality among the data (Mardia’s coefficient = 51.23,
z = 10.14.), Bollen and Stine’s (1992) bootstrapping technique was again used to compute a new
critical value of the chi-square test for overall model fit.
Against our hypothesized model, I tested two alternative models: model 1 was a three-
factor model in which the two most highly correlated change message strategies (enactive
mastery and lecture training) were combined to form a single factor; and model 2 was a one-
factor model in which all four factors were combined into one general response bias factor (cf.
Barger & Grandey, 2006; Cole, et al., 2006). The fit indices supported the hypothesized four-
factor model, and provided initial evidence of the distinctiveness of persuasive communication,
vicarious learning, enactive mastery, and lecture training. As shown in Table 2, the four-factor
measurement model recognizing persuasive communication, enactive mastery, vicarious
learning, and lecture training as distinct dimensions provided a relatively good fit to the data [(χ2
= 140.31, df = 84, normal-theory p < 0.001, Bollen-Stine bootstrapped, p = 0.18); CFI = .94;
SRMR = .06; RMSEA = .09]. The three-factor model had a generally worse fit with the data [(χ2
= 192.42, df = 87, normal-theory p < 0.001, Bollen-Stine bootstrapped, p < 0.02); CFI = .89;
SRMR = .07; RMSEA = .12]. The one-factor model had a poor fit with the data [(χ2 = 551.80,
df = 90, normal-theory p < 0.001, Bollen-Stine bootstrapped, p = 0.001); CFI = .53; SRMR =
.18; RMSEA = .26].
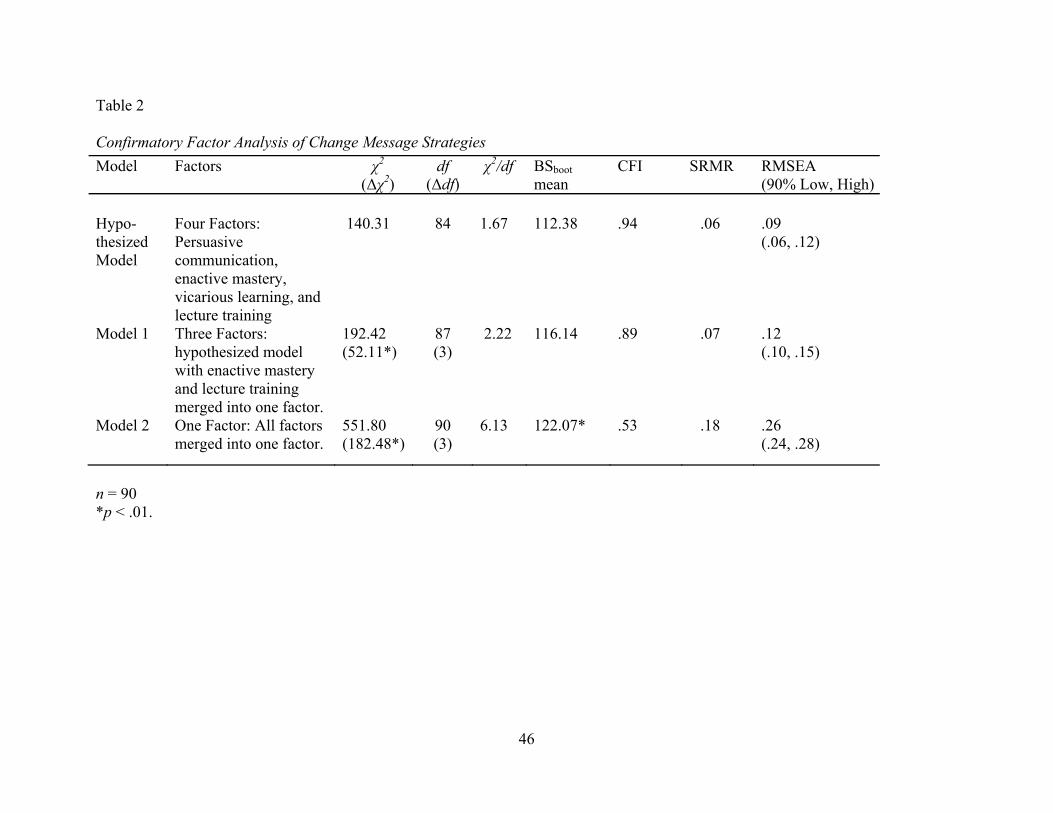
46
Table 2 Confirmatory Factor Analysis of Change Message Strategies
n = 90 *p < .01.
Model Factors χ2 (Δχ2)
df (Δdf)
χ2/df
BSboot mean
CFI SRMR RMSEA (90% Low, High)
Hypo- thesized Model
Four Factors: Persuasive communication, enactive mastery, vicarious learning, and lecture training
140.31 84 1.67 112.38
.94
.06 .09 (.06, .12)
Model 1
Three Factors: hypothesized model with enactive mastery and lecture training merged into one factor.
192.42 (52.11*)
87 (3)
2.22
116.14
.89 .07 .12 (.10, .15)
Model 2 One Factor: All factors merged into one factor.
551.80 (182.48*)
90 (3)
6.13 122.07* .53 .18 .26 (.24, .28)

47
Additionally, a series of dimension-level confirmatory factor analyses (CFAs) were
conducted for the seven discrete emotions (anger, sadness, fear, worry, optimism/hope,
happiness, and excitement) to determine if these variables were distinct from one another. Given
the lack of multivariate normality among the data (Mardia’s coefficient = 140.88, z = 21.38.),
Bollen and Stine’s (1992) bootstrapping technique was once again used to compute a new critical
value of the chi-square test for overall model fit.
Against our hypothesized model, I tested two alternative models. Model 1 was a two-
factor model in which generally negative emotions (anger, sadness, fear and worry) were
combined to form one factor, and generally positive emotions (optimism/hope, happiness, and
excitement) were combined to form a second factor. Model 2 was a one-factor model in which
all seven emotions were combined into one general response bias factor (cf. Barger & Grandey,
2006; Cole, et al., 2006). The fit indices supported the hypothesized seven-factor model, and
provided initial evidence of the distinctiveness of the seven emotions. As shown in Table 3, the
seven-factor measurement model recognizing anger, sadness, fear, worry, optimism/hope,
happiness, and excitement as distinct dimensions provided an satisfactory fit to the data [(χ2 =
280.33, df = 168, normal-theory p < 0.001, Bollen-Stine bootstrapped, p = 0.32); CFI = .94;
SRMR = .08; RMSEA = .09]. The two-factor model had a generally worse fit with the data [(χ2
= 670.23, df = 188, normal-theory p < 0.001, Bollen-Stine bootstrapped, p = 0.001); CFI = .75;
SRMR = .11; RMSEA = .17]. The one-factor model had a poor fit with the data [(χ2 = 1196.05
, df = 189, normal-theory p < 0.001, Bollen-Stine bootstrapped, p = 0.001); CFI = .48; SRMR =
.23; RMSEA = .25].
The final descriptive statistics, alpha levels and intercorrelations among all employee-
level variables are shown in Table 4.
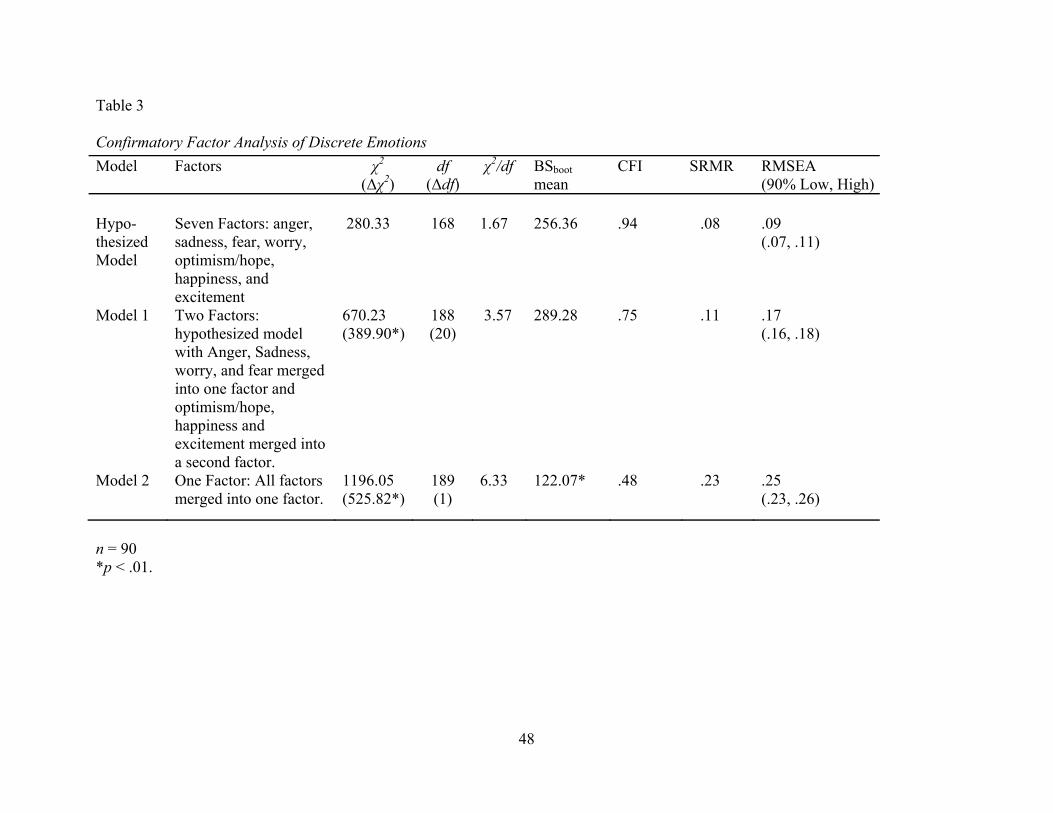
48
Table 3 Confirmatory Factor Analysis of Discrete Emotions
n = 90 *p < .01.
Model Factors χ2 (Δχ2)
df (Δdf)
χ2/df
BSboot mean
CFI SRMR RMSEA (90% Low, High)
Hypo- thesized Model
Seven Factors: anger, sadness, fear, worry, optimism/hope, happiness, and excitement
280.33 168 1.67 256.36
.94
.08 .09 (.07, .11)
Model 1
Two Factors: hypothesized model with Anger, Sadness, worry, and fear merged into one factor and optimism/hope, happiness and excitement merged into a second factor.
670.23 (389.90*)
188 (20)
3.57
289.28
.75 .11 .17 (.16, .18)
Model 2 One Factor: All factors merged into one factor.
1196.05 (525.82*)
189 (1)
6.33 122.07* .48 .23 .25 (.23, .26)
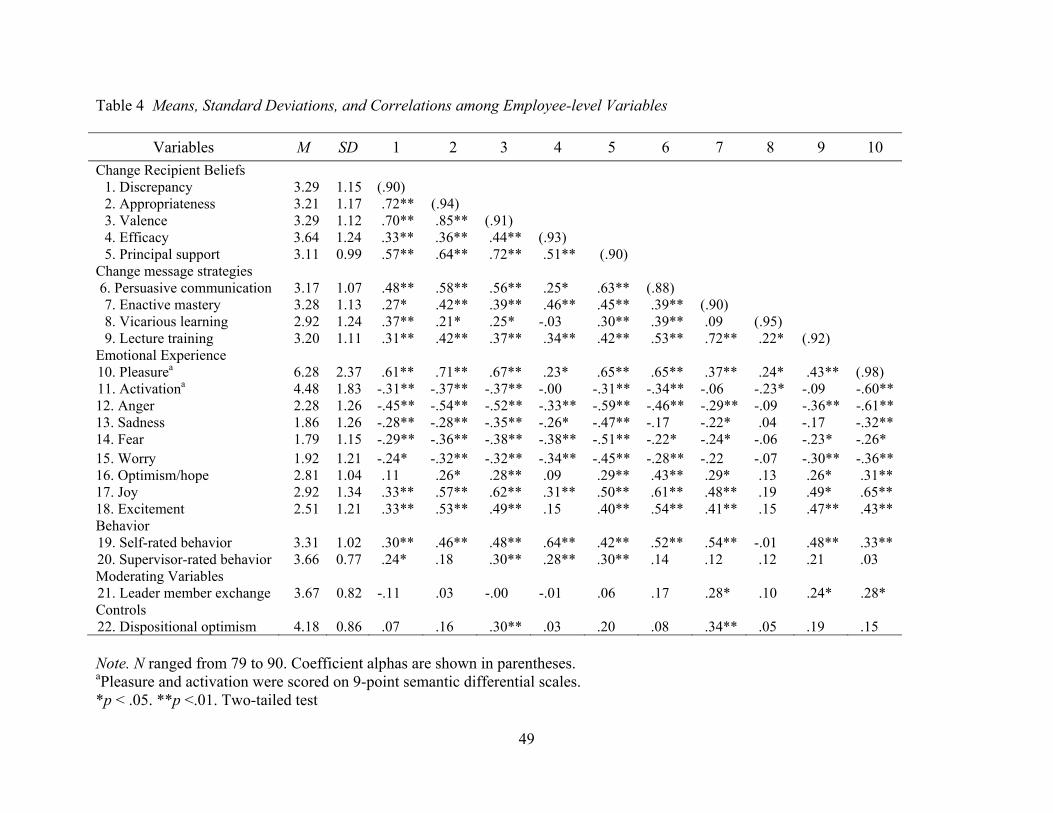
49
Table 4 Means, Standard Deviations, and Correlations among Employee-level Variables
Variables M SD 1 2 3 4 5 6 7 8 9 10
Change Recipient Beliefs 1. Discrepancy 3.29 1.15 (.90) 2. Appropriateness 3.21 1.17 .72** (.94) 3. Valence 3.29 1.12 .70** .85** (.91) 4. Efficacy 3.64 1.24 .33** .36** .44** (.93) 5. Principal support 3.11 0.99 .57** .64** .72** .51** (.90)
Change message strategies 6. Persuasive communication 3.17 1.07 .48** .58** .56** .25* .63** (.88) 7. Enactive mastery 3.28 1.13 .27* .42** .39** .46** .45** .39** (.90) 8. Vicarious learning 2.92 1.24 .37** .21* .25* -.03 .30** .39** .09 (.95) 9. Lecture training 3.20 1.11 .31** .42** .37** .34** .42** .53** .72** .22* (.92)
Emotional Experience 10. Pleasurea 6.28 2.37 .61** .71** .67** .23* .65** .65** .37** .24* .43** (.98) 11. Activationa 4.48 1.83 -.31** -.37** -.37** -.00 -.31** -.34** -.06 -.23* -.09 -.60** 12. Anger 2.28 1.26 -.45** -.54** -.52** -.33** -.59** -.46** -.29** -.09 -.36** -.61** 13. Sadness 1.86 1.26 -.28** -.28** -.35** -.26* -.47** -.17 -.22* .04 -.17 -.32** 14. Fear 1.79 1.15 -.29** -.36** -.38** -.38** -.51** -.22* -.24* -.06 -.23* -.26* 15. Worry 1.92 1.21 -.24* -.32** -.32** -.34** -.45** -.28** -.22 -.07 -.30** -.36** 16. Optimism/hope 2.81 1.04 .11 .26* .28** .09 .29** .43** .29* .13 .26* .31** 17. Joy 2.92 1.34 .33** .57** .62** .31** .50** .61** .48** .19 .49* .65** 18. Excitement 2.51 1.21 .33** .53** .49** .15 .40** .54** .41** .15 .47** .43** Behavior 19. Self-rated behavior 3.31 1.02 .30** .46** .48** .64** .42** .52** .54** -.01 .48** .33** 20. Supervisor-rated behavior 3.66 0.77 .24* .18 .30** .28** .30** .14 .12 .12 .21 .03 Moderating Variables 21. Leader member exchange 3.67 0.82 -.11 .03 -.00 -.01 .06 .17 .28* .10 .24* .28* Controls 22. Dispositional optimism 4.18 0.86 .07 .16 .30** .03 .20 .08 .34** .05 .19 .15 Note. N ranged from 79 to 90. Coefficient alphas are shown in parentheses. aPleasure and activation were scored on 9-point semantic differential scales. *p < .05. **p <.01. Two-tailed test
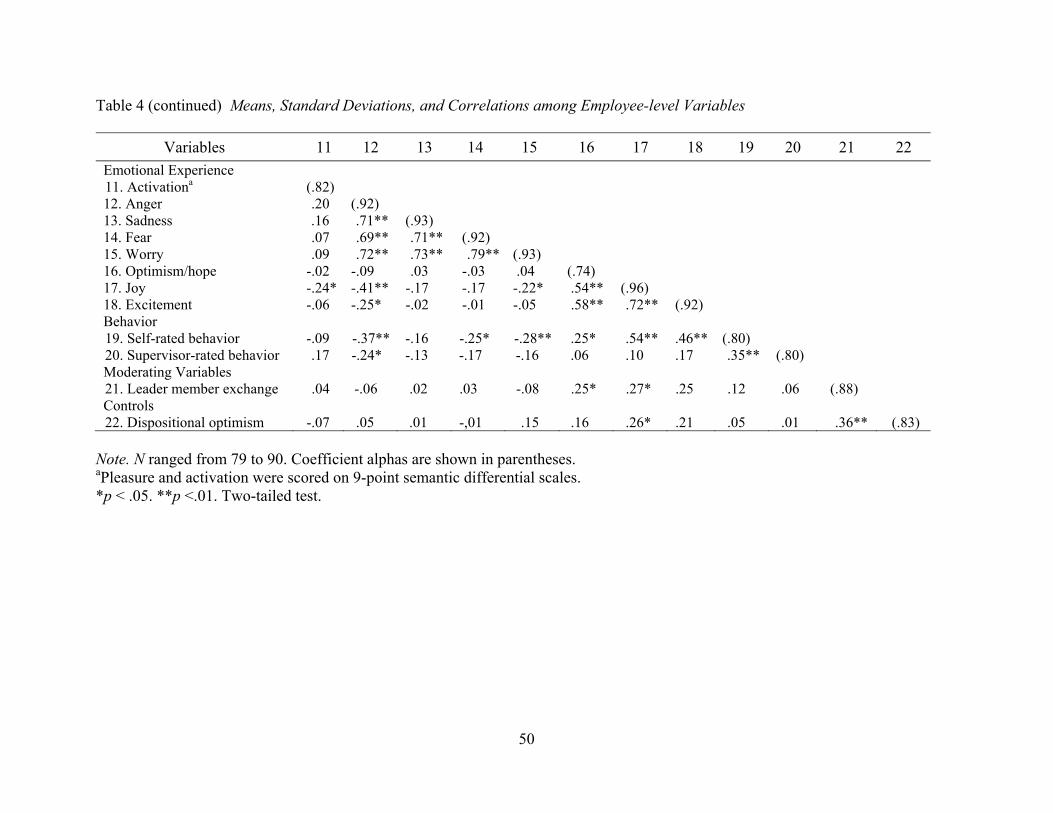
50
Table 4 (continued) Means, Standard Deviations, and Correlations among Employee-level Variables
Variables 11 12 13 14 15 16 17 18 19 20 21 22
Emotional Experience 11. Activationa (.82) 12. Anger .20 (.92) 13. Sadness .16 .71** (.93) 14. Fear .07 .69** .71** (.92) 15. Worry .09 .72** .73** .79** (.93) 16. Optimism/hope -.02 -.09 .03 -.03 .04 (.74) 17. Joy -.24* -.41** -.17 -.17 -.22* .54** (.96) 18. Excitement -.06 -.25* -.02 -.01 -.05 .58** .72** (.92) Behavior 19. Self-rated behavior -.09 -.37** -.16 -.25* -.28** .25* .54** .46** (.80) 20. Supervisor-rated behavior .17 -.24* -.13 -.17 -.16 .06 .10 .17 .35** (.80) Moderating Variables 21. Leader member exchange .04 -.06 .02 .03 -.08 .25* .27* .25 .12 .06 (.88) Controls 22. Dispositional optimism -.07 .05 .01 -,01 .15 .16 .26* .21 .05 .01 .36** (.83)
Note. N ranged from 79 to 90. Coefficient alphas are shown in parentheses. aPleasure and activation were scored on 9-point semantic differential scales. *p < .05. **p <.01. Two-tailed test.

51
Change Beliefs Related to Pleasure and Positive Discrete Emotions
Hypothesis 1 posited that the five change beliefs of discrepancy, appropriateness,
valence, efficacy, and principal support would each positively relate to the emotional dimension
of pleasure. As shown in Table 5, the set of change beliefs accounted for 55% of the variance
(∆R2 = .55, p < .001) in pleasure after controlling for dispositional optimism. Among the group
of beliefs, both appropriateness (b = .95, p < .01) and principal support (b = .83, p < .01) related
to pleasure, while discrepancy, valence, efficacy did not. Thus hypothesis 1 was partially
supported.

52
Table 5 Hierarchical Multiple Regression Analysis for Pleasure and Positive Discrete Emotions
Pleasure Optimism/Hope Joy Excitement Variable b R2 b R2 b R2 b R2
Step 1: Controls Constant .51 1.55* .10 1.24 Dispositional Optimism -.04 .08 .10 .31* ∆ R2 after Step 1 .03 .02 .07* .05* Step 2: Discrepancy -.03 -.19 -.30* -.13 Appropriateness .95** .15 .35 .51* Valence .25 .14 .50* .08 Efficacy -.15 -.05 .00 -.09 Principal Support .83** .25 .19 .16 ∆ R2 after Step 2 .55*** .11 .35*** .26*** Overall R2 .58*** .13 .42*** .31*** Adjusted R2 .54 .07 .37 .25 Note. N = 82-85. The unstandardized regression coefficients are those derived in step 2 of the model. All tests are two-tailed. *p < .05. **p < .01. ***p < .001.

53
Change Beliefs Related to Positive Discrete Emotions
Hypotheses 3a, 3b, and 3c posited the five change beliefs would be positively associated
with the motive-consistent emotions of optimism/hope, joy, and excitement. Results of the
multiple hierarchical regression analyses testing these hypotheses are summarized in Table 5.
Relating to optimism/hope, the set of change beliefs accounted for a non-significant 11% of the
variance (∆R2 = .11, ns) in optimism/hope after controlling for dispositional optimism. Thus,
hypothesis 3a was not supported. The set of change beliefs accounted for 35% of the variance in
joy (∆R2 = .35, p < .001) after controlling for dispositional optimism. When considered together,
only the change belief of valence (b = .50, p < .05) was significantly positively related to joy,
while discrepancy (b = -.30, p < .05) was negatively significantly related to joy, thus providing
only partial support for hypothesis 3b. Finally, the set of change beliefs accounted for 26% of
the variance in excitement (∆R2 = .26, p < .001) after controlling for dispositional optimism.
Individually, only the change belief of appropriateness was significantly related to excitement (b
= .51, p < .05). Thus hypothesis 3c was partially supported.
Hypotheses 3d, 3e, 3f, and 3g proposed that the change beliefs of valence and efficacy
were anticipated to have a stronger positive relationship with d) pleasure, e) optimism/hope, f)
joy, and g) excitement than the other change beliefs. Hypotheses 3d, e, and g were not
supported. Valence was positively significantly related to joy (b = .50, p < .05), providing partial
support for hypothesis 3f.
Change Beliefs and Arousal
Hypothesis 2 posited that the five change beliefs would each have a U-shaped
relationship with activation such that negative and positive beliefs would correspond to higher
activation. As shown in Table 6, there was a main linear effect for the set of beliefs (∆R2 = .18, p

54
< .05). However, contrary to Hypothesis 2, the set of squared terms were not significant; thus
hypothesis 2 was not supported.
Table 6 Hierarchical Multiple Regression Analysis of Activation on Change Beliefs
Activation
b R2 Step 1: Controls Constant 3.83*** Dispositional Optimism .10 ∆ R2 after Step 1 .00 Step 2: Discrepancy (centered) -.08 Appropriateness (centered) -.31 Valence centered (centered) -.49 Efficacy centered (centered) .40 Principal centered (centered) -.04 ∆ R2 after Step 2 .18* Step 3: Discrepancy (centered) squared .10 Appropriateness (centered) squared .13 Valence centered (centered) squared -.33 Efficacy centered (centered) squared .17 Principal centered (centered) squared .16 ∆ R2 after Step 2 .03 Overall R2 .21 Adjusted R2 .09 Note. N = 79. The unstandardized regression coefficients are those derived in step 3 of the model. All tests are two-tailed. *p < .05. **p < .01. ***p < .001.
Change Beliefs and Negative Discrete Emotions
Hypotheses 4a-4d posited discrepancy, appropriateness valence, efficacy, and principal
support would be negatively related to the negative discrete emotions of a) anger, b) sadness, c)
fear, and d) worry. As noted in Table 7, taken together, the five beliefs accounted for significant

55
increases in variance explained for each of the four negative emotions. However, only principal
support made a significant individual contribution to all four negative emotions: anger (b = -.56,
p < .01), sadness (b = -.61, p < .01), fear (b = -.49, p < .01), and worry (b = -.49, p < .01).
Contrary to the hypothesis 4, discrepancy, appropriateness, valence and efficacy were not
independently related to any of the four negative emotions. Thus, hypotheses 4a-d were only
partially supported.
Hypotheses 4e-4h posited valence and efficacy were anticipated to have stronger
relationships with e) anger, f) sadness, g) fear, and h) worry than the other change beliefs.
Because valence and efficacy were not significantly related to anger, sadness fear, or worry,
hypotheses 4e-h were not supported.

56
Table 7 Hierarchical Multiple Regression Analysis for Negative Discrete Emotions
Anger Sadness Fear Worry Variable b R2 b R2 b R2 b R2
Step 1: Controls Constant 4.03*** 3.17*** 3.43*** 2.59** Dispositional Optimism .26 .19 .11 .32* ∆ R2 after Step 1 .00 .00 .00 .02 Step 2: Discrepancy -.03 -.06 .06 .11 Appropriateness -.27 .19 -.10 -.14 Valence -.07 -.21 .01 .00 Efficacy .01 .02 -.14 -.12 Principal Support -.56** -.61** -.49** -.49** ∆ R2 after Step 2 .44*** .27*** .27*** .24*** Overall R2 .44*** .27*** .27*** .36** Adjusted R2 .40 .21 .22 .20 Note. N = 85. The unstandardized regression coefficients are those derived in step 2 of the model. All tests are two-tailed. *p < .05. **p < .01. ***p < .001

57
Pleasure and Activation Related to Change Adoption Behavior
Hypotheses 5a and 5b posited that felt pleasure would be positively related to a) self-
rated and b) supervisor-rated change adoption behaviors. To test these hypotheses, I conducted a
series of multiple hierarchical regressions, whose results are summarized in Table 8. Pleasure
was found to be significantly positively related to self-rated change adoption behaviors, (b = .13,
p < .05), but not supervisor-rated change adoption behaviors. As such, hypothesis 5a was
supported, but not 5b.
Table 8 Hierarchical Multiple Regression Analysis for Change-Related Behaviors
Self-Rated Change Behaviors
Supervisor-Rated Change Behaviors
Variable b R2 b R2 Step 1: Controls Constant 3.49*** 3.70*** Dispositional Optimism -.00 .02 ∆ R2 after Step 1 .00 .00 Step 2: Pleasure (centered) .13* .05 Activation (centered) .04 .10 ∆ R2 after Step 2 .13** .07 Step 3: Pleasure (centered) X Activation (centered)
.05* .03
∆ R2 after Step 3 .05* .03 Overall R2 .18*** .10 Adjusted R2 .13 .06 Note. N = 78-79. The unstandardized regression coefficients are those derived in step 3 of the model. All tests are two-tailed. *p < .05. **p < .01. ***p < .001.
Hypotheses 6a and 6b posited that activation would moderate the relationship between
pleasure and a) self-reported and b) supervisor reported change adoption behaviors. As shown in
Table 8, the activation x pleasure interaction term was found to be positively related to self-rated
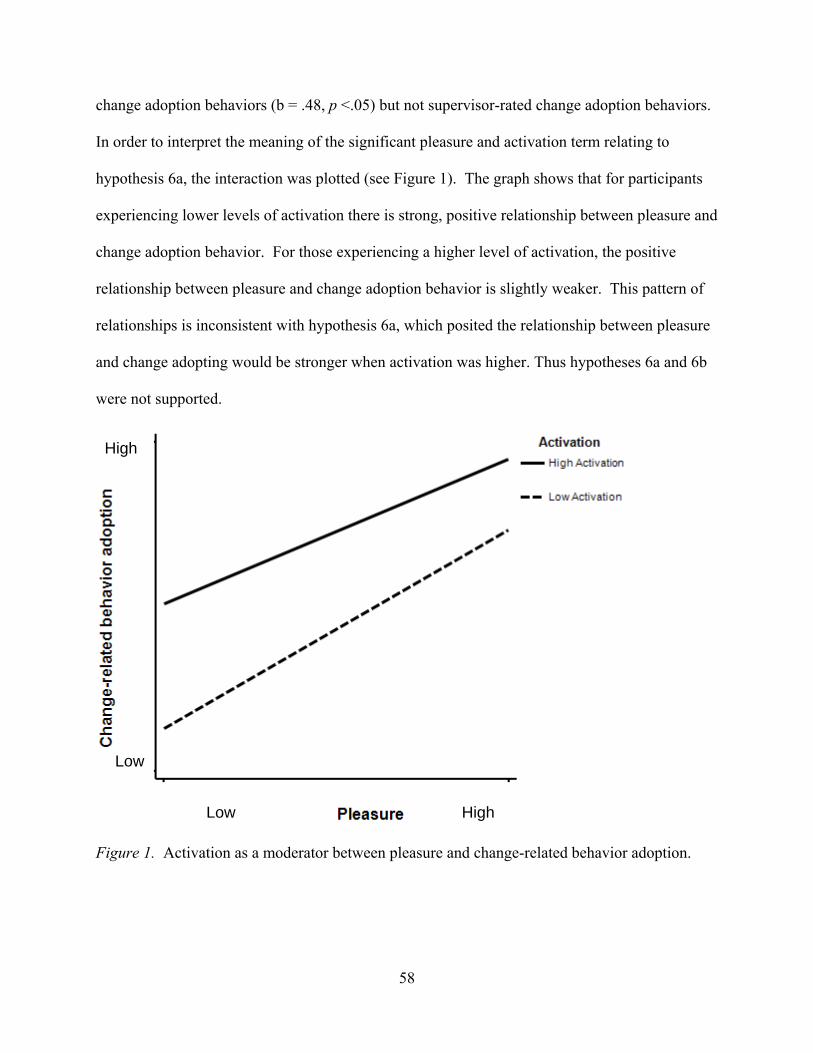
58
change adoption behaviors (b = .48, p <.05) but not supervisor-rated change adoption behaviors.
In order to interpret the meaning of the significant pleasure and activation term relating to
hypothesis 6a, the interaction was plotted (see Figure 1). The graph shows that for participants
experiencing lower levels of activation there is strong, positive relationship between pleasure and
change adoption behavior. For those experiencing a higher level of activation, the positive
relationship between pleasure and change adoption behavior is slightly weaker. This pattern of
relationships is inconsistent with hypothesis 6a, which posited the relationship between pleasure
and change adopting would be stronger when activation was higher. Thus hypotheses 6a and 6b
were not supported.
Figure 1. Activation as a moderator between pleasure and change-related behavior adoption.
Low High
Low
High

59
Change Message Strategies, LMX, and Supervisor Beliefs Related to Change Beliefs
Significant positive correlations exist between many change beliefs and the change
message strategies. These correlations, however, do not take into account the multilevel nature
of the data. The data in the present study relating to hypotheses 7-12 were multilevel in nature,
with supervisor organizational change beliefs at the group level and subordinate change beliefs,
change message strategies, and leader member exchange at the individual level of analysis. This
multilevel data structure required the use of the hierarchical linear modeling analytical technique
(Hofmann, Griffin, & Gavin, 2000; Hofmann, et al., 2003; Raudenbush & Bryk, 2002), which
allowed for the simultaneous testing of the relationship between change beliefs and change
message strategies, LMX, and supervisor beliefs. HLM Version 6.0 reports both generalized
least squares (GLS) standard errors as well as more robust standard errors. Given the Level 2
sample size, I reported only the t values based on the more conservative GLS estimates.
Following the advice of James and William (2000) who suggest a simpler analysis is sometimes
better than a more complex analysis; I also analyzed the data using the more traditional ordinary
least squares regression, following the example of Hoffmann, Morgeson & Gerras (2003). The
results of these ordinary least squares analyses were consistent with the HLM results reported.
Table 9 provides detailed HLM models results while Table 10 provides a summary of the
HLM results used to test Hypotheses 7-12. Hypothesis 7 predicted that the change message
strategy of persuasive communication would be positively related to all five change beliefs.
Persuasive communication was found to relate to four of the five beliefs discrepancy: (γ30 = .51,
p < .01; appropriateness: (γ30 = .56, p < .05); valence (γ30 = .68, p < .01); and principal support
(γ30 = .52, p < .01). Persuasive communication was not significantly related to efficacy (γ30 =
.21, ns). Thus, hypothesis 7 was partially supported.

60
Table 9 Hierarchical Linear Modeling Models and Results for Hypotheses 7, 8, 9, 10, 11, 12 and 13 Discrepancy
Model Parameter Estimates
L1: Discrepancy = β0j + β1j(Dispositional optimism)ij + β2j(Vicarious Learning) ij + β3j(Persuasive Communication) ij + β4j(Lecture Training) ij + β5j(Enactive Mastery)ij + β6j(Leader Member Exchange)ij + rij
L2: β0j = γ00 + γ01(Supervisor’s Discrepancy)j + u0j L2: β1j = γ10 + u1j L2: β2j = γ20 + u2j
L2: β3j = γ30 + u3j L2: β4j = γ40 + u4j L2: β5j = γ50 + u5j
L2: β6j = γ60 + u6j
γ00 3.32*** γ01 .16 γ10 .10 γ20 .16 γ30 .51** γ40 -.16 γ50 .18 γ60
-.46*
Appropriateness
Model Parameter Estimates
L1: Appropriateness = β0j + β1j(Dispositional optimism)ij + β2j(Vicarious Learning) ij + β3j(Persuasive Communication) ij + β4j(Lecture Training)ij + β5j(Enactive Mastery)ij + β6j(Leader Member Exchange)ij + rij
L2: β0j = γ00 + γ01(Supervisor’s Appropriateness)j + u0j L2: β1j = γ10 + u1j L2: β2j = γ20 + u2j
L2: β3j = γ30 + u3j L2: β4j = γ40 + u4j L2: β5j = γ50 + u5j
L2: β6j = γ60 + u6j
γ00 2.97*** γ01 .26* γ10 .19 γ20 -.09 γ30 .56* γ40 -.05 γ50 .31 γ60 -.03
Valence
Model Parameter Estimates
L1: Valence = β0j + β1j(Dispositional optimism)ij + β2j(Vicarious Learning)ij + β3j(Persuasive Communication) ij + β4j(Lecture Training)ij + β5j(Enactive Mastery)ij + β6j(Leader Member Exchange)ij + rij
L2: β0j = γ00 + γ01(Supervisor’s Valence)j + u0j L2: β1j = γ10 + u1j L2: β2j = γ20 + u2j
L2: β3j = γ30 + u3j L2: β4j = γ40 + u4j L2: β5j = γ50 + u5j
L2: β6j = γ60 + u6j
γ00 3.20*** γ01 .14 γ10 .27 γ20 -.07 γ30 .68** γ40 -.09 γ50 .16 γ60
-.33
Note. L1=Level 1; L2= Level 2; γ00 = Slope of Level 2 regression predicting β0j; γ10 = Slope of Level 2 regression predicting β1j (pooled Level 1 slopes); γ20 = Slope of Level 2 regression predicting β2j (pooled Level 1 slopes); γ30 = Slope of Level 2 regression predicting β3j (pooled Level 1 slopes); γ40 = Slope of Level 2 regression predicting β4j (pooled Level 1 slopes), γ50 = Slope of Level 2 regression predicting β5j (pooled Level 1 slopes); γ60 = Slope of Level 2 regression predicting β6j (pooled Level 1 slopes); σ2= Variance in Level 1 residual (i.e. variance in u1) *p < .05. **p < .01. ***p < .001.

61
Table 9 (Continued)
Hierarchical Linear Modeling Models and Results for Hypotheses 7, 8, 9, 10, 11, 12 and 13
Efficacy
Model Parameter Estimates
L1: Efficacy = β0j + β1j(Dispositional optimism)ij + β2j(Vicarious Learning) ij + β3j(Persuasive Communication) ij + β4j(Lecture Training)ij + β5j(Enactive Mastery)ij + β6j(Leader Member Exchange)ij + rij
L2: β0j = γ00 + γ01(Supervisor’s Efficacy)j + u0j L2: β1j = γ10 + u1j L2: β2j = γ20 + u2j
L2: β3j = γ30 + u3j L2: β4j = γ40 + u4j L2: β5j = γ50 + u5j
L2: β6j = γ60 + u6j
γ00 3.50***
γ01 .00 γ10 -.02 γ20 -.03 γ30 .21 γ40 -.25 γ50 .64** γ60 -.12
Principal Support
Model Parameter Estimates
L1: Principal Support = β0j + β1j(Dispositional optimism)ij + β2j(Vicarious Learning)ij + β3j(Persuasive Communication) ij + β4j(Lecture Training)ij + β5j(Enactive Mastery)ij + β6j(Leader Member Exchange)ij + rij
L2: β0j = γ00 + γ01(Supervisor’s Principal Support)j + u0j L2: β1j = γ10 + u1j L2: β2j = γ20 + u2j
L2: β3j = γ30 + u3j L2: β4j = γ40 + u4j L2: β5j = γ50 + u5j
L2: β6j = γ60 + u6j
γ00 2.97***
γ01 .41*** γ10 .11 γ20 -.01 γ30 .52** γ40 -.10 γ50 .30** γ60 -.17
Note. L1=Level 1; L2= Level 2; γ00 = Slope of Level 2 regression predicting β0j; γ10 = Slope of Level 2 regression predicting β1j (pooled Level 1 slopes); γ20 = Slope of Level 2 regression predicting β2j (pooled Level 1 slopes); γ30 = Slope of Level 2 regression predicting β3j (pooled Level 1 slopes); γ40 = Slope of Level 2 regression predicting β4j (pooled Level 1 slopes), γ50 = Slope of Level 2 regression predicting β5j (pooled Level 1 slopes); γ60 = Slope of Level 2 regression predicting β6j (pooled Level 1 slopes) *p < .05. **p < .01. ***p < .001.
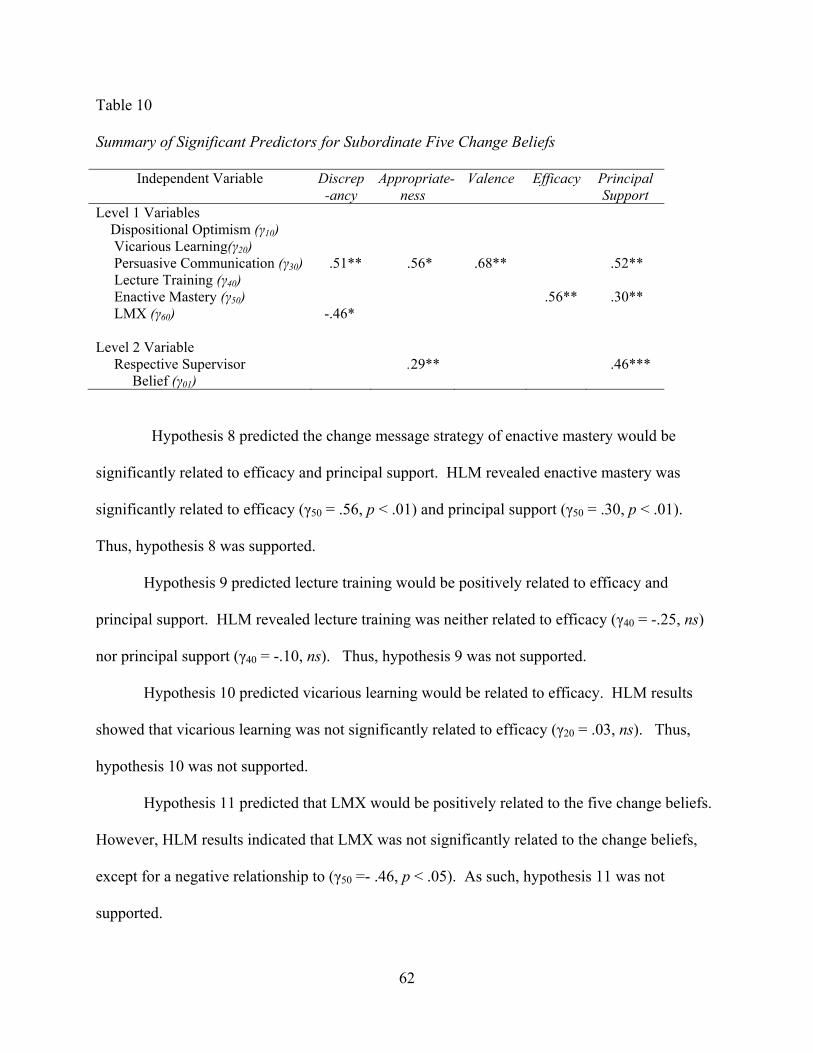
62
Table 10 Summary of Significant Predictors for Subordinate Five Change Beliefs
Independent Variable Discrep-ancy
Appropriate-ness
Valence Efficacy Principal Support
Level 1 Variables Dispositional Optimism (γ10) Vicarious Learning(γ20) Persuasive Communication (γ30) .51** .56* .68** .52** Lecture Training (γ40) Enactive Mastery (γ50) .56** .30** LMX (γ60) -.46* Level 2 Variable Respective Supervisor .29** .46*** Belief (γ01)
Hypothesis 8 predicted the change message strategy of enactive mastery would be
significantly related to efficacy and principal support. HLM revealed enactive mastery was
significantly related to efficacy (γ50 = .56, p < .01) and principal support (γ50 = .30, p < .01).
Thus, hypothesis 8 was supported.
Hypothesis 9 predicted lecture training would be positively related to efficacy and
principal support. HLM revealed lecture training was neither related to efficacy (γ40 = -.25, ns)
nor principal support (γ40 = -.10, ns). Thus, hypothesis 9 was not supported.
Hypothesis 10 predicted vicarious learning would be related to efficacy. HLM results
showed that vicarious learning was not significantly related to efficacy (γ20 = .03, ns). Thus,
hypothesis 10 was not supported.
Hypothesis 11 predicted that LMX would be positively related to the five change beliefs.
However, HLM results indicated that LMX was not significantly related to the change beliefs,
except for a negative relationship to (γ50 =- .46, p < .05). As such, hypothesis 11 was not
supported.

63
Hypothesis 12 predicted that each change belief held by a supervisor would correspond to
the same belief held by subordinates. Consistent results were found for appropriateness (γ01 =
.26, p < .05), and principal support (γ01 = .41, p < .001). Supervisor beliefs were not found to be
significantly related to subordinate beliefs of discrepancy (γ01 = .16, ns), valence (γ01 = .14, ns)
or efficacy (γ01 = .00, ns).
Hypothesis 13 predicted that supervisor beliefs of discrepancy, appropriateness, and
principal support would relate more strongly to respective subordinate beliefs than would
supervisor beliefs of valence and efficacy related to respective subordinate beliefs. Because
supervisor appropriateness and principal support were significantly related to their respective
subordinate beliefs, while supervisor beliefs of discrepancy, valence, and efficacy were not
significantly related to respective subordinate beliefs, hypothesis 13 was partially supported.
Table 11 provides a summary of the results of all hypotheses tests.
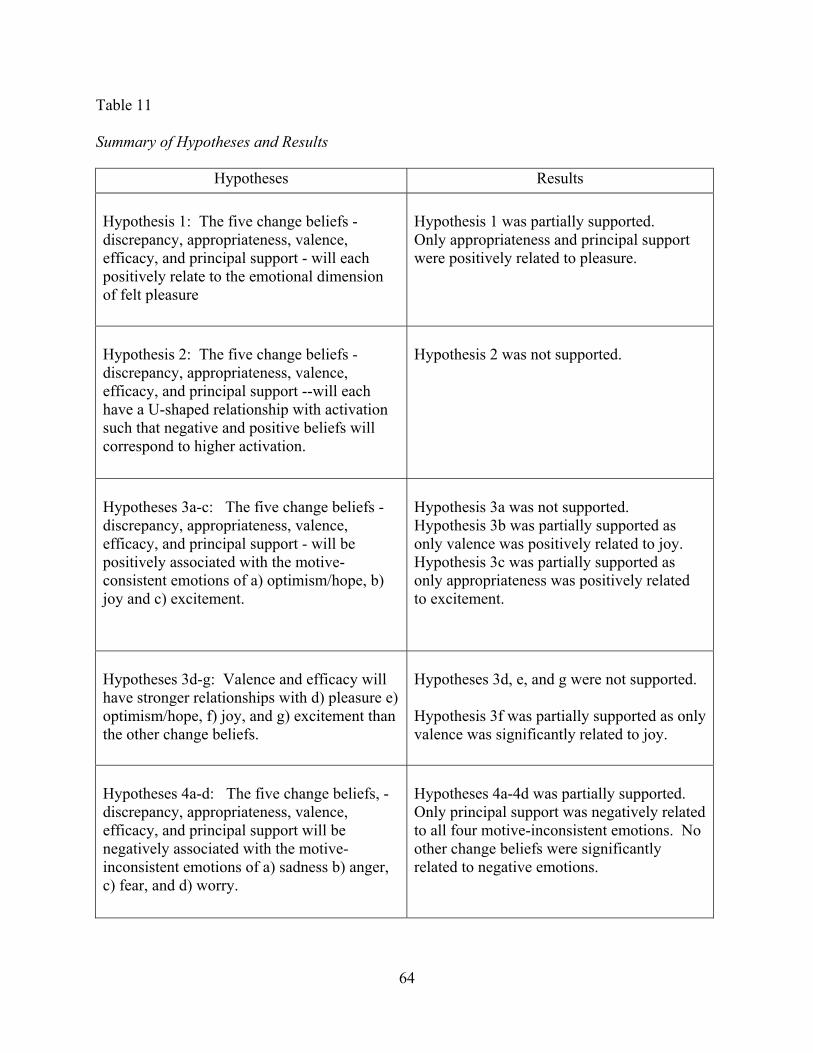
64
Table 11 Summary of Hypotheses and Results
Hypotheses Results
Hypothesis 1: The five change beliefs - discrepancy, appropriateness, valence, efficacy, and principal support - will each positively relate to the emotional dimension of felt pleasure
Hypothesis 1 was partially supported. Only appropriateness and principal support were positively related to pleasure.
Hypothesis 2: The five change beliefs - discrepancy, appropriateness, valence, efficacy, and principal support --will each have a U-shaped relationship with activation such that negative and positive beliefs will correspond to higher activation.
Hypothesis 2 was not supported.
Hypotheses 3a-c: The five change beliefs - discrepancy, appropriateness, valence, efficacy, and principal support - will be positively associated with the motive-consistent emotions of a) optimism/hope, b) joy and c) excitement.
Hypothesis 3a was not supported. Hypothesis 3b was partially supported as only valence was positively related to joy. Hypothesis 3c was partially supported as only appropriateness was positively related to excitement.
Hypotheses 3d-g: Valence and efficacy will have stronger relationships with d) pleasure e) optimism/hope, f) joy, and g) excitement than the other change beliefs.
Hypotheses 3d, e, and g were not supported. Hypothesis 3f was partially supported as only valence was significantly related to joy.
Hypotheses 4a-d: The five change beliefs, - discrepancy, appropriateness, valence, efficacy, and principal support will be negatively associated with the motive-inconsistent emotions of a) sadness b) anger, c) fear, and d) worry.
Hypotheses 4a-4d was partially supported. Only principal support was negatively related to all four motive-inconsistent emotions. No other change beliefs were significantly related to negative emotions.

65
Table 11 (continued)
Hypotheses Results
Hypotheses 4e-h: Valence and efficacy will have stronger relationships with e) anger, f) sadness, g) fear, and h) worry than the other change beliefs.
Hypotheses 4e-h were not supported.
Hypothesis 5a: Felt pleasure will be positively related to the adoption of change-related behaviors, as self-assessed by change recipients.
Hypothesis 5a was supported. Felt pleasure was positively associated with self-rated change behaviors.
Hypothesis 5b: Felt pleasure will positively relate to the adoption of change adoption behaviors, as assessed by the supervisor of each change recipient.
Hypothesis 5b was not supported.
Hypothesis 6a: Activation will moderate the relationship between pleasure and self-rated change adoption behavior. Higher levels of activation are anticipated to strengthen the relationship between pleasure and self-assessed change-related behavior.
Hypothesis 6a was not supported. While activation significantly moderated the relationship between pleasure and self rated change behavior, the nature of the interaction was opposite that hypothesized.
Hypothesis 6b: Activation will moderate the relationship between pleasure and supervisor-rated change adoption behavior. Higher levels of activation are anticipated to strengthen the relationship between pleasure and supervisor-assessed change adoption behavior of subordinates.
Hypothesis 6b was not supported.
Hypothesis 7: Persuasive communication will be positively related to the five change beliefs of discrepancy, appropriateness, valence, efficacy, and principal support.
Hypothesis 7 was partially supported. Persuasive communication was found to positively relate to four of the five beliefs: Discrepancy, appropriateness, valence, and principal support.

66
Table 11 (continued)
Hypotheses Results
Hypothesis 8: Enactive mastery will be positively related to efficacy and principal support beliefs.
Hypothesis 8 was supported as enactive mastery was significantly related to efficacy and principal support.
Hypothesis 9: Lecture training will be positively related to efficacy and principal support beliefs.
Hypothesis 9 was not supported.
Hypothesis 10: Vicarious learning will be positively related to efficacy.
Hypothesis 10 was not supported.
Hypothesis 11: LMX is anticipated to be positively related to the five change beliefs of discrepancy, appropriateness, valence, efficacy and principal support.
Hypothesis 11 was not supported.
Hypothesis 12: Supervisor beliefs of discrepancy, appropriateness, valence, efficacy, and principal support will relate positively to corresponding subordinate beliefs.
Hypothesis 12 was partially supported. Supervisory beliefs of appropriateness, and principal support related to corresponding subordinate beliefs.
Hypothesis 13: Supervisor beliefs of discrepancy, appropriateness, and principal support will relate more strongly to subordinate beliefs than supervisor beliefs of valence and efficacy.
Hypothesis 13 was partially supported. Supervisor appropriateness and principal support were positively related to their respective subordinate beliefs, while supervisor beliefs of discrepancy, valence and efficacy were not related to respective subordinate beliefs.
67
Chapter 4: Discussion
In the context of a technological change, the results from this research provide
preliminary, yet partial support for the proposed relationships between cognitive evaluations,
emotional responses, and behavioral responses as predicted by the models of Liu and Perrewé
(2005) and Elfenbein (2007). This research integrates these models with aspects of the
institutionalization change model relating to change message strategies developed by Armenakis,
Harris, and their colleagues (Armenakis, et al., 1999; Armenakis, et al., 1993). Results from this
research provide evidence that change agents may successfully utilize change message strategies
to help shape cognitive evaluations of a change.
Predicting Felt Emotion
In several ways, this research expands on prior research relating to the relationships
between cognitions and felt emotion. First, this research includes all five change beliefs in
assessing the influence of cognition on felt emotion, whereas prior research only included three
of the five change beliefs. Additionally, this research explored the relationships between change
beliefs and both dimensional (pleasure and activation) and discrete emotion. Prior research
utilized only dimensional measures of felt emotion.
In predicting pleasure utilizing multiple hierarchical regression, as a group, the five
change beliefs predicted 55% of the variance relating to pleasure beyond that explained by
dispositional optimism. However, among the five, only appropriateness (b = .95, p < .01) and
principal support (b = .83, p < .01) were significant independent predictors of pleasure
individually. This lack of individual significance for discrepancy, valence, and efficacy may be
explained by the fact that the five change beliefs were moderately correlated with one another.
In addition, the small sample size reduced the power of the tests. It was surprising that
68
appropriateness and principal support were most significantly related to pleasure as it was
anticipated that change beliefs most closely related to the change’s impact on oneself (valence
and efficacy) would be most important. Perhaps the strength of the relationship was the result of
the nature of the change in this case. Specifically, the change was mandated, compliance was
straightforward with little room for implementation discretion, and resistance was not possible
without personal pay consequences. Perhaps in such circumstances, feelings that the change is
systemically appropriate and enjoys enough support that it will not be rescinded are the most
important considerations. Taken together, these finds help us gain a more nuanced
understanding of the relationship between change beliefs and pleasure by recognizing that while
the five change sentiments as a group are significantly related to pleasure, the most important
change beliefs may differ according to the circumstance.
In predicting activation, none of the five change beliefs held the anticipated U-shaped
relationship with activation. This was a surprise because the relationship had been found for two
beliefs in previous research (Harris & Gresch, 2008). The lack of significance between the five
change beliefs and activation in this study underscores the fact that more research is needed to
better understand the nature of activation. Perhaps the timing of the data collection in the present
study offers an explanation for the lack of support for the curvilinear relationship. In the Harris
and Gresch (2008) study, data were collected while some changes were still being implemented.
In the present study, data was collected after the implementation of a very discrete behavioral
change. Perhaps respondents had already inured themselves to the change and therefore negative
beliefs were not as arousing. Interestingly, there was a positive main effect between the set of
beliefs and arousal. Positive beliefs were more arousing.
69
In evaluating how well the change beliefs predicted pleasure relative to individual
discrete emotions, it is interesting to note that while the change beliefs explained 55% of the
variance of pleasure beyond the control variable, the change beliefs explained noticeably less
variance (11% to 44%) for each of the discrete emotions. This difference in explained variance
should not be entirely unexpected, considering the complex nature of discrete emotions as
depicted in Roseman’s (1996) framework. It may be relatively simple for change beliefs to
predict whether an individual feels generally positive or negative about a change.
This study contributes to the field by investigating which specific appraisals are most
strongly related to individual discrete emotions. In considering positive discrete emotions,
change beliefs as a group were not significant predictors of optimism/hope beyond the control
variable (Δ R2= .11, ns) and individually, no change beliefs were significant predictors of
optimism/hope. However, change beliefs as a group significantly predicted joy (Δ R2= .35, p <
.001) beyond the control variable, with valence being the only significant individual predictor
among the group (b = .50, p < .05) with the exception of an unexpected negative relationship
with discrepancy (b = -.30, p < .05). The negative relationship could exist if individuals who
believed the prior status quo was highly unsatisfactory (high discrepancy) also felt the changes
were unhelpful. Since the discrepancy belief focuses on circumstances prior to the change and
not specifically on the change itself, the relationship between discrepancy and emotion felt
toward the new change may be complex. Likewise, change beliefs as a group significantly
predicted excitement (Δ R2= .26, p < .001) beyond the control variable, although appropriateness
was the only individually significant predictor variable (b = .51, p < .05). These results suggest
that different beliefs influence different discrete emotions. In particular, joy seems to be related

70
to assessments of individual outcomes (valence) while excitement was related more to
organizational outcomes (appropriateness of the change).
With regard to the negative discrete emotions, the change belief of principal support was
negatively associated with all four of the negative discrete emotions studied. In contrast, among
the group, discrepancy, appropriateness, valence, and efficacy were not significantly related to
any of the four negative discrete emotions, although the five change beliefs as a group
significantly predicted anger (Δ R2= .44, p < .001), sadness (Δ R2= .27, p < .001), fear (Δ R2=
.27, p < .001), and worry (Δ R2= .24, p < .001). The strength of principal support as an
individual predictor of negative emotions was surprising, especially since valence and efficacy
were anticipated to have the strongest relationships, as they are the change beliefs which
represent the change’s most direct impact on the individual. Recognizing that principal support
was associated with multiple negative discrete emotions as well as pleasure helps contribute to
our understanding of the magnitude of the influence that principal support beliefs may play in an
organization. As such, change agents should take note of the implication that change recipients
are at heightened risk for experiencing negative emotions relating to the change if they perceive
co-workers and organizational leaders do not support the change. This implication is consistent
with social cognition theory (Wood & Bandura, 1989) which recognizes individuals observe the
behavior of others as a means of assessing efficacy. If an individual observes others who are not
modeling behavior that supports the change, their organizational change efficacy beliefs will be
low as they recognize the effort is likely to fail. Likewise, such a reaction is consistent with
social information processing which recognizes that individuals attend to, encode and interpret
social cues before generating and evaluating and enacting possible responses to the situation
(Lemerise & Arsenio, 2000). According to social information processing, an individual would

71
recognize the behavior and attitudes of leaders were inconsistent with the successful adoption of
a change and evaluate the likelihood of failure to be high. Utilizing available resources to ensure
change recipients perceive that organization leadership supports a change appear to be
investments well worth considering.
It is also interesting to note that the two change beliefs most significantly related to
positive discrete emotions (appropriateness and valence) were different from the change belief
most significantly related to negative discrete emotions (principal support). This pattern of one
set of factors relating to positive emotions and a second set of factors relating to negative
emotions could be analogous to patterns associated with Hertzberg’s (1959) job satisfaction
theory. According to Herzberg’s theory, “satisfiers” are factors that relate to job content and
associated with job satisfaction, while “dissatisfiers” are factors related to job dissatisfaction and
include supervision and physical work environment.
The change belief of principal support could be representative of a “dissatisfier” as it was
significantly associated with negative discrete emotions, but not positive discrete emotions. The
association of principal support with co-workers and management is consistent with the concept
of a “dissatisfier.” In contrast, appropriateness and valence were significantly positively related
to positive discrete emotions, but not negative discrete emotions. Consistent with the concept of
“satisfiers,” appropriateness and valence relate to the content of the change itself.
This study extends our understanding of the relationships between felt emotions and the
adoption of change compliant behavior. As expected, felt pleasure toward the change was
positively associated with self-ratings of change adoption behavior. This association is intuitive
as individuals who feel better about a change are more likely to engage in behavior that complies
with the change. Interestingly, felt pleasure was not significantly associated with supervisor-

72
rated change adoption behavior. Considering that supervisor ratings of subordinate change
adoption behavior were higher on average than subordinate self-ratings and contained less
variance, it could simply be that supervisor ratings reflected fairly common performance
appraisal biases of leniency and central tendency error (Moody, 2010). In contrast, it is also
possible that individuals let any negative attitudes shape their perception of their performance.
Again, the performance required to comply with the change was straightforward leaving little
room for discretionary behavior. Supervisors may have only witnessed this compliance while
employees were aware that they were performing under the auspices of certain feelings, such as
resentment or enthusiasm.
More surprising was the moderating effect that activation played in the relationship
between pleasure and self-rated change adoption behavior. Counter to expectations, a stronger
relationship between pleasure and change-related behavior existed when activation was low,
rather than high. The results shown in Figure 1, do suggest that activation in the current study
served to compensate for low pleasure such that those feeling low pleasure but high activation
were more likely to report adoption than those with low activation. Activation regarding the
change as well as pleasure both had main effects on self-reported change adoption. In the
present case, activation may have been generated by the stress of not complying successfully. In
contrast, those feeling displeasure about the change and having low activation as well may have
been least motivated to comply.
Antecedents of Change Beliefs
The current study helps us understand the impact of individual strategies on change
appraisals by examining the role of four strategies (persuasive communication, enactive mastery,
vicarious learning, and lecture training) in shaping the five change beliefs, providing empirical

73
support for strategies recognized by Armenakis, Harris, and Feild (1999). This research found
that one or more change message strategies were significantly related to each of the five change
beliefs. Surprisingly, persuasive communication was found to be the most consistent predictor
of change beliefs, as it was significantly related to four of the five change beliefs. This strong
relationship may provide encouragement to change agents who must rely heavily on corporate
communication efforts to manage change recipient perceptions of a change. Enactive mastery
was a significant predictor of change recipient efficacy perceptions and principal support. The
positive relationship between enactive mastery and efficacy was expected as enactive mastery is
recognized in social learning theory (Bandura, 1977) as a specific strategy for increasing self
efficacy. Likewise, the positive relationship between enactive mastery and principal support was
consistent with change recipients recognizing leadership support if they believe sufficient
resources are committed to facilitate adequate preparation for the change. Lecture training was
not significantly related to efficacy or principal support beliefs in the HLM analysis as
hypothesized. Additionally vicarious learning was not significantly related to efficacy despite
being positively correlated to the beliefs. This lack of significant positive association between
change message strategies and change beliefs in the HLM analysis could possibly be explained
by the moderate correlations between the four change message strategies.
Considering all the change message strategies available to change agents, it appears that
the use persuasive communication is most consistently influential in shaping change message
beliefs. Therefore, change agents might consider leveraging the persuasive communication
strategy by utilizing a variety of communication channels for delivering the change message.
Considering that a large number of communication media exist, and that each possesses different
characteristics, such as richness, future research might identify media that most strongly impact

74
each of the five change beliefs. Although persuasive communication did not significantly relate
to efficacy, change agents can still address efficacy utilizing the change message strategy of
enactive mastery. Utilizing a combination of persuasive communication and enactive mastery
change message strategies would enable change agents to address all five change beliefs.
This study adds to our knowledge of the role of the supervisor in influencing change
credibility in shaping change recipient beliefs. Relating to the influence of the dyadic
relationship between supervisor and subordinate, it was surprising to note that leader-member
exchange (LMX) did not prove to be significantly positively associated with the five change
beliefs. In fact, LMX was negatively significantly related the belief of discrepancy. A possible
explanation might be that an individual who has a strong relationship with their supervisor might
be happier with the status quo and less likely to see the need for any change. As such, change
agents would be cautioned against assuming a positive work relationship between a supervisor
and a subordinate will result in more favorable beliefs regarding organization changes.
This research adds to our knowledge regarding the internalization of supervisor beliefs by
subordinates. Our research found that subordinate change beliefs appear to be significantly
related to their supervisor’s change beliefs. Two of five change beliefs (appropriateness and
principal support) held by supervisors had positive relationships with corresponding beliefs held
by subordinates. This finding underscores the influence that supervisors may have on shaping
subordinate beliefs. The results are consistent with research that proposes that subordinates are
inclined to take on beliefs of their immediate supervisor, resulting from the acceptance of
supervisor beliefs as reality. Being aware of such influence suggests that change agents may
benefit from making extra efforts to ensure supervisors hold positive beliefs regarding the

75
change. However, the convergence of beliefs might also be the result of supervisors and their
subordinates being exposed to similar information and therefore making similar assessments.
Future research
The findings of this research provide insights that can help guide future research. While
the five change beliefs were able explain a large amount of variance (55%) in the emotional
dimension of felt pleasure, the beliefs explained smaller amounts of variance among discrete
emotions. Considering the complexity of Roseman’s (2001) framework, the limited ability of
change beliefs to explain discrete emotions should not be surprising as a number of different
beliefs beyond motive-consistency also shape emotional responses. While the five change
beliefs can assess motive consistency, they were not specifically written to capture other, more
nuanced dimensions of Roseman’s framework such as probability (uncertain/certain), control
potential (low/high); and agency (circumstances/other person/self caused). These other
dimensions provide information that allow for differentiation between discrete emotions such as
anger, fear, or guilt. Although change beliefs explained relatively less variance in predicting
discrete emotions as compared with the dimensional measure of pleasure, change beliefs still
explained a significant variance for almost all discrete emotions. Therefore, the five change
beliefs do offer value in explaining why change recipients experience particular emotions
regarding the change. Future research could incorporate improvements in measurements for
explaining why particular discrete emotions are experienced as a result of a change.
Additionally, it would be very beneficial to explore a number of additional discrete emotions
beyond those included in this study. In particular, emotions characterized by Roseman’s agency
characteristic of self attribution, such as pride and guilt, could provide some noteworthy insights.

76
While a significant amount of variance was explained by the change beliefs together as a
group, only one or two of the change beliefs were individually significant predictors of any given
discrete emotion. The change beliefs that were individually significant are very interesting to
note, especially for negative discrete emotions. Principal support was a significant predictor of
three of four negative discrete emotions, while it failed to predict any positive discrete emotions.
Future research could further explore whether certain change beliefs significantly predict only
change negative discrete emotions, while a different set of change beliefs tend to predict only
positive discrete emotions.
It is encouraging to note the change message strategy measures were not only confirmed
to be distinct dimensions, but provided a useful means of explaining beliefs held by change
recipients. With persuasive communication identified as a consistently significant predictor of
most change beliefs, there is an opportunity to further identify specific communication media
that would be most effective in influencing change beliefs.
Limitations
While the findings of this research provide a number of insights for researchers and
practitioners alike, several limitations should be acknowledged. One strong limitation is the
small sample size limiting statistical power. Additionally, while the change may have been
perceived as a challenging adjustment for the specific change recipients studied, the change did
not represent a fundamental change for the larger organization. Likewise, one characteristic of
the change was its discrete and mandatory nature; either an individual complied with the change
or not, with little discretion in performance allowed. As a result, the discrete nature of the
change did not allow for the full range of change-related attitudes to be reflected in a full range
of change adoption behaviors. This reflection would have been possible if behaviors were

77
allowed to be discretionary rather than mandatory. The impact of the timing of the study should
be noted as well. Change recipients were surveyed three months after the change was
implemented. As a result, the survey did not capture initial beliefs and reactions to the change,
but instead recorded later beliefs and reactions, the strength of which may have attenuated during
the adjustment to the change. Additionally, it should be noted that with the exception of
supervisor-subordinate change belief relationships, all significant relationships were found for
same-source data (change recipient self-report) therefore the possibility of common method
variance explanations cannot be discounted. Last, design of the study was cross-sectional design,
not longitudinal, which would have allowed for measurement of changes in variables over time.

78
References
Armenakis, A. A., & Bedeian, A. G. (1999). Organizational change: A review of theory and
research in the 1990s. Journal of Management, 25, 293-315.
Armenakis, A. A., Bedeian, A. G., & Niebuhr, R. E. (1979). Planning for organizational
intervention: The importance of existing socio-psychological situations in organizational
diagnosis. Group & Organization Management, 4, 59-70.
Armenakis, A. A., Bernerth, J. B., Pitts, J. P., & Walker, H. J. (2007). Organizational change
recipients' beliefs scale: Development of an assessment instrument. Journal of Applied
Behavioral Science, 43, 481-505.
Armenakis, A. A., & Harris, S. G. (2002). Crafting a change message to create transformational
readiness. Journal of Organizational Change Management, 15, 169-183.
Armenakis, A. A., & Harris, S. G. (2009). Reflections: Our journey in organizational change
research and practice. Journal of Change Management, 9, 127-142.
Armenakis, A. A., Harris, S. G., & Feild, H. S. (1999). Making change permanent: A model for
institutionalizing change. In W. Pasmore & R. Woodman (Eds.), Research in
organizational change and development (Vol. 12, pp. 97-128). Greenwich, Conn.: JAI
Press.
Armenakis, A. A., Harris, S. G., & Mossholder, K. W. (1993). Creating readiness for
organizational change. Human Relations, 46, 681-703.
Ashkanasy, N. M., Zerbe, W. J., & Hartel, C. E. J. (2002). Managing emotions in a changing
workplace. In N. M. Ashkanasy, W. J. Zerbe & C. E. J. Hartel (Eds.), Managing emotions
in the workplace (pp. 3-22). Armonk, N.Y.: M.E. Sharpe.

79
Avey, J. B., Wernsing, T. S., & Luthans, F. (2008). Can positive employees help positive
organizational change? Impact of psychological capital and emotions on relevant
attitudes and behaviors. The Journal of Applied Behavioral Science, 44, 48-70.
Bagozzi, R. P., Gopinath, M., & Nyer, P. U. (1999). The role of emotions in marketing. Journal
of the Academy of Marketing Science, 27, 184-206.
Bandura, A. (1977). Social learning theory. Englewood Cliffs, N.J.: Prentice Hall.
Bandura, A. (1982). Self-efficacy mechanism in human agency. American Psychologist, 37, 122-
147.
Bandura, A. (1997). Self-efficacy: The exercise of control. New York: W.H. Freeman.
Barger, P. B., & Grandey, A. A. (2006). Service with a smile and encounter satisfaction:
Emotional contagion and appraisal mechanisms. Academy of Management Journal, 49,
1229-1238.
Baron, R. A., & Richardson, D. R. (1994). Human aggression (2nd ed.). New York: Plenum
Press.
Bartunek, J. M. (1984). Changing interpretive schemes and organizational restructuring: The
example of a religious order. Administrative Science Quarterly, 29, 355-372.
Basch, J., & Fisher, C. D. (2000). Affective events-emotions matrix: A classification of work
events and associated emotions. In N. M. Ashkanasy, C. E. J. Härtel & W. J. Zerbe
(Eds.), Emotions in the workplace: Research, theory, and practice (pp. 36-48). Westport,
Conn.: Quorum Books.
Beck, A. T. (1976). Cognitive therapy and the emotional disorders. New York: International
Universities Press.
80
Bernerth, J. (2004). Expanding our understanding of the change message. Human Resource
Development Review, 3, 36-52.
Blau, P. M. (1964). Exchange and power in social life. New York,: J. Wiley.
Boies, K., & Howell, J. M. (2006). Leader-member exchange in teams: An examination of the
interaction between relationship differentiation and mean LMX in explaining team-level
outcomes. The Leadership Quarterly, 17, 246-257.
Bollen, K. A. (1989). Structural equations with latent variables. New York: Wiley.
Bollen, K. A., & Stine, R. A. (1992). Bootstrapping goodness-of-fit measures in structural
equation models. Sociological Methods Research, 21, 205-229.
Bradburn, N. M., & Noll, C. E. (1969). The structure of psychological well-being. Chicago:
Aldine.
Byrne, B. M. (2001). Structural equation modeling with AMOS: Basic concepts, applications,
and programming. Mahwah, N.J.: Lawrence Erlbaum Associates.
Campbell, D. J. (2000). The proactive employee: Managing workplace initiative. Academy of
Management Executive, 14, 52-66.
Cartwright, S., & Cooper, C. L. (1992). Mergers and acquisitions: The human factor. Boston:
Butterworth-Heinemann.
Carver, C. S., & Scheier, M. (1981). Attention and self-regulation: A control-theory approach to
human behavior. New York: Springer-Verlag.
Coch, L., & French, J. R. P., Jr. (1948). Overcoming resistance to change. Human Relations, 1,
512-532.
81
Cole, M., Harris, S., & Bernerth, J. (2006). Exploring the implications of vision, appropriateness,
and execution of organizational change. Leadership & Organization Development
Journal, 27, 352-367.
Compeau, D. R., & Higgins, C. A. (1995). Application of social cognitive theory to training for
computer skills. Information Systems Research, 6, 118-143.
Conlon, D., & Shapiro, D. (2002). Employee postings and company responses to downsizing
inquiries: Implications for managing and reacting to organizational change. Advances in
Qualitative Organization Research, 4, 39–67.
Cornelius, R. R. (1996). The science of emotion: Research and tradition in the psychology of
emotions. Upper Saddle River, N.J.: Prentice Hall.
Coyle-Shapiro, J. A. M., & Conway, N. (2005). Exchange relationships: Examining
psychological contracts and perceived organizational support. Journal of Applied
Psychology, 90, 774-781.
Deutsch, M., & Gerard, H. (1955). A study of normative and informational social influences
upon individual judgment. Journal of abnormal and social psychology, 51, 629-636.
Duck, J. D. (2001). The change monster: The human forces that fuel or foil corporate
transformation and change (1st ed.). New York: Crown Business.
Ekkekakis, P., Hall, E. E., & Petruzzello, S. J. (2005). Evaluation of the circumplex structure of
the activation deactivation adjective check list before and after a short walk. Psychology
of Sport and Exercise, 6, 83-101.
Elfenbein, H. A. (2007). Emotion in organizations: A review in stages. In A. P. Brief & J. P.
Walsh (Eds.), Academy of management annals (Vol. 1, pp. 315-386). Amsterdam:
Elsevier.
82
Freedman, J. L., Wallington, S. A., & Bless, E. (1967). Compliance without pressure: The effect
of guilt. Journal of Personality and Social Psychology, 7, 117-124.
Frijda, N. H. (1993). Moods, emotion episodes, and emotions. In M. Lewis & J. M. Haviland
(Eds.), Handbook of emotions (pp. 381-403). New York: Guilford.
Frijda, N. H., & Zeelenberg, M. (2001). Appraisal, what is the dependent? In K. R. Scherer, A.
Schorr & T. Johnstone (Eds.), Appraisal process in emotion (pp. 141-155). New York:
Cambridge University Press.
George, J. M., & Jones, G. R. (1997). Experiencing work: Values, attitudes, and moods. Human
Relations, 50, 393-416.
Gerstner, C. R., & Day, D. V. (1997). Meta-analytic review of leader-member exchange theory:
Correlates and construct issues. Journal of Applied Psychology, 82, 827-844.
Gist, M. E. (1987). Self-efficacy: Implications for organizational behavior and human resource
management. The Academy of Management Review, 12, 472-485.
Gist, M. E. (1988). The influence of training method and trainee age on the acquisition of
computer skills. Personnel Psychology, 41, 255-265.
Harris, S. G., & Gresch, E. B. (2008). The emotional implications of organizational change
sentiments. Paper presented at the 2008 Annual Meeting of the Academy of Management.
Harris, S. G., & Gresch, E. B. (2010). The emotions of change: Merger sentiments, pleasure and
emotional expression. In W. J. Zerbe, C. E. J. Hartel & N. M. Ashkanasy (Eds.), Reseach
on emotion in organizations (Vol. 6, pp. 189-220). Bingley, UK: Emerald Group
Publishing/JAI Press.
Herzberg, F. (1959). The motivation to work (2d ed.). New York,: Wiley.

83
Hofmann, D. A., Griffin, M. A., & Gavin, M. B. (2000). The application of hierarchical linear
modeling to organizational research. In K. J. Klein & S. W. J. Kozlowski (Eds.),
Multilevel theory, research, and methods in organizations (pp. 467–511). San Francisco:
Jossey-Bass.
Hofmann, D. A., Morgeson, F. P., & Gerras, S. J. (2003). Climate as a moderator of the
relationship between leader-member exchange and content specific citizenship: Safety
climate as an exemplar. Journal of Applied Psychology, 88, 170-178.
Huy, Q. N. (2002). Emotional balancing of organizational continuity and radical change: The
contribution of middle managers. Administrative Science Quarterly, 47, 31-69.
Jaffe, D. T., Scott, C. D., & Tobe, G. R. (1994). Rekindling commitment: How to revitalize
yourself, your work, and your organization. San Francisco: Jossey-Bass Publishers.
James, L. R., & Williams, L. J. (2000). The cross-level operator in regression, ancova, and
contextual analysis. In K. J. Klein & S. W. J. Kozlowski (Eds.), Multilevel theory,
research, and methods in organizations: Foundations, extensions, and new directions
(pp. 382-424). San Francisco: Jossey-Bass.
Jones, L., Watson, B., Hobman, E., Bordia, P., Gallois, C., & Callan, V. J. (2008). Employee
perceptions of organizational change: Impact of hierarchical level. Leadership &
Organization Development Journal, 29, 294 - 316.
Judson, A. S. (1991). Changing behavior in organizations: Minimizing resistance to change.
Cambridge, MA: Blackwell.
Kelman, H. C. (1958). Compliance, identification, and internalization: Three processes of
attitude change. The Journal of Conflict Resolution, 2, 51-60.
84
Kiefer, T. (2002). Analyzing emotions for a better understanding of organization change: Fear
joy, and anger during a merger. In N. M. Ashkanasy, W. J. Zerbe & C. E. J. Hartel (Eds.),
Managing emotions in the workplace (pp. 45-69). Armonk, N.Y.: M.E. Sharpe.
Kiefer, T. (2005). Feeling bad: Antecedents and consequences of negative emotions in ongoing
change. Journal of Organizational Behavior, 26, 875-897.
Kluger, A. N., Lewinsohn, S., & Aiello, J. R. (1994). The influence of feedback on mood: Linear
effects on pleasantness and curvilinear effects on arousal. Organizational Behavior and
Human Decision Processes, 60, 276-299.
Kotter, J. P. (1995). Leading change: Why transformation efforts fail. Harvard Business Review,
73, 59-67.
Kusstatscher, V., & Cooper, C. L. (2005). Managing emotions in mergers and acquisitions.
Cheltenham, UK: Edward Elgar.
Larkin, T. J., & Larkin, S. (1996). Reaching and changing frontline employees. [Article].
Harvard Business Review, 74(3), 95-104.
Larsen, R. J. (2000). Toward a science of mood regulation. Psychological Inquiry: An
International Journal for the Advancement of Psychological Theory, 11, 129 - 141.
Larsen, R. J., & Diener, E. (1992). Promises and problems with the circumplex model of
emotions. In M. S. Clark (Ed.), Review of personality and social psychology (Vol. 13, pp.
25-59). Beverly Hills, CA.: Sage Publications.
Lazarus, R. S. (1968). Emotions and adaptation: Conceptual and empirical relations. In W. J.
Arnold (Ed.), Nebraska symposium on motivation (Vol. 16, pp. 175-266). Lincoln:
University of Nebraska Press.
Lazarus, R. S. (1991a). Emotion and adaptation. New York: Oxford University Press.

85
Lazarus, R. S. (1991b). Progress on a cognitive-motivational-relational theory of emotion.
American Psychologist, 46, 819-834.
Lazarus, R. S. (2001). Relational meaning and discrete emotions. In K. R. Scherer, A. Schorr &
T. Johnstone (Eds.), Appraisal processes in emotion (pp. 37-67). New York: Oxford
University Press.
Lazarus, R. S., Averill, J. R., & Opton, E. M., Jr. (1970). Towards a cognitive theory of emotion.
In M. B. Arnold (Ed.), Feelings and emotions: The Loyola symposium (pp. 207-232).
New York: Academic Press.
Lemerise, E. A., & Arsenio, W. F. (2000). An integrated model of emotion processes and
cognition in social information processing. Child Development, 71, 107.
Liden, R. C., Sparrowe, R. T., & Wayne, S. J. (1997). Leader–member exchange theory: The
past and potential for the future. Research in Personnel and Human Resources
Management, 15, 47-119.
Lind, E. A., & van den Bos, K. (2002). When fairness works: Toward a general theory of
uncertainty management. Research in Organizational Behavior, 24, 181-223.
Little, T. D., Cunningham, W. A., Shahar, G., & Widaman, K. F. (2002). To parcel or not to
parcel: Exploring the question, weighing the merits. Structural Equation Modeling: A
Multidisciplinary Journal, 9, 151 - 173.
Liu, Y., & Perrewé, P. L. (2005). Another look at the role of emotion in the organizational
change: A process model. Human Resource Management Review, 15, 263-280.
Manstead, A. S., & Fischer, A., H. (2001). Social appraisal: The social world as object of and
influence on appraisal processes. In K. R. Scherer, A. Schorr & T. Johnstone (Eds.),

86
Appraisal processes in emotion: Theory, methods, research (pp. 221-232). Oxford:
Oxford University Press.
Mardia, K. V. (1970). Measures of multivariate skewness and kurtosis with applications.
Biometrika, 57, 517-530.
McHugh, M. (1997). The stress factor: Another item for the change management agenda?
Journal of Organizational Change Management, 10, 345 - 362.
Mehrabian, A., & Russell, J. A. (1974). An approach to environmental psychology. Cambridge:
M.I.T. Press.
Meichenbaum, D. H. (1977). Cognitive-behavioral modification: An integrative approach. New
York: Plenum Press.
Micceri, T. (1989). The unicorn, the normal curve, and other improbable creatures.
Psychological Bulletin, 105, 156-166.
Moody, R. W. (2010). Human resource management (11th ed.). Upper Saddle River, NJ:
Prentice Hall.
Morris, W., & Schnurr, P. (1989). Mood: The frame of mind: Springer-Verlag.
Moscovici, S. (1976). Social influence and social change. London: Academic Press.
Mossholder, K. W., Kemery, E. R., Harris, S. G., Armenakis, A. A., & Mcgrath, R. (1994).
Confounding constructs and levels of constructs in affectivity measurement: An empirical
investigation. Educational and Psychological Measurement, 54, 336-349.
Mossholder, K. W., Settoon, R. P., Armenakis, A. A., & Harris, S. G. (2000). Emotion during
organizational transformations: An interactive model of survivor reactions. Group &
Organization Management, 25, 220-243.

87
Nippa, M. (1996). Empirische untersuchung ausgewählter erfolgsmerkmale organisatorischer
veränderungsprozesse (Vol. 12). Freiberg: Freiberger Arbeitspapiere.
Nutt, P. C. (1986). Tactics of implementation. Academy of Management Journal, 29, 230-261.
Ornstein, R. E. (1991). The evolution of consciousness: Of Darwin, Freud, and cranial fire: The
origins of the way we think. New York: Prentice Hall Press.
Oswald, S. L., Mossholder, K. W., & Harris, S. G. (1994). Vision salience and strategic
involvement: Implications for psychological attachment to organization and job. Strategic
Management Journal, 15, 477-489.
Oswald, S. L., Mossholder, K. W., & Harris, S. G. (1997). Relations between strategic
involvement and managers' perceptions of environment and competitive strengths the
effect of vision salience. Group & Organization Studies (1986-1998), 22, 343.
Palmer, D. H. (2006). Sources of self-efficacy in a science methods course for primary teacher
education students. Research in Science Education, 36, 17.
Parsons, C. K., Liden, R. C., O'Connor, E. J., & Nagao, D. H. (1991). Employee responses to
technologically-driven change: The implementation of office automation in a service
organization. Human Relations, 44, 1331.
Paterson, J. M., & Hartel, C. E. J. (2002). An integrated affective and cognitive model to explain
employees' responses to downsizing. In N. M. Ashkanasy, W. J. Zerbe & C. E. J. Hartel
(Eds.), Managing emotions in the workplace (pp. 25-44). Armonk, N.Y.: M.E. Sharpe.
Paulsen, N., Callan, V., J., Grice, T. A., Rooney, D., Gallois, C., Jones, E., et al. (2005). Job
uncertainty and personal control during downsizing: A comparison of survivors and
victims. Human Relations, 58, 463.
88
Piderit, S. K. (2000). Rethinking resistance and recognizing ambivalence: A multidimensional
view of attitudes toward an organizational change. Academy of Management Review, 25,
783-794.
Raudenbush, S. W., & Bryk, A. S. (2002). Hierarchical linear models: Applications and data
analysis methods (2nd ed.). Thousand Oaks: Sage Publications.
Rice, R., & Aydin, C. (1991). Attitudes toward new organizational technology: Network
proximity as a mechanism for social information processing. Administrative Science
Quarterly, 36.
Richins, M. L. (1997). Measuring emotions in the consumption experience. Journal of Consumer
Research, 24, 127-146.
Roseman, I. J. (1984). Cognitive determinants of emotion: A structural theory. In P. Shaver
(Ed.), Review of personality and social psychology (Vol. 5, pp. 11-36). Beverly Hills,
CA: Sage Publications.
Roseman, I. J. (1996). Appraisal determinants of emotions: Constructing a more accurate and
comprehensive theory. Cognition & Emotion, 10, 241 - 278.
Roseman, I. J. (2001). A model of appraisal in the emotion system: Integrating theory, research
and applications. In K. R. Scherer, A. Schorr & T. Johnstone (Eds.), Appraisal process in
emotion: Theory, methods, research (pp. 68-91). New York: Oxford University Press.
Roseman, I. J., & Evdokas, A. (2004). Appraisals cause experienced emotions: Experimental
evidence. Cognition & Emotion, 18, 1-28.
Roseman, I. J., & Smith, C. A. (2001). Appraisal theory overview, assumptions, varieties,
controversies. In K. R. Scherer, A. Schorr & T. Johnstone (Eds.), Appraisal process in
emotion: Theory methods, research (pp. 3-19). New York: Oxford University Press.
89
Rosen, C. C., Harris, K. J., & Kacmar, K. M. (2010). LMX, context perceptions, and
performance: An uncertainty management perspective. Journal of Management, -.
Russell, J. A. (1980). A circumplex model of affect. Journal of Personality and Social
Psychology, 39, 1161-1178.
Russell, J. A. (1989). Measures of emotion. In R. Plutchik & H. Kellerman (Eds.), Emotion,
theory, research, and experience (Vol. 4, pp. 83-111). San Diego, CA: Academic Press.
Salancik, G. R., & Pfeffer, J. (1978). A social information processing approach to job attitudes
and task design. Administrative Science Quarterly, 23, 224-253.
Scheier, M. F., & Carver, C. S. (1985). Optimism, coping, and health: Assessment and
implications of generalized outcome expectancies. Health Psychology, 4, 219-247.
Scherer, K. R., Schorr, A., & Johnstone, T. (2001). Preface. In K. R. Scherer, A. Schorr & T.
Johnstone (Eds.), Appraisal processes in emotion (pp. vii-viii). New York: Oxford
University Press.
Schorr, A. (2001). Appraisal: The evolution of an idea. In K. R. Scherer, A. Schorr & T.
Johnstone (Eds.), Appraisal processes in emotion (pp. 20-34). New York: Oxford
University Press.
Schweiger, D. M., & Denisi, A. S. (1991). Communication with employees following a merger:
A longitudinal field experiment. Academy of Management Journal, 34, 110-135.
Siemer, M., Mauss, I., & Gross, J. J. (2007). Same situation--different emotions: How appraisals
shape our emotions. Emotion, 7, 592-600.
Slater, M. D., & Rouner, D. (1992). Confidence in beliefs about social groups as an outcome of
message exposure and its role in belief change persistence. Communication Research, 19,
597-617.
90
Tompson, G. H., & Dass, P. (2000). Improving students’ self-efficacy in strategic management:
The relative impact of cases and simulations. Simulation & Gaming, 31, 22-41.
Varma, V., & Harris, S. G. (2008). An empirical examination of the relation between merger
communication and post-merger identification. Paper presented at the 2008 meeting of
the Academy of Management.
Venkatesh, V., & Davis, F. D. (2000). A theoretical extension of the technology acceptance
model: Four longitudinal field studies. Management Science, 46, 186-204.
Wallington, S. A. (1973). Consequences of transgression: Self-punishment and depression.
Journal of Personality and Social Psychology, 28, 1-7.
Warshaw, P. R. (1980). A new model for predicting behavioral intentions: An alternative to
Fishbein. Journal of Marketing Research (JMR), 17, 153-172.
Watson, D., Clark, L. A., & Tellegen, A. (1988). Development and validation of brief measures
of positive and negative affect: The panas scales. Journal of Personality and Social
Psychology, 54, 1063-1070.
Watson, D., & Tellegen, A. (1985). Toward a consensual structure of mood. Psychological
Bulletin, 98, 219-235.
Weick, K. E. (1984). Small wins: Redefining the scale of social problems. American
Psychologist, 39, 40-49.
Weiss, H. M. (2002a). Conceptual and empirical foundations for the study of affect at work. In
R. G. Lord, R. J. Klimoski & R. Kanfer (Eds.), Emotions in the workplace:
Understanding the structure and role of emotions in organizational behavior (1st ed., pp.
20-63). San Francisco: Jossey-Bass.

91
Weiss, H. M. (2002b). Deconstructing job satisfaction: Separating evaluations, beliefs and
affective experiences. Human Resource Management Review, 12, 173-194.
Weiss, H. M., & Cropanzano, R. (1996). Affective events theory: A theoretical discussion of the
structure, causes and consequences of affective experiences at work. In B. Straw & L.
Cummings (Eds.), Research in organization behavior: An annual series of analytical
essays and critical reviews (Vol. 18, pp. 1-74). Greenwich, CT: JAI.
Weiss, H. M., Nicholas, J. P., & Daus, C. S. (1999). An examination of the joint effects of
affective experiences and job beliefs on job satisfaction and variations in affective
experiences over time. Organizational Behavior and Human Decision Processes, 78, 1-
24.
Weiss, H. M., Suckow, K., & Cropanzano, R. (1999). Effects of justice conditions on discrete
emotions. Journal of Applied Psychology, 84, 786-794.
West, S. G., Finch, J. F., & Curran, P. J. (1995). Structural equations with nonnormal variables:
Problems and remedies. In R. H. Hoyle (Ed.), Structural equation modeling: Concepts,
issues, and applications (pp. 56-75). Thousand Oaks, CA: Sage Publications.
Wood, R., & Bandura, A. (1989). Social cognitive theory of organizational management.
Academy of Management Review, 14, 361-384.
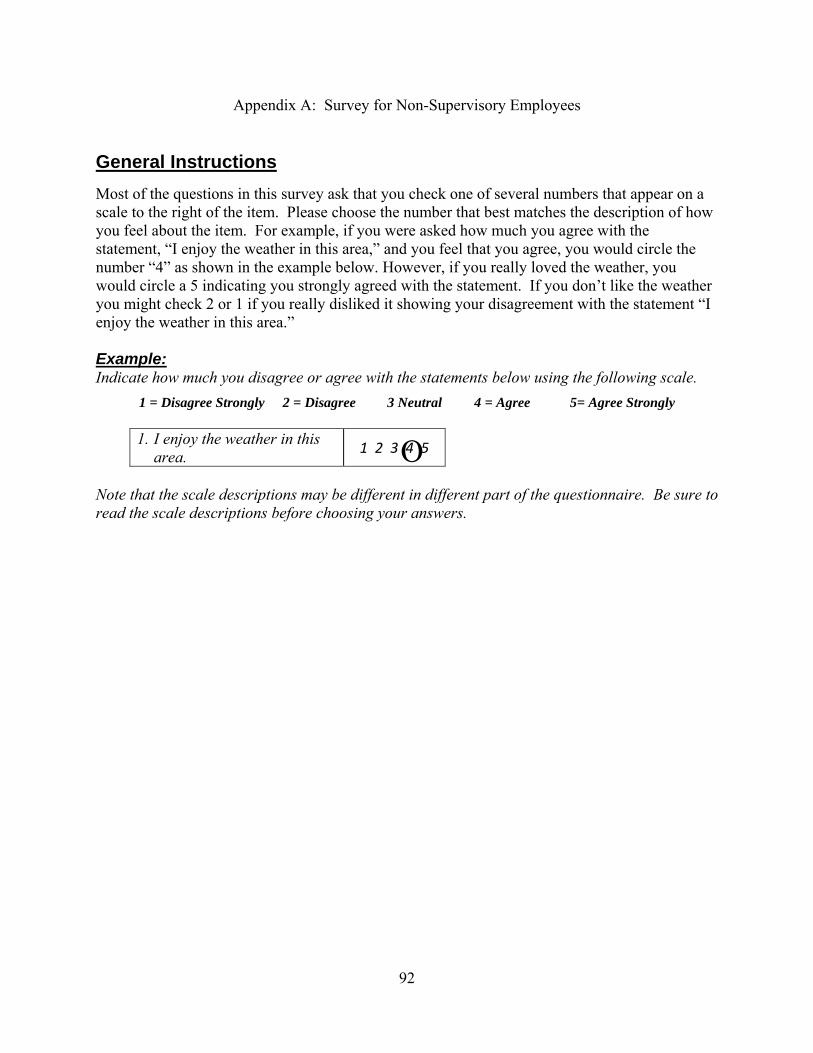
92
Appendix A: Survey for Non-Supervisory Employees
General Instructions
Most of the questions in this survey ask that you check one of several numbers that appear on a scale to the right of the item. Please choose the number that best matches the description of how you feel about the item. For example, if you were asked how much you agree with the statement, “I enjoy the weather in this area,” and you feel that you agree, you would circle the number “4” as shown in the example below. However, if you really loved the weather, you would circle a 5 indicating you strongly agreed with the statement. If you don’t like the weather you might check 2 or 1 if you really disliked it showing your disagreement with the statement “I enjoy the weather in this area.” Example: Indicate how much you disagree or agree with the statements below using the following scale.
1 = Disagree Strongly 2 = Disagree 3 Neutral 4 = Agree 5= Agree Strongly
1. I enjoy the weather in this area.
1 2 3 4 5
Note that the scale descriptions may be different in different part of the questionnaire. Be sure to read the scale descriptions before choosing your answers.
O

93
Change to Web-based Time Sheets (eTime) In August, (University Name) switched to eTIME, a time reporting system using the ADP system. The purpose of this survey is to gather your opinions of the switch from paper-based timesheets to eTIME electronic timesheets entered by computer. We want to get your opinions on all aspects of the change including training and support. Please circle the number that represents how much you disagree or agree with each statement referring to eTIME, your supervisor, and yourself.
1 = Disagree Strongly 2 = Disagree 3 Neutral 4 = Agree 5= Agree Strongly
1. A change was needed to improve the way time was reported.
1 2 3 4 5 14. eTIME allows me to record
my time more accurately. 1 2 3 4 5
2. We needed to improve how we were reporting our time
1 2 3 4 5 15. It is more convenient for me to
enter my time using eTIME. 1 2 3 4 5
3. We needed to change the way we did some things in reporting of our time.
1 2 3 4 5 16. I know how to enter my hours
on eTIME. 1 2 3 4 5
4. We needed to improve our effectiveness by changing the way we reported our time.
1 2 3 4 5 17. I can do a good job of entering
my hours using eTIME. 1 2 3 4 5
5. The change to eTIME is correct for (University Name).
1 2 3 4 5 18. It is easy for me to enter my
time using eTIME. 1 2 3 4 5
6. When I think about the change to eTIME, I realize it is right for (University Name).
1 2 3 4 5 19. (University Name) is doing a
good job of changing to eTIME.
1 2 3 4 5
7. The change to eTIME is best for (University Name)’s situation.
1 2 3 4 5 20. (University Name) is
successfully getting everyone to use the new eTIME system.
1 2 3 4 5
8. The change in how we report our time will improve (University Name)’s performance.
1 2 3 4 5 21. Most of the co-workers I
respect want the change to eTIME to work.
1 2 3 4 5
9. I believe the change to eTIME is good for (University Name).
1 2 3 4 5 22. Most of my co-workers like the
change to eTIME. 1 2 3 4 5
10. The new way of entering our time is better than how we used to do it.
1 2 3 4 5 23. My direct supervisor wants me
to support the change to eTIME.
1 2 3 4 5
11. The change in how I enter my time makes me feel good about myself.
1 2 3 4 5 24. My direct supervisor is in favor
of the change to eTIME. 1 2 3 4 5
12. The change to entering my own time using eTIME will be good for me.
1 2 3 4 5
25. The top leaders at (University Name) are leading by example when it comes to implementing eTIME.
1 2 3 4 5
13. Entering my own time using eTIME makes me feel better about my job.
1 2 3 4 5 26. The top leaders support the
change to eTIME. 1 2 3 4 5
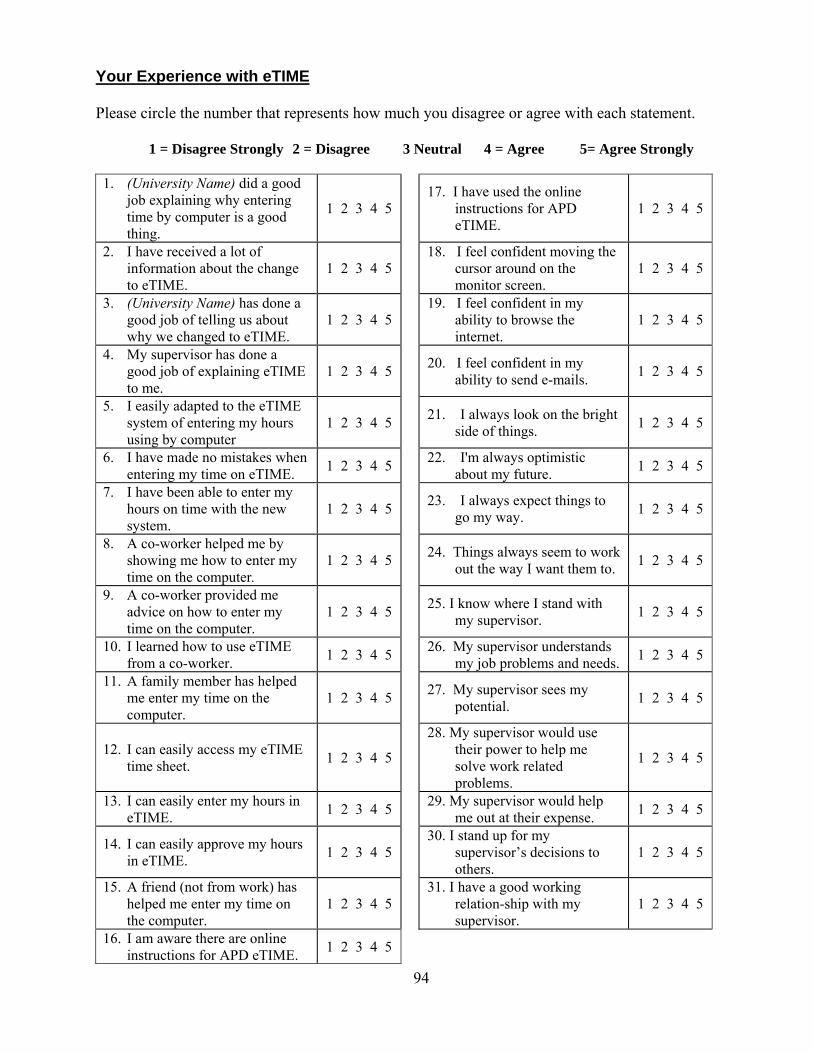
94
Your Experience with eTIME Please circle the number that represents how much you disagree or agree with each statement.
1 = Disagree Strongly 2 = Disagree 3 Neutral 4 = Agree 5= Agree Strongly
1. (University Name) did a good job explaining why entering time by computer is a good thing.
1 2 3 4 5 17. I have used the online
instructions for APD eTIME.
1 2 3 4 5
2. I have received a lot of information about the change to eTIME.
1 2 3 4 5 18. I feel confident moving the
cursor around on the monitor screen.
1 2 3 4 5
3. (University Name) has done a good job of telling us about why we changed to eTIME.
1 2 3 4 5 19. I feel confident in my
ability to browse the internet.
1 2 3 4 5
4. My supervisor has done a good job of explaining eTIME to me.
1 2 3 4 5 20. I feel confident in my
ability to send e-mails. 1 2 3 4 5
5. I easily adapted to the eTIME system of entering my hours using by computer
1 2 3 4 5 21. I always look on the bright
side of things. 1 2 3 4 5
6. I have made no mistakes when entering my time on eTIME.
1 2 3 4 5 22. I'm always optimistic
about my future. 1 2 3 4 5
7. I have been able to enter my hours on time with the new system.
1 2 3 4 5 23. I always expect things to
go my way. 1 2 3 4 5
8. A co-worker helped me by showing me how to enter my time on the computer.
1 2 3 4 5 24. Things always seem to work
out the way I want them to. 1 2 3 4 5
9. A co-worker provided me advice on how to enter my time on the computer.
1 2 3 4 5 25. I know where I stand with
my supervisor. 1 2 3 4 5
10. I learned how to use eTIME from a co-worker.
1 2 3 4 5 26. My supervisor understands
my job problems and needs. 1 2 3 4 5
11. A family member has helped me enter my time on the computer.
1 2 3 4 5 27. My supervisor sees my
potential. 1 2 3 4 5
12. I can easily access my eTIME time sheet.
1 2 3 4 5
28. My supervisor would use their power to help me solve work related problems.
1 2 3 4 5
13. I can easily enter my hours in eTIME.
1 2 3 4 5 29. My supervisor would help
me out at their expense. 1 2 3 4 5
14. I can easily approve my hours in eTIME.
1 2 3 4 5 30. I stand up for my
supervisor’s decisions to others.
1 2 3 4 5
15. A friend (not from work) has helped me enter my time on the computer.
1 2 3 4 5 31. I have a good working
relation-ship with my supervisor.
1 2 3 4 5
16. I am aware there are online instructions for APD eTIME.
1 2 3 4 5

95
How Do You Feel About the Change? When you think about the change to eTIME, how does it make you feel? Please circle the number that represents the how much you disagree or agree with each statement.
1 = Not at all 2= A little 3= Moderately 4= Quite a bit 5= Extremely
1. Frustrated 1 2 3 4 5 13. Scared 1 2 3 4 5
2. Angry 1 2 3 4 5 14. Afraid 1 2 3 4 5
3. Irritated 1 2 3 4 5 15. Panicky 1 2 3 4 5
4. Optimistic 1 2 3 4 5 16. Excited 1 2 3 4 5
5. Encouraged 1 2 3 4 5 17. Thrilled 1 2 3 4 5
6. Hopeful 1 2 3 4 5 18. Enthusiastic 1 2 3 4 5
7. Depressed 1 2 3 4 5 19. Nervous 1 2 3 4 5
8. Sad 1 2 3 4 5 20. Worried 1 2 3 4 5
9. Miserable 1 2 3 4 5 21. Tense 1 2 3 4 5
10. Happy 1 2 3 4 5 22. Surprised 1 2 3 4 5
11. Pleased 1 2 3 4 5 23. Amazed 1 2 3 4 5
12. Joyful 1 2 3 4 5 24. Astonished 1 2 3 4 5
Now think about the mood the change to eTIME puts you in; then describe your feelings using the adjective pairs below. Some of the pairs might seem unusual, but you’ll probably feel more one way than the other. So for each pair, put a single check mark in the space that best describes your feelings. Check marks closer to one word or the other indicates your feelings are very close to that word. Check marks made in the middle indicate you don’t feel very strongly regarding those emotions. For example in the word pair below, if thinking about the switch to e-time makes you feel much more glad than depressed, you would put a check mark closer to glad.
Glad : : : : : : : : Depressed
1. Happy : : : : : : : : Unhappy 2. Pleased : : : : : : : : Displeased 3. Satisfied : : : : : : : : Unsatisfied 4. Contented : : : : : : : : Discontented 5. Hopeful : : : : : : : : Despairing 6. Relaxed : : : : : : : : Bored 7. Calm : : : : : : : : Excited 8. Sluggish : : : : : : : : Frenzied 9. Dull : : : : : : : : Jittery 10. Sleepy : : : : : : : : Wide-awake 11. Relaxed : : : : : : : : Stimulated

96
Training related to the Change
How many formal eTIME training sessions offered by Human Resources did you attend? 0 1 2 more than 2
If you attended at least one formal training session offered by Human Resources regarding eTIME in July or August, please answer the next eight questions. If you did not attend training, proceed to the next section, entitled “A Little Bit About Yourself).
1 = Disagree Strongly 2 = Disagree 3 Neutral 4 = Agree 5= Agree Strongly
1. The eTIME training was helpful.
1 2 3 4 5 5. I would have preferred
more “hands-on” training. 1 2 3 4 5
2. After training, I understood what I needed to do to use eTIME.
1 2 3 4 5 6. The training offered for
eTIME was good. 1 2 3 4 5
3. eTIME training answered all my questions about the new system.
1 2 3 4 5 7. Right after the training
session, I felt I like I still needed more training.
1 2 3 4 5
4. (University Name) offered plenty of eTIME training opportunities.
1 2 3 4 5 8. I feel like I still need more
training in eTIME. 1 2 3 4 5
If the training session you attended included a “hands on” training session in a computer lab where you got to practice entering your time, please answer the following 3 questions. 1. It was helpful to go
through the process of entering my time at the computer lab.
1 2 3 4 5
3. After entering my timesheets in the lab, I felt more confident in how to enter my time.
1 2 3 4 5
2. I felt more certain I could enter my time correctly after the “hands on” training.
1 2 3 4 5

97
A Little Bit About Yourself Please let us know a little bit more about yourself by completing the items below. 1. About how long have you worked at (University Name)? ____ years __months
Please indicate how frequently you use a computer at work and at home using the scale below. 1 = Never 2= Once a month or less 3= Once a week or less 4= Several Times a week 5= everyday 1. Prior to eTIME, how
often did you use a computer at work?
1 2 3 4 5 2. Prior to eTIME, how
often did you use a computer at work?
1 2 3 4 5
Please use the scale below in responding to the next set of items. 1 = Never 2= infrequently 3= Sometimes 4= Often 5= Very often I believe my direct supervisor… 1. Acts without
considering individual’s feelings.
1 2 3 4 5 4. Leads by example. 1 2 3 4 5
2. Provides individuals with new ways of looking at puzzling things.
1 2 3 4 5 5. Behaves in a way that is
thoughtful of staff’s personal needs.
1 2 3 4 5
3. Encourages employees to be team players.
1 2 3 4 5 6. Develops a team attitude
and spirit among his/her employees
1 2 3 4 5
Please indicate how much you agree or disagree with the statements below using this scale.
1 = Disagree Strongly 2 = Disagree 3 Neutral 4 = Agree 5= Agree Strongly I see myself as:
1. Extraverted, enthusiastic 1 2 3 4 5 6. Reserved, quiet 1 2 3 4 5
2. Critical, quarrelsome 1 2 3 4 5 7. Sympathetic, warm 1 2 3 4 5
3. Dependable, self-disciplined
1 2 3 4 5 8. Disorganized, careless 1 2 3 4 5
4. Anxious, easily upset 1 2 3 4 5 9. Calm, emotionally stable 1 2 3 4 5
5. Open to new experiences, complex
1 2 3 4 5 10. Conventional, uncreative 1 2 3 4 5

98
In Your Own Words
1. What are your three (3) most important suggestions for improvement that should be considered as we move forward using the eTIME system?
2. Do you have any suggestions about how other changes that come along could be better carried out?

99
Appendix B: Survey for Supervisors
General Instructions
Most of the questions in this survey ask that you check one of several numbers that appear on a scale to the right of the item. Please choose the number that best matches the description of how you feel about the item. For example, if you were asked how much you agree with the statement, “I enjoy the weather in this area,” and you feel that you agree, you would circle the number “4” as shown in the example below. However, if you really loved the weather, you would circle a 5 indicating you strongly agreed with the statement. If you don’t like the weather you might check 2 or 1 if you really disliked it showing your disagreement with the statement “I enjoy the weather in this area.” Example: Indicate how much you disagree or agree with the statements below using the following scale.
1 = Disagree Strongly 2 = Disagree 3 Neutral 4 = Agree 5= Agree Strongly
2. I enjoy the weather in this area.
1 2 3 4 5
Note that the scale descriptions may be different in different part of the questionnaire. Be sure to read the scale descriptions before choosing your answers.
O

100
Change to Web-based Time Sheets (eTIME) In August, (University Name) switched to eTIME, a time reporting system supported by ADP. The purpose of this survey is to gather your opinions regarding the switch from paper-based timesheets to eTIME electronic timesheets entered by computer. We want to get your opinions on all aspects of the change including training and support. Please circle the number that represents how much you disagree or agree with each statement referring to eTIME, your supervisor, and yourself.
1 = Disagree Strongly 2 = Disagree 3 Neutral 4 = Agree 5= Agree Strongly 1. A change was needed to improve
the way time was reported. 1 2 3 4 5
14. eTIME allows me to record my time more accurately.
1 2 3 4 5
2. We needed to improve how we were reporting our time
1 2 3 4 5 15. It is more convenient for me
to enter my time using eTIME.
1 2 3 4 5
3. We needed to change the way we did some things in reporting of our time.
1 2 3 4 5 16. I know how to enter my hours
on eTIME. 1 2 3 4 5
4. We needed to improve our effectiveness by changing the way we reported our time.
1 2 3 4 5 17. I can do a good job of entering
my hours using eTIME. 1 2 3 4 5
5. The change to eTIME is correct for (University Name).
1 2 3 4 5 18. It is easy for me to enter my
time using eTIME. 1 2 3 4 5
6. When I think about the change to eTIME, I realize it is right for (University Name).
1 2 3 4 5 19. (University Name) is doing a
good job of changing to eTIME.
1 2 3 4 5
7. The change to eTIME is best for (University Name)’s situation.
1 2 3 4 5 20. (University Name) is
successfully getting everyone to use the new eTIME system.
1 2 3 4 5
8. The change in how we report our time will improve (University Name)’s performance.
1 2 3 4 5 21. Most of the co-workers I
respect want the change to eTIME to work.
1 2 3 4 5
9. I believe the change to eTIME is good for (University Name).
1 2 3 4 5 22. Most of my co-workers like
the change to eTIME. 1 2 3 4 5
10. The new way of entering our time is better than how we used to do it.
1 2 3 4 5 23. My direct supervisor wants me
to support the change to eTIME.
1 2 3 4 5
11. The change in how I enter my time makes me feel good about myself.
1 2 3 4 5 24. My direct supervisor is in
favor of the change to eTIME. 1 2 3 4 5
12. The change to entering my own time using eTIME will be good for me.
1 2 3 4 5
25. The top leaders at (University Name) are leading by example when it comes to implementing eTIME.
1 2 3 4 5
13. Entering my own time using eTIME makes me feel better about my job.
1 2 3 4 5 26. The top leaders support the
change to eTIME. 1 2 3 4 5

101
Your Experience with eTIME Please circle the number that represents how much you disagree or agree with each statement.
1 = Disagree Strongly 2 = Disagree 3 Neutral 4 = Agree 5= Agree Strongly
1. The university did a good job explaining why entering time by computer is a good thing.
1 2 3 4 5 7. I feel confident in my
ability to browse the internet.
1 2 3 4 5
2. I have received a lot of information about the change to eTIME.
1 2 3 4 5 8. I feel confident in my
ability to send e-mails. 1 2 3 4 5
3. (University Name) has done a good job of telling us about why we changed to eTIME.
1 2 3 4 5 9. I always look on the
bright side of things. 1 2 3 4 5
4. I am aware there are online instructions for APD eTIME.
1 2 3 4 5 10. I'm always optimistic
about my future. 1 2 3 4 5
5. I have used the online instructions for APD eTIME.
1 2 3 4 5 11. I always expect things to
go my way. 1 2 3 4 5
6. I feel confident moving the cursor around on the monitor screen.
1 2 3 4 5 12. Things always seem to
work out the way I want them to.
1 2 3 4 5
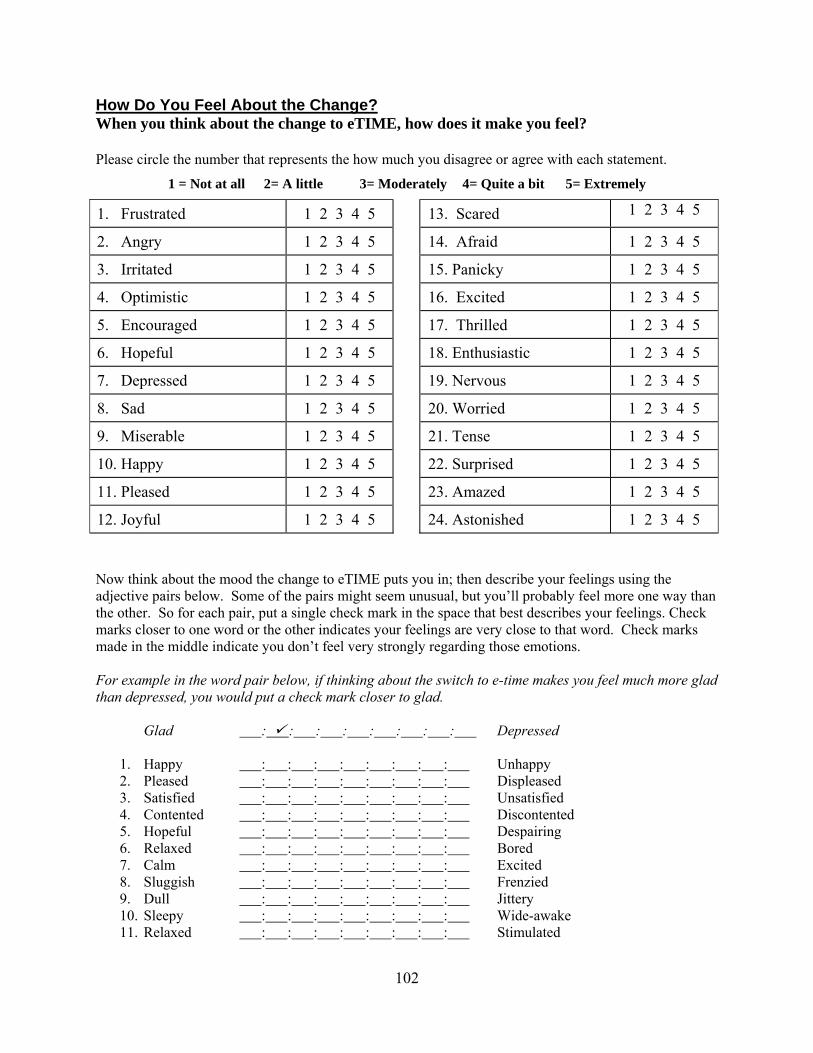
102
How Do You Feel About the Change? When you think about the change to eTIME, how does it make you feel? Please circle the number that represents the how much you disagree or agree with each statement.
1 = Not at all 2= A little 3= Moderately 4= Quite a bit 5= Extremely
1. Frustrated 1 2 3 4 5 13. Scared 1 2 3 4 5
2. Angry 1 2 3 4 5 14. Afraid 1 2 3 4 5
3. Irritated 1 2 3 4 5 15. Panicky 1 2 3 4 5
4. Optimistic 1 2 3 4 5 16. Excited 1 2 3 4 5
5. Encouraged 1 2 3 4 5 17. Thrilled 1 2 3 4 5
6. Hopeful 1 2 3 4 5 18. Enthusiastic 1 2 3 4 5
7. Depressed 1 2 3 4 5 19. Nervous 1 2 3 4 5
8. Sad 1 2 3 4 5 20. Worried 1 2 3 4 5
9. Miserable 1 2 3 4 5 21. Tense 1 2 3 4 5
10. Happy 1 2 3 4 5 22. Surprised 1 2 3 4 5
11. Pleased 1 2 3 4 5 23. Amazed 1 2 3 4 5
12. Joyful 1 2 3 4 5 24. Astonished 1 2 3 4 5
Now think about the mood the change to eTIME puts you in; then describe your feelings using the adjective pairs below. Some of the pairs might seem unusual, but you’ll probably feel more one way than the other. So for each pair, put a single check mark in the space that best describes your feelings. Check marks closer to one word or the other indicates your feelings are very close to that word. Check marks made in the middle indicate you don’t feel very strongly regarding those emotions. For example in the word pair below, if thinking about the switch to e-time makes you feel much more glad than depressed, you would put a check mark closer to glad.
Glad : : : : : : : : Depressed
1. Happy : : : : : : : : Unhappy 2. Pleased : : : : : : : : Displeased 3. Satisfied : : : : : : : : Unsatisfied 4. Contented : : : : : : : : Discontented 5. Hopeful : : : : : : : : Despairing 6. Relaxed : : : : : : : : Bored 7. Calm : : : : : : : : Excited 8. Sluggish : : : : : : : : Frenzied 9. Dull : : : : : : : : Jittery 10. Sleepy : : : : : : : : Wide-awake 11. Relaxed : : : : : : : : Stimulated

103
Training related to the Change How many formal eTIME training sessions offered by Human Resources did you attend?
0 1 2 more than 2
If you attended at least one formal training session offered by Human Resources regarding eTIME in July or August, please answer the next eight questions. If you did not attend training, proceed to the next section, entitled “A Little Bit About Yourself).
1 = Disagree Strongly 2 = Disagree 3 Neutral 4 = Agree 5= Agree Strongly
1. The eTIME training was helpful.
1 2 3 4 5 5. I would have preferred
more “hands-on” training.
1 2 3 4 5
2. After training, I understood what I needed to do to use eTIME.
1 2 3 4 5 6. The training offered for
eTIME was good. 1 2 3 4 5
3. eTIME training answered all my questions about the new system.
1 2 3 4 5 7. Right after the training
session, I felt I like I still needed more training.
1 2 3 4 5
4. (University Name) offered plenty of eTIME training opportunities.
1 2 3 4 5 8. I feel like I still need
more training in eTIME. 1 2 3 4 5
If the training session you attended included a “hands on” training session in a computer lab where you got to practice entering your time, please answer the following 3 questions. 1. It was helpful to go
through the process of entering my time at the computer lab.
1 2 3 4 5
3. After entering my timesheets in the lab, I felt more confident in how to enter my time.
1 2 3 4 5
2. I felt more certain I could enter my time correctly after the “hands on” training.
1 2 3 4 5

104
A Little Bit About Yourself Please let us know a little bit more about yourself by completing the items below. 1. About how long have you worked at (University Name)? ____ years __months
Please indicate how frequently you use a computer at work and at home using the scale below.
1 = Never 2= Once a month or less 3= Once a week or less 4= Several Times a week 5= everyday
2. Prior to eTIME, how often did you use a computer at work?
1 2 3 4 5 2. Prior to eTIME, how
often did you use a computer at work?
1 2 3 4 5
Please use the scale below in responding to the next set of items.
1 = Never 2= infrequently 3= Sometimes 4= Often 5= Very often
I believe my direct supervisor…
4. Acts without considering individual’s feelings.
1 2 3 4 5 4. Leads by example. 1 2 3 4 5
5. Provides individuals with new ways of looking at puzzling things.
1 2 3 4 5 5. Behaves in a way that is
thoughtful of staff’s personal needs.
1 2 3 4 5
6. Encourages employees to be team players.
1 2 3 4 5 6. Develops a team attitude
and spirit among his/her employees
1 2 3 4 5
Please indicate how much you agree or disagree with the statements below using this scale.
1 = Disagree Strongly 2 = Disagree 3 Neutral 4 = Agree 5= Agree Strongly
I see myself as:
6. Extraverted, enthusiastic 1 2 3 4 5 6. Reserved, quiet 1 2 3 4 5
7. Critical, quarrelsome 1 2 3 4 5 7. Sympathetic, warm 1 2 3 4 5
8. Dependable, self-disciplined
1 2 3 4 5 8. Disorganized, careless 1 2 3 4 5
9. Anxious, easily upset 1 2 3 4 5 9. Calm, emotionally stable 1 2 3 4 5
10. Open to new experiences, complex
1 2 3 4 5 10. Conventional, uncreative 1 2 3 4 5
105
In Your Own Words 1. What are your three (3) most important suggestions for improvement
that should be considered as we move forward using the eTIME system?
2. Do you have any suggestions about how other changes that come along could be better implemented?
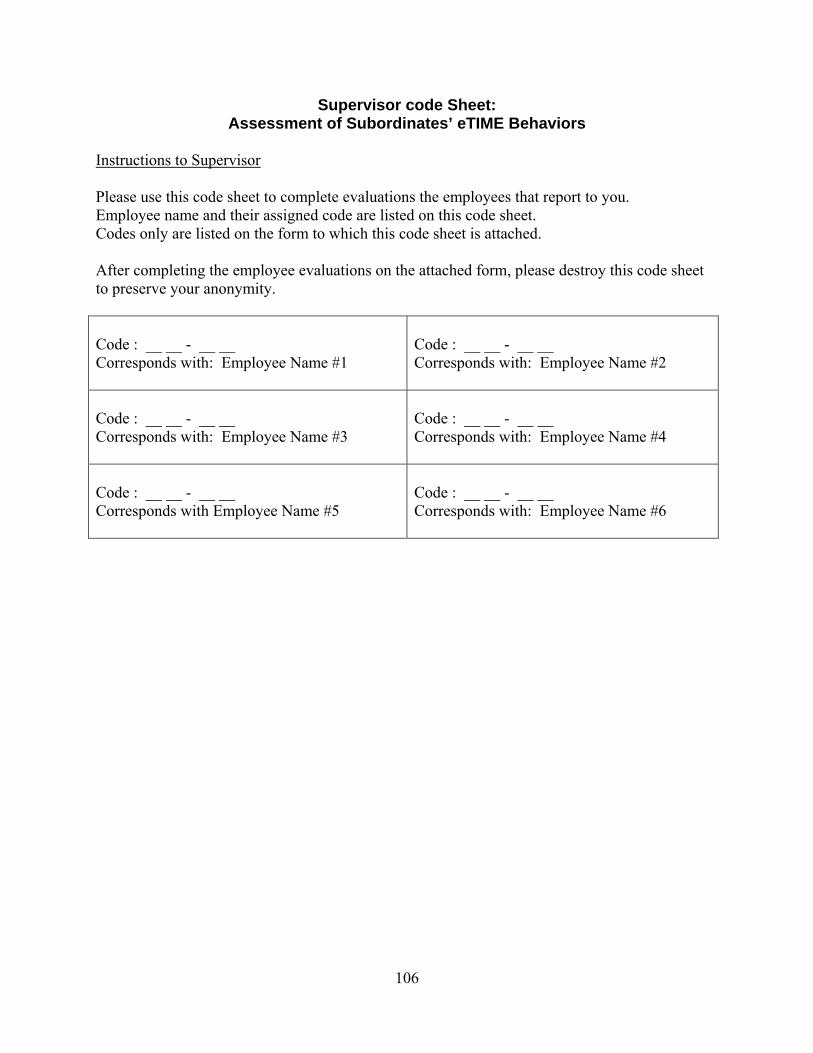
106
Supervisor code Sheet: Assessment of Subordinates’ eTIME Behaviors
Instructions to Supervisor Please use this code sheet to complete evaluations the employees that report to you. Employee name and their assigned code are listed on this code sheet. Codes only are listed on the form to which this code sheet is attached. After completing the employee evaluations on the attached form, please destroy this code sheet to preserve your anonymity. Code : __ __ - __ __ Corresponds with: Employee Name #1
Code : __ __ - __ __ Corresponds with: Employee Name #2
Code : __ __ - __ __ Corresponds with: Employee Name #3
Code : __ __ - __ __ Corresponds with: Employee Name #4
Code : __ __ - __ __ Corresponds with Employee Name #5
Code : __ __ - __ __ Corresponds with: Employee Name #6

107
Questions for Supervisors Regarding Subordinates’ eTIME Behaviors Please indicate how much you agree or disagree with the statements below using this scale.
1 = Disagree Strongly 2 = Disagree 3 Neutral 4 = Agree 5= Agree Strongly
Subordinate #1 code here Subordinate #2 code here 1. Consistently submits
timesheets on time using eTIME.
1 2 3 4 5 1. Consistently submits
timesheets on time using eTIME.
1 2 3 4 5
2. Consistently reports time correctly using eTIME.
1 2 3 4 5 2. Consistently reports hours correctly using eTIME.
1 2 3 4 5
3. Made the transition to eTIME easily.
1 2 3 4 5 3. Made the transition to eTIME easily.
1 2 3 4 5
4. Had difficultly adapting to eTIME.
1 2 3 4 5 4. Had difficultly adapting to eTIME.
1 2 3 4 5
5. I’ve had to help this person a lot with their eTIME submission.
1 2 3 4 5 5. I’ve had to help this person a
lot with their eTIME submission.
1 2 3 4 5
Subordinate #3 code here Subordinate #4 code here 1. Consistently submits
timesheets on time using eTIME.
1 2 3 4 5 1. Consistently submits
timesheets on time using eTIME.
1 2 3 4 5
2. Consistently reports hours correctly using eTIME.
1 2 3 4 5 2. Consistently reports hours correctly using eTIME.
1 2 3 4 5
3. Made the transition to eTIME easily.
1 2 3 4 5 3. Made the transition to eTIME easily.
1 2 3 4 5
4. Had difficultly adapting to eTIME.
1 2 3 4 5 4. Had difficultly adapting to eTIME.
1 2 3 4 5
5. I’ve had to help this person a lot with their eTIME submission.
1 2 3 4 5 5. I’ve had to help this person a
lot with their eTIME submission.
1 2 3 4 5
Subordinate #5 code here Subordinate #6 code here
1. Consistently submits timesheets on time using eTIME.
1 2 3 4 5 1. Consistently submits
timesheets on time using eTIME.
1 2 3 4 5
2. Consistently reports hours correctly using eTIME.
1 2 3 4 5 2. Consistently reports hours correctly using eTIME.
1 2 3 4 5
3. Made the transition to eTIME easily.
1 2 3 4 5 3. Made the transition to eTIME easily.
1 2 3 4 5
4. Had difficultly adapting to eTIME.
1 2 3 4 5 4. Had difficultly adapting to eTIME.
1 2 3 4 5
5. I’ve had to help this person a lot with their eTIME submission.
1 2 3 4 5 5. I’ve had to help this person a
lot with their eTIME submission.
1 2 3 4 5
Thank you for your participation in this survey!

108
Appendix C: Revised Items for LMX and OCRBS scales
LMX 7 - Original Items LMX 7 Revised items Flesch reading ease – 56.4 Flesch reading ease – 60.6 Flesch grade level – 7.8 Flesch grade level – 6.9
Original Items Revised Items 1. I know where I stand with my supervisor. 2. My supervisor understands my job
problems and needs. 3. My supervisor recognizes my potential. 4. My supervisor would use his/her power to
help me solve work related problems. 5. My supervisor would “bail me out” at
his/her expense. 6. I defend and justify my supervisor
decisions when he/she is not present to do so.
7. I have an effective working relationship with my supervisor.
1. no changes 2. no changes
3. no changes 4. My supervisor would use their power to
help me solve work related problems 5. My supervisor would help me out at their
expense 6. I stand up for my supervisor’s decisions to
others
7. I have a good working relationship with my supervisor.
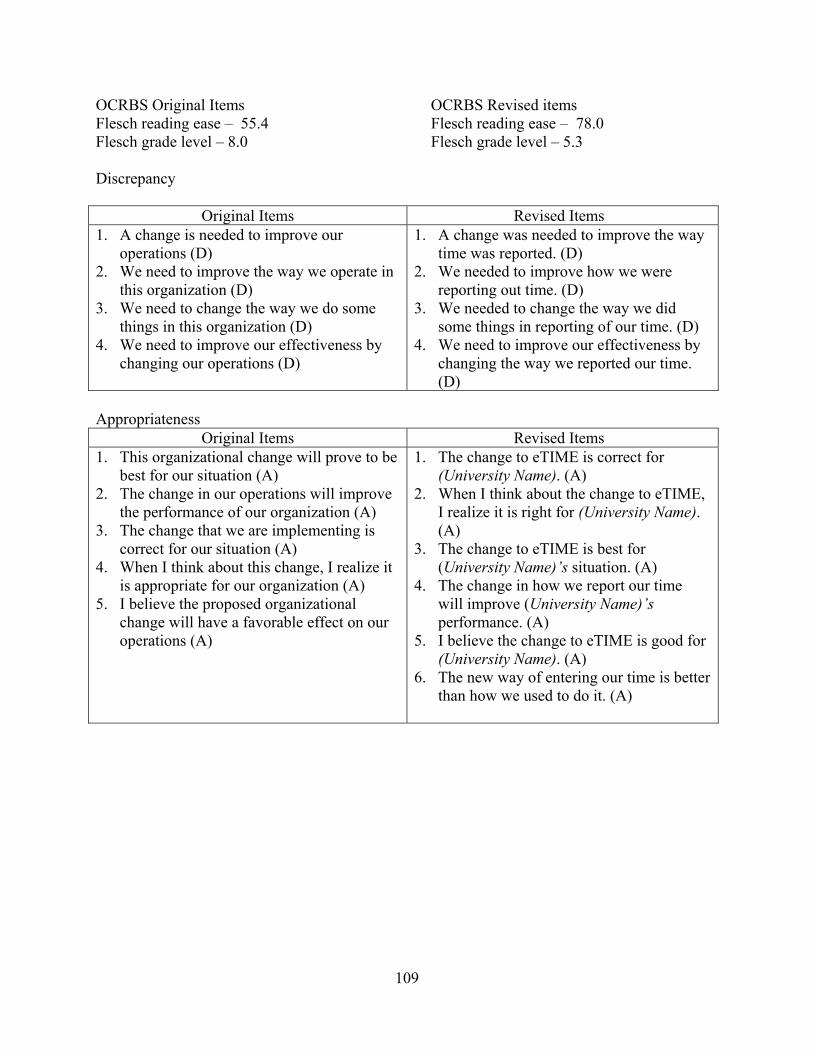
109
OCRBS Original Items OCRBS Revised items Flesch reading ease – 55.4 Flesch reading ease – 78.0 Flesch grade level – 8.0 Flesch grade level – 5.3 Discrepancy
Original Items Revised Items 1. A change is needed to improve our
operations (D) 2. We need to improve the way we operate in
this organization (D) 3. We need to change the way we do some
things in this organization (D) 4. We need to improve our effectiveness by
changing our operations (D)
1. A change was needed to improve the way time was reported. (D)
2. We needed to improve how we were reporting out time. (D)
3. We needed to change the way we did some things in reporting of our time. (D)
4. We need to improve our effectiveness by changing the way we reported our time. (D)
Appropriateness
Original Items Revised Items 1. This organizational change will prove to be
best for our situation (A) 2. The change in our operations will improve
the performance of our organization (A) 3. The change that we are implementing is
correct for our situation (A) 4. When I think about this change, I realize it
is appropriate for our organization (A) 5. I believe the proposed organizational
change will have a favorable effect on our operations (A)
1. The change to eTIME is correct for (University Name). (A)
2. When I think about the change to eTIME, I realize it is right for (University Name). (A)
3. The change to eTIME is best for (University Name)’s situation. (A)
4. The change in how we report our time will improve (University Name)’s performance. (A)
5. I believe the change to eTIME is good for (University Name). (A)
6. The new way of entering our time is better than how we used to do it. (A)

110
Valence Original Items Revised Items
1. With this change in my job, I will experience more self-fulfillment (V)
2. This change will benefit me (V) 3. The change in my job assignments will
increase my feelings of accomplishment (V)
4. I will earn higher pay from my job after this change (V)
1. The change in how I enter my time makes me feel good about myself. (V)
2. The change to entering my own time using eTIME will be good for me. (V)
3. Entering my own time using eTIME makes me feel better about my job. (V)
4. eTIME allows me to record my time more accurately. (V)
5. It is more convenient for me to enter my time using eTIME. (V)
Efficacy
Original Items Revised Items 1. I have the capability to implement the
change that is initiated (E) 2. I can implement this change in my job (E) 3. I am capable of successfully performing
my job duties with the proposed organizational change (E)
4. We have the capability to successfully implement this change (E)
5. I believe we can successfully implement this change (E)
1. I know how to enter my hours on eTIME. (E)
2. I can do a good job entering my hours using eTIME. (E)
3. It is easy for me to enter my time using eTIME. (E)
4. (University Name) is doing a good job of changing to eTIME. (E)
5. (University Name) is successfully getting everyone to use the new eTIME system. (E)
Principal Support
Original Items Revised Items 1. Most of my respected peers embrace the
proposed organizational change (PS) 2. My immediate manager is in favor of this
change (PS) 3. My immediate manager encourages me to
support the change (PS) 4. The top leaders in this organization are
“walking the talk” (PS) 5. The top leaders support this change (PS) 6. The majority of my respected peers are
dedicated to making this change work (PS)
1. Most of the co-workers want the change to eTIME to work. (PS)
2. Most of my co-workers like the change to eTIME. (PS)
3. My direct supervisor wants me to support the change to eTIME. (PS)
4. My direct supervisor is in favor of the change to eTIME. (PS)
5. The top leaders at (University Name) are leading by example when it comes to implementing eTIME. (PS)
6. The top leaders support the change to eTIME. (PS)
Recommended