EDCHOICE BRIEF
EXPLORING TEXAS’S PRIVATE EDUCATION SECTORANDREW D. CATTJANUARY 2017
OVERVIEWExploring Texas’s Private Education Sector is the eighth entry in the School Survey Series.1 This brief synthesizes information about Texas’s accredited private schools from a survey conducted by EdChoice, in collaboration with the Texas Catholic Conference and the Texas Private Schools Association.
Educational choice has come to the forefront of Texas education policy conversations. For years, organizations have pushed for tax-credit scholarships, a type of school choice program that allows taxpayers to receive full or partial tax credits when they donate to nonprofits that provide private school scholarships.2
More recently, Gov. Greg Abbott suggested educational choice programs could help alleviate issues regarding the state’s services for students with special needs.3 One type of program—education savings accounts (ESAs)—has served students with special needs in other states, providing students more flexibility than tax-credit scholarships and resulting in high parental satisfaction. ESAs allow parents to withdraw their children from public district or charter schools and receive a deposit of public funds into government-authorized savings accounts with restricted, but multiple, uses. Those funds may cover only educational expenses, such as private school tuition and fees, online learning programs, private tutoring, community college costs, and even other higher education expenses.
From April 7 to May 31, 2016, EdChoice administered a first-of-its-kind survey about these types of choice programs and more to Texas’s private K–12 schools in collaboration with the Texas Catholic Conference and the Texas Private Schools
KEY FINDINGS• Accredited private schools in Texas have at least 31,650 open seats with a projected estimate closer to 127,000 open seats for K–12 students
• 27 percent of schools are familiar with education savings accounts (ESAs)
• 63 percent would or probably would participate in an ESA program open to all students
• 39 percent of schools are familiar with tax-credit scholarships
• 73 percent would or probably would participate in a tax-credit scholarship program open to all students
• Schools are mostly concerned with regulations regarding paperwork and reporting, testing and accountability, setting of curriculum and instruction, and school admissions and enrollment guidelines
• 73 percent of private schools serve students with special needs
• 95 percent of private schools administer at least one nationally norm-referenced test
1

Association. This brief provides a descriptive analysis of the results of that survey.
Do Texas’s private schools have available seats for new students?
Of the schools taking part in the EdChoice survey, cautious estimates show the state’s accredited private schools have 29,485 open seats across K–12. Note that this is an estimate provided directly by the 333 private schools in this survey. The projected estimate for Texas’s total accredited private school sector is closer to 127,000 open seats for K–12 students.
Are schools familiar with the concept of education savings accounts (ESAs)?
Texas private schools were asked how familiar they are with the concept of ESAs for K–12 education. Slightly more than one out of four private schools (27%; 78 of 288 schools) indicated they were already familiar with
ESAs. Nearly two out of five Texas private schools (38%; 110 of 288 schools) said they were “not at all familiar” with ESAs, meaning they may not have heard of the concept prior to the survey provided directly by the 333 private schools in this survey. The projected estimate for Texas’s total accredited private school sector is closer to 127,000 open seats for K–12 students.
If enacted, would schools participate in an ESA program?
When provided with the previous ESA definition and asked if they would participate in an ESA program open to all students, nearly two out of three respondent private schools (63%; 182 of 288 schools) said “yes” or “probably yes.” Another 25 percent of schools (71 of 288 schools) said “maybe.” In other words, they would consider participating. Twenty-three schools (8%) said they probably would not participate, and 12 schools (4%) said they would not participate.
Schools were asked if they would be interested in participating in an ESA program that would serve only students with special needs.4 More than one-third of the respondent private schools (36%; 105 of 288 schools) said “yes” or “probably yes.” Another 32 percent of schools (91 of 288 schools) said “maybe.” In other words, they would consider participating. More than one out of five schools (22%; 63 of 288 schools) said they probably would not participate, and one out of 10 schools (10%; 29 of 288 schools) said they would not participate (see Table 3).
TOTAL
Prekindergarten
Kindergarten
Elementary School
Middle School
High School
Ungraded
31,650
2,165
2,040
11,221
8,826
6,708
690
Private School Grade Level Number of Open Seats
Known Open Seats in Respondent Private Schools (2015–16)
number of respondent schools = 333; item response rate = 29%
T1
Very Familiar
Somewhat Familiar
Not Too Familiar
Not At All Familiar
4%
23%
35%
38%
Response Percent of Private Schools
Texas Private Schools’ Familiarity with Education Savings Accounts (ESAs)
number of respondent schools = 288; item response rate = 25%
T2
2
See the Survey Project and Profile, Survey Methodology and Data Sources, data on Unaccredited Schools and the Texas Private School Survey Questionnaire at www.edchoice.org/TXSchoolSurvey.

Are schools familiar with the concept of tax-credit scholarships?
Texas private schools were asked how familiar they are with tax-credit scholarships. Nearly two out of five of the private schools (39%; 113 of 289 schools) indicated they were already familiar with tax-credit scholarships. Nearly one-third of Texas private schools (32%; 93 of 289 schools) said they were “not at all familiar” with tax-credit scholarships, meaning they may not have heard of the concept prior to the survey.
If enacted, would schools participate in a tax-credit scholarship program?
When asked if they would participate in a tax-credit scholarship program open to all students, nearly three out of four respondent private schools (73%; 211 of
290 schools) said “yes” or “probably yes.” Another 19 percent of schools (54 of 290 schools) said “maybe.” In other words, they would consider participating. Fourteen schools (5%) said they probably would not participate, and 11 schools (4%) said they would not participate.
Schools were asked if they would be interested in participating in a tax-credit scholarship program that would serve only students with special needs.5 More than one-third of the respondent private schools (35%; 100 of 285 schools) said “yes” or “probably yes.” Another 33 percent of schools (94 of 285 schools) said “maybe.” In other words, they would consider participating. Slightly more than one out of five schools (21%; 61 of 285 schools) said they probably would not participate, and slightly more than one out of 10 schools (11%; 30 of 285 schools) said they would not participate.
Schools were asked if they would be interested in participating in a tax-credit scholarship program that would serve only “students with financial and/or academic need.” Nearly three-fourths of the respondent private schools (72%; 208 of 290 schools) said “yes” or “probably yes.” Another 21 percent of schools (61 of 290 schools) said “maybe.” In other words, they would consider participating. Thirteen schools (4%) said they probably would not participate, and eight schools (3%) said would not participate.
Yes
Probably Yes
Maybe
Probably Not
No
Number of Respondents
20%
17%
32%
22%
10%
288
Response Special NeedsESA
38%
25%
25%
8%
4%
288
UniversalESA
Texas Private School Responses to Potential Education Savings Account (ESA) Program Participation
item response rate = 25%
T3
Very Familiar
Somewhat Familiar
Not Too Familiar
Not At All Familiar
7%
32%
29%
32%
Response Percent of Private Schools
Texas Private Schools’ Familiarity with Tax-Credit Scholarships
number of respondent schools = 289; item response rate = 25%
T4
Yes
Probably Yes
Maybe
Probably Not
No
Number of Respondents
42%
31%
19%
5%
4%
290
Response UniversalTCS
19%
16%
33%
21%
11%
285
Special NeedsTCS
41%
31%
21%
4%
3%
290
Means-TestedTCS
Texas Private School Responses to Potential Tax-Credit Scholarship (TCS) Program Participation
item response rates = 25%, 24%, and 25%, respectively
T5
3
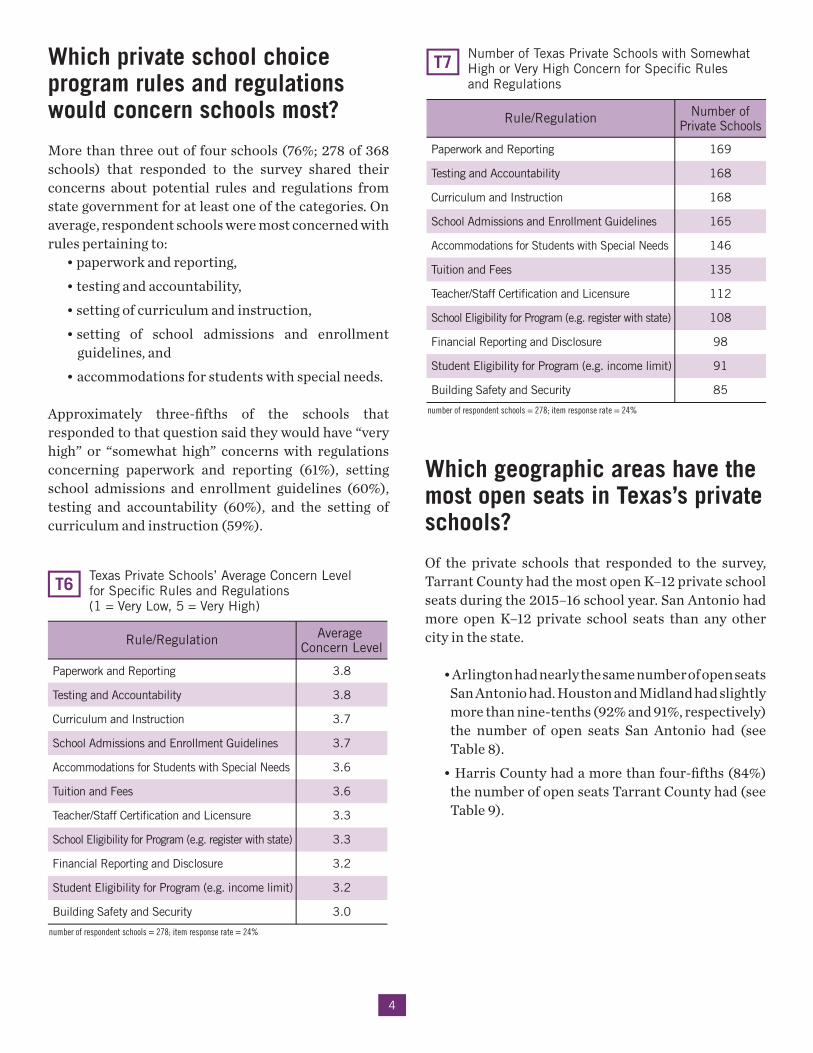
Which private school choice program rules and regulations would concern schools most?
More than three out of four schools (76%; 278 of 368 schools) that responded to the survey shared their concerns about potential rules and regulations from state government for at least one of the categories. On average, respondent schools were most concerned with rules pertaining to: • paperwork and reporting, • testing and accountability, • setting of curriculum and instruction, • setting of school admissions and enrollment guidelines, and • accommodations for students with special needs.
Approximately three-fifths of the schools that responded to that question said they would have “very high” or “somewhat high” concerns with regulations concerning paperwork and reporting (61%), setting school admissions and enrollment guidelines (60%), testing and accountability (60%), and the setting of curriculum and instruction (59%).
Which geographic areas have the most open seats in Texas’s private schools?
Of the private schools that responded to the survey, Tarrant County had the most open K–12 private school seats during the 2015–16 school year. San Antonio had more open K–12 private school seats than any other city in the state. • Arlington had nearly the same number of open seats San Antonio had. Houston and Midland had slightly more than nine-tenths (92% and 91%, respectively) the number of open seats San Antonio had (see Table 8). • Harris County had a more than four-fifths (84%) the number of open seats Tarrant County had (see Table 9).
Paperwork and Reporting
Testing and Accountability
Curriculum and Instruction
School Admissions and Enrollment Guidelines
Accommodations for Students with Special Needs
Tuition and Fees
Teacher/Staff Certification and Licensure
School Eligibility for Program (e.g. register with state)
Financial Reporting and Disclosure
Student Eligibility for Program (e.g. income limit)
Building Safety and Security
169
168
168
165
146
135
112
108
98
91
85
Rule/Regulation Number ofPrivate Schools
Number of Texas Private Schools with Somewhat High or Very High Concern for Specific Rules and Regulations
number of respondent schools = 278; item response rate = 24%
T7
Paperwork and Reporting
Testing and Accountability
Curriculum and Instruction
School Admissions and Enrollment Guidelines
Accommodations for Students with Special Needs
Tuition and Fees
Teacher/Staff Certification and Licensure
School Eligibility for Program (e.g. register with state)
Financial Reporting and Disclosure
Student Eligibility for Program (e.g. income limit)
Building Safety and Security
3.8
3.8
3.7
3.7
3.6
3.6
3.3
3.3
3.2
3.2
3.0
Rule/Regulation Average Concern Level
Texas Private Schools’ Average Concern Level for Specific Rules and Regulations (1 = Very Low, 5 = Very High)
number of respondent schools = 278; item response rate = 24%
T6
4
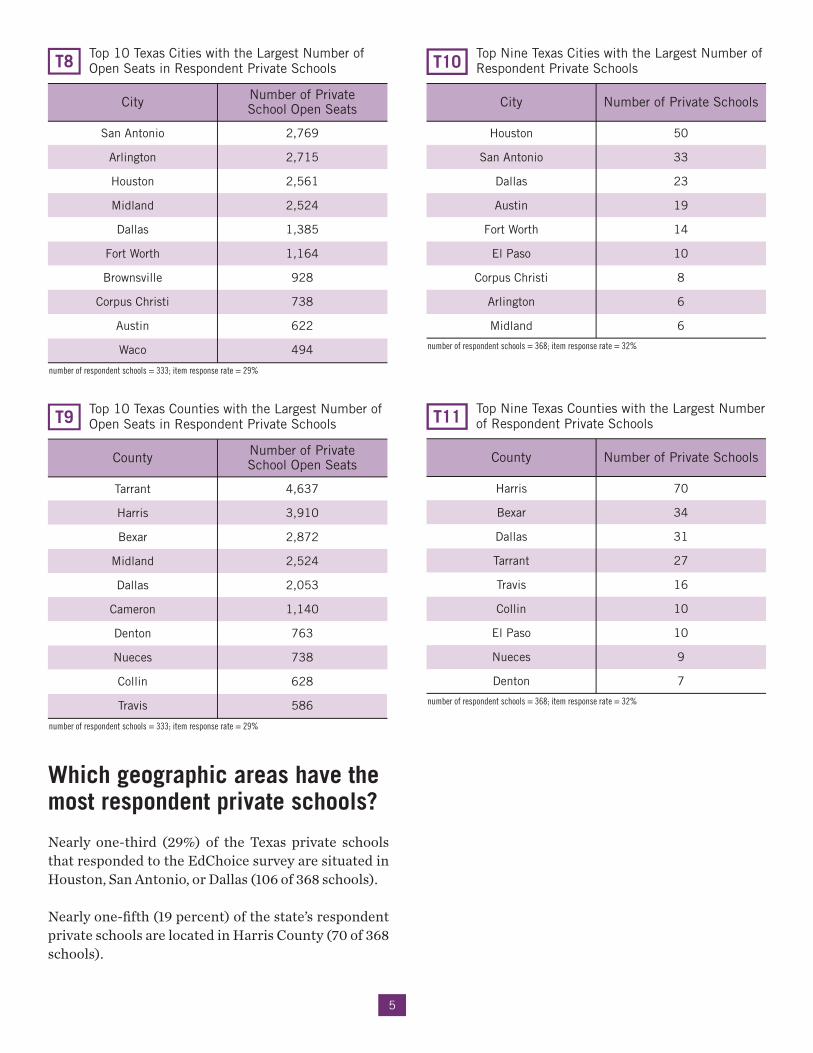
Which geographic areas have the most respondent private schools?
Nearly one-third (29%) of the Texas private schools that responded to the EdChoice survey are situated in Houston, San Antonio, or Dallas (106 of 368 schools).
Nearly one-fifth (19 percent) of the state’s respondent private schools are located in Harris County (70 of 368 schools).
Houston
San Antonio
Dallas
Austin
Fort Worth
El Paso
Corpus Christi
Arlington
Midland
50
33
23
19
14
10
8
6
6
City Number of Private Schools
Top Nine Texas Cities with the Largest Number of Respondent Private Schools
number of respondent schools = 368; item response rate = 32%
T10
Harris
Bexar
Dallas
Tarrant
Travis
Collin
El Paso
Nueces
Denton
70
34
31
27
16
10
10
9
7
County Number of Private Schools
Top Nine Texas Counties with the Largest Number of Respondent Private Schools
number of respondent schools = 368; item response rate = 32%
T11
San Antonio
Arlington
Houston
Midland
Dallas
Fort Worth
Brownsville
Corpus Christi
Austin
Waco
2,769
2,715
2,561
2,524
1,385
1,164
928
738
622
494
City Number of PrivateSchool Open Seats
Top 10 Texas Cities with the Largest Number of Open Seats in Respondent Private Schools
number of respondent schools = 333; item response rate = 29%
T8
Tarrant
Harris
Bexar
Midland
Dallas
Cameron
Denton
Nueces
Collin
Travis
4,637
3,910
2,872
2,524
2,053
1,140
763
738
628
586
County Number of PrivateSchool Open Seats
Top 10 Texas Counties with the Largest Number of Open Seats in Respondent Private Schools
number of respondent schools = 333; item response rate = 29%
T9
5

What is the cost of combined tuition and fees among private schools?
Half of private schools for which combined tuition and fee data are available charge $5,995 or less for elementary, $6,500 or less for middle school grades, and $8,800 or less for high school grades.
At all levels there are some especially expensive schools that create the gaps between “average” and “median” private school tuition and fee rates seen in the first accompanying table. The minimum combined tuition
and fees charged at any level is $100 and the maximum combined tuition and fees charged at any level is $495,500.
Approximately three-fifths of Texas private schools (61%) charge less than $6,000 for prekindergarten, whereas closer to half charge the same range for kindergarten and elementary school grades (52% and 50%, respectively). More than two-fifths of Texas private schools (42%) charge the same range for middle school grades and nearly one-fifth of Texas private schools (18%) charge the same rate for high school grades.
Texas Private School Tuition Ranges by Grade Level (2015–2016)
Prekindergarten Kindergarten Elementary Middle High
Less than $2,500 $2,500 to $3,499 $3,500 to $5,999 $6,000 to $9,999 $10,000 or more
5% 5%4%
42%
36%
12% 16%
34%
40%
4%6% 5%
3%
34%
37%
21%
39%
43%
13%1%4%
7%
48%
31%
8%
F1
OVERALL
Prekindergarten
Kindergarten
Elementary School
Middle School
High School
$6,000
$5,405
$5,850
$5,995
$6,500
$8,800
Grade(s) Median
$8,893
$7,355
$7,127
$8,728
$11,121
$11,604
Average
$100
$100
$100
$100
$100
$500
Minimum
$495,500
$199,800
$122,000
$465,500
$495,500
$81,000
Maximum
Combined Tuition and Fees Amounts for Texas Private Schools
number of respondent schools = 322; item response rate = 28%
T11
6

What do private schools charge in fees?
Half of schools for which fee data are available charge $524 or less, and the Texas private schools for which fee data are available charge $25 to $45,000 in total fees. Those fees are in addition to the tuition that schools charge students. The fee category in which Texas schools charge the most, on average, is “Other,” which includes those for classroom supplies, athletics, field trips, after care, and general student activities.
What proportion of Texas private schools offers some form of financial assistance, and how much do they offer?
More than four-fifths of the state’s private schools for which tuition data are available (82%) provide some form of tuition assistance. Half of those schools
provide financial assistance to more than one-fifth of their students (22%), and half of those schools provide $1,300 or more in financial assistance.
What proportion of Texas private schools educates students with special needs?
For the schools that responded to this question, an estimated one-fourth of students attending Texas private schools (24%) had special needs in 2015–16, on average (see Table 14).6 Comparatively, slightly less than one-tenth of Texas public school students (9%) had special needs in 2014–15.7
However, it is important to note that, in 13 of the respondent schools, students with special needs made up the entire student body, so the median proportion of students (11%) may be more important for comparisons. A median of that data point could not be found for Texas public schools.
Percentage of Students ReceivingFinancial Assistance (Including Discounts)
Tuition Assistance Per Student
22%
$1,300
Median
32%
$2,150
Average
Tuition Assistance Provided by Texas Private Schools
number of respondent schools = 265; item response rate = 23%
T13
TOTAL
Registration/Application
Textbooks
Technology
Transportation
Uniforms
Other
$524
$250
$300
$100
$150
$150
$250
Grade(s) Median
$967
$360
$296
$458
$523
$662
$689
Average
$25
$25
$50
$10
$5
$15
$10
Minimum
$45,000
$11,000
$800
$25,000
$3,000
$20,000
$32,000
Maximum
Fee Amounts for Texas Private Schools
number of respondent schools = 292; item response rate = 25%
T12
7

What proportion of the state’s private schools enrolls students with special needs?
Of those schools that responded to the question, nearly three-fourths (73%; 208 of 284 schools) enrolled at least one student with special needs in 2015–16.
Do respondent schools test their students annually?
More than nine out of 10 Texas private schools (95%) require their students to take a nationally norm-referenced test to measure student academic performance. Of those schools, more than three-fifths (63%; 171 of 272 schools) reported they administered the Iowa Assessments. In addition to the tests listed in the accompanying table, there were 18 other nationally norm-referenced tests administered by accredited Texas private schools in 2015–16.
TOTAL
Iowa Assessments
Cognitive Abilities Test (CogAT)
TerraNova
PSAT
Stanford 10
ERB
SAT
ACT Aspire
ACT
State of Texas Assessments of Academic Readiness (STAAR)
Tests Administered
272
171
34
27
26
21
20
13
12
11
10
Number of Testing Schools
95%
60%
12%
9%
9%
7%
7%
5%
4%
4%
3%
Percentage of State's Private Schools
Top 10 Tests Administered in Texas Private Schools
number of respondent schools = 196; item response rate = 17%
T16
Percent of State'sPrivate Schools
Number of Private Schools
Enrolled Student(s)with Special Needs
Texas Private Schools Enrolling Students with Special Needs
number of respondent schools = 284; item response rate = 24%
Yes
No
208
76
73%
27%
T15
504 Plan
Autism
Developmental Delay
Specific Learning Disability
Speech or Language Impairment
Other Special Need(s)
Student Profile
9%
6%
7%
11%
5%
6%
Average Percent of Private School's Students
5%
2%
2%
5%
2%
3%
Median Percent of Private School's Students
Texas Private Schools’ Percentage of Students with Special Needs
number of respondent schools = 196; item response rate = 17%
T14
8

9
NOTES 1Although all of the previous surveys in the School Survey Series were administered under the banner of the Friedman Foundation for Educational Choice, the organization changed its name on July 29, 2016 to EdChoice.
2Brooke D. Terry, Paige Perez, and Brittany Wagner (2010), Helping Parents Pay for Education: Examining Education Tax Credits and Deductions, Policy Perspective (Austin: Texas Public Policy Foundation), retrieved from http://www.texaspolicy.com/library/doclib/2010-04-PP10-EdTaxCredits-bt-pp.pdf.
3Brian M. Rosenthal and Mike Ward (2016, December 15), “Abbott Floats School Choice as Solution to Special Ed Frustration,” Houston Chronicle, retrieved from http://www.chron.com/news/politics/texas/article/Abbott-floats-school-choice-as-solution-to-10794219.php.
4Students within this population may have an Individualized Education Program (IEP), 504 plan, and/or: autism, deaf-blindness, developmental delay, hearing impairment, intellectual disability, multiple disabilities, orthopedic impairment, serious emotional disturbance, specific learning disability, speech or language impairment, traumatic brain injury, visual impairment, or other health impairments.
5Ibid.
6Students with special needs were defined on this survey question as those having autism, deaf-blindness, developmental delay, hearing impairment, intellectual disability, multiple disabilities, orthopedic impairment, serious emotional disturbance, specific learning disability, speech or language impairment, traumatic brain injury, visual impairment, or other health impairments.
7US Dept. of Education, National Center for Education Statistics, Common Core of Data (CCD), “Local Education Agency (School District) Universe Survey Special ED Data,” 2014-15 v.1a, “Public Elementary/Secondary School Universe Survey Membership Data,” 2014–15 v.1a, and “State Nonfiscal Public Elementary/Secondary
Education Survey Directory Data,” 2014–15 v.1a, retrieved December 19, 2016 from http://nces.ed.gov/ccd/elsi/tableGenerator.aspx.
ABOUT THE AUTHOREdChoice Director of State Research and Policy Analysis Drew Catt conducts analyses on private educational choice programs, conducts surveys of private school leaders and supports quality control as EdChoice’s research and data verifier. Prior to joining EdChoice—formerly the Friedman Foundation—in May 2013, Drew served as the program associate for The Clowes Fund, a private family foundation located in Indianapolis that awards grants to nonprofits in Seattle, Greater Indianapolis and Northern New England. Drew graduated from Vanderbilt University in 2008 with a bachelor’s degree in Human and Organizational Development, specializing in Leadership and Organizational Effectiveness. While at Vanderbilt, Drew served as research assistant for North Star Destination Strategies, a community branding organization. During that time, Drew also researched the effects of homeschooling on socialization. Drew received his Master of Public Affairs in Nonprofit Management at Indiana University’s School of Public and Environmental Affairs in Indianapolis. He also received his Master of Arts in Philanthropic Studies through the Lilly Family School of Philanthropy. While in graduate school, Drew’s research focused on teacher performance incentives and cross-sector collaboration. Drew recently received a Graduate Certificate in Geographic Information Science (GIS) from IUPUI. Drew is a native of central Indiana and currently resides in downtown Indianapolis with his wife Elizabeth.
ACKNOWLEDGMENTSI would like to thank Jennifer Carr Allmon and Lisette Allen with the Texas Catholic Conference of Bishops, Laura Colangelo with the Texas Private Schools Association, and Texas EdChoice Advisor Randan
Steinhauser for collaborating with me on the survey and helping drive up response rates. I would also like to thank Julia Moore with Texans for Education Opportunity for contacting non-respondents after the first few waves and encouraging their participation, and I would like to thank all of the Texas private school principals and administrators that took the time out of their busy schedules to respond to the survey. I am very grateful for Paul DiPerna and his unwavering ability to keep me asking the right questions and Katie Brooks and her uncanny ability to find my grammatical errors. Finally, I would like to express my thanks to Drew Vessely for designing an eye-catching brief cover and Jacob Vinson for making the text and figures/tables flow together beautifully in a seemingly effortless way. All remaining errors are my own.
COMMITMENT TO METHODS & TRANSPARENCYEdChoice is committed to research that adheres to high scientific standards, and matters of methodology and transparency are taken seriously at all levels of our organization. We are dedicated to providing high-quality information in a transparent and efficient manner.
The American Association for Public Opinion Research (AAPOR) welcomed EdChoice to its AAPOR Transparency Initiative (TI) in September of 2015. The TI is designed to acknowledge those organizations that pledge to practice transparency in their reporting of survey-based research findings and abide by AAPOR’s disclosure standards as stated in the Code of Professional Ethics and Practices.
For more information please visit edchoice.org/AAPORTI.
111 MONUMENT CIRCLE, SUITE 2650INDIANAPOLIS, IN 46204EDCHOICE.ORG
Recommended