Journal of Marketing and Consumer Research www.iiste.org
ISSN 2422-8451 An International Peer-reviewed Journal
Vol.11, 2015
132
Extent of Adoption of Green Marketing Strategies by the Kenya
Tea Firms
Dr. Francis Ofunya Afande, PhD., FCIM (UK).
Dedan Kimathi University of Technology P.O. Box 657,10100, Nyeri Kenya
Abstract
The study sought to explore the extent of adoption of green marketing practices by Kenya tea firms. A
descriptive survey was undertaken, the population of study being all tea factories in Kenya operating under East
Africa Tea Traders Association, whose number stood at 73 as at June 30th
2010. A sample of 63 tea factories was
selected to participate in the study and primary data was collected with the aid of a self-administered
questionnaire, targeting environmental management representatives of the selected factories. Data analysis was
undertaken using Statistical Package for Social Sciences package version 19.0. The findings are presented with
the aid of bar charts, frequency tables, percentages, standard deviations and mean scores.
Keywords: Adoption, Green marketing,
ABBREVIATIONS AND ACCRONYMS
4-Rs Recycle, Refill, Reuse and Reduce
AMA American Marketing Association
EATTA East Africa Tea Traders Association
EM Enviropreneurial Marketing
EMR Environmental Management Representative
EMS Environmental Management System
ENPD Environmental new Product Development
EO Environmental Orientation
EPZ Export Processing Zone
ETP Ethical Tea Partnership
FTC Federal Trade Commission
GS Greening Strategies
ISO International Standards Organization
IT Information Technology
KETEPA Kenya Tea Packers Ltd
KTDA Kenya Tea Development Agency
KTGA Kenya Tea Growers Association
MNCs Multinational Corporations
NEO Natural Environmental Orientation
NGOs Non Governmental Organizations
NPD New Product Development
NTDC Nyayo Tea Development Corporation
PDF Product
PRF Price
PRMF Promotion
RA Rainforest Alliance
RG Regulations
SCDA Special Crops Development Authority
SPSS Statistical Package for Social Sciences
SSCM Sustainable Supply Chain Management
UK United Kingdom
WBCSB The World Business Council for Sustainable Development
INTRODUCTION
Background of the study
Environmental issues such as global warming, deforestation, disposal of toxic waste, ozone depletion and
reduction of resources have become regular features of everyday life. According to Polonsky & Rosenburger
(2001), corporate greening could occur across such activities as market targeting, green design, green positioning,
green pricing, green logistics, and green promotions. Menon & Menon (1997) proposed that greening is
something that should be integrated into corporate philosophy, which can then be used to leverage the firm’s
position within the market place.

Journal of Marketing and Consumer Research www.iiste.org
ISSN 2422-8451 An International Peer-reviewed Journal
Vol.11, 2015
133
Review of the literature indicate that marketers are incorporating green marketing strategies into many
activities, including: planning (McDaniel & Rylander, 1993); product and package design (Bhat, 1993; Polonsky,
Bailey, Baker, Basche, Jepson & Neath, 1997); pricing (McCaughan, 1991; Kapelianis & Strachan, 1996),
distribution (Schlegelmilch & Robertson, 1995), retailing (Duff, 1990); promotion (Davis, 1993); customer
segmentation (Balderjahn, 1988); strategic alliances (Mendleson & Polonsky, 1995; Milne, Iyer &Gooding-
Williams, 1996; Stafford and Hartman, 1996); industrial marketing (Drumwright, 1994) and overall marketing
strategy (Menon & Menon, 1997). While going green may be in fashion, it is unclear why firms are making
these changes. Polonsky (1995) asserts that “some reasons, such as matching the competition, might not
necessarily mean marketers are concerned with their firms’ environmental behavior and thus they may not
actually be improving their environmental performance”.
Research also indicates that consumers are integrating their concern for the environment into their
purchasing behavior in a variety of ways. There is a growing amount of evidence indicating that consumers are
choosing products or avoiding others based on their impact on the natural environment (Coddington, 1993, Davis,
1993; McDougall, 1993, Ottman, 1992a; The Roper Organization, 1990). Other studies suggest that consumers
not only desire to purchase products that are less environmentally harmful but are willing to pay more to do so
(Coddington, 1993, Davis, 1993; Ottman, 1992a).
Though green marketing has been an important academic research topic for at least three decades,
most of the studies have been undertaken in the developed countries, as evidenced by (Kassarjian, 1971; Kinnear,
Taylor & Ahmed, 1974); Coddington, 1993; Ottman, 1994; Peattie, 1995; Polonsky & Mintu-Wimsatt, 1995;
Schlegelmilch, Bohlen & Diamantopoulos,1996; and Kalafatis, Pollard, East & Tsogas, 1999). For instance,
Dembkowski & Hanmer-Lloyd (1994) found that 82 per cent of British citizens rated the environment as an
immediate and urgent problem, while Worcester (1993) established that 69 per cent of the general public
believes that pollution and other environmental damage are impacting on their everyday life.
Studies on green marketing undertaken in Kenya include the following: Kiongera (2003) undertook a
survey of green marketing practices in Bamburi cement in Kenya; (Obuya (2003) carried out a survey of the
extent to which manufacturing firms in Nairobi practice green marketing; Kalama (2007) undertook a study on
the green marketing practices by Kenya Petroleum refineries; Odhiambo (2008) surveyed the extent to which
floricultural firms in Kenya practice green marketing; and Thiong’o (2009) undertook an investigation of green
marketing practices among pharmaceutical firms in Kenya. According to Cresswell (2003), “a research problem
is the question that exists that leads to a need for the study because no answers were found within the literature
reviewed, in theory, or in practice”. This study therefore, attempts to bridge the gap.
Green marketing
Green marketing is a broad concept that is applicable to consumer goods, industrial goods and even services. It
integrates a wide range of activities, including product modification, changes to the production process,
packaging changes, as well as modifying advertising. Polonsky (1994) observed that no definition of “green
marketing” has been universally accepted. It is therefore, difficult to evaluate this issue since all researchers have
a different perception of what they are researching. In order to fully comprehend this concept, it is important to
review the research of other authors.
Fuller’s (1999, p.4) defined green marketing as
the process of planning, implementing, and controlling the development, pricing, promotion,
and distribution of products in a manner that satisfies the following three criteria: (i) customer
needs are met, (ii) organizational goals are attained, and (iii) the process is compatible with
ecosystems.
Peattie & Charter (1994), proposed the definition of green marketing as, “the holistic management process
responsible for identifying, anticipating and satisfying the needs of consumers and society, in a profitable and
sustainable way”.
Polonsky’s (1995, p.2) defined marketing as
all activities designed to generate and facilitate any exchanges intended to satisfy human
needs or wants, such that the satisfaction of these need and wants occurs, with minimal
detrimental impact on the natural environment.
Polynsky’s definition not only incorporates the traditional components of the marketing definition, but also
includes the protection of the natural environment by attempting to minimize the negative impact that this
exchange has on the environment. Polynsky’s definition was adopted for purposes of this study.
Prakash (2002) suggested that “firms can ‘green’ themselves in three ways: value-addition processes
(firm level); management systems (firm level) and or products (product level).” Green the value-addition
processes could entail redesigning them, eliminating source of them, modifying technology-all with the objective
of reducing environmental impact aggravated for all stages (Charter & Polousky, 1999).
Ottman (1993) asserts that green marketing serves two key objectives: to develop products that
Journal of Marketing and Consumer Research www.iiste.org
ISSN 2422-8451 An International Peer-reviewed Journal
Vol.11, 2015
134
incorporate consumers’ needs for convenience, affordable pricing and performance while having a minimal
impact on the environment; and to project an image of high quality, including environmental aspects, both in
regards to product attributes and the manufacturer’s track record for environmental compliance. For purposes of
this study, the definition by Fuller (1999) was adopted.
Tea sector in Kenya
The history of tea in Kenya dates back to 1903 when a European settler, Mr. G. W. Cain introduced the first tea
plants in Limuru area of Central Kenya. The early settlers and the colonial government restricted tea and coffee
growing to large-scale farmers and multinationals, ostensibly to maintain quality. The main reason was to lock
out locals (read Africans) from the then very lucrative cash crop farming. Kenya’s attainment of independence in
1963 saw the passing of various Land Reform Bills which have had far reaching impact on agriculture. Tea
growing for instance was made open to the local farmers and the crop has since spread across the country and is
currently an important economic mainstay for many small holder farmers.
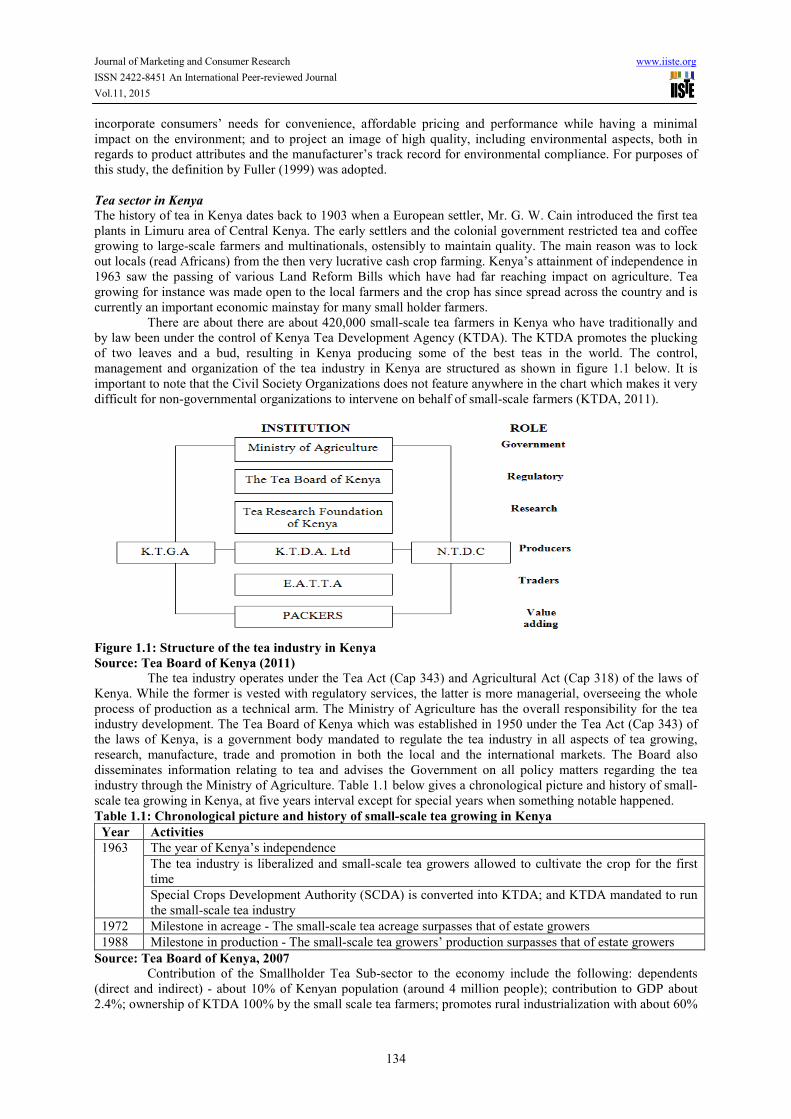
There are about there are about 420,000 small-scale tea farmers in Kenya who have traditionally and
by law been under the control of Kenya Tea Development Agency (KTDA). The KTDA promotes the plucking
of two leaves and a bud, resulting in Kenya producing some of the best teas in the world. The control,
management and organization of the tea industry in Kenya are structured as shown in figure 1.1 below. It is
important to note that the Civil Society Organizations does not feature anywhere in the chart which makes it very
difficult for non-governmental organizations to intervene on behalf of small-scale farmers (KTDA, 2011).
Figure 1.1: Structure of the tea industry in Kenya
Source: Tea Board of Kenya (2011) The tea industry operates under the Tea Act (Cap 343) and Agricultural Act (Cap 318) of the laws of
Kenya. While the former is vested with regulatory services, the latter is more managerial, overseeing the whole
process of production as a technical arm. The Ministry of Agriculture has the overall responsibility for the tea
industry development. The Tea Board of Kenya which was established in 1950 under the Tea Act (Cap 343) of
the laws of Kenya, is a government body mandated to regulate the tea industry in all aspects of tea growing,
research, manufacture, trade and promotion in both the local and the international markets. The Board also
disseminates information relating to tea and advises the Government on all policy matters regarding the tea
industry through the Ministry of Agriculture. Table 1.1 below gives a chronological picture and history of small-
scale tea growing in Kenya, at five years interval except for special years when something notable happened.
Table 1.1: Chronological picture and history of small-scale tea growing in Kenya
Year Activities
1963 The year of Kenya’s independence
The tea industry is liberalized and small-scale tea growers allowed to cultivate the crop for the first
time
Special Crops Development Authority (SCDA) is converted into KTDA; and KTDA mandated to run
the small-scale tea industry
1972 Milestone in acreage - The small-scale tea acreage surpasses that of estate growers
1988 Milestone in production - The small-scale tea growers’ production surpasses that of estate growers
Source: Tea Board of Kenya, 2007 Contribution of the Smallholder Tea Sub-sector to the economy include the following: dependents
(direct and indirect) - about 10% of Kenyan population (around 4 million people); contribution to GDP about
2.4%; ownership of KTDA 100% by the small scale tea farmers; promotes rural industrialization with about 60%

Journal of Marketing and Consumer Research www.iiste.org
ISSN 2422-8451 An International Peer-reviewed Journal
Vol.11, 2015
135
of national tea output; and contribution to foreign exchange earning in 2009 was Ksh37 billion (342 million euro)
expected to be above 49B (453 million euro) in 2010 (Mbadi, 2010). The small-scale farmers account for 60% of
all the tea produced in Kenya. The large scale tea plantations are still under the control of big multinationals.
Green marketing within the tea firms in Kenya
The environmental impacts of the tea industry are considerable. There is significant biodiversity loss when high
biodiversity areas such as forests are converted to tea plantations. Wal (2008) observed that along with habitat
conversion, logging for firewood to process tea, in particular, has caused extensive deforestation in countries
such as Kenya, Sri Lanka, Malawi and India. Energy consumption for tea processing is also high. In some
countries, such as India, Sri Lanka and Vietnam, abundant application of pesticides is also negatively affecting
the local and wider environment (water pollution, reduced soil biodiversity).
Most of the tea factories in Kenya are customer focused and committed to continually improving their
process. They have ascribed to Information Communication Technology, process automation and International
Standards such as ISO (EATTA, 2010). Some of the factories have undergone the certification process, and
having met the requirements, they have been recommended for the following certifications: ISO 9001/2001; ISO
9001:2000; ISO 9001: 2008; ISO 9001: 22000; ISO 22000: 2005 (Food Safety Management Systems)
certification after audits by Bureau Veritas Quality International (BVQI); and HACCP certification.
Statement of the problem
Some companies’ green strategies include: repositioning products without changing product composition;
modifying existing products to be less environmentally harmful; modifying the entire corporate culture to ensure
that environmental issues are integrated into all operational aspects; and the formation of new companies that
target green consumers only produce green products. Green product attributes may be environmentally sound
processes, responsible product uses, or product elimination, which consumers compare with those possessed by
competing conventional products. However, implementation of environmental strategies in Kenya is based very
much on ad hoc practices and many of them do not actually subscribe to any particular environmental concept.
Though green marketing has been an important academic research topic for at least three decades, most of the
studies have been undertaken in developed countries. None of the studies assessed the extent of adoption of
green marketing practices by the Kenya tea firms. The limited number of available literature reveals that there is
a meager research to probe why the practice of green marketing is low or the low motivation for firms to adopt
green marketing activities. Hence, there is a need to shed light on the establish the extent of adoption of green
marketing by the Kenya tea firms.
Objective of the study
The study sought to explore the extent of adoption of green marketing practices by Kenya tea firms.
Scope of the study
This study focused on the Kenya tea firms registered with East Africa Tea Trader Association. Reviews of the
relevant literature indicate that green marketing strategies may focus on the following areas: corporate focus;
suppliers focus; production/processing (manufacturing) focus; product focus; price focus; place (distribution)
focus; packaging focus; and promotion focus (Kilbourne, 1998; Menon, Menon, Chowdhury & Jankovich, 1999;
and Baker & Sinkula, 2005). For purposes of the study, green marketing practices are limited to environmental
adjustments of the traditional marketing mix elements (product, price, distribution, and promotion).
Justification for the study
The marketplace is placing an increasingly large amount of emphasis on green business. Studies on green
marketing in relation to the tea sector, especially in Africa are very scarce. Ideally, it is the role of Universities
and other institutions of higher learning to prepare their students to excel in their chosen field. Today’s
generation of business students will be the ones that will continue the transition from conventional business to
sustainability. Those individuals that are able to understand the role green marketing practices will play in the
marketplace, as well as how to successfully develop and implement green policies and processes, will hold a
competitive advantage over those that lack this understanding. This is the impetus for this study.
LITERATURE REVIEW
Green marketing strategies
Review of the literature on green marketing practices reveals various actions that can be undertaken to enhance
environmental sustainability. Some of the possible green marketing practices are discussed below.
Corporate focus
Fuller (1999), proposed the following green marketing practices: development of a mission statement that

Journal of Marketing and Consumer Research www.iiste.org
ISSN 2422-8451 An International Peer-reviewed Journal
Vol.11, 2015
136
explains commitment to the environment; development of an environmental workplace policy; development of
achievable environmental goals for all stakeholders; conducting environmental audits at regular intervals;
cooperation with groups/authorities on environmental issues; sensitization of key stakeholders on environmental
issues; financial support for environmental projects; and investment in research and development for cleaner
environment. In addition, and Polonsky & Rosenberger (2001), proposed the following: investing in new
technologies for handling waste, sewage and air pollution (for example, in-house paper recycling program);
evaluation of processes based on their environmental impact; formation of cross functional teams whose main
responsibility is to improve our environmental performance; substitution of environmental questionable
materials; and offering rewards to employees who develop new environmental ideas.
Supplier’ focus
Peattie (1992), Grove, Fisk, Pickett & Kangun (1996) and Grundey & Zaharia (2008) proposed the following
green marketing practices with respect to suppliers focus: budgetary allocation to assist suppliers purchase
equipment for production prevention and waste water recycling; bringing together suppliers in the same industry
to share their know how and problems; choice of suppliers by environmental criteria; guiding suppliers to
establish their own environmental programmes; holding awareness seminars for suppliers/contractors;
urging/pressuring suppliers to take environmental actions; developing specific environmental standards for
evaluating suppliers; and ensuring that all supplies contain green attributes such as recycled or reusable items
Production/processing (manufacturing) focus
Vasanthakumar (1993) and Baumann, Boons & Bragd (2002), proposed the following green marketing practices
with respect to production focus: optimization of processes to reduce waste/ air emissions/ noise; use of cleaner
technology processes to make savings; use of environmentally friendly raw materials; use of waste of other
companies; utilization of sustainable energy sources wherever possible; recycling of wastes produced during
production process; and use of recycled raw materials wherever possible.
Product focus
Around the world there have been an increasing number of firms which have introduced green products (Carson
& Fyfe, 1992). For example, 5% of all new products in the US in 1989 were identified as green products,
whereas in 1990 this figure increased to 10% (Davis, 1992). The degree to which green marketing has been
incorporated into a company’s marketing strategies has varied between companies. Some companies’ green
initiatives include: repositioning products without changing product composition (Davis, 1992); modifying
existing products to be less environmentally harmful (Ottman, 1992a); modifying the entire corporate culture to
ensure that environmental issues are integrated into all operational aspects (McDaniel & Rylander, 1993); and
the formation of new companies that target green consumers only produce green products (CHOICE, 1990).
Peattie (1992), Zeithaml, Parasuraman & Berry (2006), and Grundey & Zaharia (2008), proposed the following
green marketing practices with respect to product focus: participation in the design of products for recycling,
reuse or disassembly; recovery of the factory’s end-of-life products; offering environmental friendly products;
and undertaking product standardization to ensure environmentally safe products.
Price focus
Barrett (1991), Peattie (1992), Zeithaml et al. (2006) and Bridges & Wilhelm (2008), proposed the following
green marketing practices with respect to price focus: the factory be proactive and by focusing on costs, there
should be improved cost-effectiveness and a higher competitive edge; and the factory should support adoption of
environmental accounting methods to assess costs associated with tea processing.
Place (distribution) focus
Coddington (1993), Isherwood (2000), Bartlett & Howard (2000) and Rogers & Tibben-Lembke (2001),
proposed the following green marketing practices with respect to place focus: change for more environmental-
friendly transportation; location of the factory products being consistent with the image which the factory wants
to project; adoption of “green” distribution, including redesigning physical facilities; converting to a more fuel
efficient fleet; and redesigning distribution to minimize transportation.
Packaging focus
Zeithaml et al. (2006) proposed the following green marketing practices with respect to packaging focus:
redesigned packaging to reduce environmental impact; and use of packaging that is of lighter weight.
Promotion focus
Davis (1993), Carlson, Stephen & Kangun (1993) and Grundey & Zaharia (2008), proposed the following
green marketing practices with respect to promotion focus: providing customers with information on
environmental friendly products and/or production methods; in their communications, the factories should
clearly state their environmental efforts, characteristics and benefits achieved; the factories should use
sustainable marketing and communication tools and practices to reinforce environmental credibility; the firms
should understand that the key to successful green marketing is credibility, and such, the firm never overstates
environmental claims or establish unrealistic expectations; the factories should advertise the expenditures that it
has used on the environmental protection; the truthfulness and specificity of the green marketing claims should
Journal of Marketing and Consumer Research www.iiste.org
ISSN 2422-8451 An International Peer-reviewed Journal
Vol.11, 2015
137
be monitored and the claims be informative by nature; and the factories should have newsletters communicating
environmental actions to all employees.
Implementing a green marketing strategy requires a fundamental, holistic, integrated approach across
all functional marketing areas, which include the entire marketing mix of targeting, pricing, design, positioning
and promotion (Polonsky & Rosenberger, 2001). According to Fuller (1999, p.109), “only companies that are
truly committed to environmental concerns and are willing to translate those concerns into action through
marketing mix decisions can develop viable strategies”. However, for purposes of this study, only the traditional
“4 Ps” of marketing, namely product, price, place and promotion will be considered. These are discussed in the
next section.
Green marketing mix
Ottman (1993) argues that “like conventional marketers, green marketers must address the ‘four Ps’ in
innovative ways”. Bridges and Wilhelm (2008, 39), state that the 4Ps marketing mix is a useful means of
categorizing the sustainability concepts and tools relevant to marketing decision making. These are discussed as
follows:
Products
Zeithaml, Parasuraman & Berry (2006, p.26), define product by the features of the related physical goods,
quality level, accessories, packaging, warranties, product lines and branding. Product can be classified into three
levels, which include the core product, actual product and augmented product. Core product solves the problem
of the customer and is the reason for buying the product. As an example, if the core product is a nature
experience in intact natural environment, then the whole service needs to be developed accordingly. The
environmental impacts of product can be minimized by effective use of raw materials and energy as well as
paying attention to reusing and recycling the related end products
Actual product includes brand name, quality, styling, features and packaging. According to Peattie
(1992, 235), “green brand name can be created by attaching some environmental meaning to it or something
related to a product feature, such as clean or natural, production related, like recycled, or by relating some green
symbols, colors or forms to the brand”. Grundey and Zaharia (2008, 138), argued that being branded as a green
company can potentially be beneficial to business organizations and it might for example enhance the overall
perception of product quality. The green quality features of physical products include energy and resource
efficiency, minimization of the amount of waste and pollution, product life, reuse and recycling possibilities.
With respect to packaging, there are several possibilities to reduce environmental impacts, for example by
selling bigger unit sizes, offering products in refillable containers and reducing extra package layers (Peattie
1992, 222; Grove et al., 1996, 57; Grundey & Zaharia 2008, 136).
Augmented product is surrounding the core product and actual product and includes extra benefits and
services such as after sales services, delivery and credit, installation and warranty. The aim of the product is to
increase the lifetime of the product to which they are attached by utilizing maintenance and repair services
(Bridges & Wilhelm, 2008, 37).
According to Charter (1992), greening of products could take place in the following ways: “repair-
extend the life of a product by repairing its parts; recondition- extend the life of a product by significantly over
handling it; re - manufacture- the new product is based on old ones; re-use – design a product so that it can be
reprocessed and converted into a new material to be used in another or the same product and reduce- even
though the product uses less material or generates less disposable waste, it delivers benefits comparable to its
former version or to competing products”.
Although the study of relationship between green products and industry from a marketing perspective
is relatively new (Baumann et al., 2002), the literature also recognizes that managers should be aware that green
marketing begins with green design (Vasanthakumar, 1993), and that product design constitutes an active
interface between demand (consumers) and supply (manufacturers) (Baumann et al., 2002). For example, super-
concentrated laundry detergents are associated with energy saving reduced packaging and space, and money
(Ottman & Terry, 1998).
Ottman (1992b) concluded that entrepreneurs wanting to exploit emerging green markets either;
identify customers’ environmental needs and develop products to address these needs; or develop
environmentally responsible products to have less impact than competitors. Whatever the product or service, it is
vital to ensure that products meet or exceed the quality expectations and is thoroughly tested.
Price
Price consists of flexibility, price level, terms, differentiation, discounts and allowances (Zeithaml et al., 2006, p.
26). Peattie (1992, p. 250) argues that while developing environmentally sustainable practices, extra costs often
arise, which normally diminish again with learning, as such, both costs and demand have to be considered in the
price. Barrett (1991) observed that most customers are prepared to pay a premium if there is a perception of
additional product value. This value may be improved performance, function, design, visual appeal or taste.
Environmental benefits are thus an added bonus but will often be the deciding factor between products of equal

Journal of Marketing and Consumer Research www.iiste.org
ISSN 2422-8451 An International Peer-reviewed Journal
Vol.11, 2015
138
value and quality.
Bridges & Wilhelm (2008, p. 35), noted that “to practice sustainable marketing, practitioners will need
to rethink assumptions and those necessary changes include lengthening corporate time horizons for return on
investment and valuing financial continuity over profit”. Bridges & Wilhelm thus support the adoption of
environmental accounting methods to assess costs associated with product production, ownership, use, and
disposal which will ensure that environmental costs are taken into consideration in product pricing decisions.
Grundey and Zaharia (2008, p. 141), concluded that marketers need to assess the cost of new laws and
regulations as well as the cost of endless litigation as integral and critical components of an ecological approach.
Therefore, companies should be proactive and by focusing on costs they can improve their cost effectiveness and
possibly gain competitive edge.
Place (distribution)
Place involves ensuring that goods are available to consumers in convenient ways. Distribution choices include
decisions of channel type, exposure, intermediaries, outlet location, transportation, storage and managing
channels (Zeithaml et al., 2006, 26). Green distribution activities include (i) redesigning physical facilities; (ii)
implementing reverse logistics (Bartlett & Howard, 2000); and (iii) converting to a more fuel efficient fleet; and
redesigning distribution to minimize transportation (Rogers & Tibben-Lembke, 2001).
According to Imballagio (2002), green distribution should be considered because product distribution
systems can constrain green design solutions since they must guarantee the tangible “ecological nature” of the
products on the market. Additionally, distribution often increases the environmental impact of products, and is
constantly regulated for environmental compliance. This is a common situation in the United States (Isherwood,
2000).
However, it is generally less clear if consumers can or will be able to objectively assess the
environmental implications of distribution since many distribution activities are not typically known by
consumers. Coddington (1993), argued that very few customers go out of their way to buy green products merely
for the sake of it and concluded that location of the products must be consistent with the image which a company
wants to project, and that the location must differentiate a company from its competitors.
Promotion
Promotion includes advertising, public relations, sales promotion and direct marketing among others. According
to Davis (1993), the key to successful green marketing is credibility, and as such, marketers should never
overstate environmental claims or establish unrealistic expectations (Grundey & Zaharia, 2008, 130) suggest
that the company should advertise the expenditures that it has used on the environmental protection and note that
the green products probably require special attention.
Carlson et al. (1993) suggested that there are four types of environmental information that can be
included in environmental advertising: Product orientation: the claim focuses on the environmentally friendly
attributes that a product possesses. (Biodegradable is an example of such product); Process orientation: the
claim deals with an organization’s internal technology, production technique and/or disposal method that yields
environmental benefits. (For example, 20 per cent of the raw materials used in producing this good are recycled.);
Image orientation: the claim associates an organization with an environmental cause or activity for which there
is broad-based public support. (For example “we are committed to preserving our forests”); Environmental fact:
the claim involves an independent statement that is ostensibly factual in nature from an organization about the
environment at large, or its condition.
METHODS
Research design
Brown, Askew, Baker, Denvir & Millett (2003) observed that “research design provides the glue that holds the
research project together”. A design is used to structure the research, to show how all of the major parts of the
project, which include the samples or groups, measures, treatments or programs, and methods of assignment that
work together to try to address the central research questions. In order to undertake the study a descriptive survey
was used. According to Mugenda & Mugenda (1999) descriptive statistics enable meaningful description of a
distribution of scores or measurements using a few indices or statistics. Descriptive statistics help to simplify
large amounts of data in a sensible way. Each descriptive statistic reduces lots of data into a simpler summary.
Measures of central tendency give the expected score or measure from a group of scores in a study. Measures of
variability, such as standard deviations inform about the distribution of scores around the mean of the
distribution. Frequency distributions show a record of the number of times a score or record appears.
Presentation of the information was done using frequency tables and percentages.
Population of the study
Cooper & Schindler (2005) define a population as the total collection of elements about which the researcher
wishes to make some inferences. Zikmund (2003, p.739) defines a population as “a complete group of entities
sharing some common set of characteristics”. The population of this study was all tea factories in Kenya that are

Journal of Marketing and Consumer Research www.iiste.org
ISSN 2422-8451 An International Peer-reviewed Journal
Vol.11, 2015
139
members of East African Tea Trade Association (EATTA), whose number at 17 as at 30th June 2010 (EATTA,
2010). Kenya Tea Trading Agency Ltd has a total of 57 factories, which operate independently and were all
included in the study. In total, the study targeted a total of 73 tea factories. A sample of 63 organizations was
conducted (the 10 tea firms that participated in the pre-testing of the questionnaires were excluded). The unit of
analysis of the study was the individual tea factory. The study respondent in each of the factories was the
environmental management representative.
Data Collection
In order to investigate the research objective, both secondary and primary data were collected and analyzed. The
first stage of the research process was an extensive search of articles, reports and professional information
concerning green marketing strategies in general and the international dimension of these strategies in particular,
using the internet and academic databases. Secondary data was collected in order to ensure relevance to the
research problem, eliminate duplication of what has been done and provide a clear understanding of existing
knowledge base in the problem area. The analysis of secondary information provided the general context for
initiating the collection, analysis and the interpretation of primary data. In the second stage, primary data was
collected. Saunders, Lewis & Thornhill (2003) argued that primary data is needed to thoroughly answer the
research question and is collected specifically for the research project being undertaken. Hair, Black, Babin,
Anderson & Tatham (2006, p. 64) defined primary data as “gathering of first-hand, new information by the
researcher”. Saunders et al. (2003 p. 245) concluded that “use of interviews and questionnaires help to collect
valid and reliable data relevant to the research questions and objectives.
Data collection instrument
Primary data was collected with the aid of a detailed questionnaire that was completed by the environmental
management representative. According to Neuman (1997), a questionnaire is a written document in quantitative
research that has set of questions directed at respondents. It is used by an interviewer to pose questions to
respondents and to record the answers. The questionnaire was designed to answer the questions identified in the
problem statement.
Structured questions were presented on a likert scale. The likert scale, commonly used in business
research was used because it allows participants to respond with degrees of agreement or disagreement. The
ratings were on a scale from 1 (lowest impact or least important) to 5 (highest impact or most important). The
advantage of closed questions is that it is easier and quicker for respondents to answer. Furthermore, the answers
of different respondents are easier to compare code and statistically analyze. There are also fewer irrelevant or
confused answers and replication is easier. Closed questions are an appropriate means of asking questions that
have a finite set of answers of a clear-cut nature. Sometimes this is factual information, but closed questions are
also used for obtaining data on attitudes and opinions (Anon, 2003d).
The questionnaire included questions that were relevant to the study and followed a logical sequence to
ensure that accurate answers were given and that misunderstandings were avoided. The questionnaire was based
on a quantitative method of data collection. The advantage of this method, as observed by Respini (2000), is that
the researcher is able to collect all the data before analysis and to convert it into numerical values, which are then
manipulated in order to discover patterns or relationships.
Data collection procedure
Prior to launching a full-scale study, the questionnaire was pre-tested on 10 tea factories to ensure its workability
in terms of structure, content, flow, and duration. According to Cooper & Schindler (2005) a pre-test is “the
testing of the questionnaire on a small sample of respondents, preferably 10 or more”. After the pre-testing of the
questionnaire, modifications were made in the questionnaire to reduce the possibility of ambiguity of some of the
questions before delivering them to the respondents. Experts and colleagues who are experienced in research
were also requested to examine the questionnaire to check whether there were any items that needed to be
changed or rephrased, as well as the appropriateness of the time set for completing it. At the end of the exercise,
the items in the questionnaires were considered to be satisfactory in term of both wording and format. The
researcher administered the questionnaires by drop-and-pick method after explaining the purpose of the study
and agreeing on the time frame for the completion of the questionnaires. The data collection was stopped two
months after its commencement.
Validity and reliability of measures
Validity
Validity refers to the extent to which the data collection instrument measures what it is supposed to measure.
Zikmund (2003) defines validity as the ability of a measuring instrument to measure what was intended to be
measured. According to (Sekaran, 2003), content validity is a judgmental act where experts check whether the
items represent the construct which is being studied as well as the wording, formatting and scoring of the
instrument. Two steps were taken to ensure validity. Firstly, wherever possible, research questions from prior
studies were used to improve the validity of the research instrument, in particular (Hall, 2000). Secondly, the
questionnaire was sent to selected academicians as well as 10 randomly selected members of EATTA for perusal

Journal of Marketing and Consumer Research www.iiste.org
ISSN 2422-8451 An International Peer-reviewed Journal
Vol.11, 2015
140
and to assess the structure, length, and appropriateness of the questions used.
Reliability
Reliability is the degree to which measures are free from error and therefore yield consistent results (Zikmund,
2003). The researcher relied on the guidance of the supervisors for reliability of the data collection tool. Factor
analysis was performed for testing the validity of measures used in measuring the drivers for green marketing.
According to Sekaran (2003), “reliability analysis is conducted to ensure that the measures of variables have
internal consistency across time and across the various items that measure the same concept or variable”.
Data analysis and presentation
The following is a brief description of the statistical methods that were employed for this study. According to
Marshall & Rossman (1999), data analysis is the process of bringing order, structure and interpretation to the
mass of collected data. The data collected with the aid of questionnaires was systematically organized in a
manner to facilitate analysis. Data analysis involved preparation of the collected data - coding, editing and
cleaning of data in readiness for processing using Statistical Package for Social Sciences (SPSS) package version
19.0. The coded data was keyed into the SPSS program where it was developed into a database and hence
analyzed. SPSS was preferred because it is very systematic and covers a wide range of the most common
statistical and graphical data analysis.
Extent of adoption and drivers of adoption of green marketing
In order to determine the extent of adoption and drivers of green marketing by the Kenya tea firms, descriptive
statistics were used to illustrate the means and the standard deviation of each research variable. Measures of
central tendency gave the expected score or measure from a group of scores in the study. Measures of variability,
such as standard deviation, informed about the distribution of scores around the mean of the distribution.
Frequency distributions show a record of the number of times a score or record appears.
RESULTS AND DISCUSSIONS
Introduction
The aim of this chapter is to provide a summary of the data collected through the use of questionnaires. General
trends are explained using percentages, tables, figures and descriptions of data as a way to present the findings of
the investigation. The primary data was collected using questionnaires. A total of 63 questionnaires were hand
delivered to respondents (the 10 factories that were used for pre-testing the questionnaire were omitted from the
study), out of which 58 were returned completed (92.1%) return). The data collected was then analyzed using the
Statistical Package for Social Science (SPSS) – version 19.0. The findings are presented as per the objectives,
research questions and hypotheses of the study.
Extent of adoption of green marketing by Kenya tea firms
The study objective was met through seeking answers to the research question “to what extent has green
marketing been adopted by the Kenya tea firms?” Objectives and decision making criteria; green policies and
practices adopted; greening strategies adopted; environmental actions; and green marketing strategies adopted,
were assessed. This section presents details of the findings.
Objectives and decision making
The respondents were asked to indicate the basis upon which their respective factories set their business
objectives and decision making by ticking one alternative from a given list. The responses are summarized and
presented in table 4.1 below.
Table 4.1: Objectives and decision making criteria
Criteria for objective setting and decision making Percentage Mean
score
Standard
deviation
Ranking
All respondent factories
Economic Prosperity 19.0 3
Social Equity 8.6 4
Environmental protection 22.4 2
Combination of 1,2,3 50.0
Average ranking (N = 58) 3.03 1.169 2.50
ISO 9000 and ISO 14001 Certified tea factories
Economic Prosperity 6.7 3
Social Equity 0.0 4
Environmental protection 33.3 2
Combination of 1,2,3 60.0 1
Average ranking (N = 15) 3.47 0.834 2.50
Findings above show that the main basis upon which the tea factories set their objectives and decision

Journal of Marketing and Consumer Research www.iiste.org
ISSN 2422-8451 An International Peer-reviewed Journal
Vol.11, 2015
141
making was a combination of “economic prosperity”, “social equity”, and economic prosperity” as indicated by
(50.0%) of the respondents, followed by “environmental protection”, as indicated by 22.4% of the respondents.
Social equity was the least ranked criteria upon which the tea factories set the business objectives and decision
making. The Standard Deviation is 1.169 and mean is 3.03.
Findings further show that the main basis upon which the tea factories that had obtained both ISO 9000
and ISO 14001 Certification set their objectives and decision making was a combination of “economic
prosperity”, “social equity”, and economic prosperity” as indicated by (60.0%) of the respondents, followed by
“environmental protection”, as indicated by 33.3%% of the respondents. “Economic prosperity” scored only
6.7% whereas social equity was ranked by any of the respondents. The Standard Deviation is 0.834 and mean is
3.47.
Policies and practices
Respondents were asked to indicate the extent to which their tea factories had incorporated the 4-Rs (Recycle,
Refill, Reuse and Reduce), which are the cornerstones of the green marketing strategy in their policies and
practices. The responses are summarized and presented in table 4.2 below.
Item code
PP 1: Recycle – the factory collects all types of packaging for recycling
PP 2: Refill – all outlets provide product refill service
PP 3: Reuse – the factory encourages reuse of promotional materials such as posters
PP 4: Reduce – the factory eliminates all unnecessary packaging
Table 4.2: Cornerstones of the green marketing strategy (4-Rs)
The cornerstones of the green marketing strategy
(4 - Rs)
Much Very
much
Total
(%)
Mean
score
Standard
deviation
Rank
All respondent factories
PP 1 51.7 29.3 81.0 4.10 0.693 3
PP 2 55.2 32.8 88.0 4.21 0.642 2
PP 3 58.6 36.2 94.8 4.31 0.568 1
PP 4 27.6 50.0 77.6 4.28 0.812 4
Average Rank (N = 58) 2.50
ISO 9000 and ISO 14001 Certified tea factories
PP 1 60.0 13.3 73.3 3.87 0.640 4
PP 2 60.0 26.7 86.7 4.13 0.640 2
PP 3 80.0 20.0 100.0 4.20 0.414 1
PP 4 33.3 46.7 80.0 4.27 0.799 3
Average Rank (N = 15) 2.50
Findings above indicate that “Reuse” was the highest ranked green marketing strategy incorporated by
the tea sector factories in their policies and practices, as indicated by all (100%) response. “Refill “was ranked
2nd
, as indicated by (88%) of the respondents. “Reduce” was the least ranked”, as indicated by (77.6%) of the
respondents.
Findings also indicate that “Reuse” was the highest ranked green marketing strategy incorporated by
the tea sector factories that had obtained both ISO 9000 and ISO 14001 Certification in their policies and
practices, as indicated by (94.8%) of the respondents. “Refill” was ranked 2nd
, as indicated by (86.7%) of the
respondents, “Recycle”, as indicated by (73.3%) of the respondents.
Greening strategies
The respondents were asked to indicate the extent to which they agreed/disagreed that their respective tea
factories had adopted each of the three listed greening strategies. The responses are summarized and presented in
table 4.3 below.
Item codes
GS 1: Value-addition processes (firm level) - redesigning processes with the objective of reducing environmental
impact aggravated.
GS 2: Management systems (firm level) – adoption of management systems that create conditions for reducing
the environmental impact of value-addition processes.
GS 3: Products (product level) – adoption of new technologies

Journal of Marketing and Consumer Research www.iiste.org
ISSN 2422-8451 An International Peer-reviewed Journal
Vol.11, 2015
142
Table 4.3: Relative importance of the greening strategies adopted by the tea sector
Item Codes for Greening Strategies Agree Strongly
agree
Total
(%)
Mean Standard
deviation
Rank
All respondent firms
GS 1 39.7 36.2 75.9 4.10 0.810 3
GS 2 56.9 31.0 87.9 4.19 0.634 1
GS 3 32.8 50.0 82.8 4.31 0.799 2
Average Rank (N = 58) 2.0
ISO 9000 and ISO 14001 Certified tea factories
GS 1 33.3 40.0 73.3 4.13 0.834 3
GS 2 53.3 33.3 86.6 4.20 0.676 2
GS 3 33.3 60.0 93.3 4.53 0.640 1
Average Rank (N = 58) 2.0
The findings above indicate that majority of the tea factories (87.9) had adopted the “Management
systems (firm level) - adoption of management systems that create conditions for reducing the environmental
impact of value-addition processes”. “Value-addition processes (firm level) - redesigning processes with the
objective of reducing environmental impact aggravated” was the least ranked greening strategy (75.9%) adopted
by the tea sector in Kenya.
The findings also indicate that majority of the tea factories that had obtained both ISO 9000 and ISO
14001 Certification (93.3%) had adopted the “Products (product level) – adoption of new technologies (for
instance, a steel firm may install a state-of-the art of furnace)”. “Value-addition processes (firm level) -
redesigning processes with the objective of reducing environmental impact aggravated” was the least ranked
greening strategy (73.3%) adopted by the tea factories that had obtained both ISO 9000 and ISO 14001
Certification in Kenya.
Relative importance of green marketing activities undertaken in the tea sector in Kenya
This section presents findings related to the relative importance of green marketing activities undertaken in the
tea sector in Kenya.
Products
Respondents were asked to indicate the extent to which they agreed/disagreed that their factories had taken
environmental actions in each the listed product areas. The responses are summarized and presented in table 4.4
below.
Item code
PDF 1: Design of products for recycling, re-use or disassembly
PDF 2: Recovery of the factory’s end-of-life products
PDF 3: Offering environmental friendly products
PDF 4: Undertaken product standardization to ensure environmentally safe products
Table 4.4: Product focus
5 = Extremely Important
1 = Not important
Agree Strongly
Agree
Total
(%)
Mean Standard
deviation
Rank
All respondent firms
PDF 1 51.7 37.9 89.6 4.28 0.643 6
PDF 2 39.7 41.4 81.1 4.19 0.826 12
PDF 3 43.1 46.6 89.7 4.36 0.667 5
PDF 4 39.7 51.7 91.4 4.43 0.652 3
Average Rank (N = 58) 6.50
ISO 9000 and ISO 14001 Certified tea factories
PDF 1 60.0 33.3 93.3 4.27 0.594 7
PDF 2 33.3 60.0 93.3 4.53 0.640 2
PDF 3 53.3 40.0 93.3 4.33 0.617 6
PDF 4 26.7 66.7 93.4 4.60 0.632 1
Average Rank (N = 15) 4.0
The findings above indicate that “product focus” was the highest ranked overall, with an average
ranking of (6.50). The item that was highest ranked for product focus in terms of percentage was “undertaken
product standardization to ensure environmentally safe products”, with a mean score of 4.43 and a total
percentage of (91.4%) of the respondents indicating either “agree” or “strongly agree”. The least ranked item
was “recovery of the factory’s end-of-life products”, with a mean score of 4.19 and a total of (81.1%) of the
respondents indicating “agree” or “strongly agree”.
The findings also indicate that “product focus” was the highest ranked overall, with an average ranking
Journal of Marketing and Consumer Research www.iiste.org
ISSN 2422-8451 An International Peer-reviewed Journal
Vol.11, 2015
143
of (4.0). The item that was highest ranked for product focus in terms of percentage was “undertaken product
standardization to ensure environmentally safe products”, with a mean score of 4.60 and a total percentage of
(93.4%) of the respondents indicating either “agree” or “strongly agree”. The least ranked item was “design of
products for recycling, re-use or disassembly”, with a mean score of 4.27 and a total of (93.3%) of the
respondents indicating “agree” or “strongly agree”.
Price
Respondents were asked to indicate the extent to which they agree/disagree that their factories had taken
environmental actions in each of the listed price areas. The responses are summarized and presented in table 4.5
below.
Item code
PRF 1: The factory is proactive and by focusing on costs, there is improved cost-effectiveness and a higher
competitive edge
PRF 2: The factory supports adoption of environmental accounting methods to assess costs associated with tea
processing
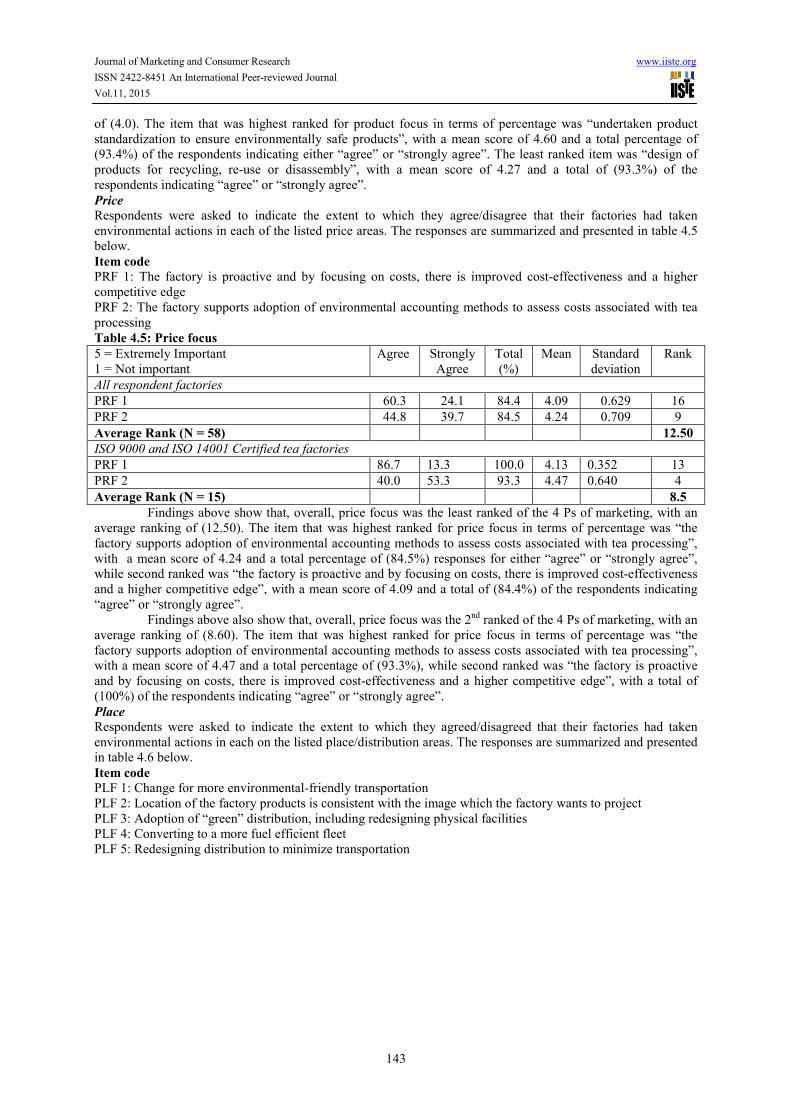
Table 4.5: Price focus
5 = Extremely Important
1 = Not important
Agree Strongly
Agree
Total
(%)
Mean Standard
deviation
Rank
All respondent factories
PRF 1 60.3 24.1 84.4 4.09 0.629 16
PRF 2 44.8 39.7 84.5 4.24 0.709 9
Average Rank (N = 58) 12.50
ISO 9000 and ISO 14001 Certified tea factories
PRF 1 86.7 13.3 100.0 4.13 0.352 13
PRF 2 40.0 53.3 93.3 4.47 0.640 4
Average Rank (N = 15) 8.5
Findings above show that, overall, price focus was the least ranked of the 4 Ps of marketing, with an
average ranking of (12.50). The item that was highest ranked for price focus in terms of percentage was “the
factory supports adoption of environmental accounting methods to assess costs associated with tea processing”,
with a mean score of 4.24 and a total percentage of (84.5%) responses for either “agree” or “strongly agree”,
while second ranked was “the factory is proactive and by focusing on costs, there is improved cost-effectiveness
and a higher competitive edge”, with a mean score of 4.09 and a total of (84.4%) of the respondents indicating
“agree” or “strongly agree”.
Findings above also show that, overall, price focus was the 2nd
ranked of the 4 Ps of marketing, with an
average ranking of (8.60). The item that was highest ranked for price focus in terms of percentage was “the
factory supports adoption of environmental accounting methods to assess costs associated with tea processing”,
with a mean score of 4.47 and a total percentage of (93.3%), while second ranked was “the factory is proactive
and by focusing on costs, there is improved cost-effectiveness and a higher competitive edge”, with a total of
(100%) of the respondents indicating “agree” or “strongly agree”.
Place
Respondents were asked to indicate the extent to which they agreed/disagreed that their factories had taken
environmental actions in each on the listed place/distribution areas. The responses are summarized and presented
in table 4.6 below.
Item code
PLF 1: Change for more environmental-friendly transportation
PLF 2: Location of the factory products is consistent with the image which the factory wants to project
PLF 3: Adoption of “green” distribution, including redesigning physical facilities
PLF 4: Converting to a more fuel efficient fleet
PLF 5: Redesigning distribution to minimize transportation
Journal of Marketing and Consumer Research www.iiste.org
ISSN 2422-8451 An International Peer-reviewed Journal
Vol.11, 2015
144
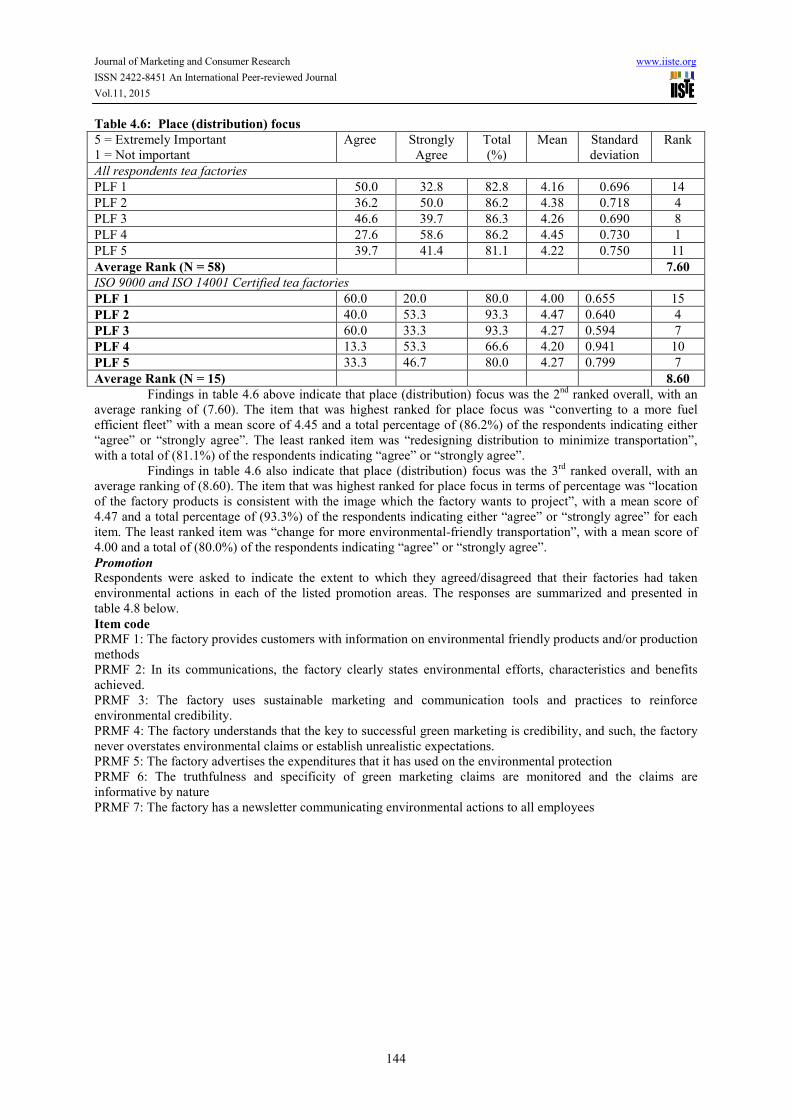
Table 4.6: Place (distribution) focus
5 = Extremely Important
1 = Not important
Agree Strongly
Agree
Total
(%)
Mean Standard
deviation
Rank
All respondents tea factories
PLF 1 50.0 32.8 82.8 4.16 0.696 14
PLF 2 36.2 50.0 86.2 4.38 0.718 4
PLF 3 46.6 39.7 86.3 4.26 0.690 8
PLF 4 27.6 58.6 86.2 4.45 0.730 1
PLF 5 39.7 41.4 81.1 4.22 0.750 11
Average Rank (N = 58) 7.60
ISO 9000 and ISO 14001 Certified tea factories
PLF 1 60.0 20.0 80.0 4.00 0.655 15
PLF 2 40.0 53.3 93.3 4.47 0.640 4
PLF 3 60.0 33.3 93.3 4.27 0.594 7
PLF 4 13.3 53.3 66.6 4.20 0.941 10
PLF 5 33.3 46.7 80.0 4.27 0.799 7
Average Rank (N = 15) 8.60
Findings in table 4.6 above indicate that place (distribution) focus was the 2nd
ranked overall, with an
average ranking of (7.60). The item that was highest ranked for place focus was “converting to a more fuel
efficient fleet” with a mean score of 4.45 and a total percentage of (86.2%) of the respondents indicating either
“agree” or “strongly agree”. The least ranked item was “redesigning distribution to minimize transportation”,
with a total of (81.1%) of the respondents indicating “agree” or “strongly agree”.
Findings in table 4.6 also indicate that place (distribution) focus was the 3rd
ranked overall, with an
average ranking of (8.60). The item that was highest ranked for place focus in terms of percentage was “location
of the factory products is consistent with the image which the factory wants to project”, with a mean score of
4.47 and a total percentage of (93.3%) of the respondents indicating either “agree” or “strongly agree” for each
item. The least ranked item was “change for more environmental-friendly transportation”, with a mean score of
4.00 and a total of (80.0%) of the respondents indicating “agree” or “strongly agree”.
Promotion
Respondents were asked to indicate the extent to which they agreed/disagreed that their factories had taken
environmental actions in each of the listed promotion areas. The responses are summarized and presented in
table 4.8 below.
Item code
PRMF 1: The factory provides customers with information on environmental friendly products and/or production
methods
PRMF 2: In its communications, the factory clearly states environmental efforts, characteristics and benefits
achieved.
PRMF 3: The factory uses sustainable marketing and communication tools and practices to reinforce
environmental credibility.
PRMF 4: The factory understands that the key to successful green marketing is credibility, and such, the factory
never overstates environmental claims or establish unrealistic expectations.
PRMF 5: The factory advertises the expenditures that it has used on the environmental protection
PRMF 6: The truthfulness and specificity of green marketing claims are monitored and the claims are
informative by nature
PRMF 7: The factory has a newsletter communicating environmental actions to all employees

Journal of Marketing and Consumer Research www.iiste.org
ISSN 2422-8451 An International Peer-reviewed Journal
Vol.11, 2015
145
Table 4.8: Promotion focus
5 = Extremely Important
1 = Not important
Agree Strongly
Agree
Total
(%)
Mean Standard
deviation
Rank
All respondent factories
PRMF 1 63.8 15.5 79.3 3.95 0.605 18
PRMF 2 41.4 36.2 77.6 4.14 0.760 15
PRMF 3 44.8 29.3 74.1 4.03 0.748 17
PRMF 4 41.4 37.9 79.3 4.17 0.752 13
PRMF 5 51.7 37.9 89.6 4.28 0.643 6
PRMF 6 37.9 53.4 91.3 4.45 0.654 1
PRMF 7 37.9 43.1 81.0 4.24 0.757 9
Average Rank (N = 58) 11.29
ISO 9000 and ISO 14001 Certified tea factories
PRMF 1 80.0 6.7 86.7 3.93 0.458 17
PRMF 2 33.3 33.3 66.6 4.00 0.845 15
PRMF 3 60.0 13.3 73.3 3.87 0.640 18
PRMF 4 40.0 40.0 80.0 4.20 0.775 10
PRMF 5 73.3 20.0 93.3 4.13 0.516 13
PRMF 6 20.0 66.7 86.7 4.53 0.743 2
PRMF 7 26.7 46.7 73.4 4.20 0.862 10
Average Rank (N = 15 ) 12.14
The findings in table 4.8 above indicate that promotion focus was the 3rd
ranked overall, with an
average ranking of (11.29). The findings also show that “the truthfulness and specificity of the green marketing
claims are monitored and the claims are informative by nature” was ranked highest with a mean score of 4.45
and a total of (91.3%) of the respondents either indicating “agree” or “strongly agree”.
The findings in the table above also indicate that promotion focus was the least ranked overall, with an
average ranking of (12.14). The findings also show that “The truthfulness and specificity of the green marketing
claims are monitored and the claims are informative by nature” was ranked highest (91.3%) and “The factory
advertises the expenditures that it has used on the environmental protection” was ranked 2nd
with (89.6%) of the
respondents indicating a total of “agree” and “strongly agree”. The overall findings of the study with respect to
the relative importance of green marketing activities undertaken in the tea sector in Kenya are summarized and
presented in table 4.9 below.
Table 4.9: Summary of findings with respect to the relative importance of green marketing activities
undertaken in the tea sector in Kenya
Status of ISO Certification Ranking of relative importance of green marketing activities
1st ranked 2
nd ranked 3
rd ranked 4
th ranked
All tea factories irrespective of ISO
9000 and ISO 14001 Certification
(N = 58)
Product focus
(6.5)
Place/
Distribution
(7.60)
Promotion focus
(11.29)
Price focus
(12.50)
Only the tea factories that were both
ISO 9000 and ISO 14001 Certified
(N = 15)
Product focus
(4.0)
Price focus
(8.50)
Place/Distribution
(8.60)
Promotion
focus
(12.40)
Findings above indicate that the relative importance of green marketing activities undertaken in the tea
sector in Kenya (irrespective of ISO 9000 and ISO 14001 Certification) is as follows in terms of average rank: 1st
ranked was product focus with an average rank of (6.50); 2nd
ranked was place (distribution focus), with an
average rank of (7.60); 3rd
ranked was promotion focus, with an average rank of (11.29); and the least ranked
was price focus, with an average rank of (12.50).
Further, the findings in that table above also indicate that the relative importance of green marketing
activities undertaken by the tea factories that were both ISO 9000 and ISO 14001 Certified in Kenya is as
follows in terms of average rank: 1st ranked was product focus with an average rank of (4.50); 2
nd ranked was
price focus, with an average rank of (8.50); 3rd
ranked was Place/Distribution focus (average of 8.60); and the
least ranked was Promotion focus (average of 12.40).
CONCLUSIONS AND RECOMMENDATIONS
Conclusions
Based on the findings of the study, this section presents the conclusions.
The ideas conveyed in this study are in response to the study objective set forth. This study achieved its primary
objective, which was to establish the extent of adoption of green marketing by the Kenya tea firms. Hence, it is

Journal of Marketing and Consumer Research www.iiste.org
ISSN 2422-8451 An International Peer-reviewed Journal
Vol.11, 2015
146
concluded with some contributions to the literature.
The first significant contribution of this study is that green marketing was researched from a different
approach; hence a broader and deeper picture of marketing was investigated. Previously, many researches on
green marketing were often conducted in Western countries such as Germany and United States. An argument
supported by Carter & Carter (1998). In this study, the ideas of green marketing were brought to an emerging
economy (Kenya). This study’s purpose was not to compare between these two groups of countries, it was to put
the research concepts in different situations and environments in order to see the reactions of managers toward
environmental issues.
The results offer evidence for green marketing as an important role to improve firms’ performance.
Bearing this in mind, firms’ managers can work on researching efficient solutions to reduce negative effects as
well as increase positive effects of green marketing activities.
Companies that develop virgin and improved products and services with environment inputs in mind
give themselves access to new markets, increase their profit and enjoy competitive advantage over the
companies which are not concerned for the environment. The advantages of green marketing are specified below.
Green marketing saves money in the long run, though initially the cost is more; It helps in accessing
the new market and enjoying competitive advantage; Green marketing ensures sustained long term growth along
with profitability; It helps companies market their products and services keeping the environment aspects in
mind; As resources are limited and human wants are unlimited, it is important for the marketers to utilize the
resources efficiently without waste and to achieve organization's objectives; and Green marketing helps to
protect the ozone and whole the environment (Chopra, 2007).
Recommendations
In view of the findings of the study, the following recommendations for policy and practice are made:
Like conventional marketers, green marketers must address the ‘four Ps’ in innovative ways.
Product: Businesses wanting to exploit emerging green markets either: (a) identify customers’
environmental needs and develop products to address these needs; or (b) develop environmentally responsible
products to have less impact than competitors. The increasingly wide variety of products on the market that
support sustainable development and are good for the triple bottom line include: products made from recycled
goods; products that can be recycled or reused; efficient products, which save water, energy or gasoline, save
money and reduce environmental impact; products with environmentally responsible packaging; products with
green labels, as long as they offer substantiation; organic products, which offer promise of quality; and certified
products, which meet or exceed environmentally responsible criteria. Whatever the product or service, it is vital
to ensure that the product meets or exceeds the quality expectations of customers and is thoroughly tested.
Price: Pricing is a critical element of the marketing mix. Most customers are prepared to pay a
premium if there is a perception of additional product value. This value may be improved performance, function,
design, visual appeal or taste. Environmental benefits are usually an added bonus but will often be the deciding
factor between products of equal value and quality. Environmentally responsible products, however, are often
less expensive when product life cycle costs are taken into consideration.
Place: The choice of where and when to make a product available has a significant impact on the
customers being attracted. Marketers looking to successfully introduce new green products should, in most cases,
position them broadly in the market place so that they are not just appealing to a small green niche market. The
location must also be consistent with the image which a company wants to project. The location must
differentiate a company from its competitors. This can be achieved by in-store promotions and visually
appealing displays or using recycled materials to emphasize the environmental and other benefits.
Promotion: Promoting products and services to target markets includes paid advertising, public
relations, sales promotions, direct marketing and on-site promotions. Smart green marketers will be able to
reinforce environmental credibility by using sustainable marketing and communications tools and practices. For
example, many companies in the financial industry are providing electronic statements by email. E-marketing is
rapidly replacing more traditional marketing methods, and printed materials can be produced using recycled
materials and efficient processes, such as waterless printing. Retailers, for example, are recognizing the value of
alliances with other companies, environmental groups and research organizations when promoting their
environmental commitment. The key to successful green marketing is credibility. The marketers should never
overstate environmental claims or establish unrealistic expectations, and communicate simply and through
sources that people trust.
Implementing a green marketing strategy requires a fundamental, holistic, integrated approach across
all functional marketing areas, including the entire marketing mix of targeting, pricing, design, positioning and
promotion. For successful implementation, it is critical that green marketing is integrated across all
organizational areas and activities. Thus, the role of green marketing in environmental sustainability
development is to offer the common philosophy and practical tools for implementing environmental
Journal of Marketing and Consumer Research www.iiste.org
ISSN 2422-8451 An International Peer-reviewed Journal
Vol.11, 2015
147
sustainability into the company practices.
Although a large number of firms are using green marketing, there are a number of potential problems
which need to be addressed. Green marketing claims of a firm must: clearly state environmental benefits; explain
environmental characteristics; explain how benefits are achieved; ensure comparative differences are justified;
ensure negative factors are taken into consideration; and only use meaningful terms and pictures.
Consumer marketers need to develop strategies to develop strategies which will allow them to
overcome three problems associated with green marketing: poor credibility; consumer cynicism; and consumer
confusion. The problem of consumer cynicism is also related to green marketing’s past history, as many
producers simply jumped on the green marketing bandwagon without considering the full ramifications of their
actions. If these problems cannot be overcome, it is questionable whether environmental marketing, as a whole,
will be effective.
The benefits searched for by buyers of green products include improvement of the environment in
which they live. In some cases direct benefits can be obtained, such as perceived health advantages of organic
food, the savings on domestic heating and lighting budgets, or the sometimes quite returns on investments in
environmental technologies. The marketer’s best strategy will consequently be to deliver detailed information to
consumers about the environmental credentials of a product or service, or the consequences of advocated forms
of behavior. Thus marketers should typically emphasize the efficiency of cognitive persuasion strategies,
assuming the consumers’ high involvement regarding environmental issues to be a consequence of a growing
environmental consciousness.
Going green is not an easy undertaking for most businesses, it is a process. Not only do you have to
examine every aspect of operations in order to pinpoint areas of waste and pollution, but a responsible business
owner will also check out the supply chain for harmful practices and then try to implement eco-friendly
standards along every step of the way. While some companies never make it beyond installing recycling bins
around the office or switching to recycled paper products, there are plenty that go the extra mile by conserving
energy and water, using chemical-free products and processes, working with eco-friendly vendors, and even
securing a LEED certified office space.
Presented below are some of the green marketing best practices from other industries that the tea sector
could adopt:
General sustainability: Sustainability can help cut costs as well as build sales. The marketers should
therefore be transparent about green marketing claims by ensuing that they are verifiable by an independent,
third party. The marketers should also include their colleagues in their sustainability efforts; often the best ideas
come from the bottom up, rather than from the top down. The marketers should spread the word about the
sustainability efforts their organizations are taking. Simple changes in the offices can have a huge impact: use
energy efficient light bulbs and put recycling bins at every desk. Old batteries, light bulbs and other household
materials should be recycled for free. Employee education is key, and sustainability must be part of the company
culture. If so, it is much easier to implement (and less likely to be cut). The marketers should also make sure that
they back up their green marketing efforts with truly sustainable business practices throughout their
organizations (Chopra, 2007).
Green Printing: The tea sector should either share or recycle the printed piece. Sustainability is more
than the materials used, and it involves the lifecycle of the items. The stakeholders should consider using
chlorine-free paper. The best papers to use are bleached using an oxygen-based process, thus avoiding the
creation of chlorine-related pollution. Vegetable -based inks should be used when possible. Not only are they
generally refined in the United States, but they also reduce our use of petroleum, the majority of which comes
from foreign sources. Consider papers with a high degree of post-consumer content, as they require fewer
resources (energy, water, etc.) to produce. When using eco-friendly papers, make sure to explain the
environmental benefits derived from these choices. These calculations should come from a third-party source
rather than a calculation from an industry source. (Grundey & Zaharia, 2008). The tea sector should also use
renewable energy (like wind or solar power) in the production process.
Best Practices in marketing
Green Design: When designing products, the organizations should consider how the products are produced.
When sustainability is important, colors that works well with vegetable-based inks on recycled paper. By
designing a lighter, smaller piece, you can save energy, freight costs, as well as reduce the amount of paper used.
This can also help keep postage costs down if the piece is being mailed (Murphy & Poist, 2003).
Green promotional products: Corn plastic is practically indestructible. Choosing promotional corn
plastic coffee mugs is a wise decision for the office since you can be sure that if they are dropped they will not
break. They are also practical, attractive and economical as well as biodegradable. Recycled grocery bags can
carry twice as many items as plastic shopping bags and are easier and more comfortable to carry. In addition,
they are made from strong fabric that will last for many years, keeping your brand top-of-mind. Not only is
organic cotton chemical and pesticide-free, but it is also softer and more comfortable to the touch than blended

Journal of Marketing and Consumer Research www.iiste.org
ISSN 2422-8451 An International Peer-reviewed Journal
Vol.11, 2015
148
cotton. The tea sector should consider alternative materials as a way to send a sustainable message. These
include recycled fabrics, bamboo, biodegradable substrates, and solar-powered items (Zhu et al., 2005).
Perception: The 5th P – moving beyond Product, Price, Place and Promotion: allow consumers to
contribute to a solution, make sustainability a part of your value proposition and make sure goals are easy to
locate and articulated. When goals are achieved, let it be known; be pro-active: form a partnership or sponsor an
event; Internal Marketing: boost employee morale through education and empowerment; Involve them in a
dialogue on strategies with committees, giving them tools and resources; Downstream stakeholder relations; and
Work with key customers whose initiatives overlap with both operations (Zeithaml et al., 2006).
Limitations of the study and recommended areas for further study The following limitations could affect the generalisability of the study results:
To date literature on the extent of adoption, the drivers and influence of green marketing initiatives on
firm performance in Kenya is scarce. There is thus limited empirical data for comparison. In addition, the sample
size of the study is relatively small (58 tea factories) to draw generalized conclusions on factors driving the
decision to adopt green marketing strategies and explore the influence of adopting such strategies on
performance of firms across different industries in Kenya. Therefore, there is a need to replicate this study using
managerial samples from other countries with different cultural characteristics and/or levels of economic
development to allow for comparison of findings which can then be generalized across diverse sectors. The
following areas are suggested for further study:
As opposed to industry wide generalization of the current results, a new study could be replicated in
specific industry settings. Some industry sectors such as chemicals and health care services usually deal with
more hazardous materials than others and consequently may view green marketing as a more integral part of
marketing strategy. Therefore, it would be intriguing to see how significant a role industry differences, corporate
culture, and financial capacity play in the adoption and maturity of green marketing; and Consider time
dimension through comparing green marketing between different stages of adoption, such as innovators, early
adopters, late adopters and laggards. This comparison may facilitate the identification of the drivers of each stage
of adoption, which in turn, may enrich knowledge about these drivers.
REFERENCES
Anon (2003d): Questionnaire Implementation.
http://www.economics.Itsn.ac.uk/handbook/questionnaires/21.htm
Aragon-Correa, J. & Sharma, S. (2003). “A contingent resource-based view of proactive corporate
environmental strategy”, Academy of Management Review, Vol. 28 No. 1, pp. 71-88.
Baker, W.E. & Sinkula, J.M. (2005). “Market orientation and the new product paradox”, The Journal of Product
Innovation Management, Vol. 22 No. 6, pp. 483-502.
Balderjahn, I. (1988). “Personality variables and environmental attitudes as predictors of ecologically
responsible consumption patterns”, Journal of Business Research, Vol. 17, pp. 51-6.
Barrett, S. (1991). Environmental regulations for competitive advantage. Business Strategy Review 2: 1–15.
Bartlett, E. & Howard, N. (2000). Informing the Decision Makers on the Cost and Value of Green Building.
Building Research and Information, 28(5-6), 315-324.
Baumann, H., Boons, F. & Bragd, A. (2002). “Mapping the green product development field: engineering, policy
and business perspectives”, Journal of Cleaner Production, Vol. 10, pp. 409 25.
Bhat, V.N. (1993). “Green marketing begins with green design”, Journal of Business & Industrial Marketing,
Vol. 8 No. 3, pp. 26-31.
Bridges, C. M. & Wilhelm, W. B. (2008). Going Beyond Green: The "Why and how" of Integrating
Sustainability into the Marketing Curriculum. Journal of Marketing Education, 30 (1), 33-46.
Brown, M., Askew, M., Baker, D., Denvir, H. & Millett, A. (2003). ‘Is the National Numeracy Strategy
Research-Based?’ British Journal of Educational Studies, 46, 4, 362-385.
Carlson, L., Stephen, J.G. & Kangun N. (1993). A content analysis of environmental advertising claims: a matrix
approach. Journal of Advertising 22: 27–40.
Carr, S.B. (1993). Improving cash crops in Africa: factors influencing the productivity of cotton, coffee and tea
grown by smallholders. World Bank.
Charter, M. & Polonsky, M.J. (eds). (1999). Greener Marketing: a Global Perspective on Greening Marketing
Practice, 2nd
edn. Greenleaf: Sheffield.
Charter, M. (1992). Greener Marketing: A Responsible Approach to Business, Greenleaf Publishing, Sheffield.
CHOICE (1990). “Green cleaners”, CHOICE, September, pp. 10 – 4.
Chopra, S.L. (2007). “Turning Over a New Leaf”, Indian Management, Vol. 64, April 2007.
Coddington, W. (1993). Environmental Marketing: Positive Strategies for Reaching the Green Consumer.
McGraw-Hill: New York.
Cooper, D. R. & Schindler, P.S. (2005). Business Research Methods, 8th edition, Mc Graw-Hill, New Delhi,

Journal of Marketing and Consumer Research www.iiste.org
ISSN 2422-8451 An International Peer-reviewed Journal
Vol.11, 2015
149
India.
Cresswell, J. (2003). Research design. USA: Sage Publications.
Davis, J.J. (1993). Strategies for environmental advertising. Journal of Consumer Marketing 10: 19–36.
Dembkowski, S. & Hanmer-Lloyd, S. (1994). “The environmental attitude-system model: a framework to guide
the understanding of environmentally conscious consumer behavior”, in Carson, D. et al. (Eds),
Marketing: Unity in Diversity. Proceedings of the Annual Conference of the Marketing Education
Group, Coleraine, 4-6 July, pp. 232-41.
Drumwright, M. E. (1994). “Socially Responsible Organizational Buying: Environmental Concern as a Non-
economic Buying Criterion”, Journal of Marketing, 58 (July), pp. 1-19.
Duff, M. (1990). “Springtime in marketing: will supermarkets find gold in the “green” issue? Loblaw’s, Wal-
Mart, and others are betting they can”, Supermarket Business, Vol. 45 No. 4, pp. 15-24, 45.
Fuller, D.A. (1999). Sustainable Marketing: Managerial-ecological issues. Thousand Oaks, C.A: SAGE
Publications.
Grove, S.J., Fisk, R.P., Pickett, G.M. & Kangun, N. (1996). “Going green in the service sector: social
responsibility issues, implications and implementation”, European Journal of Marketing, Vol. 30 No.
5, pp. 56-66.
Grundey, D. & Zaharia, R. M. (2008). Sustainable incentives in marketing and strategic greening: the cases of
Lithuania and Romania. Technological and economic development Baltic Journal on Sustainability, 14
(2), 130–143.
Hair, J.F., Black, W.C., Babin, B.J., Anderson, R.E. & Tatham, R.L. (2006). Multivariate Data Analysis, 6th ed.,
Pearson Prentice-Hall, Upper Saddle River, NJ.
Hall , J . (2000). “Environmental supply chain dynamics”, Journal of cleaner production , Vol, .8 No.6 , pp.455-
71.
Imballagio, I. (2002). “Ecology and distribution”, The Magazine for Packaging, March, available at:
www.italiaimballaggio.it/italiaimballaggio/03 02/sezioni/04 envir/art2 envir.html
Isherwood, K. (2000). Mineral Fertilizer Distribution and the Environment, International Fertilizer Industry
Association, UNEP, Paris, March.
Kalafatis, S.P. Pollard, M. East, R. & Tsogas, M.H. (1999). “Green marketing and Ajzen’s theory of planned
behavior: a cross-market examination”, Journal of Consumer Marketing, Vol. 16 No. 5, pp. 441-60.
Kalama, E. (2007). Green marketing practices by Kenya petroleum refineries. A study of the perception of
management of oil companies in Kenya: Unpublished University of Nairobi, Kenya. MBA Project.
Kapelianis, D. & Strachan, S. (1996). “The price premium of an environmentally friendly product”, South
African Journal of Business Management, Vol. 27 No. 4, pp. 89-95.
Kassarjian, H.H. (1971). “Incorporating ecology into marketing strategy: the case of air pollution”, Journal of
Marketing, Vol. 35, July, pp. 61-5.
Kenya Tea Development Agency (KTDA) (2006). ChaiNews. KTDA. Nairobi.
Kenya Tea Development Agency (KTDA) (2007). Company Profile Brochure. KTDA. Nairobi
Kenya Tea Development Agency (KTDA). website: www.ktdateas.com. KTDA. Nairobi
Kilbourne, W.E. (1998). “Green Marketing: A Theoretical Perspective”, Journal of Marketing Management, 14,
641-655.
Kinnear, T.C., Taylor, J.R. & Ahmed, S.A. (1974). “Ecologically concerned consumers – who are they?”,
Journal of Marketing, Vol. 38 No. 2, pp. 20-4.
Kiongera, F.N. ((2003). Green marketing practices in cement industry in Kenya: Unpublished University of
Nairobi, Kenya. MBA Project.
Marshall, C. & Rossman G. (1999). Designing qualitative research 3rd Ed., Thousand Oaks-CA: Sage.
Mbadi, P.K. (2010). “Engaging tea smallholders to sustainable agriculture practices” IDH Conference
Presentation, 2010, KTDA.
McCaughan, D. (1991). “The ‘green’ saturation point”, The Sydney Morning Herald, 30 May, p. 26.
McDaniel, S.W. & Rylander, D.H. (1993). “Strategic green marketing”, Journal of Consumer Marketing, Vol.
10 No. 3, pp. 4-10.
McDougall, G.H.G. (1993), “The green movement in movement in Canada: implications for marketing strategy”,
Journal of International Consumer Marketing, Vol. 15 No. 3, pp. 69 – 87.
Mendleson, N. & Polonsky, M.J. (1995). Using strategic alliances to develop credible green marketing. Journal
of Consumer Marketing 12: 4–18.
Menon, A. & Menon, A. (1997). “Enviropreneurial Marketing Strategy: The Emergence of Corporate
Environmentalism as Market Strategy”, Journal of Marketing, 61 (1), pp. 51 – 67.
Milne, G.R., Iyer, E. & Gooding-Williams, S. (1996). “Environmental organization alliance relationships within
and across nonprofit, business and government sectors”, Journal of Public Policy and Marketing, Vol.
15 No. 2, pp. 203-15.

Journal of Marketing and Consumer Research www.iiste.org
ISSN 2422-8451 An International Peer-reviewed Journal
Vol.11, 2015
150
Mugenda O.M. & Mugenda, A.G. (1999). Research methods: Quantitative and Qualitative Approaches, African
Centre of technology studies, Nairobi.
Murphy, P.R. & Poist, R.F. (2003). “Green perspectives and practices: a ‘comparative logistics’ study”, Supply
Chain Management, Vol. 8 No. 2, pp. 122-31.
Neuman, W.L. (1997). Social Research Methods: Qualitative and Quantitative Approaches, 3rd
ed., Allan &
Bacon, Needham Heights, MA.
Obuya, E.N. (2003). A Survey of the Extent to Which Manufacturing Firms in Nairobi Practice Green Marketing:
Unpublished University of Nairobi, Kenya. MBA Project.
Odhiambo, S.A. (2008). A Survey of the Extent to Which Floricultural Firms in Kenya Practice Green
Marketing: Unpublished University of Nairobi, Kenya. MBA Project.
Ottman, J. & Terry, V. (1998). “Strategic marketing of greener products”, The Journal of Sustainable Product
Design, Vol. 5, April, pp. 53-7.
Ottman, J. (1992a). “Green Marketing: Challenges and Opportunities for the New Marketing Age, NTC
Business Books, Lincolnwood, IL.
Ottman, J. (1992b). “Sometimes, consumers will pay more to go green”, Marketing News, Vol. 26 No. 6, p. 16.
Ottman, J.A. (1993). Green marketing: challenges and opportunities for the new marketing age. Chicago (IL):
NTC Publishing Group.
Ottman, J.A. (1994), Green Marketing, NTC Business Books, Lincolnwood, IL.
Peattie K. (1995). Environmental Marketing Management: Meeting the Green Challenge. Pitman Publishing:
London.
Peattie, K. & Charter, M. (1994), “Green marketing”, in Baker, M. (Ed.), The Marketing Book, Butterworth
Heinneman, Oxford.
Peattie, K. (1992). “Green marketing”, The M & E Handbook Series, Longman, London.
Polonsky, M. (1995). “A stakeholder theory approach to designing environmental marketing strategy”, Journal
of Business and Industrial Marketing, Vol. 10 No. 3, pp. 29-46.
Polonsky, M.J. & Mintu-Wimsatt, A.T. (Eds) (1995). Environmental Marketing: Strategies, Practice, Theory,
and Research, The Haworth Press, New York, NY.
Polonsky, M.J. & Rosenberger III, P.J. (2001). “Re-evaluating green marketing: a strategic approach”. Business
Horizons, 44 (5), 21-30.
Polonsky, M.J. (1994). An introduction to green marketing. Electronic Green Journal, 1 (2).
Polonsky, M.J., Bailey, J., Baker, H., Basche, C., Jepson, C. & Neath, L. (1997). “Communicating
environmental information: are marketing claims on packaging misleading?”, Journal of Business
Ethics, Vol. 16.
Prakash, A. (2002). “Factors in firms and industries affecting the outcomes of voluntary measures,” in T. Dietz
and P. Stern (eds.) New Tools for Environmental Protection: Education, Information and Voluntary
Measures (Washington DC: National Academy Press) pp. 303-310.
Respini, L. (2000). The Corporation and the Triple Bottom Line. http://www.dow.com/dow-news/speeches/10-
18-00.htm
Rogers, D.S. & Tibben-Lembke, R.S. (2001). An overview of reverse logistics practices. Journal of Business
Logistics 22 (1).
Saunders, M., Lewis, P. & Thornhill, A. (2003). Research Methods for Business Students, Fourth Edition,
Prentice Hall, Pearson Education, London.
Schlegelmilch, B.B. & Robertson, D. (1995). “The influence of country and industry on ethical perceptions of
senior executives in the US and Europe”, Journal of International Business Studies, Vol. 26 No. 4, pp.
852-81.
Schlegelmilch, B.B., Bohlen, G.M. & Diamantopoulos, A. (1996). “The link between green purchasing decisions
and measures of environmental consciousness”, European Journal of Marketing, Vol. 30 No. 5, pp.
35-55.
Sekaran, U. (2003). Research Methods for Business: A Skill Building Approach, Wiley, Singapore.
Stafford, E.R. & Hartman, C.L. (1996). “Green alliances: strategic relations between businesses and
environmental groups”, Business Horizons, Vol. 2, pp. 50-59.
Thiong’o, S.M. (2009). An Investigation of Green Marketing Practices among Pharmaceutical Firms in Kenya:
Unpublished University of Nairobi, Kenya. MBA Project.
Wal, S. (2008). Sustainability Issues in the Tea Sector. A Comparative Analysis of Six Leading Producing
Countries, Amsterdam.
Worcester, R. (1993). Public and Elite Attitudes to Environmental Issues, MORI, London.
Zeithaml, V.A., Parasuraman, A. & Berry, L.L. (2006). “Problems and strategies in services marketing”, Journal
of Marketing, Vol. 49, Spring, pp. 33-46.
Zhu,Q., Sarkis, J., & Lai, K.H. (2005). Green supply chain management: Pressures, practices and performance

Journal of Marketing and Consumer Research www.iiste.org
ISSN 2422-8451 An International Peer-reviewed Journal
Vol.11, 2015
151
within the Chinese automobile industry. Journal of Cleaner Production, 15, 1041-1052.
Zikmund, W. (2003). Business research methods, USA: South - Western.
APPENDIX I: LISTING OF TEA FACTORIES THAT ARE MEMBERS OF EAST AFRICAN TEA
TRADE ASSOCIATION (EATTA)
No. Tea Company
1 Ceres Estates
2 Eastern Producers Kenya
3 James Finlay Kenya Ltd
4 Kaisugu Ltd
5 Karirana Tea Estates
6 Kenya Tea Development Agency Ltd
7 Keritor Ltd
8 Kipkebe Ltd (Sasini Tea & Coffee Ltd)
9 Kiptagich Tea Estates Ltd
10 Koisagat Tea Estate Ltd
11 Maramba Tea Factory Ltd
12 Nandi Tea Estates Ltd
13 Ngorongo Tea Factory Ltd
14 Sotik Highlands Tea Estates
15 The Sotik Tea Company
16 Tinderet Tea Estates Ltd
17 Unilever Tea Kenya Ltd
Source: East African Tea Trade Association (EATTA, 2011 )
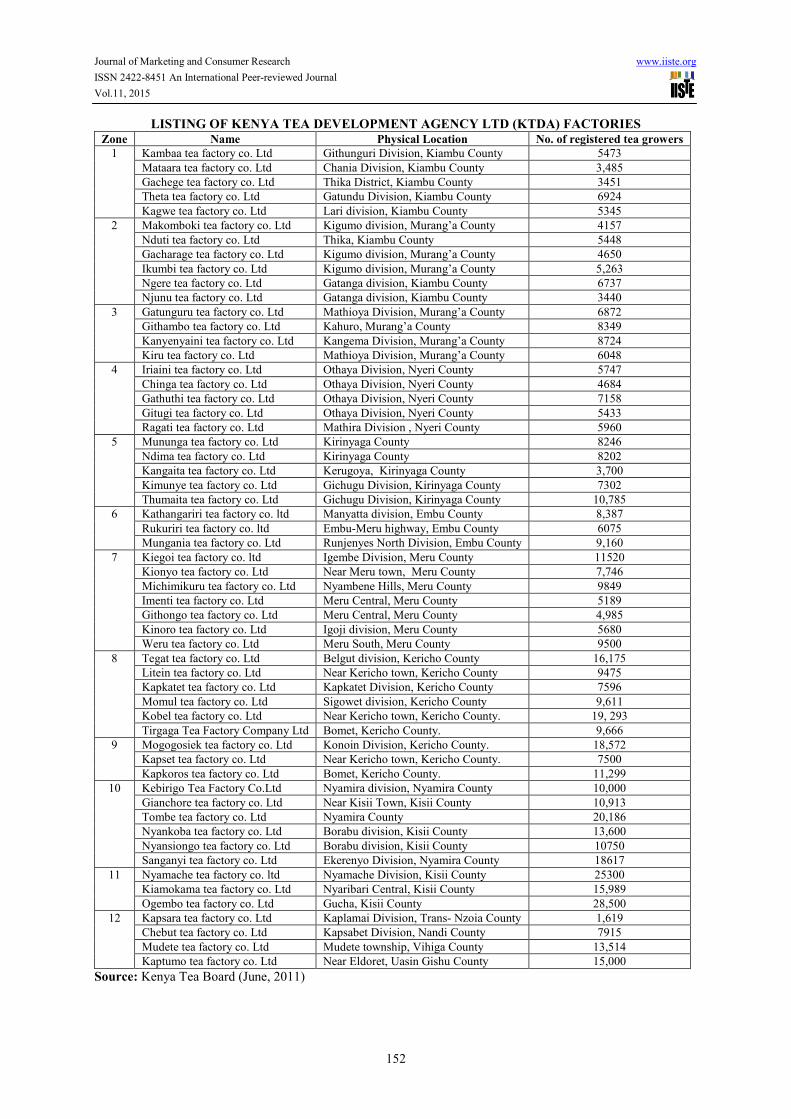
Journal of Marketing and Consumer Research www.iiste.org
ISSN 2422-8451 An International Peer-reviewed Journal
Vol.11, 2015
152
LISTING OF KENYA TEA DEVELOPMENT AGENCY LTD (KTDA) FACTORIES
Zone Name Physical Location No. of registered tea growers
1 Kambaa tea factory co. Ltd Githunguri Division, Kiambu County 5473
Mataara tea factory co. Ltd Chania Division, Kiambu County 3,485
Gachege tea factory co. Ltd Thika District, Kiambu County 3451
Theta tea factory co. Ltd Gatundu Division, Kiambu County 6924
Kagwe tea factory co. Ltd Lari division, Kiambu County 5345
2 Makomboki tea factory co. Ltd Kigumo division, Murang’a County 4157
Nduti tea factory co. Ltd Thika, Kiambu County 5448
Gacharage tea factory co. Ltd Kigumo division, Murang’a County 4650
Ikumbi tea factory co. Ltd Kigumo division, Murang’a County 5,263
Ngere tea factory co. Ltd Gatanga division, Kiambu County 6737
Njunu tea factory co. Ltd Gatanga division, Kiambu County 3440
3 Gatunguru tea factory co. Ltd Mathioya Division, Murang’a County 6872
Githambo tea factory co. Ltd Kahuro, Murang’a County 8349
Kanyenyaini tea factory co. Ltd Kangema Division, Murang’a County 8724
Kiru tea factory co. Ltd Mathioya Division, Murang’a County 6048
4 Iriaini tea factory co. Ltd Othaya Division, Nyeri County 5747
Chinga tea factory co. Ltd Othaya Division, Nyeri County 4684
Gathuthi tea factory co. Ltd Othaya Division, Nyeri County 7158
Gitugi tea factory co. Ltd Othaya Division, Nyeri County 5433
Ragati tea factory co. Ltd Mathira Division , Nyeri County 5960
5 Mununga tea factory co. Ltd Kirinyaga County 8246
Ndima tea factory co. Ltd Kirinyaga County 8202
Kangaita tea factory co. Ltd Kerugoya, Kirinyaga County 3,700
Kimunye tea factory co. Ltd Gichugu Division, Kirinyaga County 7302
Thumaita tea factory co. Ltd Gichugu Division, Kirinyaga County 10,785
6 Kathangariri tea factory co. ltd Manyatta division, Embu County 8,387
Rukuriri tea factory co. ltd Embu-Meru highway, Embu County 6075
Mungania tea factory co. Ltd Runjenyes North Division, Embu County 9,160
7 Kiegoi tea factory co. ltd Igembe Division, Meru County 11520
Kionyo tea factory co. Ltd Near Meru town, Meru County 7,746
Michimikuru tea factory co. Ltd Nyambene Hills, Meru County 9849
Imenti tea factory co. Ltd Meru Central, Meru County 5189
Githongo tea factory co. Ltd Meru Central, Meru County 4,985
Kinoro tea factory co. Ltd Igoji division, Meru County 5680
Weru tea factory co. Ltd Meru South, Meru County 9500
8 Tegat tea factory co. Ltd Belgut division, Kericho County 16,175
Litein tea factory co. Ltd Near Kericho town, Kericho County 9475
Kapkatet tea factory co. Ltd Kapkatet Division, Kericho County 7596
Momul tea factory co. Ltd Sigowet division, Kericho County 9,611
Kobel tea factory co. Ltd Near Kericho town, Kericho County. 19, 293
Tirgaga Tea Factory Company Ltd Bomet, Kericho County. 9,666
9 Mogogosiek tea factory co. Ltd Konoin Division, Kericho County. 18,572
Kapset tea factory co. Ltd Near Kericho town, Kericho County. 7500
Kapkoros tea factory co. Ltd Bomet, Kericho County. 11,299
10 Kebirigo Tea Factory Co.Ltd Nyamira division, Nyamira County 10,000
Gianchore tea factory co. Ltd Near Kisii Town, Kisii County 10,913
Tombe tea factory co. Ltd Nyamira County 20,186
Nyankoba tea factory co. Ltd Borabu division, Kisii County 13,600
Nyansiongo tea factory co. Ltd Borabu division, Kisii County 10750
Sanganyi tea factory co. Ltd Ekerenyo Division, Nyamira County 18617
11 Nyamache tea factory co. ltd Nyamache Division, Kisii County 25300
Kiamokama tea factory co. Ltd Nyaribari Central, Kisii County 15,989
Ogembo tea factory co. Ltd Gucha, Kisii County 28,500
12 Kapsara tea factory co. Ltd Kaplamai Division, Trans- Nzoia County 1,619
Chebut tea factory co. Ltd Kapsabet Division, Nandi County 7915
Mudete tea factory co. Ltd Mudete township, Vihiga County 13,514
Kaptumo tea factory co. Ltd Near Eldoret, Uasin Gishu County 15,000
Source: Kenya Tea Board (June, 2011)
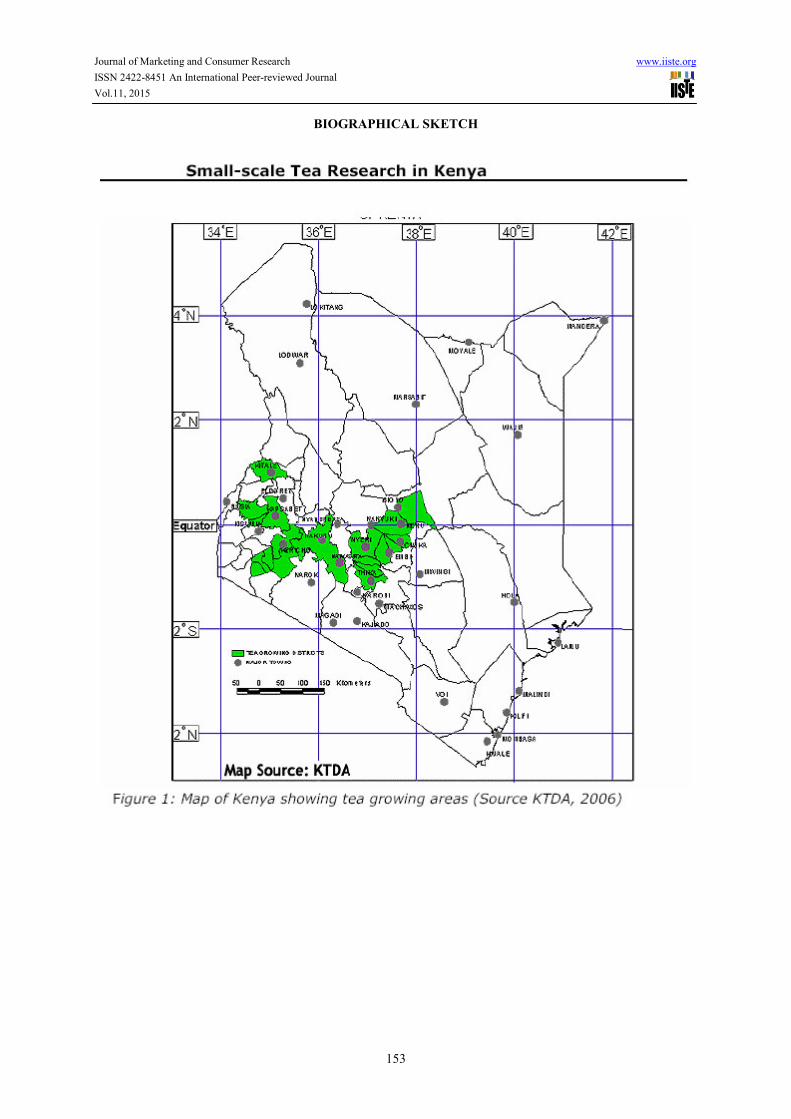
Journal of Marketing and Consumer Research www.iiste.org
ISSN 2422-8451 An International Peer-reviewed Journal
Vol.11, 2015
153
BIOGRAPHICAL SKETCH

The IISTE is a pioneer in the Open-Access hosting service and academic event management.
The aim of the firm is Accelerating Global Knowledge Sharing.
More information about the firm can be found on the homepage:
http://www.iiste.org
CALL FOR JOURNAL PAPERS
There are more than 30 peer-reviewed academic journals hosted under the hosting platform.
Prospective authors of journals can find the submission instruction on the following
page: http://www.iiste.org/journals/ All the journals articles are available online to the
readers all over the world without financial, legal, or technical barriers other than those
inseparable from gaining access to the internet itself. Paper version of the journals is also
available upon request of readers and authors.
MORE RESOURCES
Book publication information: http://www.iiste.org/book/
Academic conference: http://www.iiste.org/conference/upcoming-conferences-call-for-paper/
IISTE Knowledge Sharing Partners
EBSCO, Index Copernicus, Ulrich's Periodicals Directory, JournalTOCS, PKP Open
Archives Harvester, Bielefeld Academic Search Engine, Elektronische Zeitschriftenbibliothek
EZB, Open J-Gate, OCLC WorldCat, Universe Digtial Library , NewJour, Google Scholar
Recommended