Copyright, 2016 SAPPORO HOLDINGS LTD. All rights reserved.
1
Updated on September 30, 2016
FACT BOOK
Sapporo Holdings Ltd.URL http://www.sapporoholdings.jp/english

Copyright, 2016 SAPPORO HOLDINGS LTD. All rights reserved.
2
①Sapporo Group International Expansion Group Companies by Geographic Area / Trend of Overseas Net Sales ・・・・・・・・・・・・・・・・・4 Sales Breakdown by Geographic Area, Sales Breakdown by category・・・・・・・・・・・・・・・・・・ 5 International Expansion of Sapporo Group・・・・・・・・・・・・・・・・・・・・・・・・・・・・・・・・・・・・・・・・・・・・6
②Market Data by country & Sapporo Group Activities Canada : Beer Market Data and Sapporo Group Activities・・・・・・・・・・・・・・ ・・・・・・・・・・・・・・・ 8 United States of America:Beer Market Data and Sapporo Group Activities・・・・・・・・・・・・・10
Fruit juice Market Data and Sapporo Group Activities・・・・・・・・11 Vietnam: Beer Market Data and Sapporo Group Activities ・・・・・・・・・・・・ ・・・・・・・ ・・・・・・・ 13 Singapore : Market Data and Sapporo Group Activities<Beer/ Restaurants / Soft Drinks> ・・・15 Sapporo Group Activities in Southeast Asia countries・・・・・・・・・・・・・・・・・ ・・ ・・ ・・ ・・ ・・ ・・ 17 South Korea & Australia : Beer Market Data and Sapporo Group Activities・・・・・ ・・ ・・ ・・・18 Japan:Beer Market Data and Sapporo Group Activities・・・・・・・・・・・・・・・・・・・・ ・・ ・・ ・・ ・・ 19
Soft Drinks Market Data and Sapporo Group Activities・・・・・・・・・・・・・・・・・ ・・ ・・ ・・ 24<Soup/ Lemon-based flavoring> Market Data and Sapporo Group Activities・・・ 26Real Estate Market Data and Sapporo Group Activities・・・・・・・・・・・・・・・・・・・・・・・・ ・27Restaurant Market Data and Sapporo Group Activities・・・・・・・・・・・・・・・・・・・・・・・・ ・30
③Financial Data Sapporo Group Overview・・・・・・・・・・・・・・・・・・・・・・・・・・・・・・・・・・・・・・・・・・・・・・・・・・・・・・・・・・・ ・35 Financial Data(Profit and Loss Trends, Financial Condition, Segment Information) ・・・・ 36 Corporate Data・・・・・・・・・・・・・・・・・・・・・・・・・・・・・・・・・・・・・・・・・・・・・・・・・・・・・・・・・・・・・・・・・ ・・・・ 48
Contents
Copyright, 2016 SAPPORO HOLDINGS LTD. All rights reserved.
3
①Sapporo Group International Expansion

Copyright, 2016 SAPPORO HOLDINGS LTD. All rights reserved.
4
Group Companies by Geographic Area /Trend of Overseas Net Sales
Sapporo Group Companies by Geographic Area
GeographicArea Country Company name Business Segment
NorthAmerica
Canada SLEEMAN BREWERIES LTD. Manufacture and sales of beer International
U.S.SAPPORO U.S.A., Inc. Sales of beer InternationalSILVER SPRINGS CITRUS, INC. Manufacture and sales of soft drinks InternationalCOUNTRY PURE FOODS, INC. Manufacture and sales of soft drinks International
Asia
Vietnam SAPPORO VIETNAM LTD. Manufacture and sales of beer International
Singapore POKKA CORPORATION(SINGAPORE) PTE. LTD. Manufacture and sales of soft drinks Food & Soft DrinksSAPPORO LION (SINGAPORE) PTE. LTD. Operation of restaurants Restaurants
Malaysia POKKA (MALAYSIA)SDN.BHD. Manufacture and sales of soft drinks Food & Soft DrinksIndonesia PT.POKKA DIMA INTERNATIONAL Manufacture and sales of soft drinks Food & Soft Drinks
Japan
SAPPORO BREWERIES LTD. Manufacture and sales of alcoholic beverages Japanese Alcoholic BeveragesSAPPORO INTERNATIONAL INC. Sales of beer InternationalPOKKA SAPPORO FOOD & BEVERAGE LTD. Manufacture and sales of food & soft drinks Food & Soft DrinksPOKKA CREATE CO., LTD. Operation of coffee shops Food & Soft DrinksSAPPORO LION LTD. Operation of restaurants RestaurantsSAPPORO REAL ESTATE CO., LTD. Leasing and rental of real estate Real Estate
(billions of yen) <Overseas net sales (excluding liquor tax) ratio>
Copyright, 2016 SAPPORO HOLDINGS LTD. All rights reserved.
5
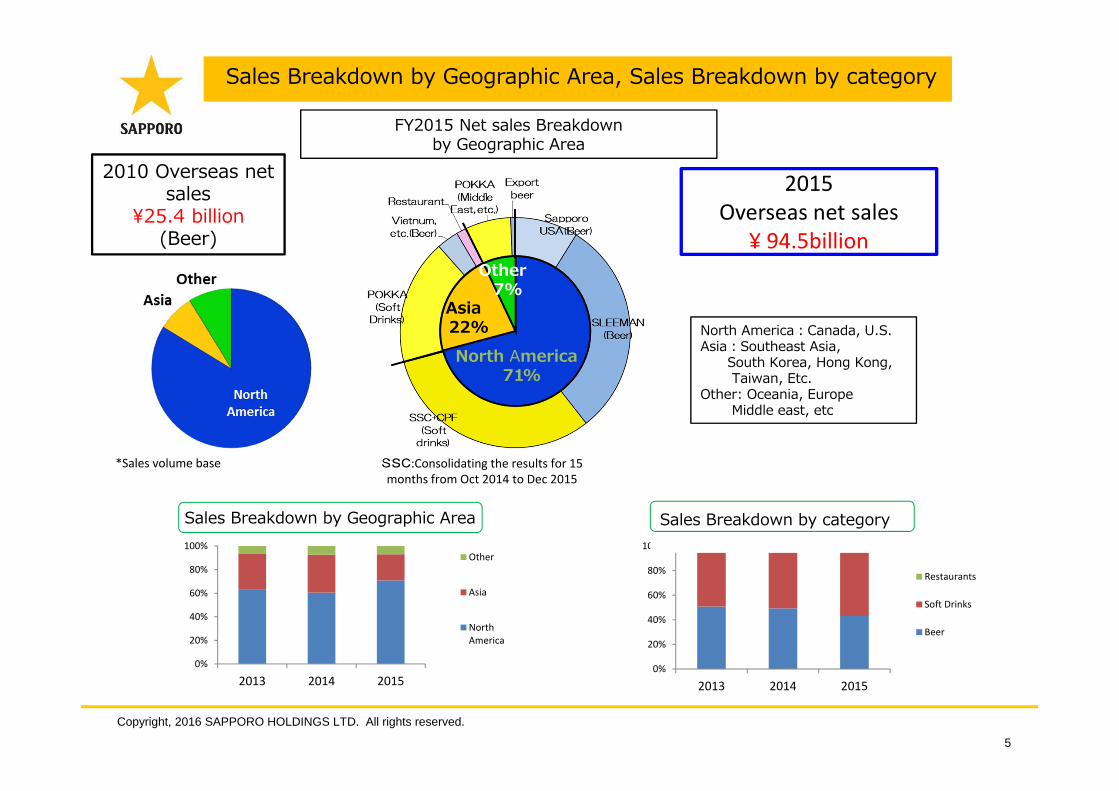
Sales Breakdown by Geographic Area, Sales Breakdown by category
0%
20%
40%
60%
80%
100%
2013 2014 2015
Other
Asia
NorthAmerica
0%
20%
40%
60%
80%
100%
2013 2014 2015
Restaurants
Soft Drinks
Beer
Sales Breakdown by categorySales Breakdown by Geographic Area
North America71%
Asia22%
Other7%
SSC:Consolidating the results for 15 months from Oct 2014 to Dec 2015
FY2015 Net sales Breakdown by Geographic Area
*Sales volume base
2010 Overseas net sales
¥25.4 billion(Beer)
2015Overseas net sales
¥ 94.5billion
North America:Canada, U.S.Asia:Southeast Asia,
South Korea, Hong Kong, Taiwan, Etc.
Other: Oceania, EuropeMiddle east, etc

Copyright, 2016 SAPPORO HOLDINGS LTD. All rights reserved.
6
International Expansion of Sapporo Group
<Canadian beer business>FY2015 SLEEMAN net sales CA$ 345 millions (before elimination of intra‐company transactions)
2006: made into subsidiary
<U.S. beer business>FY2015 Sapporo USA net sales US$ 61 millions (before elimination of intra‐company transactions)
1984: established
Made into subsidiary (a 51% stake)2012: Silver Spring Citrus2015: Country Pure Foods
<U.S. soft drinks business>FY2016 To have net sales of approx. US$ 250 millions
<Beer business>Production outsourced to
Coopers
<Beer business>Sales alliance with Maeil Dairies
<Beer business>2011: established a brewery in VietnamPromoting expansion in Southeast Asia
<Restaurants business>2 Ginza Lion restaurants14 restaurants in total
<Soft drinks business>1977: entered into SingaporeFY2015: Overseas net sales SG$ 256millions (before elimination of intra‐company transactions)
<Enhancement of soft drinks production structure>Malaysia: 2014: New plant completed
Myanmar: License‐based productionagreement2016: To start operation
Indonesia: Established joint venture witha local company2016: To start operation

Copyright, 2016 SAPPORO HOLDINGS LTD. All rights reserved.
7
②Market Data by Country &Sapporo Group Activities

Copyright, 2016 SAPPORO HOLDINGS LTD. All rights reserved.
8
Canada:Beer Market Data and Sapporo Group Activities
(1)Basic Data*• Population:Approx. 35.90mn (2015)• Population growth rate:+0.8%• Average age:39.7• GDP: 1,785billion$(2014)• GDP per capita:50,169$(2014)
• GDP growth rate:+2.4%(2014)
(2-1) Beer Market(2014)• Beer Production volume:
Approx. 1.9mn KL• Beer consumption per person:
Approx.56L• Beer market growth rate:-1.0%• Breakdown by sales channel:
On Premise 25%, Off Premise75%
(2-2) Sapporo Group Activities • Entry into business:Oct. 2006 Acquired 95.83% share of
SLEEMAN BREWERIES LTD. by TOB
Nov. 2006 Acquired 100% Share of SLEEMAN BREWERIES LTD.
・Acquisition price 293.6mnCA$( approx.30.3 bn yen at the rate of 1CA$=103.27 yen)
<Competitors Share>
A company 48%B company 36%
【Beer brand by price category in Canada】
* Source: Statistics Bureau, Ministry of Internal Affairs and Communications「The statistics of the world2015」
*Highlight in red: Our sales brand
SLEEMANMarket Share:8%
N0.3 Canadian beer manufacturer
Price Category Brand Difference
HIGH Import Heineken, Corona +15~25%
Premium Sapporo Premium, Unibroue, SLEEMAN, Okanagan Spring +10~20%
Mainstream Labatt, Molson ±0
LOW Value Bush, Key stone, Pabst blue ribbon, Old milwaukee ‐20%
Copyright, 2016 SAPPORO HOLDINGS LTD. All rights reserved.
9
Canada:Beer Market Data and Sapporo Group Activities
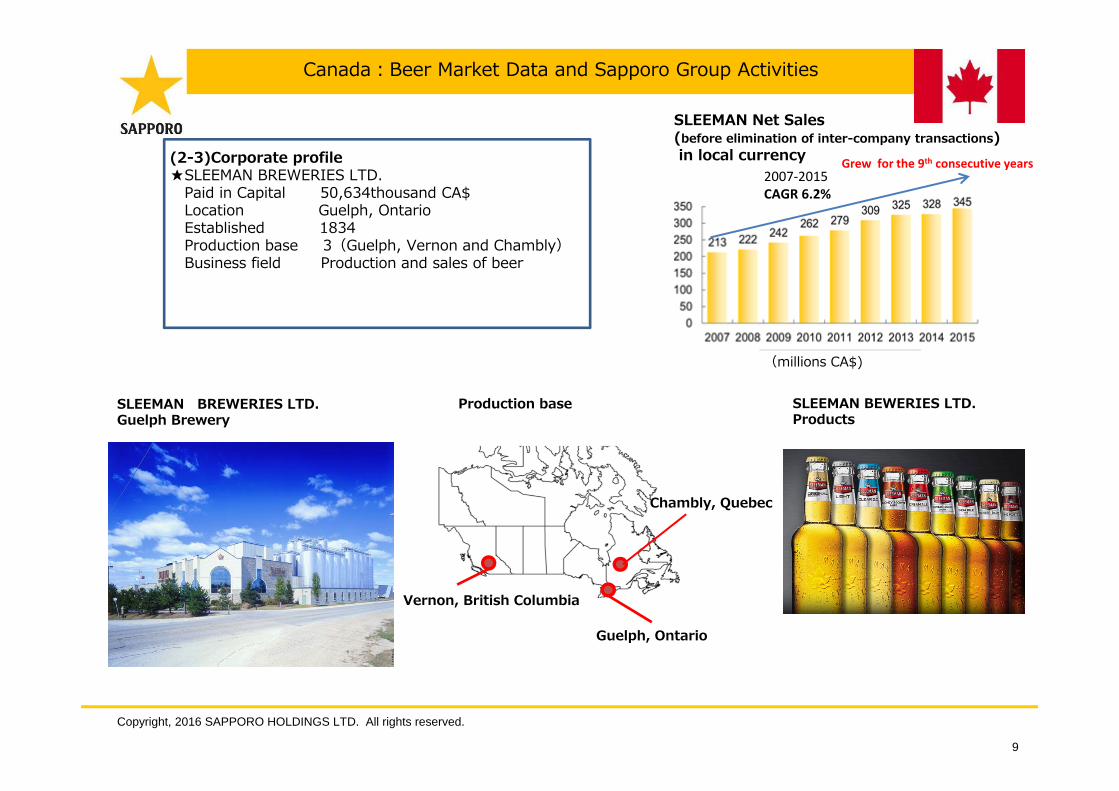
(2-3)Corporate profile★SLEEMAN BREWERIES LTD.
Paid in Capital 50,634thousand CA$Location Guelph, Ontario Established 1834Production base 3(Guelph, Vernon and Chambly)Business field Production and sales of beer
SLEEMAN Net Sales(before elimination of inter-company transactions)in local currency Grew for the 9th consecutive years
SLEEMAN BEWERIES LTD.Products
SLEEMAN BREWERIES LTD.Guelph Brewery
2007‐2015 CAGR 6.2%
Vernon, British Columbia
Guelph, Ontario
Chambly, Quebec
Production base
(millions CA$)

Copyright, 2016 SAPPORO HOLDINGS LTD. All rights reserved.
10
United States of America:Beer Market Data and Sapporo Group Activities
(1)Basic Data*• Population: Approx. 321.8mn(2015)• Population growth rate:+0.8%• Average age:37.1• GDP: 17,348.1billion$(2014)• GDP per capita:54,306$(2014)• GDP growth rate:+2.4%(2014)
(2-1) Beer Market(2014)• Beer Production volume:
Approx.22.55mn kL• Beer consumption per person:
Approx.76L• Beer market growth:+0.2%• Breakdown by sales channel: On premise 20%, Off premise 80%
(2-2) Sapporo Group Activities• Local subsidiary: Sapporo U.S.A., Inc.• Paid in capital: 7.2 million$ • Entry into business: July 1984• Business field:Sales of beer• 1984 Started sales of Sapporo Draft Beer which was imported from Japan
2002 Started OEM to SLEEMAN BREWRIES (SLEEMAN became part of Sapporo group in 2006)
• Top Asian beer seller for 29 consecutive years
Distinctive 650ml can productNickname “Silver Cup”
Sapporo USA Inc.Products
Grew for the 6thconsecutive years
* Source: Statistics Bureau, Ministry of Internal Affairs and Communications「The statistics of the world2015」
2007‐2015 CAGR 4.4%
Sapporo USA Inc. Net Sales(before elimination of inter-companytransactions) in local currency【Beer brand by price category in U.S】
Price Category Brand DifferenceHIGH Non‐U.S. Sapporo Premium, Corona, Heineken +20~50%
Craft Samuel Adams, Sierra NevadaSuper Premium Michelob, Blue moon, Shock top +10~40%
Premium Budweiser, Coors, Miller ±0LOW Popular Busch, Pabst , Highlife, Keystone ‐10~40%

Copyright, 2016 SAPPORO HOLDINGS LTD. All rights reserved.
11
(3-1) Fruit juice market Source :Sapporo estimate
• Fruit juice market size:Approx.16.8 bn$Non-blended 100% Fruit juice market size: Approx. 9.8bn$(Chilled 3.2bn$, PB chilled 0.6bn$)
• Non-commercial use fruit juice market size : Approx.1.1bn$ (For education sectors 0.5bn$,
For health care sectors 0.4bn$)
United States of America:Fruit juice Market Data and Sapporo Group Activities
(3-2) Sapporo Group Activities• Entry into business: Jan 2012 Acquired Silver Springs Citrus, Inc. 51% share
(Joint Venture with Toyota Tsusho America Inc.)・Acquisition price :18.35mn yen Cost incurred directly in the acquisition: 0 mn yenAcquisition cost :18.35mn yen*Goodwill:4.21mn yen 5 years with the straight‐line method
Market Share20% Top U.S. PB Chilled fruit juice manufacturer
Feb 2015 Acquired Country Pure Foods, Inc. 51% share(Joint Venture with Toyota Tsusho America Inc.)
・Acquisition price :43.70mn yen Cost incurred directly in the acquisition: 4.91mn yenAcquisition cost :48.61mn yen*Goodwill:44.26mn yen 9 years with the straight‐line method
For educational and health care sectorsNon‐commercial chilled fruit juice market share 10%
May 2016 Acquired the frozen fruit juice business ofThe Ridgefield's Brand Corporation, Inc. through Country Pure Foods, Inc. for the equivalent of approx.1.5 bn yen
Frozen fruit juice business for U.S school meals
Fruit juice market16.8bn$
Non-blended 100% fruit juice 9.8bn$
PB Chilled0.6 bn$
Chilled 3.2bn$
Non-commercial use1.1 bn$
21%
55%
5%
18%1%
Non‐commercial fruit juice market
Non‐chilled
Chilled
Non‐chilled (Bagged)
Frozen concentrated
Other
Size 1.1bn$

Copyright, 2016 SAPPORO HOLDINGS LTD. All rights reserved.
12
(3-3)Company Profile★Silver Springs Citrus, Inc.Paid in Capital 62.5mn$(including additional Paid in Capital)Location Orlando, FloridaEstablished 1921Production base 1 (Florida)Business field Manufacturing and sales of PB beverages for major
food supermarkets and commissioned manufacturing of chilled beverages for major beverage manufactures
Net sales 122mn$(2015), 114mn$(2014)
★Country Pure Foods, Inc.Paid in Capital 37.1mn$(including additional Paid in Capital)Location Akron, OhioEstablished 1948Production base 4( Ohio, Florida, Connecticut, Texas)Business field Manufacture and sales of food service juice in the
healthcare and education sectors Manufacture and sale of retail chain PB label juiceManufacturing services and sales for leading juice companies
Net sales 127.3mn$(2015), 155mn$(2014)
United States of America:Fruit juice Market Data and Sapporo Group Activities
Production base
Silver Springs Citrus, Inc. Products
Country Pure Foods, Inc. Products
Akron, Ohio
Huston, Texas
Wellington, Connecticut
De Land, Florida
Orlando, Florida
Copyright, 2016 SAPPORO HOLDINGS LTD. All rights reserved.
13
Vietnam:Beer Market Data and Sapporo Group Activities
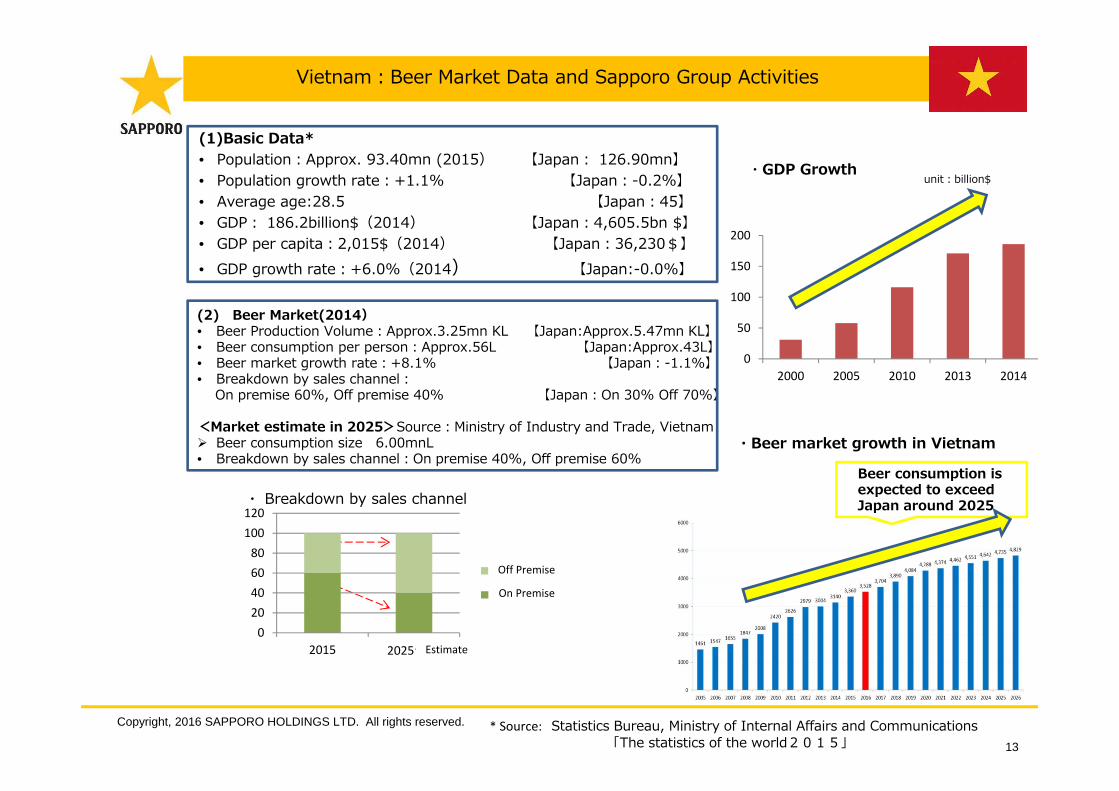
(1)Basic Data*• Population:Approx. 93.40mn (2015) 【Japan: 126.90mn】• Population growth rate:+1.1% 【Japan:-0.2%】• Average age:28.5 【Japan:45】• GDP: 186.2billion$(2014) 【Japan:4,605.5bn $】• GDP per capita:2,015$(2014) 【Japan:36,230$】• GDP growth rate:+6.0%(2014) 【Japan:-0.0%】
・GDP Growthunit:billion$
(2) Beer Market(2014)• Beer Production Volume:Approx.3.25mn KL 【Japan:Approx.5.47mn KL】• Beer consumption per person:Approx.56L 【Japan:Approx.43L】• Beer market growth rate:+8.1% 【Japan:-1.1%】• Breakdown by sales channel:
On premise 60%, Off premise 40% 【Japan:On 30% Off 70%】
<Market estimate in 2025>Source:Ministry of Industry and Trade, Vietnam Beer consumption size 6.00mnL• Breakdown by sales channel:On premise 40%, Off premise 60%
・ Breakdown by sales channel
・Beer market growth in Vietnam
Beer consumption is expected to exceed Japan around 2025
* Source: Statistics Bureau, Ministry of Internal Affairs and Communications「The statistics of the world2015」
0
50
100
150
200
2000 2005 2010 2013 2014
020406080
100120
2015 2025予測
家庭用
業務用
Estimate
Off Premise
On Premise

Copyright, 2016 SAPPORO HOLDINGS LTD. All rights reserved.
14
(3) Sapporo Group Activities• Local subsidiary : Sapporo Vietnam LTD.• Paid in capital: 708,595mn VND(≒39mn$)• Entry into business:Nov.2011 Completed construction of
Sapporo Long An Brewery Apr.2012 Full-scale market entry into Vietnam
• Construction cost:Approx.5.2 bn yen• Annual production capacity:40 thousand KL• Expanding sales of Sapporo Premium Beer using its convenient location to
maximum advantage to make inroad into surrounding countries in Asia• Exporting seven of the 10 ASEAN countries
Sapporo Vietnam Long An Brewery
<Competitors Share>Source :Sapporo estimate
A Company 41%B Company 21%C Company 20%
Sapporo Premiummade in Vietnam
Vietnam:Beer Market Data and Sapporo Group Activities
100円
40円
70円
Trend of sales volume in Vietnam
100 yen
70 yen
40 yen
The value in 2013 is set as 100 <Premium>
Sapporo, Heineken, Budweiser, etc.
<Mainstream>Tiger, Saigon Special., etc.
<Economy>Saigon Beer, 333, etc.
Vietnamese beer market categories by price
●Sales price per 330ml can

Copyright, 2016 SAPPORO HOLDINGS LTD. All rights reserved.
15
Singapore:Market Data and Sapporo Group Activities<Beer/ Restaurants/Soft Drinks>
(1)Basic Data*• Population:Approx.5.53mn (2015)• Population growth rate:+1.2%• Average age:39.6• GDP: 307.9billion$(2014)• GDP per capita:56,284$(2014)
• GDP growth rate:+2.9%(2014)
(3-2)Restaurants business• Local subsidiary : SAPPORO LION (SINGAPORE) PTE. LTD.• Paid in capital: 4mn SG$ • Entry into business:Aug. 1991 Established POKKA FOOD(SINGAPORE) PTE .LTD.
Operating Restaurants businessJan. 2013 Made POKKA FOOD (SINGAPORE) into Sapporo Lion Subsidiary
Operating「GINZA LION BEER HALL」• Business field:Operating beer halls and restaurants, Production and sales of cake• Number of outlets:14(As of June 30,2016)
(2-2)Sapporo GroupʼsOperating business • Expanding sales channel to
off premise market with POKKACORPORATION (SINGAPORE) from 2010• Sales volume in 2015 2.2 times in comparison with 2010
“Spreading the culture of beer hall to the world”
GINZA LION BEER HALLFirst outlet RobertsonOpened Oct. 2013
GINZA LION BEER HALLSecond outlet SuntecOpened Oct.2014
* Source: Department of Statistics Singapore
1. Beer2. Restaurants3. Soft Drinks
(3-1)Beer business
TONKICHI Isetan Scotts

Copyright, 2016 SAPPORO HOLDINGS LTD. All rights reserved.
16
Singapore:Market Data and Sapporo Group Activities<Beer/ Restaurants/Soft Drinks>
(3-3) Soft Drinks Business• Local subsidiary : POKKA CORPORATION (SINGAPORE) PTE.LTD.• Paid in capital: 26mn SG$ • Entry into business:Jan.1977 Established POKKA CORPORATION (SINGAPORE) PTE.LTD • Production base:Singapore1, Malaysia2• Annual production capacity:Approx. 13mn cases• Business field:Production and sales of Soft Drinks
PolicyRight Product to
Right Market
POKKA CORPORATION (SINGAPORE) PTE.LTD.Products
<Market share withinSingapore>
Tea drinks market 48%(Green tea category65%)
Non-chilled Juice category23%
※Nielsen Market Track DECʼ 15
Top 1 Brand
POKKACORPORATION (SINGAPORE) Sales composition
Exporting Products to 60 Countries

Copyright, 2016 SAPPORO HOLDINGS LTD. All rights reserved.
17
・License agreement withKah Hock Pte. Ltd.
・Plan to start operation licenseeʼs plant in 2016
• Started POKKA brand productssales through PT DIMA INDONESIAfrom 2000
・ Mar. 2015Established joint venture with PT DIMA INDONESIA, PT.POKKA DIMA INTERNATIONAL
• Plan to complete construction plant in 2016Annual production capacity(plan) :
5mn cases
Myanmar
Indonesia
Malaysia
・Completed construction Malaysia plant in Oct. 2014
・Construction cost: 34.2mnSG$( approx.2.7bn yen)
・Annual production capacity:6mn Cases
Obtained Malaysian Halal certification, which is trusted world-wide
Sapporo Group Activities in Southeast Asia countries<Soft Drinks>
Copyright, 2016 SAPPORO HOLDINGS LTD. All rights reserved.
18
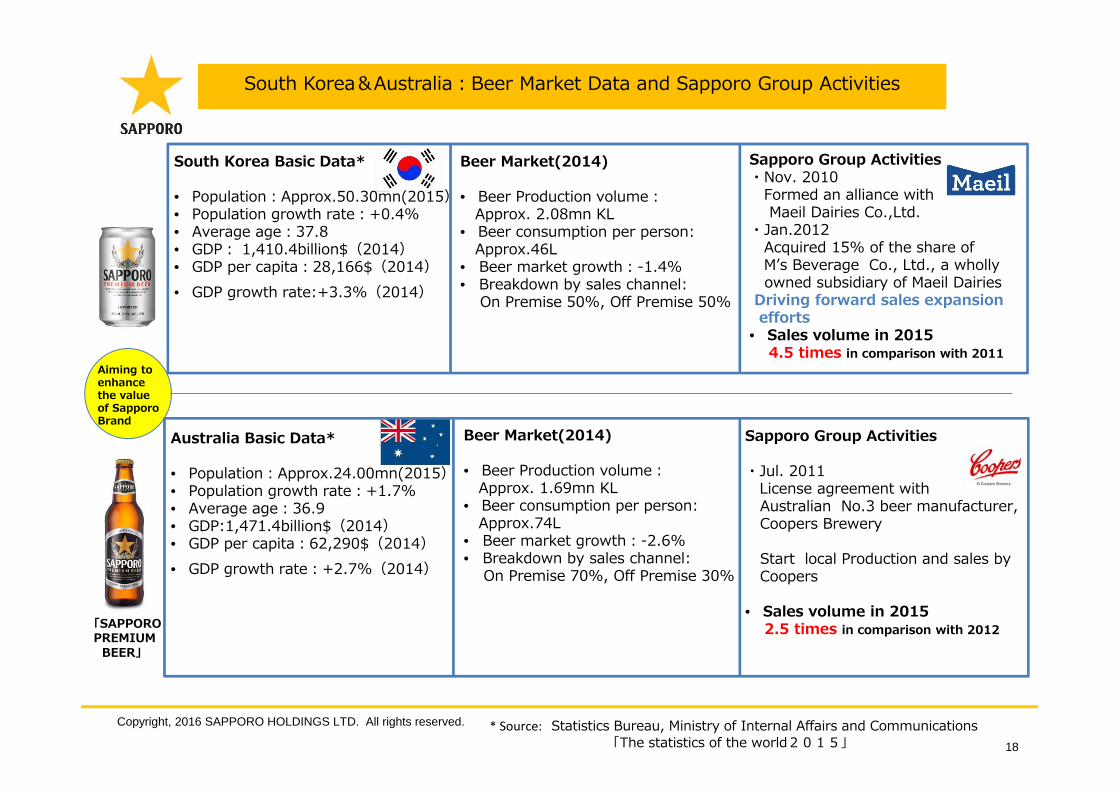
South Korea&Australia:Beer Market Data and Sapporo Group Activities
South Korea Basic Data*
• Population:Approx.50.30mn(2015)• Population growth rate:+0.4%• Average age:37.8• GDP: 1,410.4billion$(2014)• GDP per capita:28,166$(2014)• GDP growth rate:+3.3%(2014)
Australia Basic Data*
• Population:Approx.24.00mn(2015)• Population growth rate:+1.7%• Average age:36.9• GDP:1,471.4billion$(2014)• GDP per capita:62,290$(2014)• GDP growth rate:+2.7%(2014)
Beer Market(2014)
• Beer Production volume:Approx. 2.08mn KL
• Beer consumption per person:Approx.46L
• Beer market growth:-1.4%• Breakdown by sales channel:
On Premise 50%, Off Premise 50%
Sapporo Group Activities・Nov. 2010
Formed an alliance withMaeil Dairies Co.,Ltd.
・Jan.2012Acquired 15% of the share of Mʼs Beverage Co., Ltd., a whollyowned subsidiary of Maeil Dairies
Driving forward sales expansionefforts
• Sales volume in 2015 4.5 times in comparison with 2011
Sapporo Group Activities
・Jul. 2011License agreement with Australian No.3 beer manufacturer, Coopers Brewery
Start local Production and sales by Coopers
• Sales volume in 2015 2.5 times in comparison with 2012「SAPPORO
PREMIUM BEER」
Aiming to enhance the value of Sapporo Brand
Beer Market(2014)
• Beer Production volume:Approx. 1.69mn KL
• Beer consumption per person:Approx.74L
• Beer market growth:-2.6%• Breakdown by sales channel:
On Premise 70%, Off Premise 30%
* Source: Statistics Bureau, Ministry of Internal Affairs and Communications「The statistics of the world2015」

Copyright, 2016 SAPPORO HOLDINGS LTD. All rights reserved.
19
Japan:Beer Market Data and Sapporo Group Activities
●Total taxed shipments volume of beer-type beverages(Millions of cases, Total of 5 companies)
(mn cases)
(mn cases)
2006 2007 2008 2009 2010 2011 2012 2013 2014 2015Beer-type beverages
total volume 497.52 496.07 482.68 472.51 459.17 442.39 438.11 433.57 427.08 424.92
Beer volume 276.63 274.04 256.12 239.04 230.48 221.03 220.45 216.69 214.60 214.90Composition of
Bottle(%) 25.6 23.7 23.2 22.5 21.6 20.5 19.7 18.9 18.2 17.6
Can(%) 44.3 46.3 45.4 45.0 45.2 45.7 45.9 45.9 46.3 46.9
Keg(%) 30.1 30.0 31.4 32.5 33.2 33.8 34.4 35.2 35.5 35.5
Happoshu volume 124.78 121.67 112.36 94.88 78.07 68.02 62.65 58.69 61.30 61.46
New-genre volume 96.09 100.37 114.20 138.59 150.63 153.34 155.02 158.19 151.18 148.57
●Composition of taxed shipments by product category (Total of 5 companies)
020406080
100
2006200720082009201020112012201320142015
Keg
Can
Bottle
0%
20%
40%
60%
80%
100%
2006200720082009201020112012201320142015
New-genre
Happoshu
Beer
(%)
0
100
200
300
400
500
600
2006 2007 2008 2009 2010 2011 2012 2013 2014 2015
Beer
Happoshu
New-genre
Beer-type
beverages total
●Composition of taxed shipments by container type (Total of 5 companies)
Copyright, 2016 SAPPORO HOLDINGS LTD. All rights reserved.
20
Japan:Beer Market Data and Sapporo Group Activities
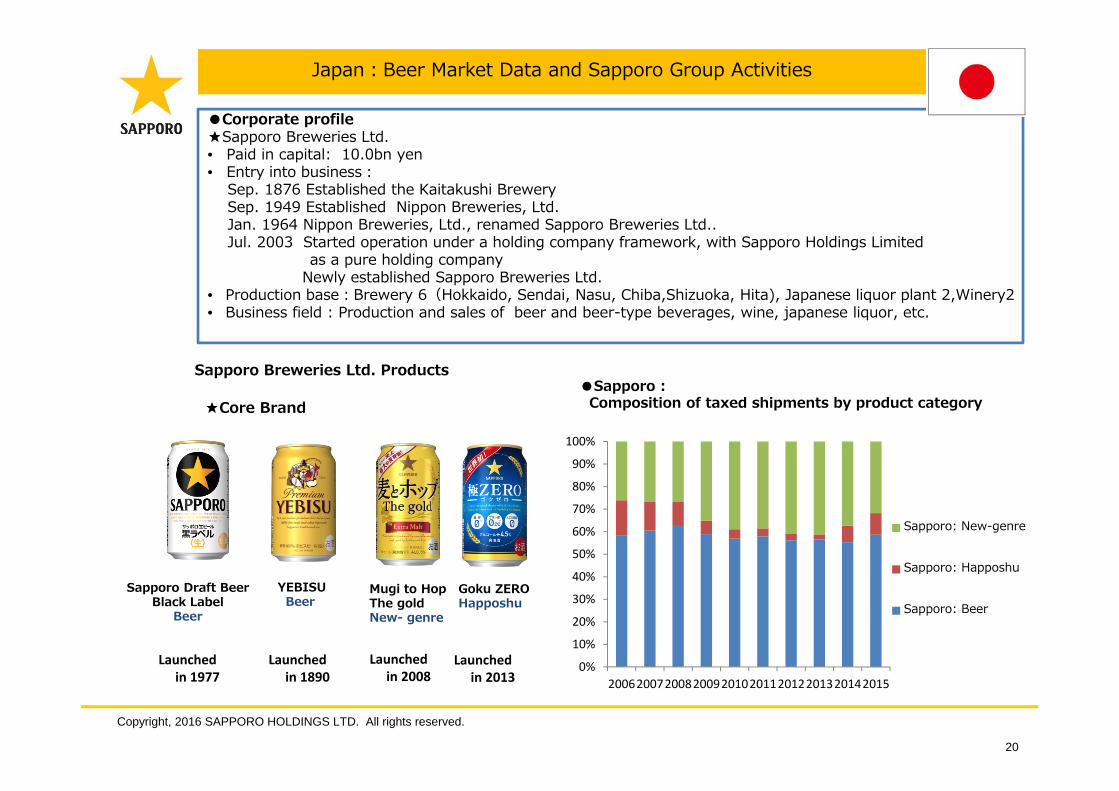
●Corporate profile★Sapporo Breweries Ltd.• Paid in capital: 10.0bn yen • Entry into business:
Sep. 1876 Established the Kaitakushi BrewerySep. 1949 Established Nippon Breweries, Ltd. Jan. 1964 Nippon Breweries, Ltd., renamed Sapporo Breweries Ltd..Jul. 2003 Started operation under a holding company framework, with Sapporo Holdings Limited
as a pure holding companyNewly established Sapporo Breweries Ltd.
• Production base:Brewery 6(Hokkaido, Sendai, Nasu, Chiba,Shizuoka, Hita), Japanese liquor plant 2,Winery2• Business field : Production and sales of beer and beer-type beverages, wine, japanese liquor, etc.
Sapporo Breweries Ltd. Products
★Core Brand
Sapporo Draft Beer Black Label
Beer
YEBISUBeer
Mugi to HopThe goldNew- genre
Goku ZEROHapposhu
Launchedin 1977
0%
10%
20%
30%
40%
50%
60%
70%
80%
90%
100%
2006200720082009201020112012201320142015
Sapporo: New-genre
Sapporo: Happoshu
Sapporo: Beer
Launchedin 1890
Launchedin 2008
Launchedin 2013
●Sapporo :Composition of taxed shipments by product category
Copyright, 2016 SAPPORO HOLDINGS LTD. All rights reserved.
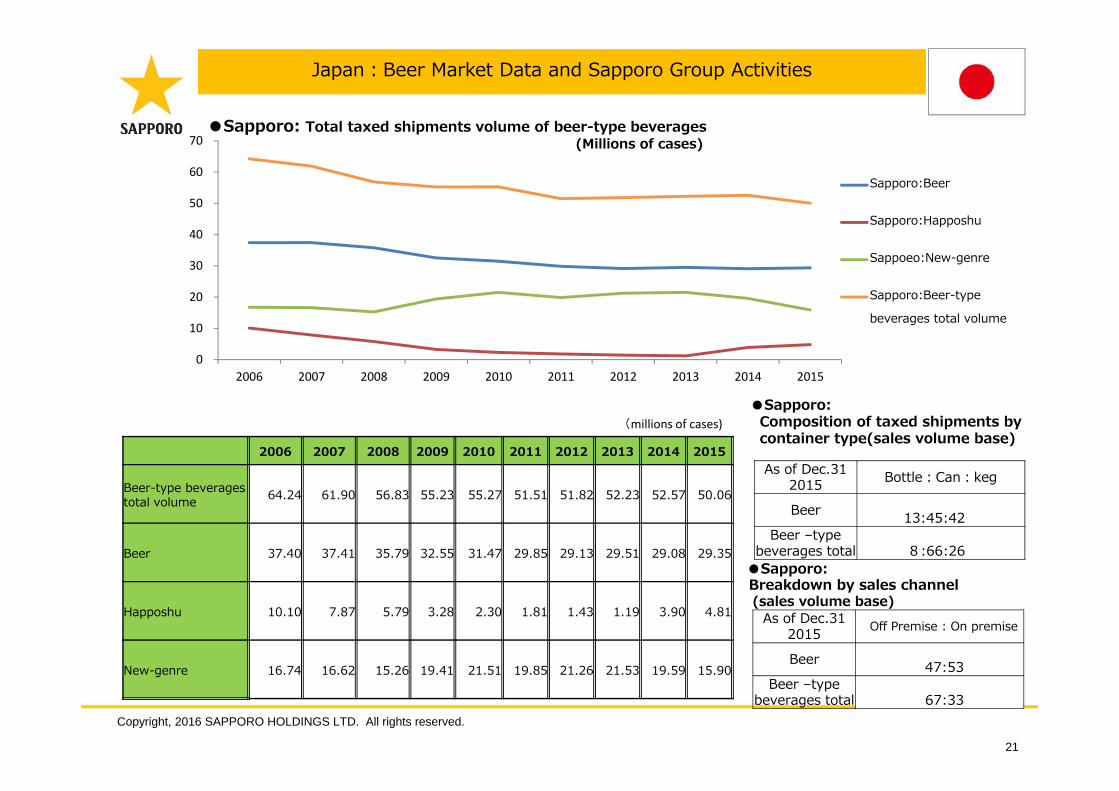
21
(millions of cases)
2006 2007 2008 2009 2010 2011 2012 2013 2014 2015
Beer-type beverages total volume 64.24 61.90 56.83 55.23 55.27 51.51 51.82 52.23 52.57 50.06
Beer 37.40 37.41 35.79 32.55 31.47 29.85 29.13 29.51 29.08 29.35
Happoshu 10.10 7.87 5.79 3.28 2.30 1.81 1.43 1.19 3.90 4.81
New-genre 16.74 16.62 15.26 19.41 21.51 19.85 21.26 21.53 19.59 15.90
0
10
20
30
40
50
60
70
2006 2007 2008 2009 2010 2011 2012 2013 2014 2015
Sapporo:Beer
Sapporo:Happoshu
Sappoeo:New-genre
Sapporo:Beer-type
beverages total volume
As of Dec.31 2015 Bottle:Can:keg
Beer 13:45:42Beer –type
beverages total 8:66:26●Sapporo: Breakdown by sales channel (sales volume base)
As of Dec.31 2015 Off Premise : On premise
Beer 47:53Beer –type
beverages total 67:33
●Sapporo: Total taxed shipments volume of beer-type beverages(Millions of cases)
●Sapporo:Composition of taxed shipments by container type(sales volume base)
Japan:Beer Market Data and Sapporo Group Activities

Copyright, 2016 SAPPORO HOLDINGS LTD. All rights reserved.
22
2013 2014 2015
Total Beer 29.42 28.96 29.19
Black label 16.62 16.15 16.18
YEBISU Brand 9.61 9.64 9.52
●Sapporo :Sales composition of Beer by brand
0%
20%
40%
60%
80%
100%
2013 2014 2015
Other beer YEBISU Brand Black label
0%
20%
40%
60%
80%
100%
Consumption tax
Liquor tax
pre‐tax price
Source:National tax agency
●Comparison of the liquor tax by category
Reference:Liquor Tax
(millions of cases)
128 105 104
7747 28
1612
11
221 164143
Beer(350 ml)
Low‐malt beer(350 ml)
New genre(350 ml)
(yen)Price before taxes Liquor tax
Source: Brewers Association of Japan, SapporoNote: Based on typical retail price at convenience stores. Consumption tax amounts are calculated using 8%
Retail Price Breakdown *
Japan:Beer Market Data and Sapporo Group Activities

Copyright, 2016 SAPPORO HOLDINGS LTD. All rights reserved.
23
Wine
Spirits
Japanese liquor
RTD
Sapporo:Sales Breakdown by category
Jan-Dec net sales273.6 billion yen
Sapporo:Net Sales Beer + Beer type beverages (incl. liquor tax)Billions of
yen
Japan:Sapporo Group ActivitiesJapan:Beer Market Data and Sapporo Group Activities
Copyright, 2016 SAPPORO HOLDINGS LTD. All rights reserved.
24
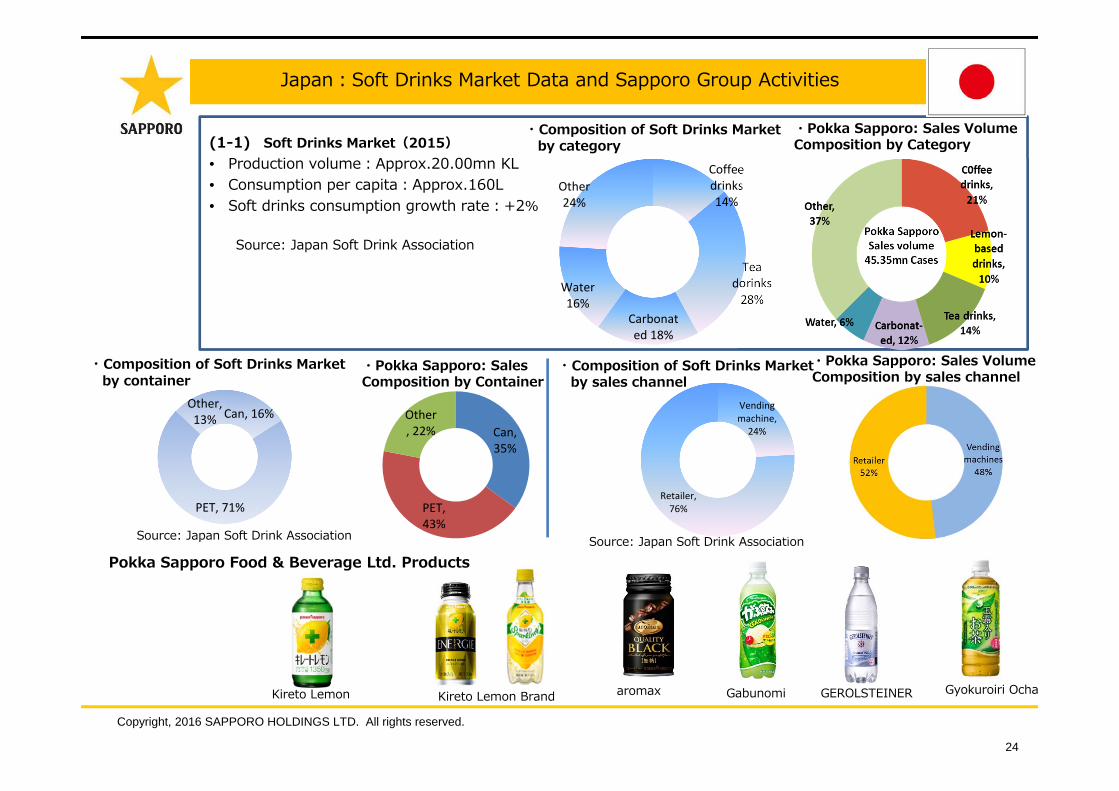
(1-1) Soft Drinks Market(2015)• Production volume:Approx.20.00mn KL• Consumption per capita:Approx.160L• Soft drinks consumption growth rate:+2%
Source: Japan Soft Drink Association
Japan:Soft Drinks Market Data and Sapporo Group Activities
・Composition of Soft Drinks Marketby container
・Composition of Soft Drinks Marketby category
Pokka Sapporo Food & Beverage Ltd. Products
・Pokka Sapporo: Sales Volume Composition by Category
Source: Japan Soft Drink Association
Kireto Lemon GabunomiKireto Lemon Brand GEROLSTEINER Gyokuroiri Ocha
Pokka SapporoSales volume 45.35mn Cases
aromax
・Pokka Sapporo: Sales Composition by Container
Coffee drinks 14%
Tea dorinks 28%
Carbonated 18%
Water 16%
Other 24%
Source: Japan Soft Drink Association
・Pokka Sapporo: Sales Volume Composition by sales channel
・Composition of Soft Drinks Marketby sales channel
Vending machine, 24%
Retailer, 76%
Can, 16%
PET, 71%
Other, 13%
Can, 35%
PET, 43%
Other, 22%

Copyright, 2016 SAPPORO HOLDINGS LTD. All rights reserved.
25
(1-2) Corporate Profile★Pokka Sapporo Food & Beverage Ltd.• Paid in capital:5.43bn yen• Entry into business:
Jun. 1909 Entered in to the soft drink business as the first Japanese brewery to do soLaunched Citron (Soda)
Jan.1957 Established Kokusai inryo Co., Ltd., later Sapporo Beverage Co., Ltd.
Feb.1957 Established Nikka Lemon Co., Ltd. to make and sell lemon beverages,later POKKA CORPORATION
Sep. 2009 Acquired 21.41% of the share of POKKA CORPORATION Made POKKA into affiliated company accounted by the equity method
Mar. 2011 Acquired 86.76% of the share of POKKA CORPORATION Made POKKA into consolidated subsidiary
As of Dec.31, 2011 Acquired 98.59% of the share of POKKA CORPORATION ・Acquisition cost 34.80bn yen*Goodwill:18.41 bn yen 15 years with the straight-line method
Mar. 2012 Integrated Sapporo Beverage Co., Ltd. with POKKA CORPORATIONto establish Pokka Sapporo Food & Beverage Ltd.
Dec.2012 Made POKKA CORPORATION into a wholly owned subsidiary
Jan. 2013 Absorption-type merger between Sapporo Beverage Co., Ltd and POKKA CORPORATIONCommenced operation of Pokka Sapporo Food & Beverage Ltd.
• Production base:Food & Soft drinks plant2(Nagoya, Gunma), Soft drinks plant 2(Iwata, Okinawa)• Business field:Manufacture and sales of food& soft drinks, Operating coffee shop and other
Japan:Soft Drinks Market Data and Sapporo Group Activities

Copyright, 2016 SAPPORO HOLDINGS LTD. All rights reserved.
26
(1-1)Soup MarketMarket size:172.8bn yen(2014)Market growth rate:+2.6%*Instant soup market size 77.3bn yen (2014)
Market growth rate:+2.6%
(1-2) Sapporo Group ActivitiesEntry into business:1980Instant soup sales:13.55bn yen(2014)Instant soup sales growth rate:+7.1%Share:17.5%(No.2)
Canned soup sales:37.00mn yen(2014)Canned soup sales growth rate:+23.3%Share:39.8%(No.1)Production base:3(Nagoya, Gunma, Iwata)
(2-1)Lemon-based Flavoring MarketMarket size:59.40mn yen(2014)Market growth rate:-0.2%
(2-2) Sapporo Group ActivitiesSales: 51.00mn yen(2014)Sales growth rate:±0%Share : 85.9%(No.1)Production base:1(Nagoya)
Launched two canned soup productsin 1980
Pokka Lemon 100
Japan:Market Data and Sapporo Group Activities <Soup / Lemon-based flavoring>
Source:Fuji Keizai Marketing hand book 2015-2016 Soup category
Long-selling products Jikkuri kotokoto seriesCelebrating 20th anniversary
Source:Fuji Keizai Marketing hand book 2015-2016 Lemon-based flavoring category

Copyright, 2016 SAPPORO HOLDINGS LTD. All rights reserved.
27
・The Greater Tokyo Area Office Leasing Market Annual average of occupancy rates & rent level (Source: Miki Shoji Co., Ltd.)
Japan:Real Estate Market Data and Sapporo Group Activities
・Major rental properties & annual average of occupancy rates
②Sapporo Ginza BuildingReopened as Ginza Place
in September, 24.2016
(1-2) Corporate profile★Sapporo Real Estate Co., Ltd.• Paid in capital: 2.08bn yen• Entry into business: June. 1988• Business field :Real estate leasing, administration, operation and development services
(1-1) Real Estate Market
*Redevelopment Buildings①Seiwa Ebisu BuildingReopened as Ebisu First Square in Sep.2014
・Real estate for lease2011 2012 2013 2014 2015
Balance at the fiscal year end date 173,297 209,924 210,078 207,864 197,666 Fair value at the fiscal year end date 299,800 335,672 337,771 348,237 357,395
2011 2012 2013 2014 2015Yebisu Garden Place 93.0 96.0 93.0 82.0 92.0 Ebisu First Square
*75.0 *44.0 *0.0 23.0 100.0 (formerly Seiwa Ebisu Building)Ebisu Square 92.0 94.0 100.0 100.0 100.0 Ginza Place(formerly Sapporo Ginza Building) 96.0 96.0 *74.0 *14.0 *0.0 Strata Ginza 99.0 99.0 100.0 100.0 100.0
2011 2012 2013 2014 2015Occupancy rate average(%) 91.1 90.9 91.9 93.8 95.1 New buildings occupancy rate 79.4 67.5 82.6 83.0 67.0 Existing buildings occupancy rate 91.3 91.7 92.1 93.9 95.7 Rent level average(yen/ tsubo) 17,250 16,719 16,367 16,616 17,412 New buildings rent level 22,976 22,830 26,008 27,312 27,186 Existing buildings rent level 17,104 16,578 16,183 16,402 17,195
0
5,000
10,000
15,000
20,000
25,000
30,000
2011 2012 2013 2014 2015
(yen) (%)
(millions of yen)
(%)
Copyright, 2016 SAPPORO HOLDINGS LTD. All rights reserved.
28
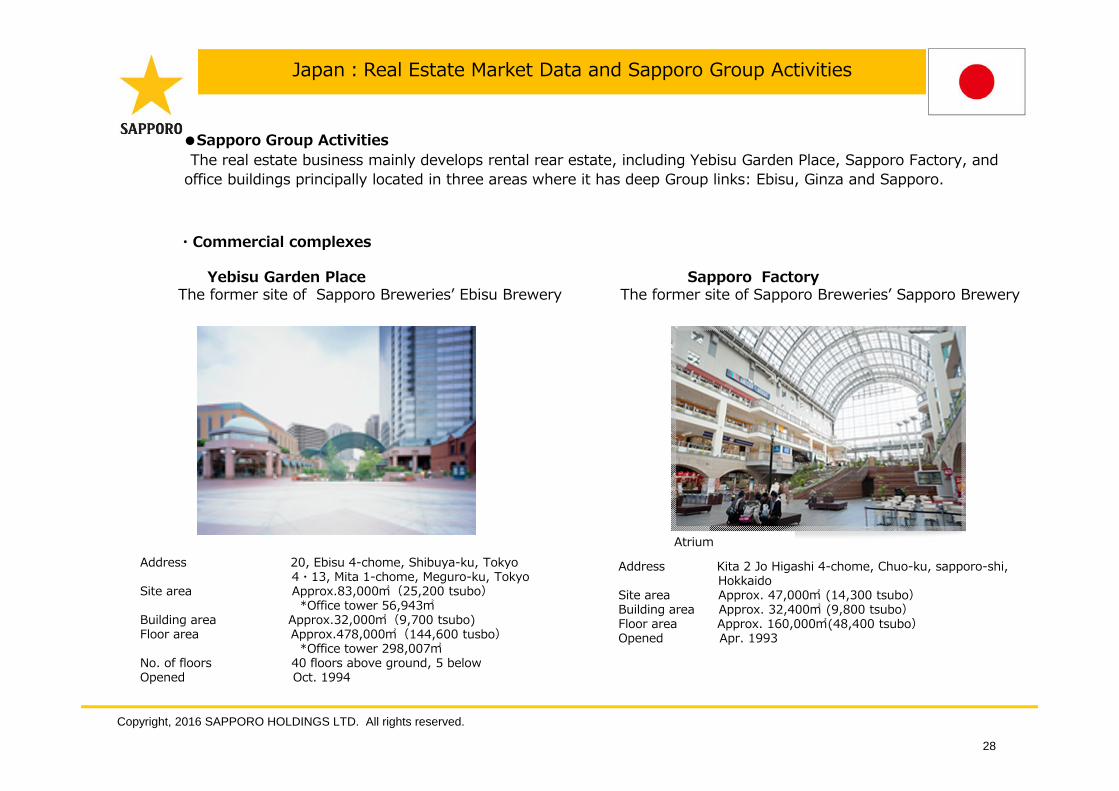
●Sapporo Group ActivitiesThe real estate business mainly develops rental rear estate, including Yebisu Garden Place, Sapporo Factory, and
office buildings principally located in three areas where it has deep Group links: Ebisu, Ginza and Sapporo.
Japan:Real Estate Market Data and Sapporo Group Activities
・Commercial complexes
Yebisu Garden Place Sapporo FactoryThe former site of Sapporo Breweriesʼ Ebisu Brewery The former site of Sapporo Breweriesʼ Sapporo Brewery
Address 20, Ebisu 4-chome, Shibuya-ku, Tokyo4・13, Mita 1-chome, Meguro-ku, Tokyo
Site area Approx.83,000㎡(25,200 tsubo)*Office tower 56,943㎡
Building area Approx.32,000㎡(9,700 tsubo)Floor area Approx.478,000㎡(144,600 tusbo)
*Office tower 298,007㎡No. of floors 40 floors above ground, 5 belowOpened Oct. 1994
Address Kita 2 Jo Higashi 4-chome, Chuo-ku, sapporo-shi, Hokkaido
Site area Approx. 47,000㎡ (14,300 tsubo)Building area Approx. 32,400㎡ (9,800 tsubo)Floor area Approx. 160,000㎡(48,400 tsubo)Opened Apr. 1993
Atrium
Copyright, 2016 SAPPORO HOLDINGS LTD. All rights reserved.
29
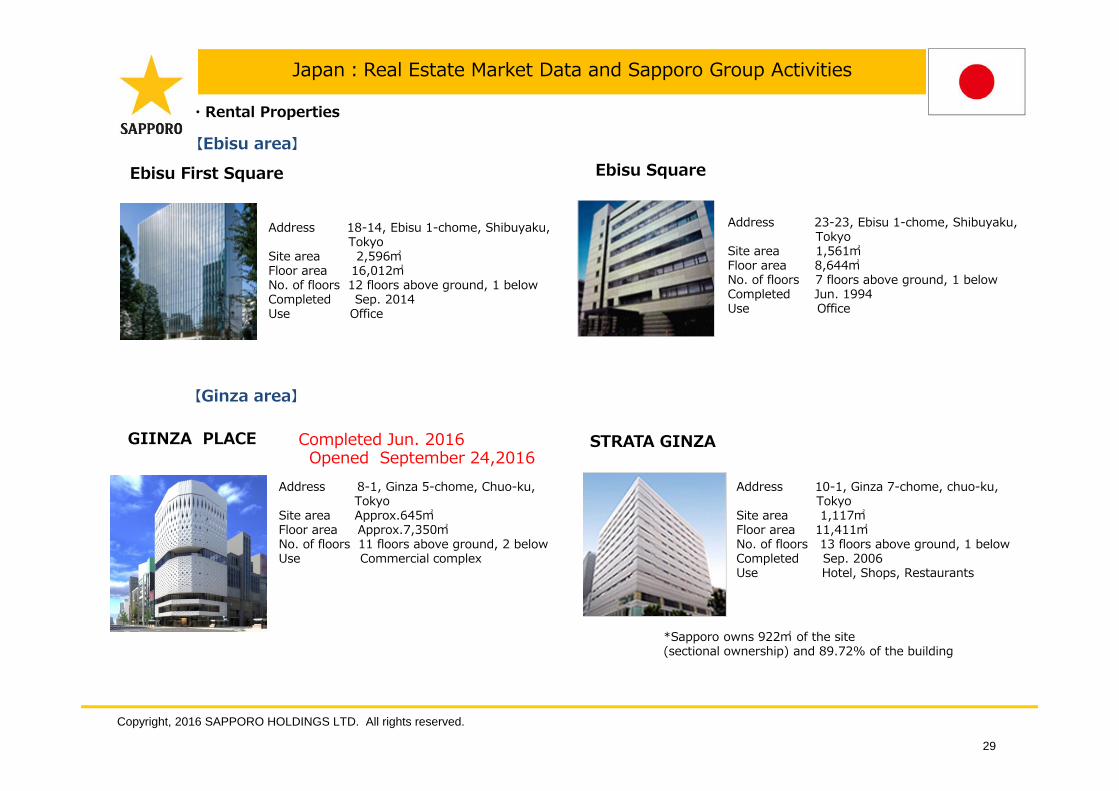
Japan:Real Estate Market Data and Sapporo Group Activities
・Rental Properties
Address 18-14, Ebisu 1-chome, Shibuyaku, Tokyo
Site area 2,596㎡Floor area 16,012㎡No. of floors 12 floors above ground, 1 below Completed Sep. 2014Use Office
STRATA GINZA
Address 23-23, Ebisu 1-chome, Shibuyaku,Tokyo
Site area 1,561㎡Floor area 8,644㎡No. of floors 7 floors above ground, 1 belowCompleted Jun. 1994Use Office
Address 10-1, Ginza 7-chome, chuo-ku, Tokyo
Site area 1,117㎡Floor area 11,411㎡No. of floors 13 floors above ground, 1 belowCompleted Sep. 2006Use Hotel, Shops, Restaurants
Ebisu Square
Address 8-1, Ginza 5-chome, Chuo-ku, Tokyo
Site area Approx.645㎡Floor area Approx.7,350㎡No. of floors 11 floors above ground, 2 belowUse Commercial complex
【Ebisu area】
Ebisu First Square
GIINZA PLACE Completed Jun. 2016Opened September 24,2016
*Sapporo owns 922㎡ of the site (sectional ownership) and 89.72% of the building
【Ginza area】
Copyright, 2016 SAPPORO HOLDINGS LTD. All rights reserved.
30
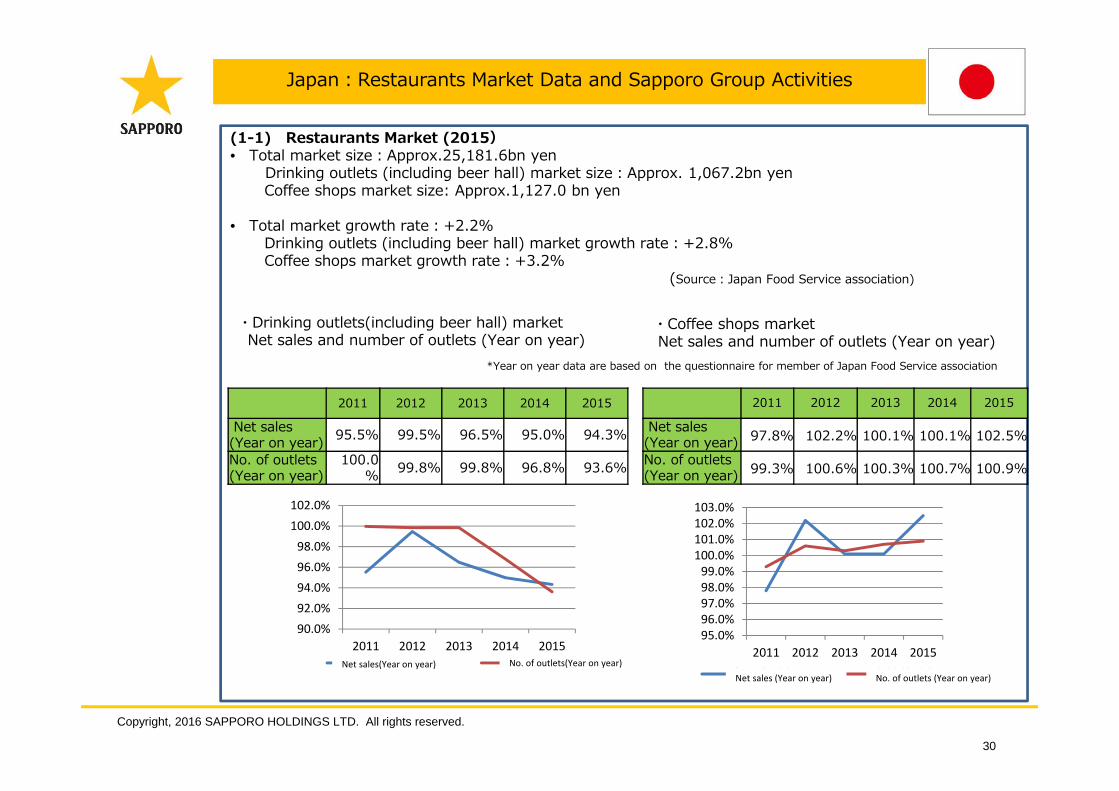
(1-1) Restaurants Market (2015)• Total market size:Approx.25,181.6bn yen
Drinking outlets (including beer hall) market size:Approx. 1,067.2bn yenCoffee shops market size: Approx.1,127.0 bn yen
• Total market growth rate:+2.2%Drinking outlets (including beer hall) market growth rate:+2.8%Coffee shops market growth rate:+3.2%
(Source:Japan Food Service association)
・Drinking outlets(including beer hall) marketNet sales and number of outlets (Year on year)
・Coffee shops marketNet sales and number of outlets (Year on year)
2011 2012 2013 2014 2015
Net sales(Year on year) 97.8% 102.2% 100.1% 100.1% 102.5%No. of outlets(Year on year) 99.3% 100.6% 100.3% 100.7% 100.9%
*Year on year data are based on the questionnaire for member of Japan Food Service association
2011 2012 2013 2014 2015
Net sales(Year on year) 95.5% 99.5% 96.5% 95.0% 94.3%No. of outlets(Year on year)
100.0% 99.8% 99.8% 96.8% 93.6%
90.0%92.0%94.0%96.0%98.0%
100.0%102.0%
2011 2012 2013 2014 2015売上高前年比 店舗数前年比Net sales(Year on year) No. of outlets(Year on year)
95.0%96.0%97.0%98.0%99.0%
100.0%101.0%102.0%103.0%
2011 2012 2013 2014 2015
売上高前年比 店舗数前年比No. of outlets (Year on year)Net sales (Year on year)
Japan:Restaurants Market Data and Sapporo Group Activities

Copyright, 2016 SAPPORO HOLDINGS LTD. All rights reserved.
31
(2-2) Sapporo Group Activities
●Drinking outlets (including beer hall)• Operating company: Sapporo Lion Ltd.• Paid in capital:4.87bn yen• Entry into business:August 4,1899 Opened YEBISU BEER HALL in Ginza, Tokyo
as Japanʼs first beer hall Sep. 1949 Established Nippon Kyoei Ltd. ,
later Sapporo Lion Ltd.
• Business field:Operating beer hall, drinking outlets and restaurants,mainly GINZA LION and YEBISU BAR
2011 2012 2013 2014 2015Net sales of existing outlets(Year on year)
93% 102% 101% 101% 104%
No. of outlets(Year on year) 95% 101% 98% 97% 92%No. of outlets at the fiscal year end date 191 193 190 185 170
90.0%92.0%94.0%96.0%98.0%
100.0%102.0%104.0%106.0%
2011 2012 2013 2014 2015Net sales of existing outlets (Year on year)No. of outlets(Year on year)
Japan:Restaurants Market Data and Sapporo Group Activities
Trends of net sales and number ofSapporo Lion outlets
(billions of yen)
No. of outlets

Copyright, 2016 SAPPORO HOLDINGS LTD. All rights reserved.
32
※1
Japan:Restaurants Market Data and Sapporo Group Activities
※2
Opened in 1934Oldest existing beer hall in Japan
Outlet interior
Authentic atmospherewith 250 colored glass mosaic wall art Size 27.5m×5.75mMade by Eizo Sugawara
As of June 30, 2016
KushiroKITTE Marunouchi outlet
<Sapporo Lion outlets>
173 Outlet
※1:Chuo, Chiyoda, Minato, Shinjuku and Shibuya ward※2:Sendai, Kyoto, Osaka, Kobe, Fukuoka
<New Sanko Inc.> *Sapporo Lionʼs Subsidiary 1954 Established in Otaru, Hokkaido Operating beer hall 9 outlets located in Hokkaido(Sapporo, Otaru)
<Marushinkawamura Inc.>*Sapporo Lionʼs Subsidiary
1955 Established in Sapporo, HokkaidoNewly consolidated from the first half of 2016
18 outlets located in Hokkaido(Sapporo) and Tokyo
Main outlet Beer Hall Lion Ginza 7‐Chome
New SankoOtaru outlet

Copyright, 2016 SAPPORO HOLDINGS LTD. All rights reserved.
33
●Coffee shops
• Operating company: Pokka Create Co., Ltd *Pokka Sapporo Food & Beverageʼs Subsidiary
• Paid in capital:300mn yen• Entry into business: Oct. 1994• Business field:Operating coffee shop chain “CAFÉ de CRIE”
Number of outlets:196 outlets (as of June 30, 2016)(Directly operated: 114 outlets; FC: 82 outlets)
Hokkaido 3, Tohoku 1, Kanto 106, Tokai 38 Kansai 36, Kyushu 9, Shikoku 3
Japan:Restaurants Market Data and Sapporo Group Activities
Trends of net sales and number CAFÉ de CRIE outlets
(billions of yen)
4.46.3 7.1 7.4 7.7
159 163 170 185 189
020406080100120140160180200
0123456789
2011 2012 2013 2014 2015
Net sales of Pokka Create No. of CAFÉ de CRIE outlets
No. of outlets

Copyright, 2016 SAPPORO HOLDINGS LTD. All rights reserved.
34
③Financial Data

Copyright, 2016 SAPPORO HOLDINGS LTD. All rights reserved.
35
International Food & Soft Drinks
Creating value in foodThe core domain driving the Group’s dynamic growth
Sapporo Group Overview
Creating comfortable surroundingsThe business domain expected to contribute stable profits
backed by prime properties
Japanese Alcoholic Beverages
Core business
The Sapporo Group is dedicated to utilizing its assets and strengths in the pursuit of operations in the two business domains of “Creating value in food” and “Creating comfortable surroundings.”The Group’s businesses are divided into five segments: Japanese Alcoholic Beverages, International, Food & Soft Drinks, Restaurants, and Real Estate.The Japanese Alcoholic Beverages and Real Estate segments are positioned as stable earnings pillars, while the Group also promotes the International and Food & Soft Drinks segments as future growth drivers.
Growth driver To become a third pillar for the Group
Contact point with customers
Contributing stable earnings
【Main financial figures】2015 Net sales:533.bn yen2015 Net sales(excl. liquor tax): 418.3bn yen2015 Operating income:13.9bn yen2015 Operating income before goodwill amortization:18.1bn yen2015 EBITDA:42.3bn yenMargin: 7.9%Margin(excl. liquor tax):10.1%
Restaurants Real Estate
Breakdown of FY2015 net sales (excl. liquor tax)
Breakdown of FY2015 EBITDA (before segment adjustment)
With a vision of “Seek No. 1 byaccumulating one‐of‐a‐kind products, ”we are focused mainly on the beer business, but is also involved in other areas, including the wine and spirits business and the Japanese liquors business. The Group will continue to propose products and services that represent the distinctive Sapporo value.
Net sales: ¥273.6 bnNet sales(excl. liquor tax): ¥158.3 bnOperating incomebefore goodwill amortization ¥8.6bnMargin (excl. liquor tax ): 5.5%EBITDA: ¥16.8 bn
Net sales: ¥70.5 bnOperating incomebefore goodwill amortization
¥2.0bnMargin: 2.8%EBITDA: ¥5.3 bn
Net sales: ¥135.7bnOperating incomebefore goodwill amortization
¥2.7bnMargin: 2.0%EBITDA: ¥8.8 bn
Net sales: ¥27.0 bnOperating incomebefore goodwill amortization
¥0.5bnMargin: 1.9%EBITDA: ¥1.1 bn
Net sales: ¥20.9 bnOperating incomebefore goodwill amortization
¥8.3bnMargin: 39.7%EBITDA: ¥12.4 bn
Offering alcoholic beverages and soft drinks, mainly in North America and Southeast Asia. In the North American market, we are aiming to take another leap forward, while working to expand our beer business in Vietnam and use it as a base for strengthening our exports to surrounding countries.
• Strong brands in the lemon‐based foods and drinks markets, and in the instant soup markets, which are expected to grow
• Growing in Southeast Asia and Middle East by leveraging the overwhelming market share of green tea drinks in Singapore
Japan’s largest beer hall chains, GINZA LION and YEBISU BAR, along with various restaurants. In addition to providing delicious draft beer, we will continue to develop menus based on the theme of “safety, security, authenticity, and health.” • Two Ginza Lion Beer Hall
outlets in Singapore
Operating and managing three commercial complexes—Yebisu Garden Place, Sapporo Factory, and GINZA PLACE —as well as office buildings and others.• Yebisu Garden Place :
Promote the renovation in the property‘s commercial area to further increase value to boost the brand strength of the entire district

Copyright, 2016 SAPPORO HOLDINGS LTD. All rights reserved.
36
Financial Data (Profit and Loss Trends)Net Sales Net Sales (excl. Liquor tax)
Operating Income
Gross Profit / Net Sales (excl. tax) SGA / Net Sales (excl. tax)Operating Income Margin (excl. tax)
Ordinary Income Net Income EBITDA
Overseas Sales Ratio(excl. Liquor tax)
Copyright, 2016 SAPPORO HOLDINGS LTD. All rights reserved.
37
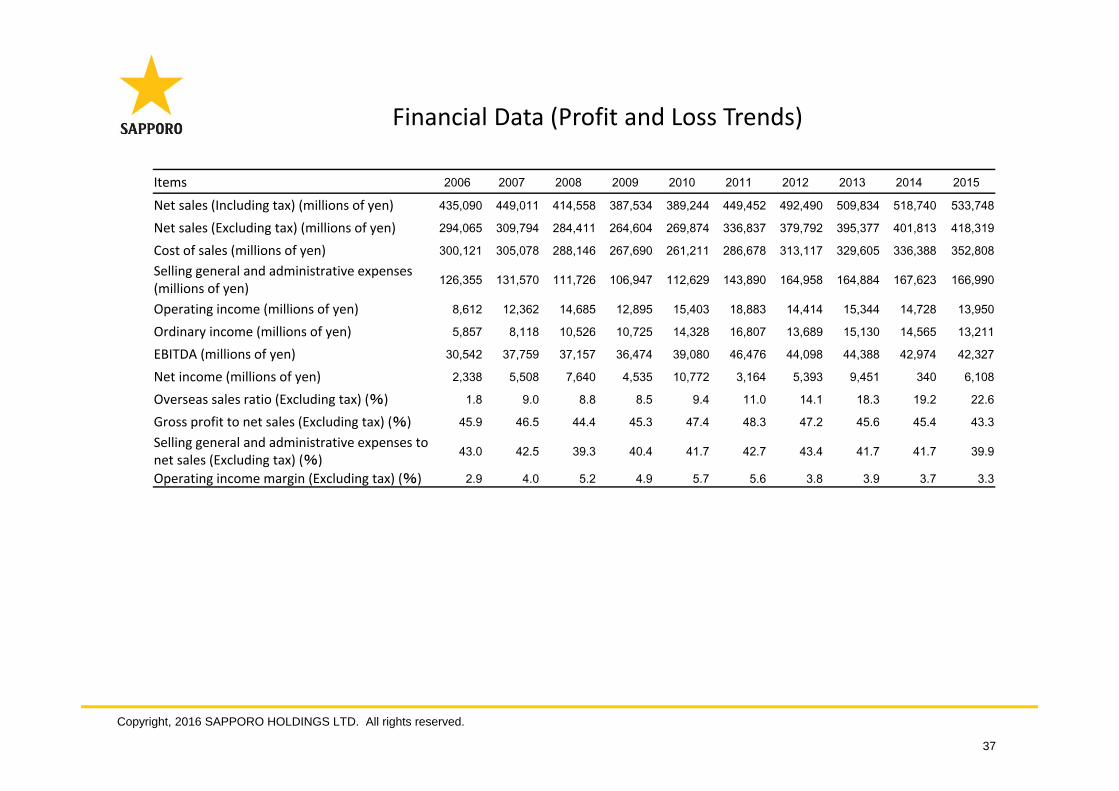
Financial Data (Profit and Loss Trends)
Items 2006 2007 2008 2009 2010 2011 2012 2013 2014 2015
Net sales (Including tax) (millions of yen) 435,090 449,011 414,558 387,534 389,244 449,452 492,490 509,834 518,740 533,748
Net sales (Excluding tax) (millions of yen) 294,065 309,794 284,411 264,604 269,874 336,837 379,792 395,377 401,813 418,319
Cost of sales (millions of yen) 300,121 305,078 288,146 267,690 261,211 286,678 313,117 329,605 336,388 352,808 Selling general and administrative expenses (millions of yen) 126,355 131,570 111,726 106,947 112,629 143,890 164,958 164,884 167,623 166,990
Operating income (millions of yen) 8,612 12,362 14,685 12,895 15,403 18,883 14,414 15,344 14,728 13,950
Ordinary income (millions of yen) 5,857 8,118 10,526 10,725 14,328 16,807 13,689 15,130 14,565 13,211
EBITDA (millions of yen) 30,542 37,759 37,157 36,474 39,080 46,476 44,098 44,388 42,974 42,327
Net income (millions of yen) 2,338 5,508 7,640 4,535 10,772 3,164 5,393 9,451 340 6,108
Overseas sales ratio (Excluding tax) (%) 1.8 9.0 8.8 8.5 9.4 11.0 14.1 18.3 19.2 22.6
Gross profit to net sales (Excluding tax) (%) 45.9 46.5 44.4 45.3 47.4 48.3 47.2 45.6 45.4 43.3 Selling general and administrative expenses to net sales (Excluding tax) (%) 43.0 42.5 39.3 40.4 41.7 42.7 43.4 41.7 41.7 39.9
Operating income margin (Excluding tax) (%) 2.9 4.0 5.2 4.9 5.7 5.6 3.8 3.9 3.7 3.3

Copyright, 2016 SAPPORO HOLDINGS LTD. All rights reserved.
38
Financial Data (Financial Condition)
Total Assets Net AssetsFixed assets Current assets Financial Liabilities
Debt Ratio Fixed Assets Ratio
Current Ratio D/E Ratio
■ Fixed assets■Current assets
Equity Ratio
Fixed Assets to Fixed Liability Ratio

Copyright, 2016 SAPPORO HOLDINGS LTD. All rights reserved.
39
Financial Data ( Financial Condition)
Items 2006 2007 2008 2009 2010 2011 2012 2013 2014 2015
Total assets (millions of yen) 589,597 561,858 527,286 506,874 494,798 550,784 597,636 616,752 625,439 620,388
Net assets (millions of yen) 113,495 125,189 116,862 118,590 126,645 124,775 134,946 155,366 160,004 163,822
Total current assets (millions of yen) 127,972 117,717 129,418 102,277 109,737 129,018 138,258 147,336 156,372 156,364
Total fixed assets (millions of yen) 461,624 444,141 397,868 404,596 385,061 421,766 459,377 469,416 469,066 464,023
Total current liabilities (millions of yen) 268,885 223,501 213,203 169,252 167,043 212,589 243,146 227,308 211,771 233,643
Total fixed liabilities (millions of yen) 207,216 213,168 197,220 219,032 201,109 213,418 219,543 234,077 253,662 222,921
Financial liabilities (millions of yen) 236,032 208,464 189,251 196,794 181,334 219,168 257,646 247,828 247,556 234,741
Equity ratio (%) 19.2 22.3 22.1 23.4 25.3 22.4 22.1 24.6 25.0 25.5
Debt ratio (%) 419.5 349.0 351.9 328.0 294.4 345.5 351.1 304.2 297.8 289.1
Fixed Assets ratio (%) 406.7 354.9 341.1 341.8 307.9 342.1 348.6 309.5 300.1 293.8
Fixed Assets to Fixed Liability ratio (%) 143.9 131.3 126.8 119.9 118.1 125.3 130.8 121.7 114.4 121.8
Current ratio (%) 47.6 52.7 60.7 60.4 65.7 60.7 56.9 64.8 73.8 66.9
D/E ratio (times) 2.1 1.7 1.6 1.7 1.4 1.8 1.9 1.6 1.5 1.4

Copyright, 2016 SAPPORO HOLDINGS LTD. All rights reserved.
40
Financial Data ( Segment Information)
Net Sales‐ Japanese Alcoholic Beverages
Net Sales‐ Food & Soft DrinksNet Sales‐ Restaurants Net Sales‐ Real Estate
Net Sales:■Japanese Alcoholic Beverages■International■Food & Soft Drinks ■Restaurants■Real Estate
Net Sales by Segment
Composition:■Alcoholic Beverages (excl. liquor tax) ■Japanese Alcoholic Beverages (excl. liquor tax)■ International ■Food & Soft Drinks ■Restaurants ■Real Estate ■Other
Composition:■Japanese Alcoholic Beverages (excl. liquor tax)■ International■Food & Soft Drinks ■Restaurants■Real Estate
Net Sales‐ International

Copyright, 2016 SAPPORO HOLDINGS LTD. All rights reserved.
41
Financial Data(Segment Information)
Items 2006 2007 2008 2009 2010 2011 2012 2013 2014 2015
Sales‐Alcoholic beverages(Including tax) (millions of yen) * 326,419 343,670 324,720 305,495 304,715 294,077 306,068 323,125 330,704 344,153
Sales‐Japanese Alcoholic beverages(Including tax) (millions of yen) *
- - - - 279,329 268,189 269,947 274,909 281,031 273,651
Sales‐International (millions of yen) * - - - - 25,386 25,888 36,121 48,215 49,672 70,501
Sales‐Food&Soft drinks(millions of yen) 58,730 52,239 36,848 30,745 33,937 108,060 129,017 130,671 133,439 135,670
Sales‐Restaurants (millions of yen) 26,995 28,954 29,537 28,026 26,429 24,091 26,621 26,827 27,143 27,004
Sales‐Real estate (millions of yen) 22,827 24,147 23,451 23,266 23,537 22,468 23,217 22,767 21,509 20,872
Sales‐Others (millions of yen) 116 - - - 624 755 7,565 6,442 5,944 6,048
Sales share‐Alcoholic beverages(Excluding tax) (%) 63.0 66.0 68.4 69.0 68.7 53.9 52.1 52.8 53.4 54.7
Sales share‐Japanese Alcoholic beverages(Excluding tax) (%) - - - - 59.3 46.2 42.6 40.6 41.0 37.8
Sales share‐International (%) - - - - 9.4 7.7 9.5 12.2 12.4 16.9
Sales share‐Food&Soft drinks (%) 20.0 16.9 13.0 11.6 12.6 32.1 34.8 33.0 33.2 32.4
Sales share ‐Restaurants (%) 9.2 9.3 10.4 10.6 9.8 7.2 6.7 6.8 6.8 6.5
Sales share‐Real estate (%) 7.8 7.8 8.2 8.8 8.7 6.7 6.1 5.8 5.4 5.0
Sales share‐Others (%) 0.0 - - - 0.2 0.2 0.2 1.6 1.5 1.4
*Effective from the fiscal year 2011, the Alcoholic beverages business was split into Japanese and International segments.

Copyright, 2016 SAPPORO HOLDINGS LTD. All rights reserved.
42
Financial Data(Segment Information)
Operating Income & OP Margin‐Food & Soft Drinks
Operating Income by Segment
■Japanese Alcoholic Beverages■ International■Food & Soft Drinks■Restaurants ■Real Estate
Operating Income & OP Margin‐Japanese Alcoholic Beverages
■Operating Income ■OP Margin (Line)
■Operating Income ■OP Margin (Line) ■Operating Income ■OP Margin (Line)
Operating Income & OP Margin‐Real Estate
■Operating Income ■OP Margin (Line)
Operating Income & OP Margin‐Restaurants
Operating Income & OP Margin‐International
■Operating Income ■ Operating Income

Copyright, 2016 SAPPORO HOLDINGS LTD. All rights reserved.
43
Financial Data(Segment Information)
Items 2006 2007 2008 2009 2010 2011 2012 2013 2014 2015
Operating income‐Alcoholic beverages(Excluding tax)(millions of yen) * 4,183 7,854 8,610 8,176 9,787 9,682 7,448 11,109 10,365 8,789
Operating income‐Japanese Alcoholic beverages(millions of yen) * - - - - 9,290 9,304 7,522 9,901 10,192 8,635
Operating income‐International(millions of yen) * - - - - 497 378 -73 1,208 172 154
Operating income‐Food&Soft drinks (millions of yen) -426 -839 220 301 1,280 3,690 364 -1,483 121 434
Operating income‐Restaurants (millions of yen) 457 656 550 -171 148 219 538 415 303 522
Operating income‐Real estate (millions of yen) 6,413 7,073 7,612 7,524 7,986 8,552 9,396 8,685 7,695 8,281
Operating income‐Others (millions of yen) 5 - - - -751 -643 -413 231 183 1
Operating income margin‐Alcoholic beverages(Excluding tax) (%) 2.3 3.8 4.4 4.5 5.3 5.3 3.8 5.3 4.8 3.8
Operating income margin‐Japanese Alcoholic beverages (Excluding tax) (%) - - - - 5.8 6.0 4.6 6.2 6.2 5.5
Operating income margin‐International(%) - - - - 2.0 1.5 -0.2 2.5 0.3 0.2
Operating income margin‐Food&Soft drinks (%) -0.7 -1.6 0.6 1.0 3.8 3.4 0.3 -1.1 0.1 0.3
Operating income margin ‐Restaurants (%) 1.7 2.3 1.9 -0.6 0.6 0.9 2.1 1.5 1.1 1.9
Operating income margin‐Real estate (%) 28.1 29.3 32.5 32.3 33.9 38.1 40.5 38.1 35.8 39.7
Operating income margin‐Others (%) 4.3 - - - -120.4 -85.2 -47.4 3.6 3.1 0.0
*Effective from the fiscal year 2011, the Alcoholic beverages business was split into Japanese and International segments.
Copyright, 2016 SAPPORO HOLDINGS LTD. All rights reserved.
44
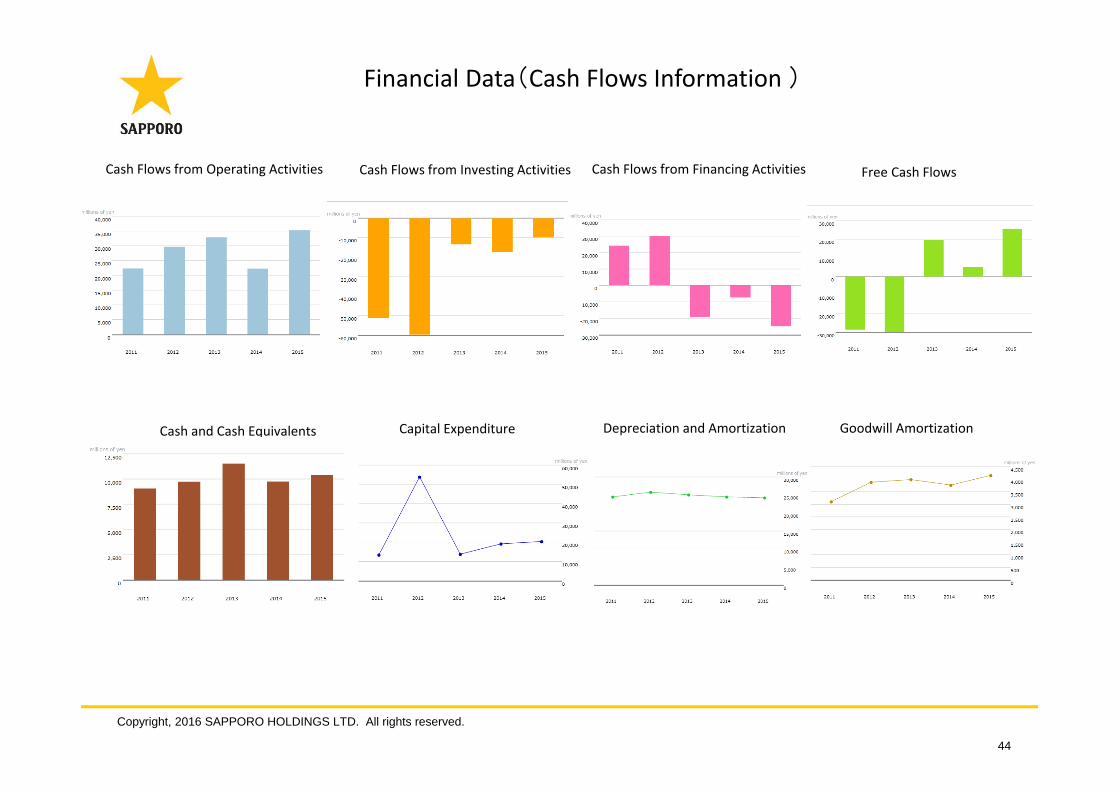
Financial Data(Cash Flows Information )
Cash Flows from Investing ActivitiesCash Flows from Operating Activities Cash Flows from Financing Activities Free Cash Flows
Cash and Cash Equivalents Capital Expenditure Depreciation and Amortization Goodwill Amortization

Copyright, 2016 SAPPORO HOLDINGS LTD. All rights reserved.
45
Financial Data(Cash Flow Information)
Items 2006 2007 2008 2009 2010 2011 2012 2013 2014 2015
Operating activities CF (millions of yen) 28,588 30,690 22,291 12,454 27,431 22,313 29,618 32,861 22,284 35,265
Investing activities CF (millions of yen) -54,414 -13,495 16,856 -32,227 -2,594 -50,891 -59,485 -13,268 -17,229 -9,755
Financing activities CF (millions of yen) 9,351 -19,568 -22,207 3,745 -18,119 24,245 30,159 -19,147 -7,307 -24,802
Free CF (millions of yen) -25,826 17,195 39,147 -19,773 24,837 -28,578 -29,867 19,593 5,055 25,510
Cash and cash equivalents at end of year (millions of yen) 8,282 5,881 22,217 6,267 13,270 9,057 9,725 11,518 9,748 10,399
Capital expenditures (millions of yen) 21,815 19,882 27,342 21,827 19,574 13,422 53,870 13,768 19,133 20,339
Depreciation and amortization (millions of yen) 21,929 24,526 21,604 22,546 22,504 24,482 25,805 25,058 24,481 24,224
Goodwill amortization expense (millions of yen) - 869 867 1,032 1,172 3,109 3,879 3,985 3,764 4,153
Copyright, 2016 SAPPORO HOLDINGS LTD. All rights reserved.
46
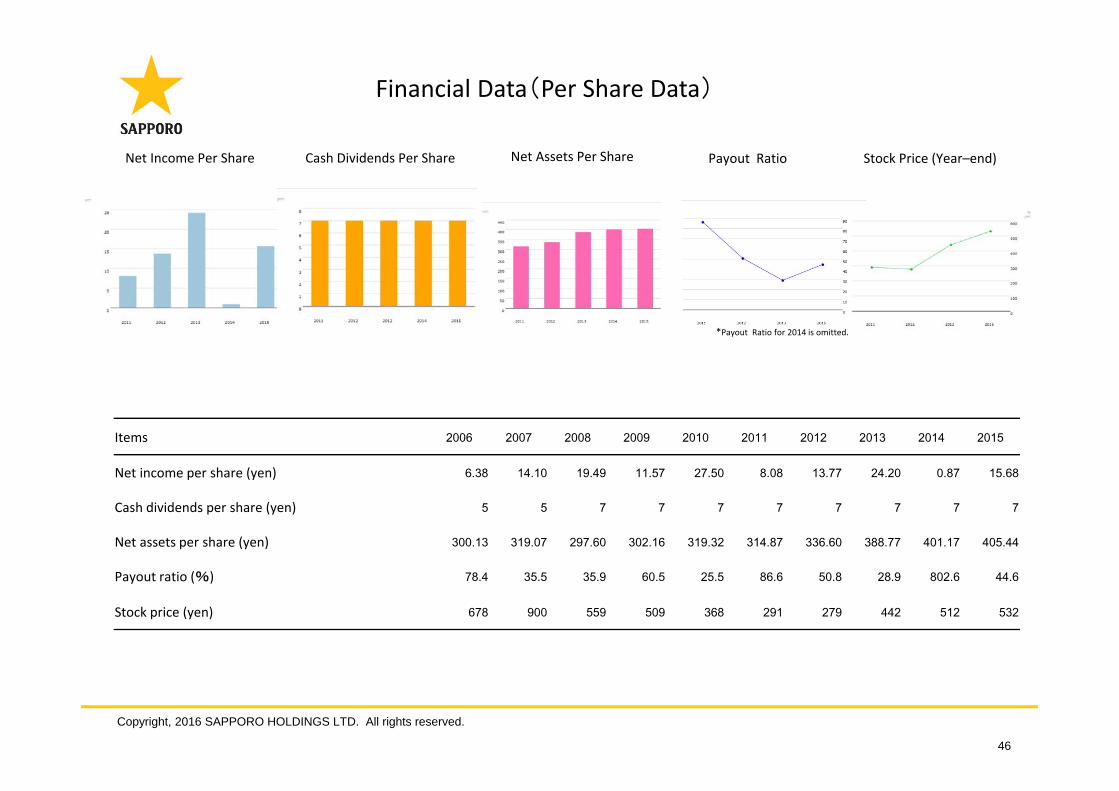
Financial Data(Per Share Data)
Net Income Per Share Cash Dividends Per Share Net Assets Per Share Payout Ratio Stock Price (Year–end)
Items 2006 2007 2008 2009 2010 2011 2012 2013 2014 2015
Net income per share (yen) 6.38 14.10 19.49 11.57 27.50 8.08 13.77 24.20 0.87 15.68
Cash dividends per share (yen) 5 5 7 7 7 7 7 7 7 7
Net assets per share (yen) 300.13 319.07 297.60 302.16 319.32 314.87 336.60 388.77 401.17 405.44
Payout ratio (%) 78.4 35.5 35.9 60.5 25.5 86.6 50.8 28.9 802.6 44.6
Stock price (yen) 678 900 559 509 368 291 279 442 512 532
*Payout Ratio for 2014 is omitted.

Copyright, 2016 SAPPORO HOLDINGS LTD. All rights reserved.
47
Financial Data(Management Indicators)
ROA ROE Total Asset Turnover Inventory Turnover Tangible Fixed Asset Turnover
Items 2006 2007 2008 2009 2010 2011 2012 2013 2014 2015
ROA (%) 0.4 1.0 1.4 0.9 2.2 0.6 0.9 1.6 0.1 1.0
ROE (%) 2.1 4.6 6.3 3.9 8.9 2.5 4.2 6.7 0.2 3.9
Total asset turnover (times) 0.5 0.5 0.5 0.5 0.5 0.6 0.7 0.7 0.6 0.7
Inventory turnover (times) 12.1 12.9 13.3 11.5 12.2 12.0 11.7 11.5 11.0 10.8
Tangible fixed asset turnover (times) 0.8 0.9 0.9 0.8 0.9 1.1 1.1 1.1 1.1 1.2

Copyright, 2016 SAPPORO HOLDINGS LTD. All rights reserved.
48
Corporate Data
Sapporo Holdings Limited
Head Office20‐1 , Ebisu 4‐chome, Shibuya‐ku, Tokyo 150‐8522, Japan
InquiriesSapporo Holdings LimitedCorporate Finance and Business Management Department Investor Relations SectionTel. +81‐3‐6859‐2304 Fax.+81‐3‐5423‐2061E‐mail. [email protected]
Date of EstablishmentSeptember 1, 1949
Founded 1876
Company RepresentativeTsutomu Kamijo President, Representative Director and Group CEO
Business DescriptionHolding Company
Capital¥53,886 million
Number of Shares Issued (As of June 30, 2016)393,971,493*On July 1,2016, the Company carried out a share consolidation at a ratio of 1 share for 5 shares of the Company’s common stock. Shares outstanding after consolidation : 78,794 thousand shares
Security Code 2501
Securities Traded:Common StockTokyo Stock Exchange, First Section
Major Shareholders (As of June 30, 2016)*Shareholding ratios are calculated after deduction of treasury stock.
Shareholders NameNumber of Shares (thousands)
Percentage(%)
The Master Trust Bank of Japan, Ltd. (Trust Account) 23,408 6.00Japan Trustee Services Bank, Ltd. (Trust Account) 14,813 3.80Trust & Custody Services bank, Ltd., as retirement benefit trust assetsMizuho Trust and banking Co., Ltd.
12,212 3.13
Nippon Life Insurance Company 11,146 2.86Meiji Yasuda Life Insurance Company 10,434 2.67The Norinchukin Bank 9,375 2.40Mizuho Bank, Ltd. 9,032 2.32Marubeni Corporation 8,246 2.11Trust & Custody Services bank, Ltd. as trustee for Mizuho Bank Ltd. Retirement Benefit Trust Account re‐entrusted by Mizuho Trust and banking Co., Ltd.
7,970 2.04
Japan Trustee Services Bank, Ltd. (Trust Account 9) 7,100 1.82
Recommended