Eastern Illinois UniversityThe Keep
Masters Theses Student Theses & Publications
1995
Factors Associated with Underachievement inEighth-Grade ChildrenBarbara A. MooreEastern Illinois UniversityThis research is a product of the graduate program in School Psychology at Eastern Illinois University. Findout more about the program.
This is brought to you for free and open access by the Student Theses & Publications at The Keep. It has been accepted for inclusion in Masters Thesesby an authorized administrator of The Keep. For more information, please contact [email protected].
Recommended CitationMoore, Barbara A., "Factors Associated with Underachievement in Eighth-Grade Children" (1995). Masters Theses. 2311.https://thekeep.eiu.edu/theses/2311
THESIS REPRODUCTION CERTIFICATE
TO: Graduate Degree Candidates (who have written formal theses)
SUBJECT: Permission to Reproduce Theses
The University Library is rece1v1ng a number of requests from other institutions asking permission to reproduce dissertations for inclusion in their library holdings. Although no copyright laws are involved, we feel that professional courtesy demands that permission be obtained from the author before we allow theses to be copied.
PLEASE SIGN ONE OF THE FOLLOWING STATEMENTS:
Booth Library of Eastern Illinois University has my permission to lend my thesis to a reputable college or university for the purpose of copying it for inclusion in that institution's library or research holdings.
Date
I respectfully request Booth Library of Eastern Illinois University not allow my thesis to be reproduced because:
Author Date
Factors Associated With Underachievement
in Eighth-Grade Children (TITLE)
BY
Barbara A. Moore
THESIS
SUBMITIED IN PARTIAL FULFILLMENT OF THE REQUIREMENTS
FOR THE DEGREE OF
Specialist in School Psychology
IN THE GRADUATE SCHOOL, EASTERN ILLINOIS UNIVERSITY CHARLESTON, ILLINOIS
1995 YEAR
I HEREBY RECOMMEND THIS THESIS BE ACCEPTED AS FULFILLING
THIS PART OF THE GRADUATE DEGREE CITED ABOVE
Factors Associated With Underachievement
in Eighth-Grade Children
Barbara A. Moore
Eastern Illinois University
Abstract
This study investigated characteristics of underachieving adolescents. The Iowa Tests of
Basic Skills (ITBS; Hieronymous, et al., 1990) and grade point averages provided the
basis for selection of 83 eighth grade students into achiever and underachiever groups.
Results indicated that underachievement was significantly related to males, number of
absences, and number of discipline referrals, but not to race and notice of special
education records. Overall self-esteem, as measured by the Self-Esteem Index (SEI;
Brown & Alexander, 1991), and the subscale measure of perceptions of weak academic
competence were positively related to level of underachievement/overachievement.
Composite measure of behavioral/emotional problems, as measured by the Youth Self
Report (YSR; Achenbach, 1991) and the subscale measure of thought problems were
positively related to levels of underachievement/overachievement.
ll

L
Dedication
This thesis is dedicated to my six-month-old son.
Zachary Hansen Moore,
whose birth gave me the final incentive to complete
this study, now or never.
iii
Acknowledgments
I would like to thank Dr. J. Michael Havey, Dr. John Rearden, and Dr. William
Kirk for serving as my thesis committee. Special thanks to Dr. Rearden for assisting with
the statistical procedures during retirement. A heartfelt thanks to Dr. Havey for the extra
time and support given to me during graduate school and beyond.
I would also like to thank my husband, John J. Moore, for his support and
patience. I will be forever in his debt for all the assistance he provided on the computer!
In addition, I would like to thank my family and friends for listening to my joys and
frustrations during the last several years. Their support was deeply appreciated.
Finally, I would like to thank the staff and students of Urbana Middle School who
kindly volunteered their time and assistance. Special thanks to Ms. Marion Krier,
Associate Principal, for her support and direction. Without the interest and participation
of everyone above, this study would have never been completed.
IV
Table of Contents
Title Page .............................................................................................................................. i
Abstract. .............................................................................................................................. .ii
Dedicaton ........................................................................................................................... .iii
Acknowledgments ............................................................................................................... iv
Table of Contents ................................................................................................................. v
List ofTables ...................................................................................................................... vi
Introduction........................................................................................................................ 1
Method ............................................................................................................................... 7
Sample ................................................................................................................... 7
Obtaining the Sample ............................................................................................... 7
Instrumentation ....................................................................................................... 8
Procedure ............................................................................................................... 11
Results ................................................................................................................................ 13
Discussion .......................................................................................................................... 17
References .......................................................................................................................... 20
Appendix ............................................................................................................................ 23
v
L
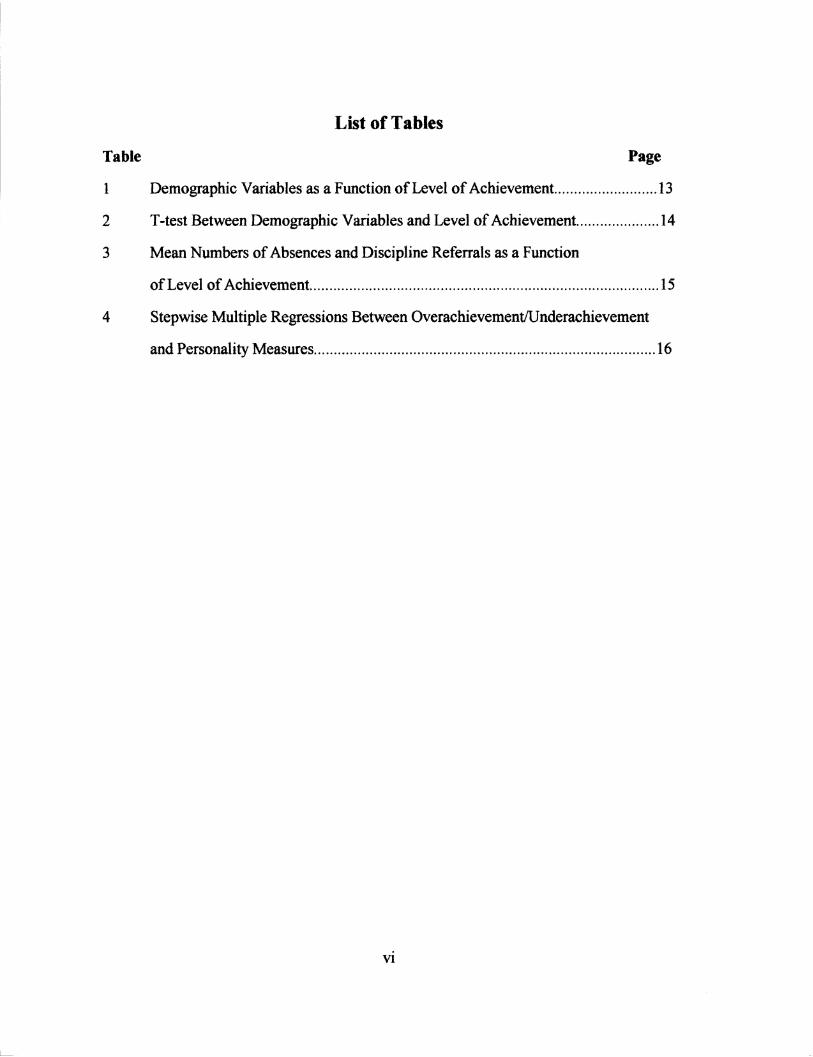
List of Tables
Table Page
1 Demographic Variables as a Function of Level of Achievement.. ........................ 13
2 T-test Between Demographic Variables and Level of Achievement.. .................. .14
3 Mean Numbers of Absences and Discipline Referrals as a Function
ofLevel of Achievement. ....................................................................................... 15
4 Stepwise Multiple Regressions Between Overachievement/Underachievement
and Personality Measures ...................................................................................... 16
VI
Chapter I
Introduction
Factors Associated With Underachievement
in Eighth-Grade Children
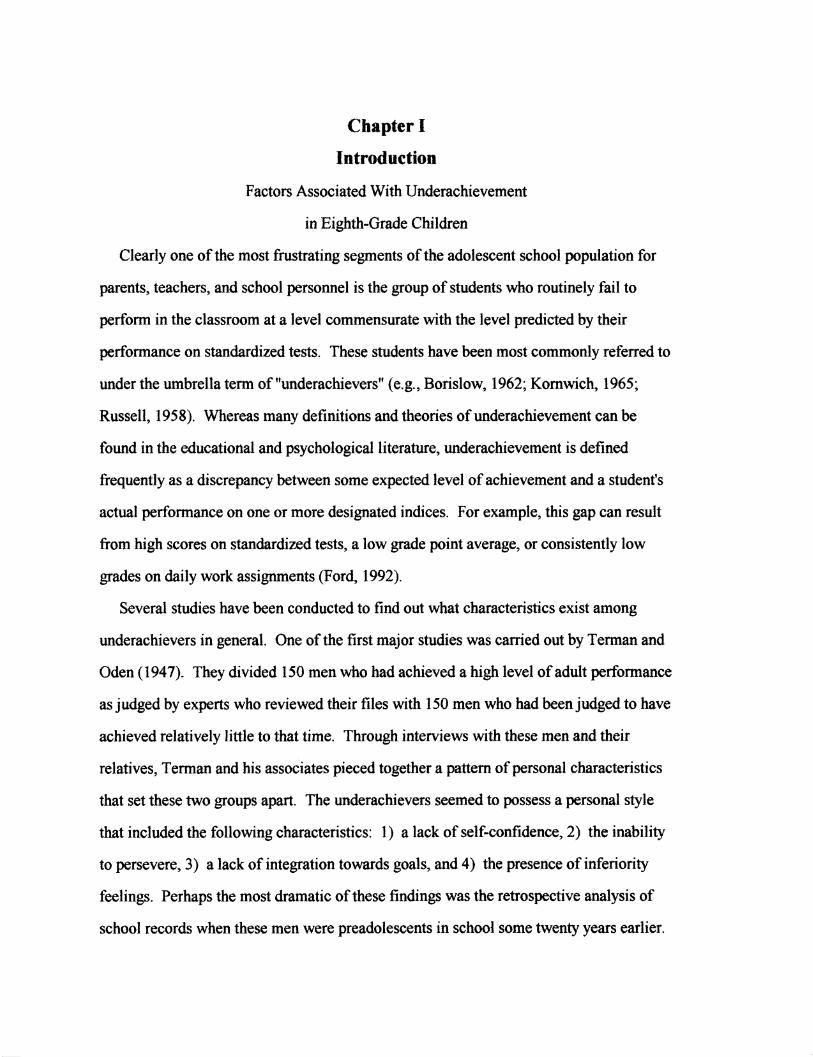
Clearly one of the most frustrating segments of the adolescent school population for
parents, teachers, and school personnel is the group of students who routinely fail to
perform in the classroom at a level commensurate with the level predicted by their
performance on standardized tests. These students have been most commonly referred to
under the umbrella term of"underachievers" (e.g., Borislow, 1962; Komwich, 1965;
Russell, 1958). Whereas many definitions and theories of underachievement can be
found in the educational and psychological literature, underachievement is defined
frequently as a discrepancy between some expected level of achievement and a student's
actual performance on one or more designated indices. For example, this gap can result
from high scores on standardized tests, a low grade point average, or consistently low
grades on daily work assignments (Ford, 1992).
Several studies have been conducted to find out what characteristics exist among
underachievers in general. One of the first major studies was carried out by Terman and
Oden ( 194 7). They divided 150 men who had achieved a high level of adult performance
as judged by experts who reviewed their files with 150 men who had beenjudged to have
achieved relatively little to that time. Through interviews with these men and their
relatives, Terman and his associates pieced together a pattern of personal characteristics
that set these two groups apart. The underachievers seemed to possess a personal style
that included the following characteristics: 1) a lack of self-confidence, 2) the inability
to persevere, 3) a lack of integration towards goals, and 4) the presence of inferiority
feelings. Perhaps the most dramatic of these findings was the retrospective analysis of
school records when these men were preadolescents in school some twenty years earlier.
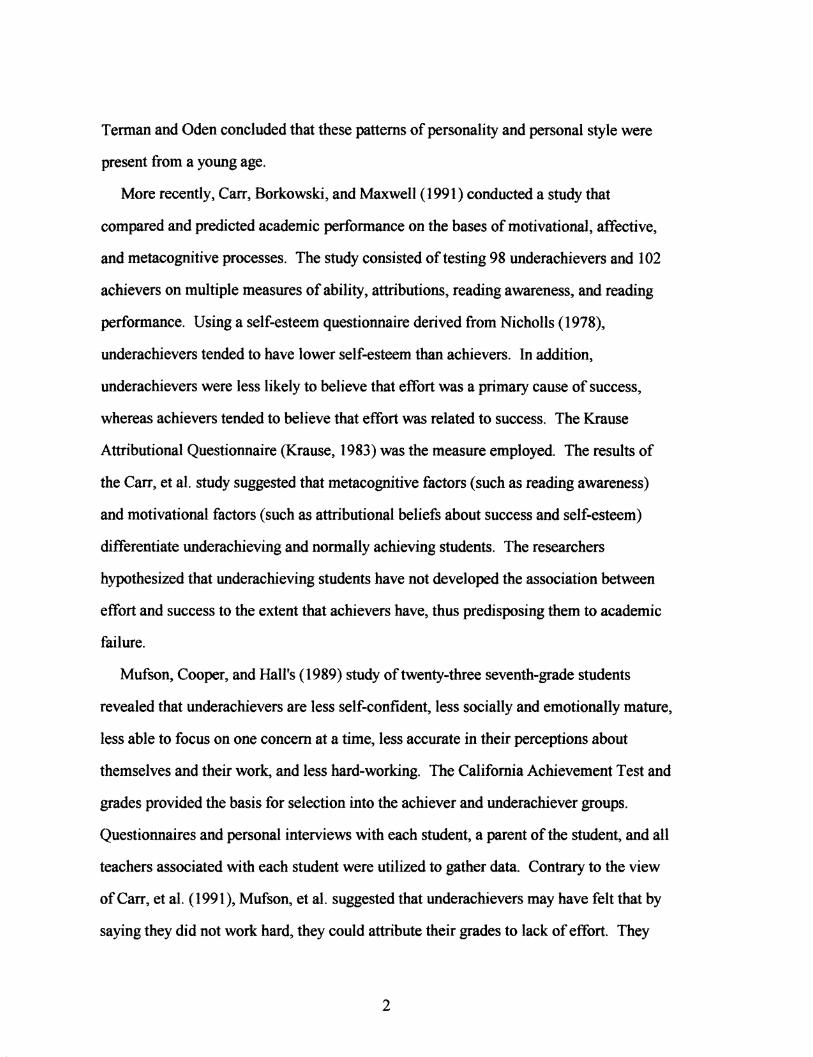
Terman and Oden concluded that these patterns of personality and personal style were
present from a young age.
More recently, Carr, Borkowski, and Maxwell (1991) conducted a study that
compared and predicted academic performance on the bases of motivational, affective,
and metacognitive processes. The study consisted of testing 98 underachievers and 102
achievers on multiple measures of ability, attributions, reading awareness, and reading
performance. Using a self-esteem questionnaire derived from Nicholls (1978),
underachievers tended to have lower self-esteem than achievers. In addition,
underachievers were less likely to believe that effort was a primary cause of success,
whereas achievers tended to believe that effort was related to success. The Krause
Attributional Questionnaire (Krause, 1983) was the measure employed. The results of
the Carr, et al. study suggested that metacognitive factors (such as reading awareness)
and motivational factors (such as attributional beliefs about success and self-esteem)
differentiate underachieving and normally achieving students. The researchers
hypothesized that underachieving students have not developed the association between
effort and success to the extent that achievers have, thus predisposing them to academic
failure.
Mufson, Cooper, and Hall's (1989) study of twenty-three seventh-grade students
revealed that underachievers are less self-confident, less socially and emotionally mature,
less able to focus on one concern at a time, less accurate in their perceptions about
themselves and their work, and less hard-working. The California Achievement Test and
grades provided the basis for selection into the achiever and underachiever groups.
Questionnaires and personal interviews with each student, a parent of the student, and all
teachers associated with each student were utilized to gather data. Contrary to the view
of Carr, et al. (1991), Mufson, et al. suggested that underachievers may have felt that by
saying they did not work hard, they could attribute their grades to lack of effort. They
2
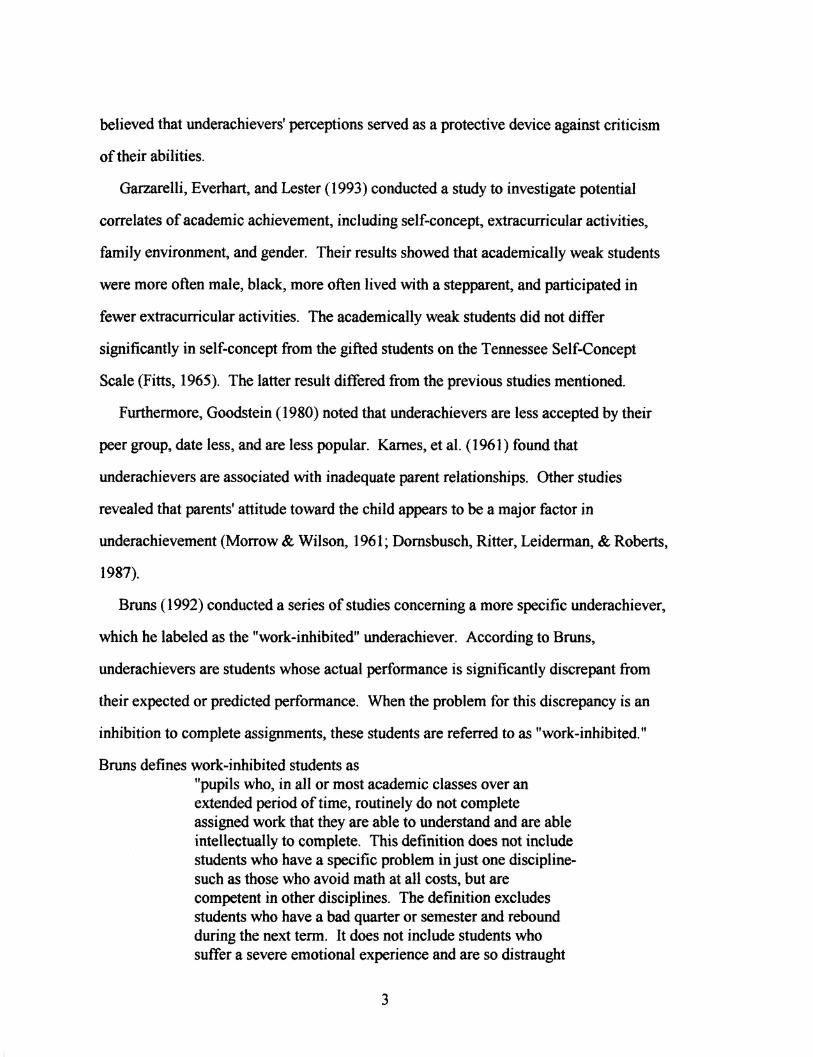
believed that underachievers' perceptions served as a protective device against criticism
of their abilities.
Garzarelli, Everhart, and Lester ( 1993) conducted a study to investigate potential
correlates of academic achievement, including self-concept, extracurricular activities,
family environment, and gender. Their results showed that academically weak students
were more often male, black, more often Jived with a stepparent, and participated in
fewer extracurricular activities. The academically weak students did not differ
significantly in self-concept from the gifted students on the Tennessee Self-Concept
Scale (Fitts, 1965). The latter result differed from the previous studies mentioned.
Furthermore, Goodstein (1980) noted that underachievers are less accepted by their
peer group, date less, and are less popular. Karnes, et al. (1961) found that
underachievers are associated with inadequate parent relationships. Other studies
revealed that parents' attitude toward the child appears to be a major factor in
underachievement (Morrow & Wilson, 1961; Dornsbusch, Ritter, Leiderman, & Roberts,
1987).
Bruns (1992) conducted a series of studies concerning a more specific underachiever,
which he labeled as the "work-inhibited" underachiever. According to Bruns,
underachievers are students whose actual performance is significantly discrepant from
their expected or predicted performance. When the problem for this discrepancy is an
inhibition to complete assignments, these students are referred to as "work-inhibited."
Bruns defines work-inhibited students as "pupils who, in all or most academic classes over an extended period of time, routinely do not complete assigned work that they are able to understand and are able intellectually to complete. This definition does not include students who have a specific problem in just one disciplinesuch as those who avoid math at all costs, but are competent in other disciplines. The definition excludes students who have a bad quarter or semester and rebound during the next term. It does not include students who suffer a severe emotional experience and are so distraught
3
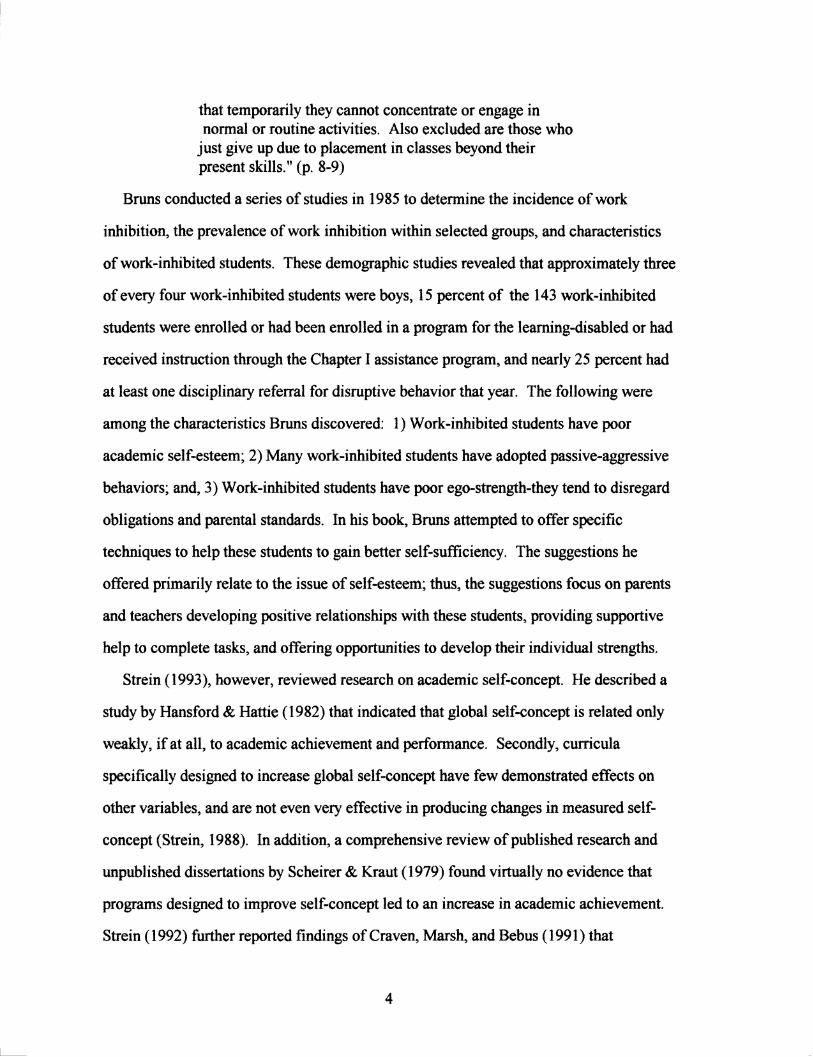
that temporarily they cannot concentrate or engage in normal or routine activities. Also excluded are those who
just give up due to placement in classes beyond their present skills." (p. 8-9)
Bruns conducted a series of studies in 1985 to determine the incidence of work
inhibition, the prevalence of work inhibition within selected groups, and characteristics
of work-inhibited students. These demographic studies revealed that approximately three
of every four work-inhibited students were boys, 15 percent of the 143 work-inhibited
students were enrolled or had been enrolled in a program for the learning-disabled or had
received instruction through the Chapter I assistance program, and nearly 25 percent had
at least one disciplinary referral for disruptive behavior that year. The following were
among the characteristics Bruns discovered: 1) Work-inhibited students have poor
academic self-esteem; 2) Many work-inhibited students have adopted passive-aggressive
behaviors; and, 3) Work-inhibited students have poor ego-strength-they tend to disregard
obligations and parental standards. In his book, Bruns attempted to offer specific
techniques to help these students to gain better self-sufficiency. The suggestions he
offered primarily relate to the issue of self-esteem; thus, the suggestions focus on parents
and teachers developing positive relationships with these students, providing supportive
help to complete tasks, and offering opportunities to develop their individual strengths.
Strein (1993), however, reviewed research on academic self-concept. He described a
study by Hansford & Hattie (1982) that indicated that global self-concept is related only
weakly, if at all, to academic achievement and performance. Secondly, curricula
specifically designed to increase global self-concept have few demonstrated effects on
other variables, and are not even very effective in producing changes in measured self
concept (Strein, 1988). In addition, a comprehensive review of published research and
unpublished dissertations by Scheirer & Kraut (1979) found virtually no evidence that
programs designed to improve self-concept led to an increase in academic achievement.
Strein (1992) further reported findings of Craven, Marsh, and Bebus (1991) that
4
illustrated that children given feedback in small groups by researchers showed changes in
academic self-concepts, while children given similar feedback by their classroom teacher
showed no changes. These changes in academic self-concepts were unrelated to changes
in measured achievement. The largest change was in peer self-concept, suggesting that
interpersonal interactions may have been the most salient feature of the intervention.
One of the implications of the research reviewed by Strein (1993) may be that many
of the recommendations, especially those geared toward enhancing underachievers' self
esteem, offered by Bruns (1992) may not be exceptionally effective in increasing
students' academic performance because there has been virtually no evidence that
programs designed to improve self-concept have led to an increase in academic
achievement. Therefore, further research is needed in order to determine what other
characteristics, in addition to low academic self-esteem, may be significant components
of student failure to perform at levels commensurate with those predicted from
standardized test results. Until these additional characteristics are determined. more
effective strategies cannot be developed.
The current study attempted to confirm results of previous studies as to the
characteristics of underachieving adolescents and to further determine what additional
characteristics may exist so that effective interventions could be developed. The primary
questions addressed include: (a) Do underachieving students differ from achieving
students with regard to the demographic variables of gender, race, and notice of special
education records? (b) Do the two groups differ with regard to attendance patterns and
discipline referrals, and to what extent does level of achievement correlate with these
variables? ( c) To what extent is level of achievement predicted by level of overall self
esteem, and what type of self-esteem (i.e., perceptions of self as relate.d to family
relationships, peer relationships. success in school, and a general sense of self) is the best
predictor of level of achievement? and ( d) To what extent is level of achievement
5
predicted by self-reports of feelings and behavior, and what behavioral category is the
best predictor of level of achievement?
6
Sample
Chapter II
Method
The subjects of this study were 83 students enroUed in the eighth grade at Urbana
Middle School in Urbana, Illinois. According to the 1990 Census, Urbana's population
was 36,344. The total school enrollment wllS 1020 students, with 37 percent minority
and approximately 32.8 percent low-income. The eighth grade enrollment consisted of
319 students, with 33 percent minority. Only data from those students who attended
Urbana Middle School during seventh grade and were currently in the eighth grade were
included in the study.
The middle school was organized into "teams," which consisted of a group of students
at the same grade level who worked with the same three to five teachers for the major
subjects of mathematics, science, English, and history. Students in this study came from
the three different eighth grade teams.
The population for this study consisted of those boys and girls who received standard
scores of 85 or higher after percentile ranks on the Iowa Tests of Basic Skills (ITBS;
Hieronymous, et al., 1990) were converted The cut-off score of 85 was chosen as it falls
one standard deviation below the mean (X = 100, SD= IS). The ITBS was the only
standardized estimate of ability available, because the school system does not administer
intelligence tests. The ITBS was constructed to provide for comprehensive measurement
of growth in the fundamental skills~ listening, word analysis, vocabulary, reading, the
mechanics of writing, methods of study, and mathematics.
Obtaining the Sample
Parental pennission was sought for all eighth grade students through mass mailing;
The eighth grade team teachers were then asked to derive lists of students that they
viewed as underachievers. The primary criterion that they were given was that these
7
students routinely do not complete work that they appear cognitively capable of doing. A
total of 42 students were listed. A second mailing was then sent to those students' parents
who did not respond initially. The purpose of this procedure and second mailing was to
increase the chance that a large enough number of underachievers would be included in
the sample in order for more accurate comparisons to occur. A total of 128 permissions
were eventually obtained.
Three forty-minute sessions were scheduled within one month during which the
participating students completed the required inventories, to be discussed in the next
section. There was one session per eighth grade team. Those students who were unable
to complete the required forms in the allotted time were given time at a later date to
finish. Nine students did not attend a session to complete the forms and three students
withdrew from the school before the time of the sessions. A total of 116 students
eventually completed the required forms.
A review of cumulative folders for the participating students was then conducted.
Data was gathered for the following areas: age, gender, race, final seventh-grade grade
point average (g. p.a.), number of absences during seventh grade, number of discipline
referrals during seventh grade, percentile for the Complete Composite Score of the ITBS
given during seventh grade, and notice of special education records. The ITBS percentile
scores were then converted to standard scores based on a mean of 100 and a standard
deviation of 15. Of the 116 students, only 87 students met the criteria ofITBS scores
above 85 and enrollment at Urbana Middle School during seventh grade. Of the 29
students eliminated from the study after their folder review, 11 students had been listed
by their teachers as appearing to be underachievers. Six of those 11 were eliminated due
to their low ITBS scores and five due to lack of enrollment at the school the previous
year.
Instrumentation
8
Two inventories, the Self-Esteem Index (SEI; Brown & Alexander, 1991) and the
Youth Self-Report (YSR; Achenbach, 1991), were administered to those students for
whom parental permission was obtained.
The SEI is an 80-item, multi-dimensional, norm-referenced standardized measure of
the way that individuals from the ages of 7-0 through 18-11 years perceive and value
themselves. The SEI can be administered to individuals or groups in approximately 30
minutes. The self-report format requires subjects to read the SEI items and then to
classify each item on a Likert-type scale as Always True, Usually True, Usually False, or
Always False. There are four scales on the SEI: Perception of Academic Competence,
Perception of Familial Acceptance, Perception of Peer Popularity, and Perception of
Personal Security. A more complete description of the scales as adapted from the
manual is provided in the Appendix. The four SEI scales each yield a standard score and
overall self-esteem is measured by the Self-Esteem Quotient. Quotients from 90-110 and
standard scores from 8-12 are considered to be normal.
The 55 internal consistency reliability coefficients listed in the SEI manual are all
significant beyond the 5% level of confidence. Of the 44 coefficients associated with the
four SEI Scales 8 (18%) exceed .90 and 36 (82%) exceed .80. Predictably, the
coefficients reported for the total test are even higher. Ten of 11 reach or exceed .90.
According to the manual, validity coefficients resulting from correlations with the Piers
Harris Children's Self-Concept Scale, Revised (Piers, 1984 ), the Self-Esteem Inventories,
School Form (Coopersmith, 1984), and the Index of Personality Characteristics (Brown
& Coleman, 1988) were .29 to .77, .01 to .93, and .10 to .96, respectively. Most of the
coefficients are statistically significant, and 97%, 76%, and 93% respectively, meet or
exceed the manual's stated criteria of coefficients of .35 and higher being accepted as
support for a test's validity.
The YSR is designed to obtain self-reports of feelings and behavior in a standardized
fashion for comparison with reports by normative groups of 11-to 18-year-olds. All YSR
9
items are stated in the first person. Youth rate themselves on a 0-1-2 scale for how true
the item is within the past six months. The YSR requires 5th grade reading skills, but
can be read to respondents with limited reading ability. Boys Problem Scales include
Anxious/Depressed, Withdrawn, Somatic Complaints, Self-Destructive/Identity
Problems, Social Problems, Attention Problems, Thought Problems, Delinquent
Behavior, Aggressive Behavior; Competence Scales include Activities and Social. Girls
Problem Scales include Somatic Complaints, Anxious/Depressed, Withdrawn, Social
Problems, Attention Problems, Thought Problems, Aggressive Behavior, Delinquent
Behavior; Competence Scales include Activities and Social. The problem scales
designated as Withdrawn, Somatic Complaints, and Anxious/Depressed are grouped
under the heading Internalizing. The problem scales designated as Delinquent Behavior
and Aggressive Behavior are grouped under the heading Externalizing. The YSR is
scored on separate profiles for boys and girls. T scores for the problem scales,
Internalizing, Externalizing, and Total Problem scale can be derived. The clinical
cutpoint is T=60, with the borderline clinical range including T scores of 60 through 63.
For this study, the results of the Self-Destructive/Identity Problem Scale were not
included since they pertained only to the male subjects. The results of the Competence
Scale were also omitted since many students failed to complete this section during the
allotted administration time.
The mean test-retest reliability correlations for raw scores on the YSR problem scales
were reported as .65 for 11-to 14-year-olds and .83 for 15-to 18-year-olds (Achenbach,
1991). On the total problem score, the test-retest r was .70 for 11-to 14-year-olds and .91
for 15-to 18-year olds. Stability rs were .56 for total problems and the mean stability r
was .49 for problem scales. The manual also presented several kinds of evidence for the
validity of YSR scores. Although test manuals typically provide evidence of construct
validity in terms of significant correlations with scales derived from other instruments,
the lack of instruments resembling the YSR limited this possibility. The YSR manual,
10
therefore, focuses its validity findings on the content validity of YSR items and the
criterion-related validity of YSR scale scores. Content validity was supported by the
ability of most YSR items to discriminate significantly between youth referred for mental
health services and nonreferred youths. Referred youths scored themselves significantly
higher (p <.01) on 95 of the 101 problem items that are counted toward the total problem
scale. Criterion-related validity was supported by the ability of the YSR quantitative
scores to discriminate between referred and nonreferred youths after demographic effects
were partialled out. All effects of referral status that were significant at p <. 01 reflected
lower problem scores for nonreferred than referred youths.
Procedure
The discrepancy between predicted grade point average (g. p.a.), using ITBS as
criterion, and actual g.p.a. constituted a continuous measure of the degree of
overachievement/underachievement. Positive values were regarded as overachievement
and negative values as underachievement.
The statistical procedures then used to answer the research questions were as follows:
1) T-tests were conducted to determine possible differences in the demographic variables
of race, gender, and notice of special education records between overachievers and
underachievers as identified by discrepancy scores.
2) Means and standard deviations for number of absences and number of discipline
referrals were calculated for the achieving and underachieving groups. Pearson product
moment correlations between the dependent variable,
overachievement/underachievement, and the continuous independent variables of age,
number of absences, and number of discipline referrals were also calculated.
3) A Pearson product-moment correlation was calculated between
overachievement/underachievement and the SEI total test scores. A stepwise multiple
regression was then conducted with overachievement/underachievement and the four
subscales of the SEI.
11
4) A Pearson product-moment correlation was calculated between
overachievement/underachievement and the YSR total test scores. A stepwise multiple
regression was then conducted with overachievement/underachievement and the eight
subscales of the YSR. The last subscale, Self-Destructive/Identity, was omitted because
it pertained only to male subjects.
12
Chapter ID
Results
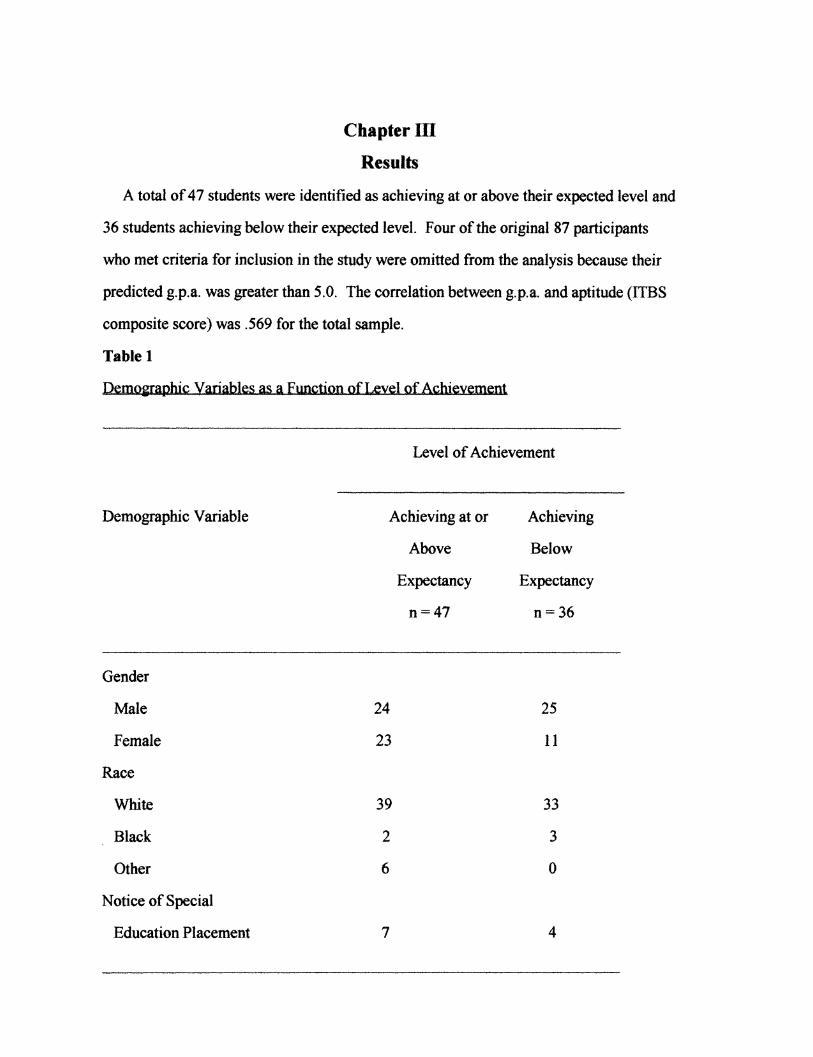
A total of 47 students were identified as achieving at or above their expected level and
36 students achieving below their expected level. Four of the original 87 participants
who met criteria for inclusion in the study were omitted from the analysis because their
predicted g.p.a. was greater than 5.0. The correlation between g.p.a and aptitude (ITBS
composite score) was .569 for the total sample.
Table 1
Dem<>.if8llhic Variables as a Function of Level of Achievement
Demographic Variable
Gender
Male
Female
Race
White
Black
Other
Notice of Special
Education Placement
Level of Achievement
Achieving at or
Above
Expectancy
n=47
24
23
39
2
6
7
Achieving
Below
Expectancy
n=36
25
11
33
3
0
4
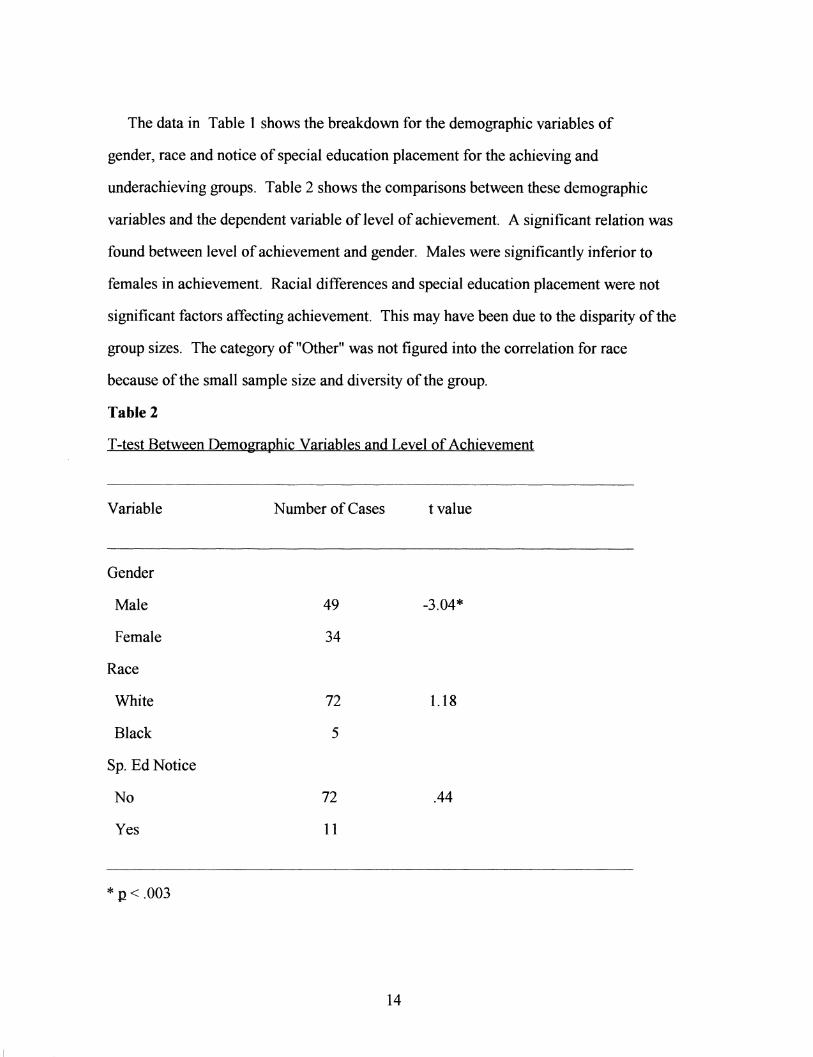
The data in Table 1 shows the breakdown for the demographic variables of
gender, race and notice of special education placement for the achieving and
underachieving groups. Table 2 shows the comparisons between these demographic
variables and the dependent variable of level of achievement. A significant relation was
found between level of achievement and gender. Males were significantly inferior to
females in achievement. Racial differences and special education placement were not
significant factors affecting achievement. This may have been due to the disparity of the
group sizes. The category of "Other" was not figured into the correlation for race
because of the small sample size and diversity of the group.
Table 2
T-test Between Demographic Variables and Level of Achievement
Variable Number of Cases t value
Gender
Male 49 -3.04*
Female 34
Race
White 72 1.18
Black 5
Sp. Ed Notice
No 72 .44
Yes 11
* p< .003
14
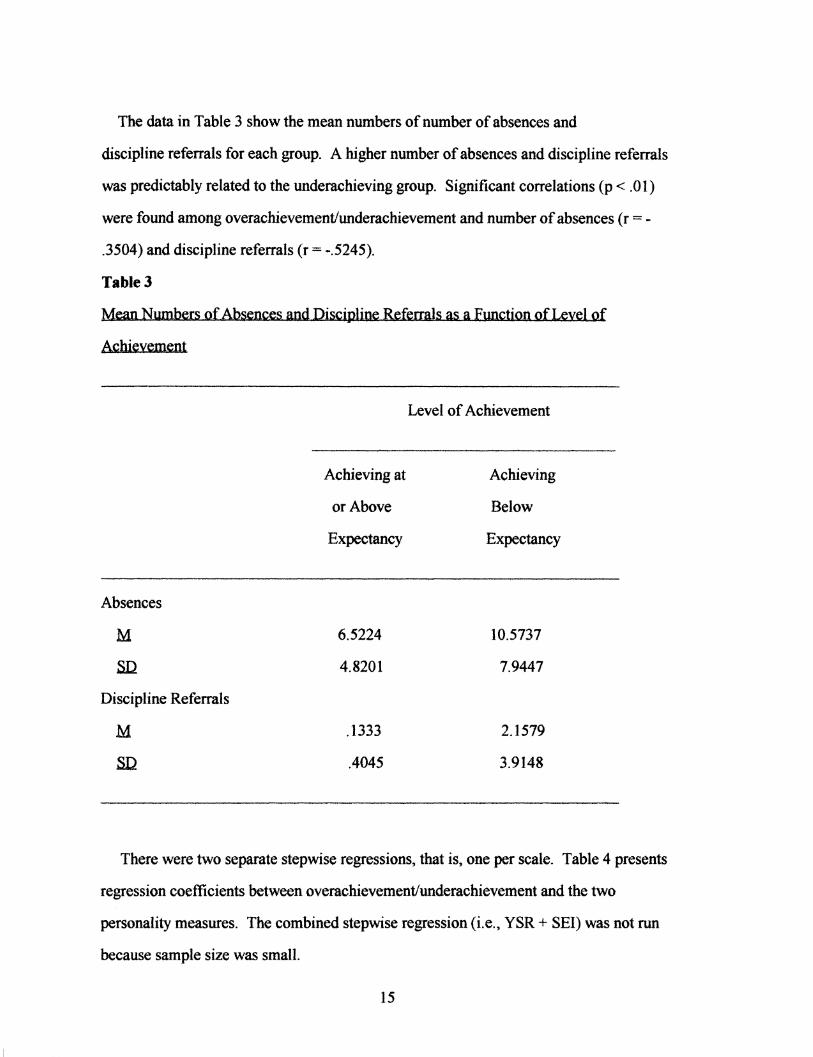
The data in Table 3 show the mean numbers of number of absences and
discipline referrals for each group. A higher number of absences and discipline referrals
was predictably related to the underachieving group. Significant correlations (p < .01)
were found among overachievement/underachievement and number of absences (r = -
.3504) and discipline referrals (r = -.5245).
Table3
Mean Numbers of Absences and Discipline Referrals as a F1mctjon of Level of
Achievement
Absences
M
fill
Discipline Referrals
M
fill
Achieving at
or Above
Expectancy
6.5224
4.8201
.1333
.4045
Level of Achievement
Achieving
Below
Expectancy
10.5737
7.9447
2.1579
3.9148
There were two separate stepwise regressions, that is, one per scale. Table 4 presents
regression coefficients between overachievement/underachievement and the two
personality measures. The combined stepwise regression (i.e., YSR + SEI) was not run
because sample size was small.
15
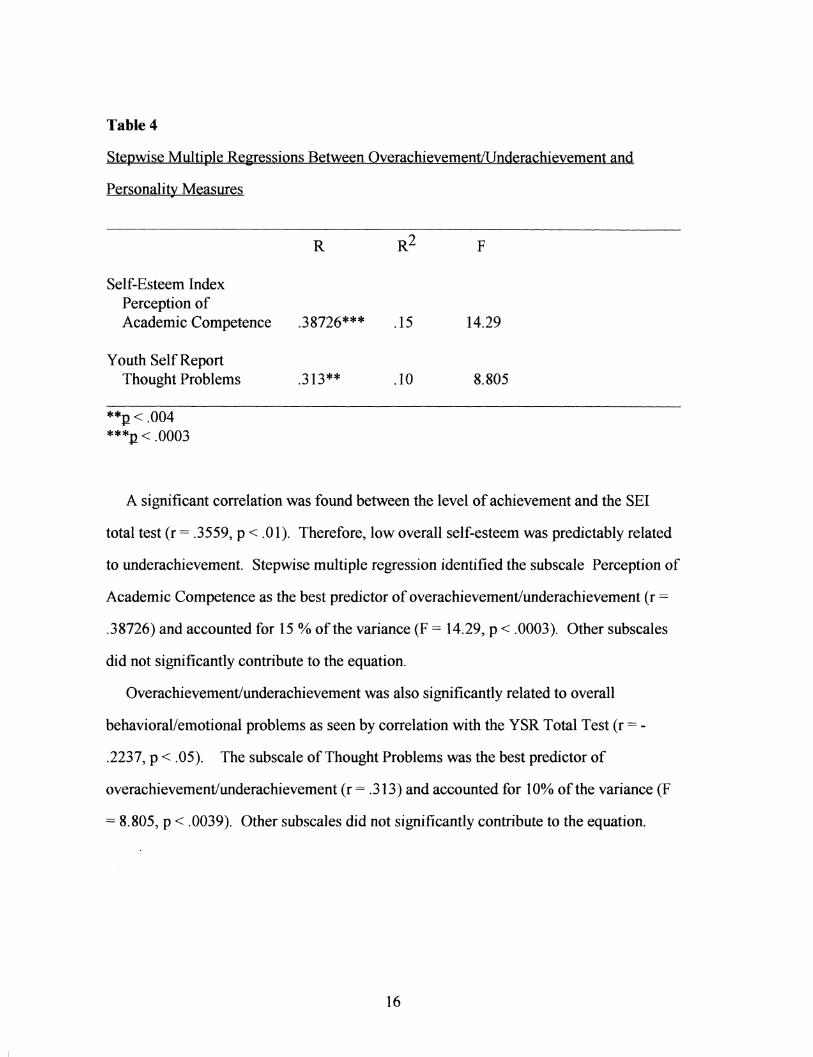
Table 4
Stepwise Multiple Regressions Between OverachievemenWnderachievement and
Personality Measures
Self-Esteem Index Perception of Academic Competence
Youth Self Report Thought Problems
**p < .004 ***p < .0003
R
.38726***
.313**
F
.15 14.29
.10 8.805
A significant correlation was found between the level of achievement and the SEI
total test (r = .3559, p < .01). Therefore, low overall self-esteem was predictably related
to underachievement. Stepwise multiple regression identified the subscale Perception of
Academic Competence as the best predictor of overachievement/underachievement (r =
.38726) and accounted for 15 % of the variance (F = 14.29, p < .0003). Other subscales
did not significantly contribute to the equation.
Overachievement/underachievement was also significantly related to overall
behavioral/emotional problems as seen by correlation with the YSR Total Test (r = -
.2237, p < .05). The subscale of Thought Problems was the best predictor of
overachievement/underachievement (r = .313) and accounted for 10% of the variance (F
= 8.805, p < .0039). Other subscales did not significantly contribute to the equation.
16
Chapter IV
Discussion
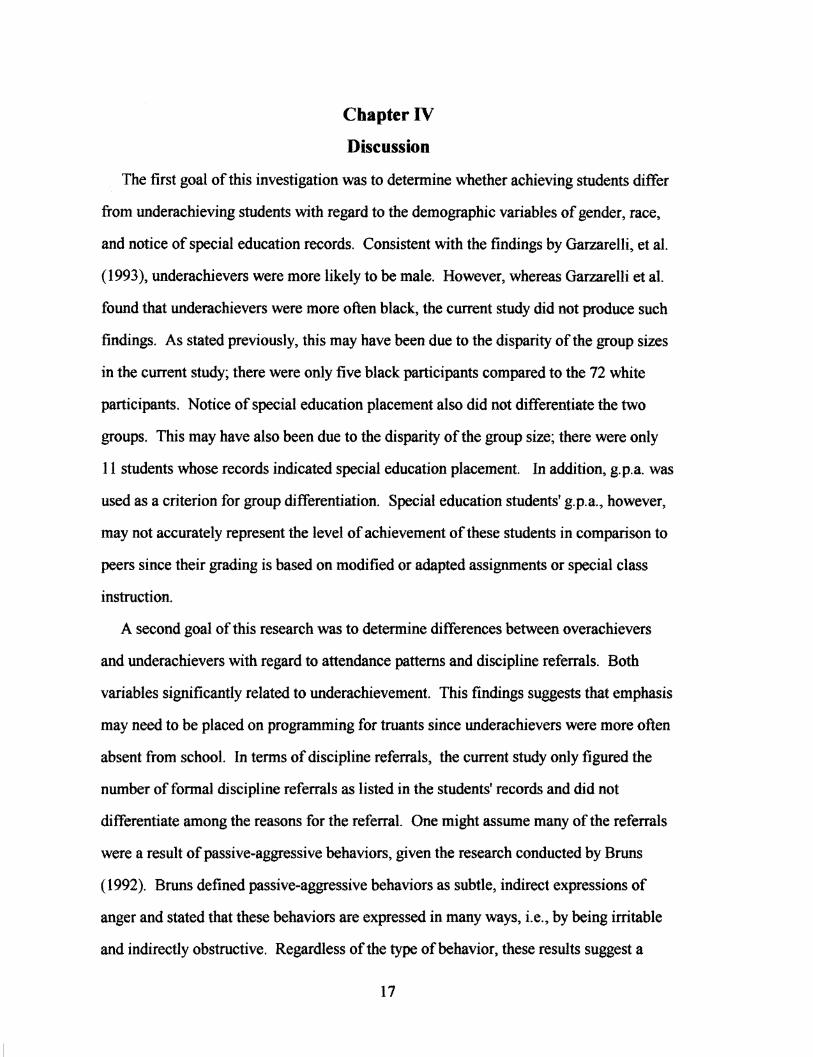
The first goal of this investigation was to determine whether achieving students differ
from underachieving students with regard to the demographic variables of gender, race,
and notice of special education records. Consistent with the findings by Garzarelli, et al.
(1993), underachievers were more likely to be male. However, whereas Garzarelli et al.
found that underachievers were more often black, the current study did not produce such
findings. As stated previously, this may have been due to the disparity of the group sizes
in the current study; there were only five black participants compared to the 72 white
participants. Notice of special education placement also did not differentiate the two
groups. This may have also been due to the disparity of the group size; there were only
11 students whose records indicated special education placement. In addition, g.p.a. was
used as a criterion for group differentiation. Special education students' g.p.a., however,
may not accurately represent the level of achievement of these students in comparison to
peers since their grading is based on modified or adapted assignments or special class
instruction.
A second goal of this research was to determine differences between overachievers
and underachievers with regard to attendance patterns and discipline referrals. Both
variables significantly related to underachievement. This findings suggests that emphasis
may need to be placed on programming for truants since underachievers were more often
absent from school. In terms of discipline referrals, the current study only figured the
number of formal discipline referrals as listed in the students' records and did not
differentiate among the reasons for the referral. One might assume many of the referrals
were a result of passive-aggressive behaviors, given the research conducted by Bruns
(1992). Bruns defined passive-aggressive behaviors as subtle, indirect expressions of
anger and stated that these behaviors are expressed in many ways, i.e., by being irritable
and indirectly obstructive. Regardless of the type of behavior, these results suggest a
17
need for underachievers to receive some form of counseling or behavior modification in
order to decrease the number of discipline referrals they receive.
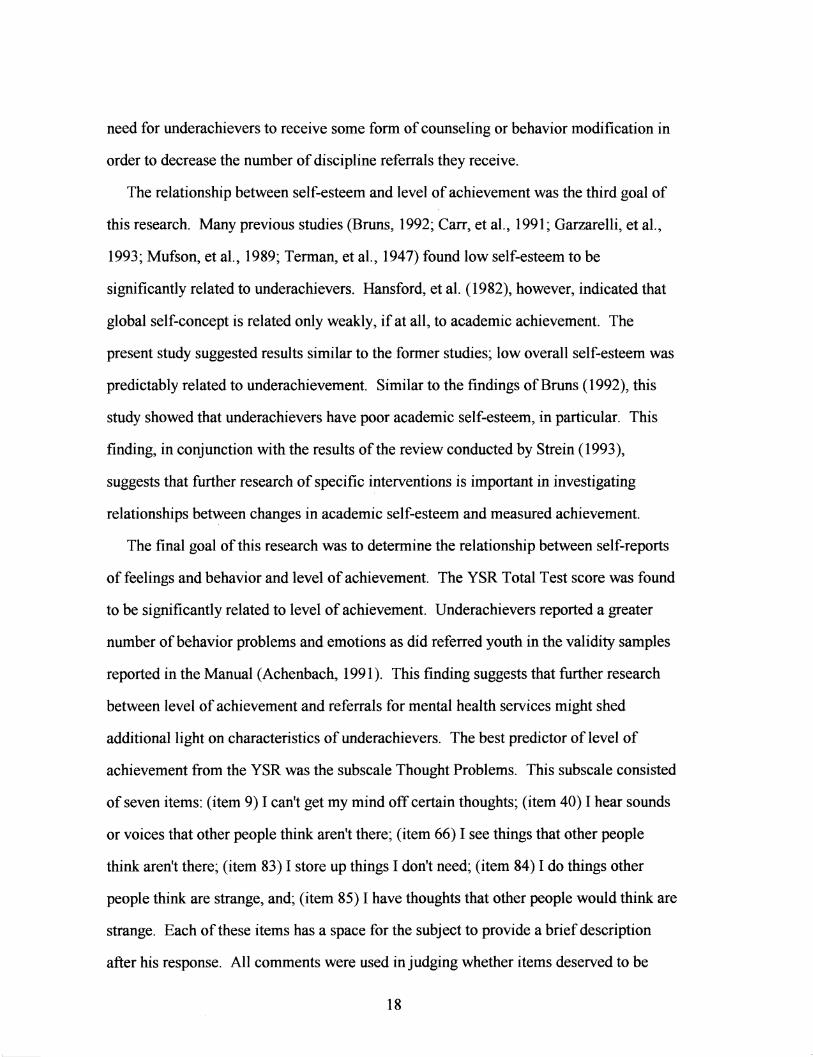
The relationship between self-esteem and level of achievement was the third goal of
this research. Many previous studies (Bruns, 1992; Carr, et al., 1991; Garzarelli, et al.,
1993; Mufson, et al., 1989; Terman, et al., 1947) found low self-esteem to be
significantly related to underachievers. Hansford, et al. (1982), however, indicated that
global self-concept is related only weakly, if at all, to academic achievement. The
present study suggested results similar to the former studies; low overall self-esteem was
predictably related to underachievement. Similar to the findings of Bruns (1992), this
study showed that underachievers have poor academic self-esteem, in particular. This
finding, in conjunction with the results of the review conducted by Strein (1993),
suggests that further research of specific interventions is important in investigating
relationships between changes in academic self-esteem and measured achievement.
The final goal of this research was to determine the relationship between self-reports
of feelings and behavior and level of achievement. The YSR Total Test score was found
to be significantly related to level of achievement. Underachievers reported a greater
number of behavior problems and emotions as did referred youth in the validity samples
reported in the Manual (Achenbach, 1991). This finding suggests that further research
between level of achievement and referrals for mental health services might shed
additional light on characteristics of underachievers. The best predictor of level of
achievement from the YSR was the subscale Thought Problems. This subscale consisted
of seven items: (item 9) I can't get my mind off certain thoughts; (item 40) I hear sounds
or voices that other people think aren't there; (item 66) I see things that other people
think aren't there; (item 83) I store up things I don't need; (item 84) I do things other
people think are strange, and; (item 85) I have thoughts that other people would think are
strange. Each of these items has a space for the subject to provide a brief description
after his response. All comments were used in judging whether items deserved to be
18
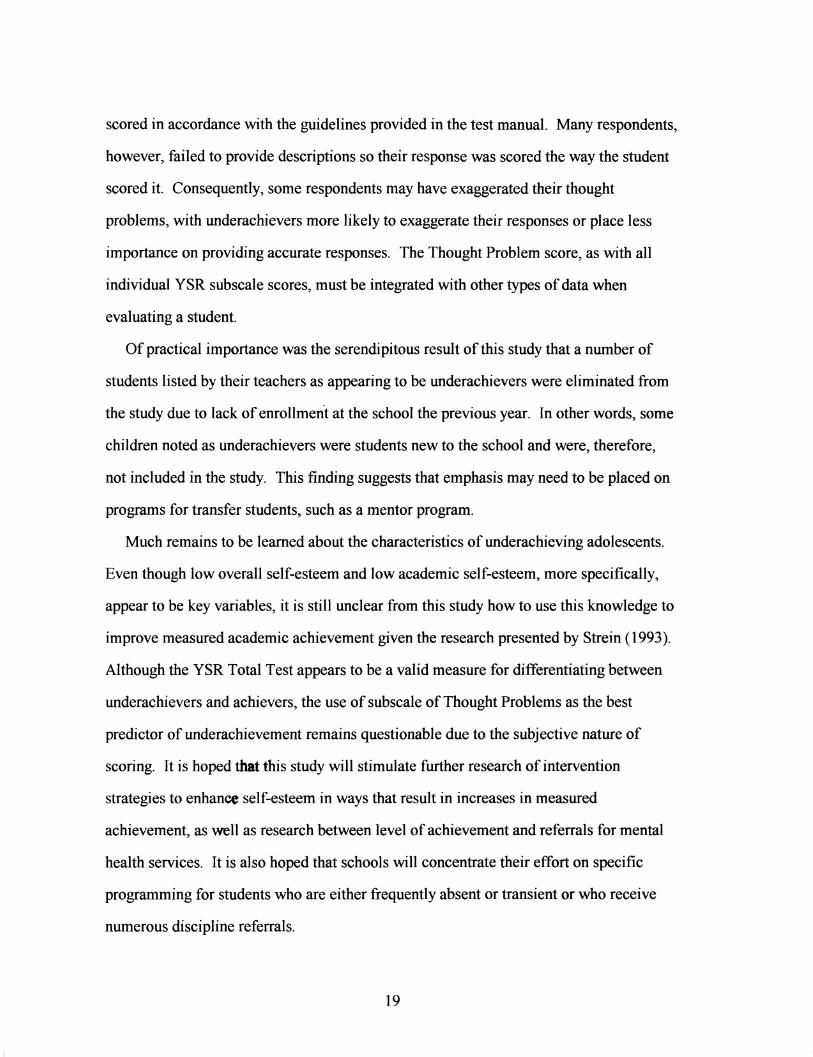
scored in accordance with the guidelines provided in the test manual. Many respondents,
however, failed to provide descriptions so their response was scored the way the student
scored it. Consequently, some respondents may have exaggerated their thought
problems, with underachievers more likely to exaggerate their responses or place less
importance on providing accurate responses. The Thought Problem score, as with all
individual YSR subscale scores, must be integrated with other types of data when
evaluating a student.
Of practical importance was the serendipitous result of this study that a number of
students listed by their teachers as appearing to be underachievers were eliminated from
the study due to lack of enrollment at the school the previous year. In other words, some
children noted as underachievers were students new to the school and were, therefore,
not included in the study. This finding suggests that emphasis may need to be placed on
programs for transfer students, such as a mentor program.
Much remains to be learned about the characteristics of underachieving adolescents.
Even though low overall self-esteem and low academic self-esteem, more specifically,
appear to be key variables, it is still unclear from this study how to use this knowledge to
improve measured academic achievement given the research presented by Strein ( 1993 ).
Although the YSR Total Test appears to be a valid measure for differentiating between
underachievers and achievers, the use of subscale of Thought Problems as the best
predictor of underachievement remains questionable due to the subjective nature of
scoring. It is hoped that this study will stimulate further research of intervention
strategies to enhance self-esteem in ways that result in increases in measured
achievement, as well as research between level of achievement and referrals for mental
health services. It is also hoped that schools will concentrate their effort on specific
programming for students who are either frequently absent or transient or who receive
numerous discipline referrals.
19
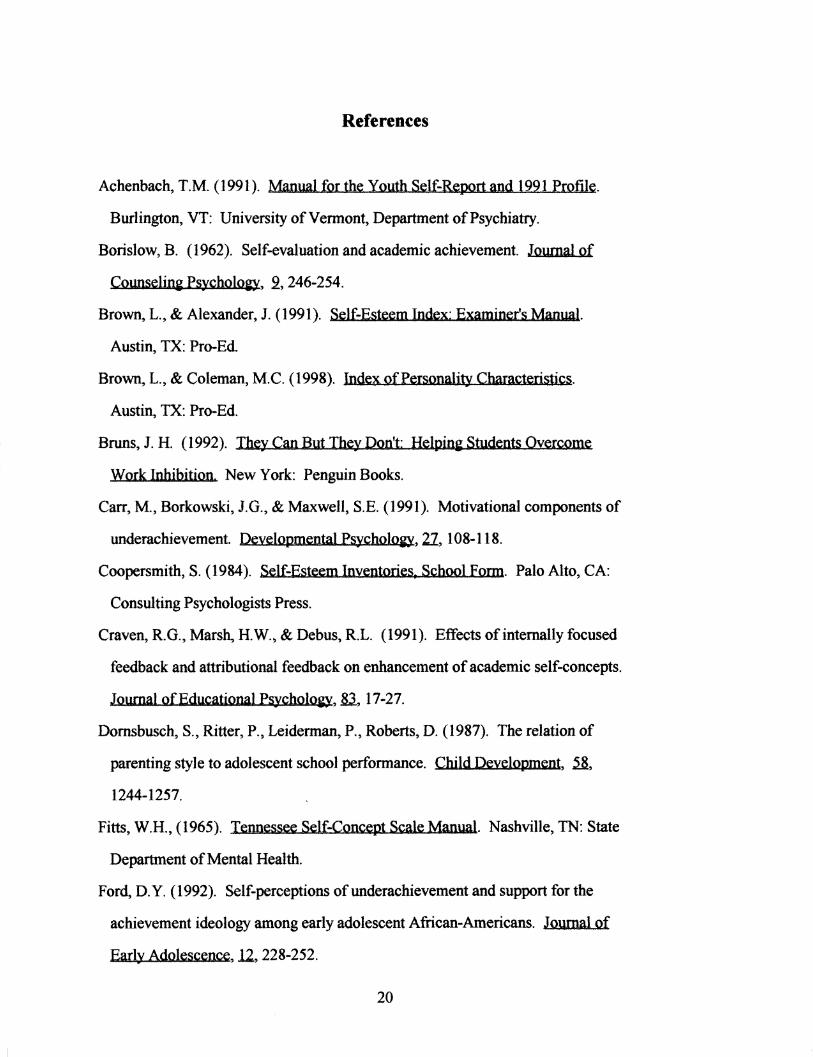
References
Achenbach, T.M. (1991). Manual for the Youth Self-Report and 1991 Profile.
Burlington, VT: University of Vermont, Department of Psychiatry.
Borislow, B. (1962). Self-evaluation and academic achievement. Journal of
Counseling Psychology, 2, 246-254.
Brown, L., & Alexander, J. (1991). Self-Esteem Index: Examiner's Manual
Austin, TX: Pro-Ed
Brown, L., & Coleman, M.C. (1998). Index of Personality Cbar&(teristics.
Austin, TX: Pro-Ed.
Bruns, J. H. (1992). They Can But They Don't: Helping Students Overcome
Work Inhibition. New York: Penguin Books.
Carr, M., Borkowski, J.G., & Maxwell, S.E. (1991). Motivational components of
underachievement. Developmental Psychology, 21, 108-118.
Coopersmith, S. (1984). Self-Esteem Inventories, School Form. Palo Alto, CA:
Consulting Psychologists Press.
Craven, R.G., Mars~ H.W., & Debus, R.L. (1991). Effects of internally focused
feedback and attributional feedback on enhancement of academic self-concepts.
Journal of Educational Psychology, .8.l 17-27.
Domsbusch, S., Ritter, P., Leiderman, P., Roberts, D. (1987). The relation of
parenting style to adolescent school performance. Child Development, 2.8,
1244-1257.
Fitts, W.H., (1965). Tennessee Self-Concept Scale Manual. Nashville, TN: State
Department of Mental Health.
Ford, D. Y. ( 1992). Self-perceptions of underachievement and support for the
achievement ideology among early adolescent African-Americans. Journal of
Early Adolescence, .12, 228-252.
20
GaIZarelli, P., Everhart, B., & Lester, D. (1993). Self-concept and academic
performance in gifted and academically weak students. Adolescence, 2.&, 235-
237.
Goodstein, M. (1980). The diagnosis and treatment of underachievement.
Journal of the International Association of Pupil Persoonel Workers, H. 102-9.
Hansford, B.C., & Hattie, J.A. (1982). The relationship between self and
achievement/performance measures. Review of E<iucation,al Research. i2, 123-
142.
Hieronymous, A. N., Hoover, H. D., Oberley, K. R., Cantor, N. K., Frisbie, D. A.,
Dunbar, D. A., Lewis, J.C., & Linquist, E. F. (1990). MmuaI for Iowa Tests of
Basic Skills. Chicago: The Riverside Publishing Co.
Karnes, M., McCoy, G., Zehrbac~ R., Wollersheim, J., Clarizio, H., Costin, L.,
Stanly, L. (1961). Factors associated with underachievement and
overachievement of intellectually gifted children. Exceptional Children. 2.&,
167-175.
Komwic~ M. ( 1965). Underachievement. Springfield, Illinois: · Charles C.
Thomas.
Krause, A. (1983). Attributions, intrinsic motivation. and metamemory:
l&terminants ofsttateiic behavior. Unpublished master's thesis, University of
Notre Dame, Notre Dame, IN.
Morrow, W.R. & Wilson, R. C. (1961). Family relations of bright high achieving
and underachieving high school-boys. Child Develo.pment, ll. 501 .. 510.
Mufson, L., Cooper, J., & Hall, J. (1989). Factors associated with
underachievement in seventh-grade children. Journal of Educational Research,
n. 5.10.
Nicholls, J.G. (1978). The development of concepts of effort and ability,
perceptions of own attainment, and the understanding that difficult tasks require
21
more ability. Child Development,~. 800-814.
Piers, E.V. (1984). Piers-Harris Children's Self-Concept Scale-Revised Manual
128.4. Los Angeles: Western Psychological Studies.
Russell, D. W. (1958). A plea to beam in the underachiever. Hi&}l Scbool
Journal, il. 66-68.
Scheirer, M.A. & Kraut, RE. (1979). Increasing educational achievement via
self-concept change. B,exiewofEducati.onal Research, M, 3-17.
Strei~ W. (1988). Effectiveness of classroom-based elementary school affective
education programs: A critical review. Psycholoe;y in the $chools, ll. 288-296.
Strein, W. (1993). Advances in research on academic self-concept: Implications
for school psychology. School PsycholoaY Review, 22. 273-284.
Tenn.an, L.M. & Ode~ M.H. (1947). The Gjftcd Child Grows Up. Stanford, CA:
Stanford University Press.
22
Appendix
Description of the SEI scales
Self-Esteem Qw»ient
The Self-Esteem Quotient takes into account all of the attributes and variables that are
measured by the SEI. For this reason, it is the best predicter of global or general self
esteem.
Perception of Familial Acceptance Scale
The Perception of Familial Acceptance Scale is a measure of the way that individuals
perceive and value themselves as members of their families and in their own homes. The
20 items of this scale address the abilities, relationships, attitudes, interests, and values of
a respondent with regard to interactions with parents, siblings, and other family members
and with regard to family activities. Deviant scores may indicate either very negative
perceptions of home and family or disturbingly positive, glowing perceptions of home
and family.
Perception of Academic Competence Scale
The Perception of Academic Competence Scale is a measure of the way that
individuals perceive themselves in academic and intellectual pursuits. The 20 items on
this scale are concerned with individuals' perceptions of (a) their school performance; (b)
their interest in and desire to excel at academic activities; ( c) the interest and support
available from teachers; ( d) the value that they attach to intellectual achievement; and ( e)
the affective qualities associated with achievement. Students with low scores are
reporting difficulties at school or in academically loaded situations. They do not feel
competent to meet the expectations and requirements that they encounter at school.
Perception o[feer Popularity
23
The Perception of Peer Popularity Scale measures individuals' perceptions of their
acceptance and popularity with children their own age. The 20 items on this scale are
concerned with individuals' perceptions of: (a) what friends, classmates, and other peers
think about them; (b) their social and interpersonal skills and the ease with which they
interact with peers; and ( c) their leadership traits and characteristics. Deviant low scores
are common among students who have been sheltered or who are socially inexperienced
or inept, students who are immature or self-indulgent~ students who are culturally or
linguistically different, students who have moved recently or frequently. or unsociable
conduct disordered or socially maladjusted students.
&irception of Personal Security Scale
The Perception of Personal Security Scale measures individuals' perception of their
physical and psychological well-being. The 20 items of this scale are concerned with
individuals' perceptions of their: (a) general health and physical condition; (b) guilt and
shame over real or imagined transgressions; ( c) overall feelings of anxiety and personal
vulnerability; ( d) desire to be younger; and ( e) fears and phobias. Youngsters with
deviant scores may be extremely overanxious and tend to internalize problems.
24
Recommended