Factors of available soil
water in TexasMap Comparison project
Brandon J. Okafor
12/6/2013

1
Introduction
Geology of Texas
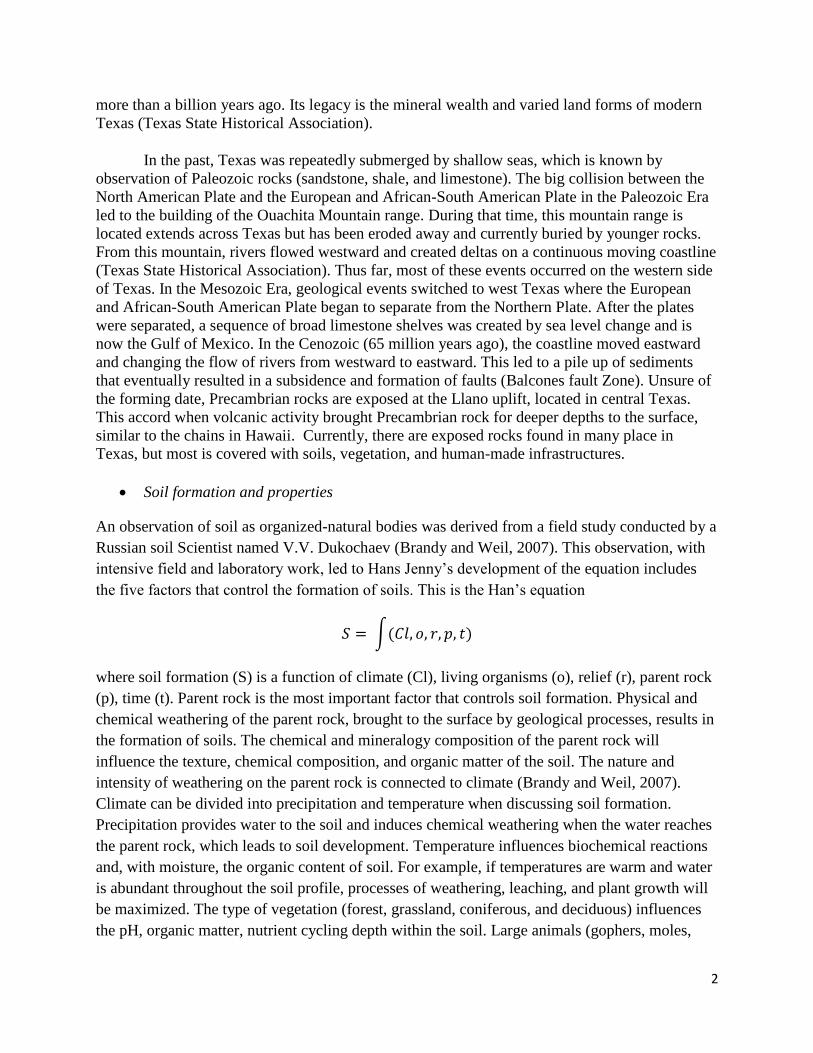
From mountains to coastal plains, Texas poses a great number of various physiographic
environments that are controlled by the different rock units that exposed at the surface and buried
beneath soils. The story behind the diverse group of geological formations in Texas can be
observed by analysis of spatial distribution across the state (figure 1).
Figure 1: Geological map of Texas (Bureau of Economic Geology)
The rock units reveal events that occurred in the past, but can also allow us to look in the future
and to see the fate of Texas. The geologic history of Texas, as documented by the rocks, began
2
more than a billion years ago. Its legacy is the mineral wealth and varied land forms of modern
Texas (Texas State Historical Association).
In the past, Texas was repeatedly submerged by shallow seas, which is known by
observation of Paleozoic rocks (sandstone, shale, and limestone). The big collision between the
North American Plate and the European and African-South American Plate in the Paleozoic Era
led to the building of the Ouachita Mountain range. During that time, this mountain range is
located extends across Texas but has been eroded away and currently buried by younger rocks.
From this mountain, rivers flowed westward and created deltas on a continuous moving coastline
(Texas State Historical Association). Thus far, most of these events occurred on the western side
of Texas. In the Mesozoic Era, geological events switched to west Texas where the European
and African-South American Plate began to separate from the Northern Plate. After the plates
were separated, a sequence of broad limestone shelves was created by sea level change and is
now the Gulf of Mexico. In the Cenozoic (65 million years ago), the coastline moved eastward
and changing the flow of rivers from westward to eastward. This led to a pile up of sediments
that eventually resulted in a subsidence and formation of faults (Balcones fault Zone). Unsure of
the forming date, Precambrian rocks are exposed at the Llano uplift, located in central Texas.
This accord when volcanic activity brought Precambrian rock for deeper depths to the surface,
similar to the chains in Hawaii. Currently, there are exposed rocks found in many place in
Texas, but most is covered with soils, vegetation, and human-made infrastructures.
Soil formation and properties
An observation of soil as organized-natural bodies was derived from a field study conducted by a
Russian soil Scientist named V.V. Dukochaev (Brandy and Weil, 2007). This observation, with
intensive field and laboratory work, led to Hans Jenny’s development of the equation includes
the five factors that control the formation of soils. This is the Han’s equation
∫
where soil formation (S) is a function of climate (Cl), living organisms (o), relief (r), parent rock
(p), time (t). Parent rock is the most important factor that controls soil formation. Physical and
chemical weathering of the parent rock, brought to the surface by geological processes, results in
the formation of soils. The chemical and mineralogy composition of the parent rock will
influence the texture, chemical composition, and organic matter of the soil. The nature and
intensity of weathering on the parent rock is connected to climate (Brandy and Weil, 2007).
Climate can be divided into precipitation and temperature when discussing soil formation.
Precipitation provides water to the soil and induces chemical weathering when the water reaches
the parent rock, which leads to soil development. Temperature influences biochemical reactions
and, with moisture, the organic content of soil. For example, if temperatures are warm and water
is abundant throughout the soil profile, processes of weathering, leaching, and plant growth will
be maximized. The type of vegetation (forest, grassland, coniferous, and deciduous) influences
the pH, organic matter, nutrient cycling depth within the soil. Large animals (gophers, moles,
3
and prairie dogs) affects soil formation by burrowing through the soil bring lower soil material to
the surface. Microorganisms can affect soil formation their biochemistry processes that could
result in alteration of soil chemistry. Human activities highly affect soil formation chemically
and physically through agricultural and other operations. Relief, or topography, describes the
slope and elevation of the land surface (Brandy and Weil, 2007). Soil formation can be affected
by relief by rapid soil material loss by intensive erosion on steep slopes. Soil takes time to
develop and create different horizons (O, A, E, B, and R Horizons) within its profile. The rate of
weathering is different depending on all the other soil-forming factors which determines the age
of the soil. The change in soil color, structure, and mineralogy can be seen in months to years in
some soil. All these factors influence the soil type or orders.
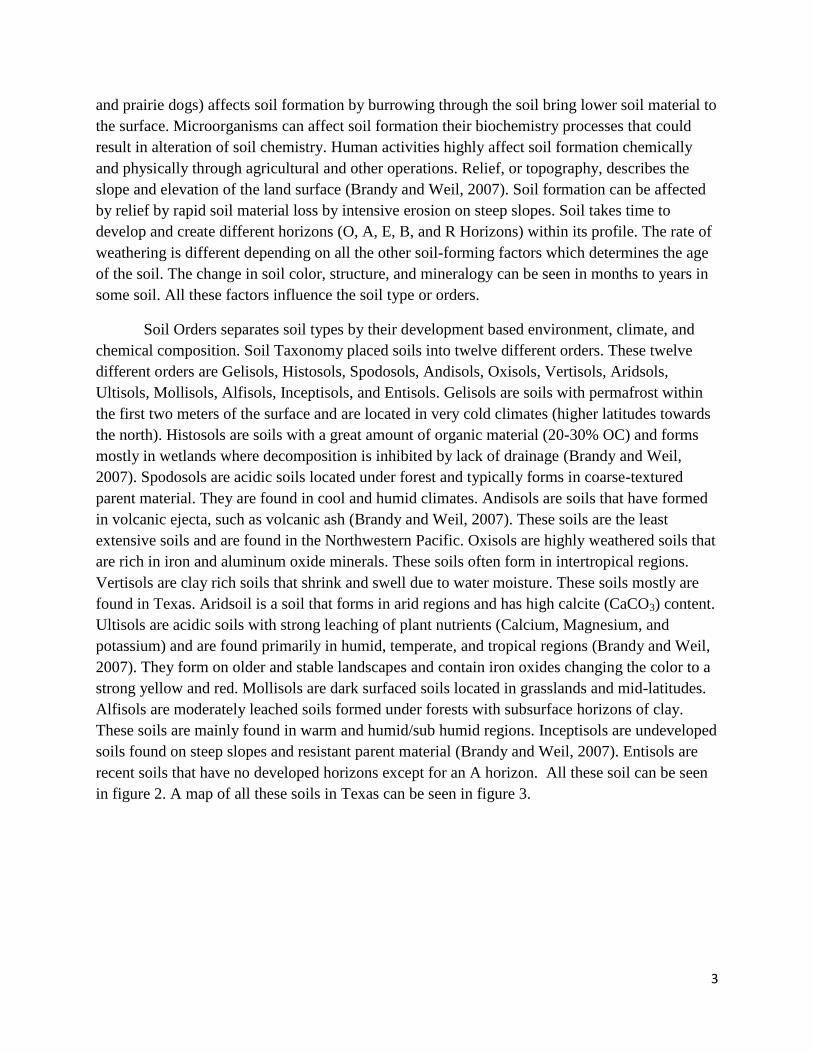
Soil Orders separates soil types by their development based environment, climate, and
chemical composition. Soil Taxonomy placed soils into twelve different orders. These twelve
different orders are Gelisols, Histosols, Spodosols, Andisols, Oxisols, Vertisols, Aridsols,
Ultisols, Mollisols, Alfisols, Inceptisols, and Entisols. Gelisols are soils with permafrost within
the first two meters of the surface and are located in very cold climates (higher latitudes towards
the north). Histosols are soils with a great amount of organic material (20-30% OC) and forms
mostly in wetlands where decomposition is inhibited by lack of drainage (Brandy and Weil,
2007). Spodosols are acidic soils located under forest and typically forms in coarse-textured
parent material. They are found in cool and humid climates. Andisols are soils that have formed
in volcanic ejecta, such as volcanic ash (Brandy and Weil, 2007). These soils are the least
extensive soils and are found in the Northwestern Pacific. Oxisols are highly weathered soils that
are rich in iron and aluminum oxide minerals. These soils often form in intertropical regions.
Vertisols are clay rich soils that shrink and swell due to water moisture. These soils mostly are
found in Texas. Aridsoil is a soil that forms in arid regions and has high calcite (CaCO3) content.
Ultisols are acidic soils with strong leaching of plant nutrients (Calcium, Magnesium, and
potassium) and are found primarily in humid, temperate, and tropical regions (Brandy and Weil,
2007). They form on older and stable landscapes and contain iron oxides changing the color to a
strong yellow and red. Mollisols are dark surfaced soils located in grasslands and mid-latitudes.
Alfisols are moderately leached soils formed under forests with subsurface horizons of clay.
These soils are mainly found in warm and humid/sub humid regions. Inceptisols are undeveloped
soils found on steep slopes and resistant parent material (Brandy and Weil, 2007). Entisols are
recent soils that have no developed horizons except for an A horizon. All these soil can be seen
in figure 2. A map of all these soils in Texas can be seen in figure 3.

4
Figure 2: Twelve Soil Orders (NRCS.USDA)
Figure 3: Dominant Soil Orders in Texas (NRCS.USDA)
5
Problem and hypothesis
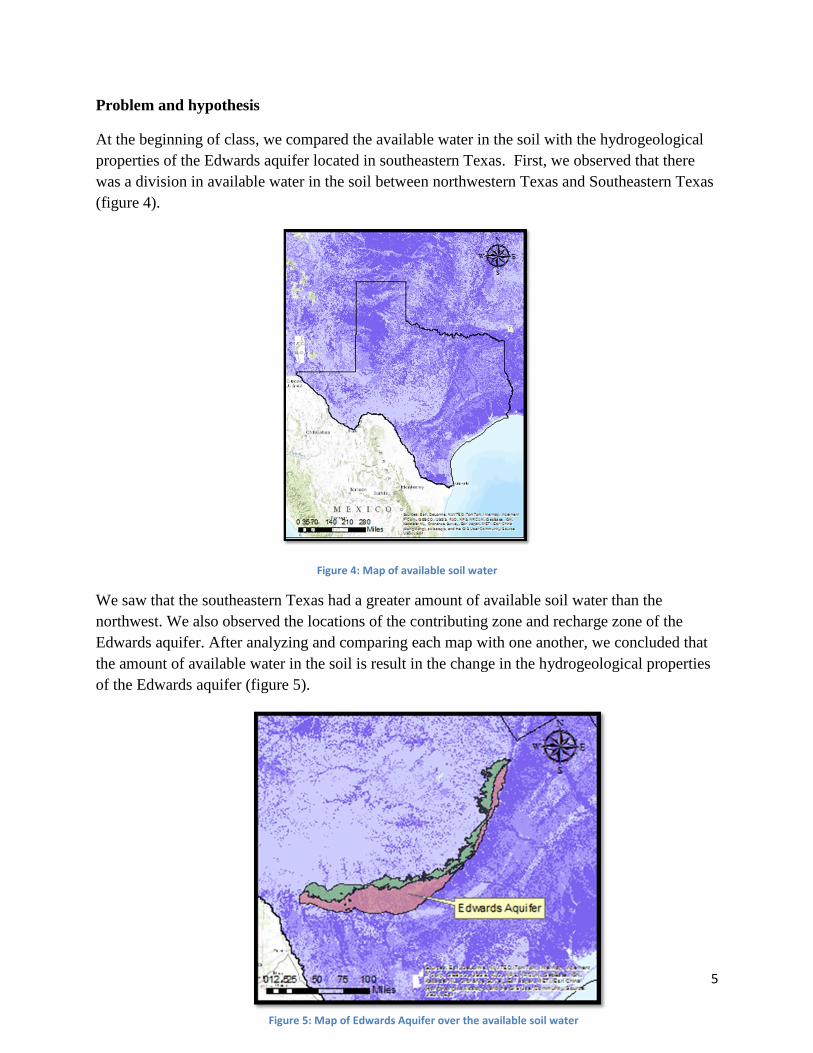
At the beginning of class, we compared the available water in the soil with the hydrogeological
properties of the Edwards aquifer located in southeastern Texas. First, we observed that there
was a division in available water in the soil between northwestern Texas and Southeastern Texas
(figure 4).
Figure 4: Map of available soil water
We saw that the southeastern Texas had a greater amount of available soil water than the
northwest. We also observed the locations of the contributing zone and recharge zone of the
Edwards aquifer. After analyzing and comparing each map with one another, we concluded that
the amount of available water in the soil is result in the change in the hydrogeological properties
of the Edwards aquifer (figure 5).
Figure 5: Map of Edwards Aquifer over the available soil water

6
We suggest that the reason for this is because there is a greater amount of soil in the southeast
than the northwest, indicated by the yellow boxes on the figure below (figure 6).
Figure 6: Cross-section of the Edwards Aquifer (Edwards Aquifer Authority)
Texas was once covered with water, after so time the water began to retreat and underlying
limestone was exposed. Since the water retreat southward, most of the fine particles that make up
soils were carried to the south causing south to have more soil water availability. But this story
was created by comparing soil water availability to hydrogeological properties of the Edwards
aquifer. Could we actually see these results by comparing soil type with soil water availability?
Also if this is true, and soil type is influenced by the geology, we should see similar results when
comparing soil water availability to geological units with in Texas. Taking this idea a step
further, we should also see this when comparing maps of vegetation cover with soil water
availability. I hypothesize that soil type and vegetation cover results will be similar to the
original comparison or story, where we see a different type of soil and vegetation cover in the
northwest of Texas verses the southeast. But I believe that geology map of Texas will not reveal
the same results because most of the rock formations under these areas are limestone and will not
affect soil water availability. I hypothesize that there will be a lower relief in the southern Texas
than northern Texas, which could also be another page in the soil water availability story. Also
the Trinity River flows through my field site and this could have effect on soil water availability.
This could influence the factors individually and their connection between each other.
Method
7
I used ArcGIS to compare the maps of available soil water, soil type, geology, vegetation
cover, topographical relief, and groundwater wells in Texas. I wanted to conduct comparisons of
Texas as a state and within my field site where I perform my graduate work. First, I obtained a
topographical basemap and downloaded a shapefile that outlined the state of Texas and a
shapefile with all the counties in Texas. I got these shapefiles from exercise 1. The Navarro,
Freestone, and McLennan counties all surround two of my field sites. Therefore, I had to export
those counties for the Texas county shapefile so that I will have a shapefile for my field site
counties. The soil water, soil orders, geology by age, and streams shapefiles were obtained from
the ArcGIS on landscape and elevation files we connected to for some of our exercises. The
geology by type maps were obtained from GIS online data on the Texas A&M University library
website. The streams and bodies of water map was the NHDPlusV2 we used in our exercises.
The soil type map was directly from National STATSGO Database. The land cover map was
obtained from the National Land Cover Dataset (NLCD). The elevation and water well location
data was obtained from Texas Water Development Board (TWDB). After collection, all the
maps where compared by observation. From research and previous knowledge, the relationships
of the maps with the available soil water map were conducted.
Results
Texas map comparisons:
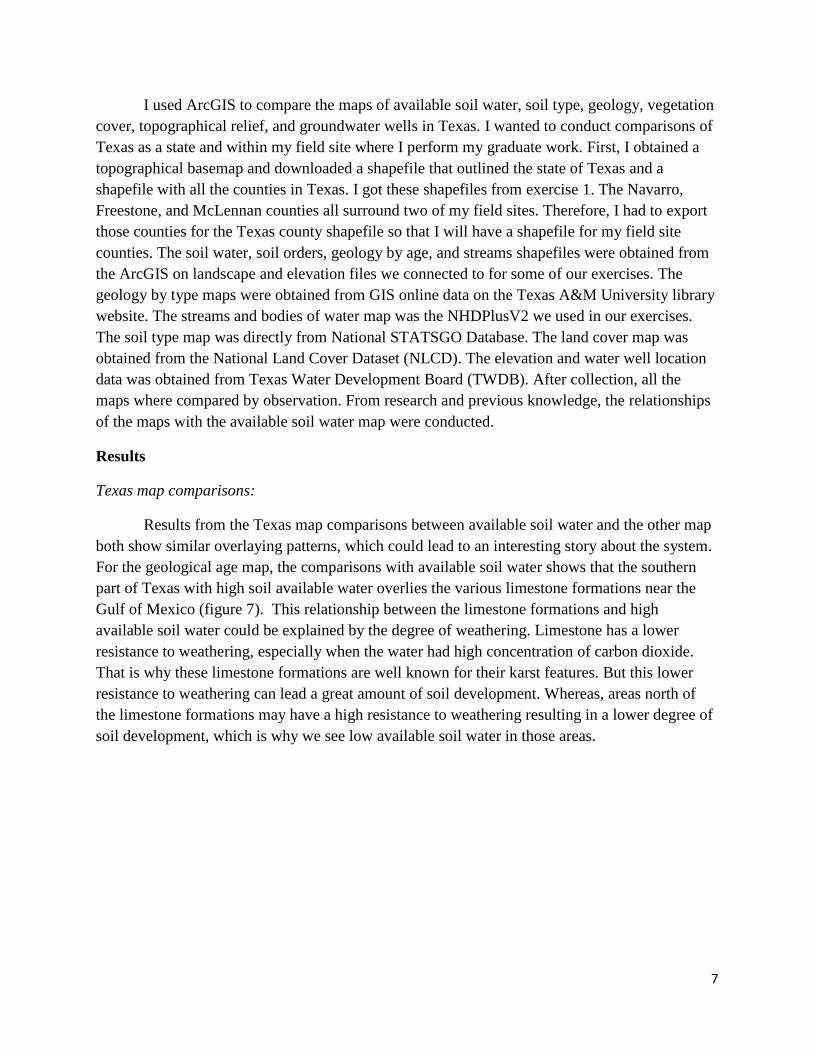
Results from the Texas map comparisons between available soil water and the other map
both show similar overlaying patterns, which could lead to an interesting story about the system.
For the geological age map, the comparisons with available soil water shows that the southern
part of Texas with high soil available water overlies the various limestone formations near the
Gulf of Mexico (figure 7). This relationship between the limestone formations and high
available soil water could be explained by the degree of weathering. Limestone has a lower
resistance to weathering, especially when the water had high concentration of carbon dioxide.
That is why these limestone formations are well known for their karst features. But this lower
resistance to weathering can lead a great amount of soil development. Whereas, areas north of
the limestone formations may have a high resistance to weathering resulting in a lower degree of
soil development, which is why we see low available soil water in those areas.
8
Figure 7: Available soil water and Geological age map of Texas
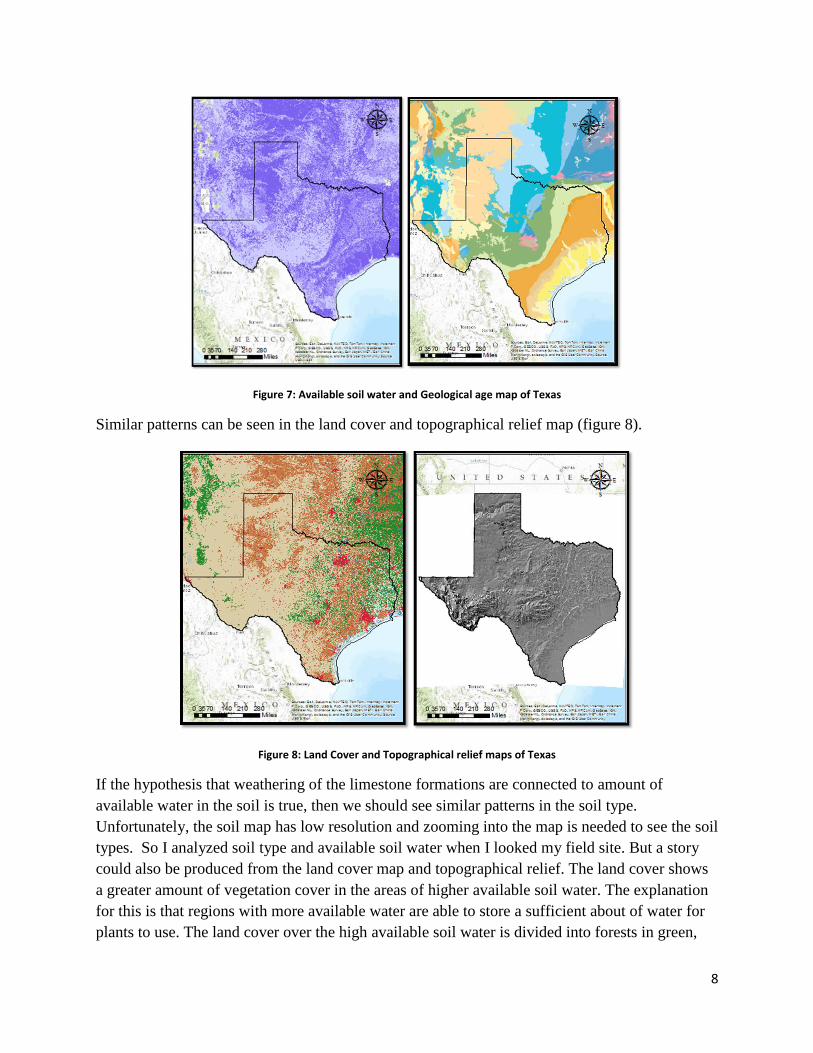
Similar patterns can be seen in the land cover and topographical relief map (figure 8).
Figure 8: Land Cover and Topographical relief maps of Texas
If the hypothesis that weathering of the limestone formations are connected to amount of
available water in the soil is true, then we should see similar patterns in the soil type.
Unfortunately, the soil map has low resolution and zooming into the map is needed to see the soil
types. So I analyzed soil type and available soil water when I looked my field site. But a story
could also be produced from the land cover map and topographical relief. The land cover shows
a greater amount of vegetation cover in the areas of higher available soil water. The explanation
for this is that regions with more available water are able to store a sufficient about of water for
plants to use. The land cover over the high available soil water is divided into forests in green,

9
croplands in orange and residential/industrial infrastructures in red. Another observation is that a
few areas with the highest available soil water are where residential infrastructures are located.
This could be due to the human impact on the soil, changing the physical properties of the soil to
hold on to more water. The topographical relief map has low relief where there is high available
soil water. Soil development is affected by relief. Areas with low relief have a more flat surface
for sediment deposit and this could lead to an increase in soil development. Once again, high soil
development will lead to soils with high available soil water.
Field Site Comparison (River Affected analysis):
The results from the Texas comparison study were assumed to be the same for this study;
however a river (figure 9) is included into the system. This is the Trinity River, which is 710
mile long and has a discharge of 180.3 m3/s. It is has a basin area of 15,589 km
2. This study was
to see if the river could have a change in the results that I discovered in the first study. The
middle of the river, in the red box, was the area where I looked at the different layers and started
to create a story.
Figure 9: Map of Trinity River
Once again, I compared the geology, soil type, and land cover to the available soil water map.
But before I did this, I looked at the available soil water map around the river (figure 10).

10
Figure 10: Map of Trinity River and available soil water
The map shows that there is a relationship with the river and high available soil water
surrounding it. This could be a result from the river being a meandering river. As the river moves
laterally across the surface, due to velocity of the water, it will deposit fine grain sediments in its
previous location. Fine grained soils, like Vertisols, are able to hold on to a great amount of
water due to their low permeability, but high porosity. Then I looked at the geology map (figure
11). This geological map actually is divided into polygons based on rock type.
Figure 11: Map of Trinity River and Geological type

11
The geological map reveals the same pattern as the available soil water map, where the silty soil
(in sky blue) falls around the river, along with high available soil water. Silty soil is fine grained
and are able to hold on to water more than sandy soils (in pink), which is seen in the available
soil water map. As you move away from the river, the soil becomes more coarse grained and this
would result in a decrease in available soil water. Same patterns can be seen in the soil type and
land cover maps (figure 12 and 13).
Figure 12: Map of Trinity River and Soil type
Figure 13: Map of Trinity River and Land cover

12
The soil type map shows that there a fine grained soil (Vertisol) around the river and the soils
becomes more coarse and diverse farther away from the river. Farther away from the river, there
is a mixture between Alfisols (forest green), Ultisols (yellow), Inceptisols (orange), Vertisols
(brown), and Entisols (blue-greenish). But the high available soil water can be related the
Vertisol physical properties to hold on a great amount of water. The soil type map can also be
compared to the geological map. But one problem that I encountered or disagree with is that in
the attribute table of the geological map, they called the material near the river unconsolidated
silt. However, Vertisols are mostly composed of clay material. This doesn’t destroy the
relationship between the two maps, but it does make me wonder if the way they obtained their
data was accurate enough. But the patterns between the soil type and geological maps are the
same near the river, but become more variable farther away from the river. These may have to do
with the river constantly weathering bedrock and carrying down other materials to create the
Vertisol along the river. But as you move away from the river, other factors (climate, organisms,
different parent material, etc.) can alter what type of soil is developed in the location. Land cover
maps have a more complex map, however it tells a more interesting story. As you move away
from the river, you can see wetlands (sky blue), grassland (khaki), forests (green), croplands
(orange), and residential infrastructures (red). But near the river, there are mostly wetlands.
Vertisols are mostly used for agriculture in Texas, but we don’t see much farming being
conducted in the Vertisols near the river. This is because of the behavior of the river to meander.
Farmers need to have a control over the amount of water and nutrients that is available to their
crops. If they plant near the river, this would not be possible. So Vertisols are mainly used for
crop, but only when they are not near river channels.
Conclusion
In conclusion, soil depth is an important component of available soil water, but it is not
the only one. The soil environment is very complex and there are many factors that govern its
properties, like available soil water. As seen, soil type, land cover, topographical relief, and
geological unit all plays a role in the amount of water that is in the soil. These factors all play an
individual role, but all are connected with each other. The introduction of a river channel seems
to change the overall pattern of each map, but it doesn’t have an influence on the relationships or
connection between the maps.

13
References
Brandy, Nyle C., and Ray R. Weil. The Nature and Properties of Soil. 14th ed. Berkeley, CA:
Prentice Hall, 2007.
Bureau of Economic Geology. Accessed December 6, 2013.
http://www.lib.utexas.edu/geo/pics/texas92a.jpg. Edwards Aquifer Authority. Accessed December 6, 2013.
http://data.edwardsaquifer.org/display_education_portal_m.php?pg=education_what_is_t
he_aquifer.
Natural Resources Conservation Service. Accessed December 6, 2013.
http://www.nrcs.usda.gov/wps/portal/nrcs/detail/soils/edu/?cid=nrcs142p2_053588. Natural Resources Conservation Service Texas. Accessed December 6, 2013.
http://www.nrcs.usda.gov/wps/portal/nrcs/detail/tx/soils/?cid=nrcs144p2_003094.
Texas A&M University library website. Accessed December 6, 2013.
http://library.tamu.edu/about/collections/map-gis-collections-services/gis-data-online-
interactive-maps/gis-online-data.html.
Texas State Historical Association: Texas Alumanac. Accessed December 6, 2013.
http://www.texasalmanac.com/topics/environment/geology-texas-0.
Wikipedia. Accessed December 6, 2013.
http://en.wikipedia.org/wiki/Trinity_River_%28Texas%29.
Recommended