WELCOMEFAMA 2015 SPRING MEETING
MEETING SESSION 1

CALL TO ORDER

INVOCATION

THANK YOU

INTRODUCTIONS

ROLL CALL

PROOF OF NOTICE

REVIEW & ENTER MINUTES
ANTI-TRUST & NON-DISCRMINATION

CHIEF JAMES COSTEIRASt. Augustine Fire Dept.
CORPORATE SPONSOR

MEETING SPONSORS
SELF-INTRODUCTION OF MEMBERS
Scott EdensTREASURER’S REPORT

Fire Apparatus Manufacturers' AssociationBalance Sheet Prev Year Comparison
As of December 31, 2014
Dec 31, '14 Dec 31, '13 $ Change % ChangeASSETS
Checking/Savings:Metro CU MM-Reserves-30 * 158,162 154,391 3,772 2%Metro CU MM-Surplus-31 156,676 133,623 23,053 17%A03 — FAMA Money Market 43,401 12,421 30,980 249%A04 — FAMA Checking 5,241 (2,746) 7,987 -291%
TOTAL ASSETS 363,480 297,688 65,792 22%
LIABILITIES
Current Liabilities:FAMA Prepaid Meeting Fees 2,350 - 2,350 100%FAMA Prepaid Membership Dues 1,500 - 1,500 100%
TOTAL LIABILITIES 3,850 - 3,850 100%
*2014 Required Reserves: $157,747.32

SUMMARY OF 2014 INCOME STATEMENT
2014 Surplus: $61,942
Increased Revenue - New Products:
$30,138 Technical Safety Guide Revenue
$15,738 Royalties$14,400 Mailer Sponsorships
Cost Reduction vs. Budget:
Newsletter Partnership with FEMSA and PennWell.
BOD Meetings Frugal Team.
Statistics Project Postponed: New strategy to improve analytical review in-process.
Strategic Structural Review A portion of original 2014 budget will be incurred during 2015 (Management Fees).
Technical Safety Guide DSI program does not require FAMA to purchase Safety Guide Inventory – Royalty.
(5) Categories $61,364 in savings vs 2014 Budget

SUMMARY OF 2015 BUDGET
BALANCED BUDGET = $13,540 Contingency Fund
Increased Revenue: $408,140 (3.66%)
Cost 2015 vs. 2014:
Management Fee & Other Transition Cost: One-Time cost to ensure proper transition of Business Manager Position.
9.4% budgeted expense increase without inclusion of one-time management fee.
3.9% increase vs 2014 budgeted expenses.

YEAR-TO-DATE SUMMARYAs of February 28, 2015
Balance Sheet:
2015 Reserve Requirement: $165,893.74Transfer of $7,616.34 to Reserve Money Market Account has been executed.
Income Statement:
RevenueLower Spring Meeting Fees (Disney Event); expect lower meeting fees.
Slow Member Collections ($6,540 as of February 28); expect to maintain current member level.
ExpenseAll expenses categories within budgeted guidelines.

BOARD OF DIRECTORS’ REPORT

Since Fall 2014 Meeting:
• Board Planning Mtg., Nov. 2014, Nashville
• Dec. Conference Call
• Special Membership Meeting, Dec. 2014
• Met with Chairs, Jan. 2015, FDSOA
• Feb. Conference Call
• March Conference Call
2015 Board Initiatives:
• Optimize Organizational Structure Of Board And Administrative Staff
• Explore Revenue Opportunities In Order To Provide Increased Services To Member Companies
• Effective Communication To Membership Through Effective Committees

2015 To Date:
• Transitioning Sonya Kelly into the Business Manager role.
• Study and Proposal to Board Structure
• Treasurer Duties Transition
• Final Arrangements for Fall 2016 Meeting
• New Leadership for NFPA and Committees
• Hill Day, Washington D.C.
• Version 2 and Reorder of Safety Guides
COMMITTEE REPORTS

STATISTICS COMMITTEEMike Schoenberger


Historic Vehicle Sales/BookedUS & Canada
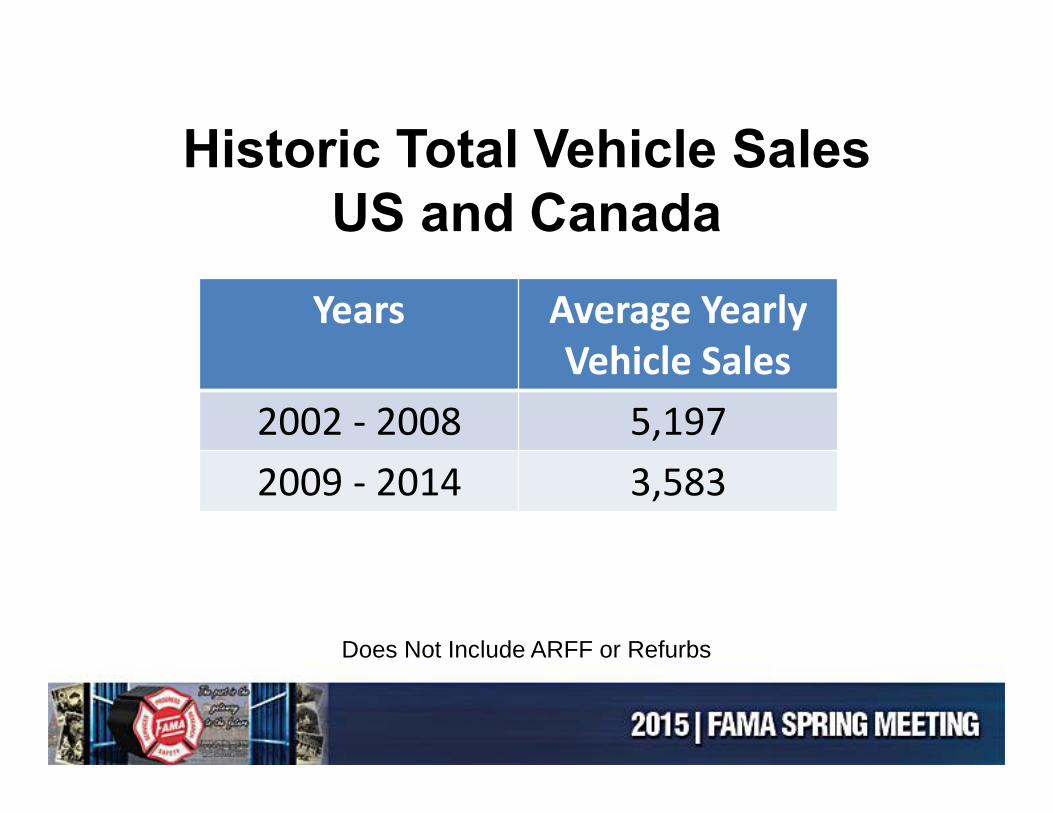
Years Average Yearly Vehicle Sales
2002 - 2008 5,1972009 - 2014 3,583
Historic Total Vehicle SalesUS and Canada
Does Not Include ARFF or Refurbs
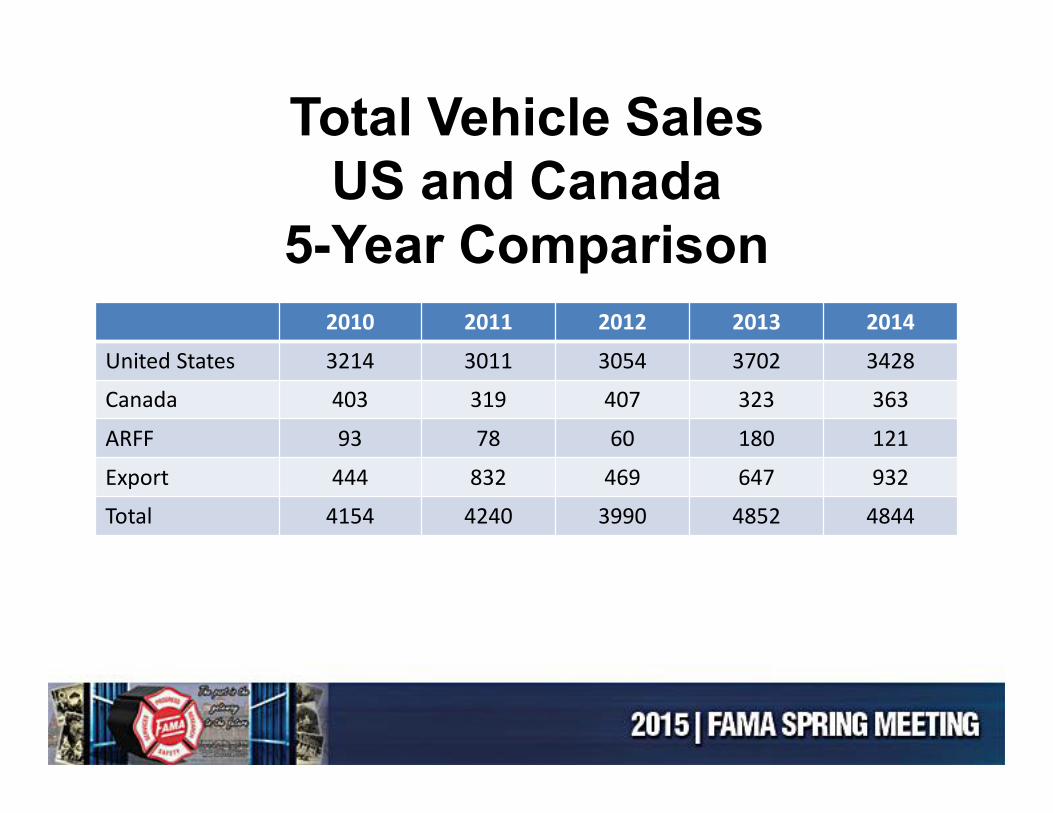
2010 2011 2012 2013 2014
United States 3214 3011 3054 3702 3428
Canada 403 319 407 323 363
ARFF 93 78 60 180 121
Export 444 832 469 647 932
Total 4154 4240 3990 4852 4844
Total Vehicle SalesUS and Canada
5-Year Comparison

2010 2011 2012 2013 2014
Pumpers 1801 1740 1953 2423 2228
Aerials 446 422 457 467 498
Tankers 590 439 454 405 438
Rescues 363 413 310 380 326
Brush/Mini 291 214 218 280 230
Total 3491 3228 3392 3955 3720
Vehicle Sales by ProductUS and Canada
5-Year Comparison

Product Commercial Custom Total Percent
Pumpers 485 2094 2579 19/81%
Aerials 3 526 529 1/99%
Tankers 429 50 479 90/10%
Rescues 459 160 619 74/26%
Total 1376 2830 4206 33/67%
Custom vs. Commercial Chassis2014 Year End

Year Commercial Custom
2002 47% 53%
2006 44% 56%
2010 42% 58%
2014 33% 67%
Custom vs. Commercial ChassisHistoric Comparison
All Vehicles

Product 3000 EVS 4000 EVS Total Percent
Pumpers 1389 705 2094 66/34%
Aerials 81 445 526 15/85%
Tankers 27 23 50 54/46%
Rescues 93 67 160 58/42%
Total 1590 1240 2830 56/44%
Custom ChassisMedium Duty vs. Heavy Duty
2014 Year End

Pumping Rate
Single Stage
Multi-Stage Total
750 GPM 95 31 1261000 GPM 283 10 2931250 GPM 803 54 8571500 GPM 1704 83 17871750 GPM 77 19 962000 GPM 279 81 3602250 GPM 15 1 162500 GPM 98 0 98
Total 3354 279 3633
2014Annual Shipments Report of
Fire Pump ManufacturersUS and CANADA ONLY
Report started in 2003

Year Yes No
2002 35% 65%
2006 46% 54%
2010 47% 53%
2014 64% 36%
Total Vehicles Sold With a Foam System

Statistics Reports Have Extensive & Valuable Data
• Sales by product models (12 aerial models)• Chassis type• Fire pump ratings and applications• Axles, single or tandem• Foam system types (6)• Vehicle average price by model

We Are Requesting Your Help
Please Submit Your Quarterly ReportsWithin 30 Days of Closing

Questions?
Thank You!Jeff Hupke & Jason NawrockiEDUCATION COMMITTEE

Education Committee Survey Reports
• Successful survey completion rates for 2014-2015 surveys!
o Industry Survey 1,416 completed the surveys
o Member Outlook Survey - 87 responded
• Special thanks to the industry publications and organizations help this year!• IAFC• NVFC• PennWell• Firehouse Magazine (Cygnus)• Fire News• Fire Fighting in Canada

FAMA / FEMSA Annual Industry Survey
Report for 2014
(Completed February 2015)

Geographic Location of Respondents
The majority of respondents are from the United States (97%); 3% are from Canada. Fifty states and all of the Canadian provinces are represented.
Pacific West–7%West–5%Central–9%Mid West–22%Mid South–11%Southeast–11%Mid Atlantic–21%North East–14%

Fire chief/commissioner 25%
Company officer 19%
Firefighter/driver/operator 19%
Assistant chief/deputy chief 14%
Training office/training chief/instructor 7%
Battalion chief/district 4%
EMT/paramedic 2%
Fire marshal inspector 2%
Chief/shift commander 1%
First responder 1%
Other 6%
Position of Respondents
Twenty-five percent of respondents are fire chiefs/commissioners; 19% are company officers.

Economy/budget cuts/gov funding/grants 38%Technology/digital options/electronic control 18%Gov regulations /OSHA/SCBA/NFPA 10%Cost/price/cash flow 10%Less municipal requests/cuts in municipal spending 10%International/exchange rates/imports 7%Competition/manufacturer mergers 5%Slow sales/up and down sales/military sales 5%Smaller 4%Consolidation/commodity pricing/group purchasing 4%Internet/online 4%Other 7%
1. Trends Affecting Industry
(What are the biggest trends currently affecting your industry?)• For 38% of the respondents, the “economy/budget cuts/gov. funding/grants” are
most affecting them• 18% indicated “technology/digital options/electronic control.”

Postpone planned purchases 35%No anticipated actions due to economic conditions 32%
Standard operating procedures will change 30%
Reduce number of planned purchases 27%Refurbish existing apparatus 27%Fees for service levied 13%Reduce staff 12%Cancel planned purchases 6%Forced to acquire non-NFPA compliant apparatus 6%Other 3%
Financial Overview
•Thirty-two percent of respondents believe equipment budgets will increase and 29% believe apparatus budgets will increase over the next two years. This continues a positive trend.
•Fifty-three percent of the respondents to the FAMA survey indicated that raising the overall awareness of funding sources would assist fire chiefs–this is similar to what was indicated in 2013, 2012 and 2011.

2. Anticipated Business Change
(How do you expect your business to change over next year/next three years?)
• Eighty-nine percent of respondents expect their business to increase next year
• Almost all (97%) expect their business to increase during the next three years.
• Twenty-nine percent of respondents anticipate their business growing over 20% during the next three years and 32% believe it will grow 11-20%.

23%
48%
29%
Staffing
25.7%
54.5%
19.8%
Equipment budgets
22.8%
59.4%
17.8%
Apparatus budgets
Trends Over Last Two Years
Increased
Stayed the same
Decreased
Staffing levels and apparatus budgets are similar to last year. Equipment budgets increased slightly.

Anticipated Trends Over Next Two Years(Over the next two years (2015 and 2016), - how do you expect your (equipment budget, apparatus budget) to change? (n=1,355)
Equipment Budget Apparatus Budget Staffing Budget
2014 (n=1.355
)
2013(n=1,322
)
2012(n=2,005
)
2011(n=225
)
2014 (n=1,355
2013(n=1,480
)
2012(n=2,005
)
2011(n=225
)
2014 (n=1,355
)
2013(n=1,480
)
Increase 32% 27% 24% 27% 29% 26% 22% 27% 31% 28%
Stay the same
55% 55% 58% 53% 57% 57% 61% 51% 57% 60%Decrease 14% 18% 19% 20% 15% 17% 18% 22% 12% 13%

AFG or SAFER Grant Application
(Has your department applied for a grant during the last two years?)
Almost three-fourths of respondents have applied for a grant for equipment and 34% for apparatus. (Note: n=1,192.)
There is an increase in the percentage of respondents applying for equipment grants.
2014(n=1,192)
2013(n=1,280)
Yes, for equipment 72% 66%Yes, for apparatus 34% 32%Yes, for other 16% 17%Yes, for staffing 15% 17%No 14% 17%Not sure 5% 8%

2014(n=1,192)
2013(n=1,280)
Yes, for equipment 24% 19%
Yes, for staffing 6% 8%
Yes, for other 4% 4%
Yes, for apparatus 5% 3%
No 61% 62%
Not sure 10% 11%
AFG or SAFER Grant Recipient
(Have you received an AFG or SAFER grant during the last two years?)
• Twenty-four percent of respondents received a grant for equipment during the last two years and 6% received a grant for staffing. (Note: n=1,192.)
• There is a slight increase in the percentage of respondents who have received a grant for equipment.

Staffing Levels 2014 (n=1,355)
2013(n=1,480)
2012 (n=1,935)
2011(n=225)
2010(n=81)
2009(n=1,072)
Increased 23% 23% 22% 21% 19% 27%
Stayed the same 48% 50% 53% 51% 54% 51%
Decreased 29% 27% 25% 27% 27% 23%
Equipment Budgets 2014 (n=1,355)
2013(n=1,322)
2012 (n=1,935)
2011(n=225)
2010(n=81)
2009(n=1,072)
Increased 26% 22% 20% 21% 16% 19%
Stayed the same 55% 53% 54% 48% 37% 44%
Decreased 20% 25% 26% 31% 47% 37%
Apparatus Budgets 2014 (n=1,355)
2013(n=1,480)
2012 (n=1,935)
2011(n=225)
2010(n=81)
2009(n=1,072)
Increased 23% 22% 20% 22% 19% 19%
Stayed the same 60% 58% 58% 54% 42% 45%
Decreased 18% 19% 23% 24% 40% 36%
Trends Over Last Two Years
(Over the last two years has your (staffing level, equipment budget, apparatus budget) increased, stayed the same or decreased?)
• Staffing levels and apparatus budgets are similar to last year’s amounts. Equipment budgets increased slightly from 2013 to 2014. (Note: n=1,355.)

Impact of Budget Restrictions(Have you changed your apparatus specifications/selection due to cost or budget restrictions?)
2014 (n=1,416)
2013 (n=1,537)
Yes, chose a different, new apparatus 27% 26%
Yes, replace with a used vehicle 13% 13%
Yes, other options 16% 17%
No 43% 44%
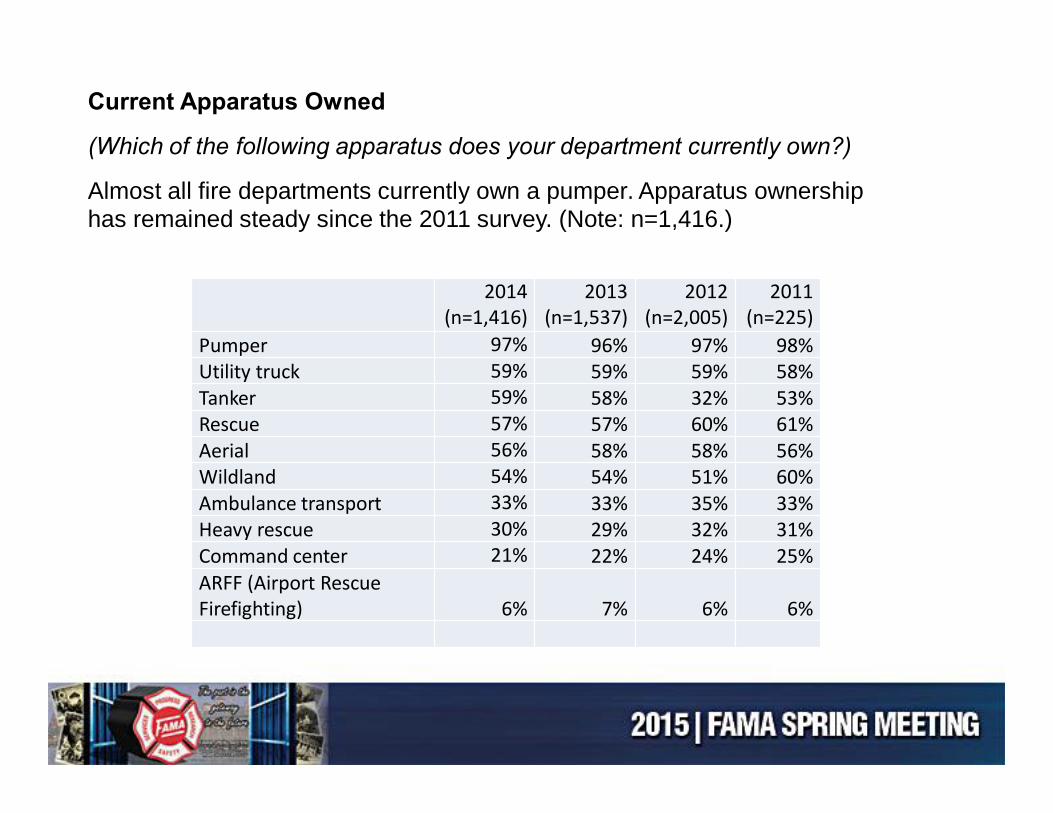
2014 (n=1,416)
2013(n=1,537)
2012(n=2,005)
2011(n=225)
Pumper 97% 96% 97% 98%Utility truck 59% 59% 59% 58%Tanker 59% 58% 32% 53%Rescue 57% 57% 60% 61%Aerial 56% 58% 58% 56%Wildland 54% 54% 51% 60%Ambulance transport 33% 33% 35% 33%Heavy rescue 30% 29% 32% 31%Command center 21% 22% 24% 25%ARFF (Airport Rescue Firefighting) 6% 7% 6% 6%
Current Apparatus Owned
(Which of the following apparatus does your department currently own?)
Almost all fire departments currently own a pumper. Apparatus ownership has remained steady since the 2011 survey. (Note: n=1,416.)

2014(n=1,416)
2013(n=1,537)
2012(n=2,005)
2011(n=225)
2010(n=81)
Yes 43% 40% 40% 56% 37%
No 34% 36% 33% 30% 32%
Not sure 27% 24% 28% 14% 31%
Anticipate Major Purchase
(Do you anticipate making a major purchase during the next fiscal year?)
• Slightly more than four out of ten fire departments anticipate making a major purchase during the next fiscal year; 34% indicated they would not be making a major purchase. (Note: n=1,537).)
2014 (n=565)
2013(n=441)
2012 (n=614)
2011 (n=225)
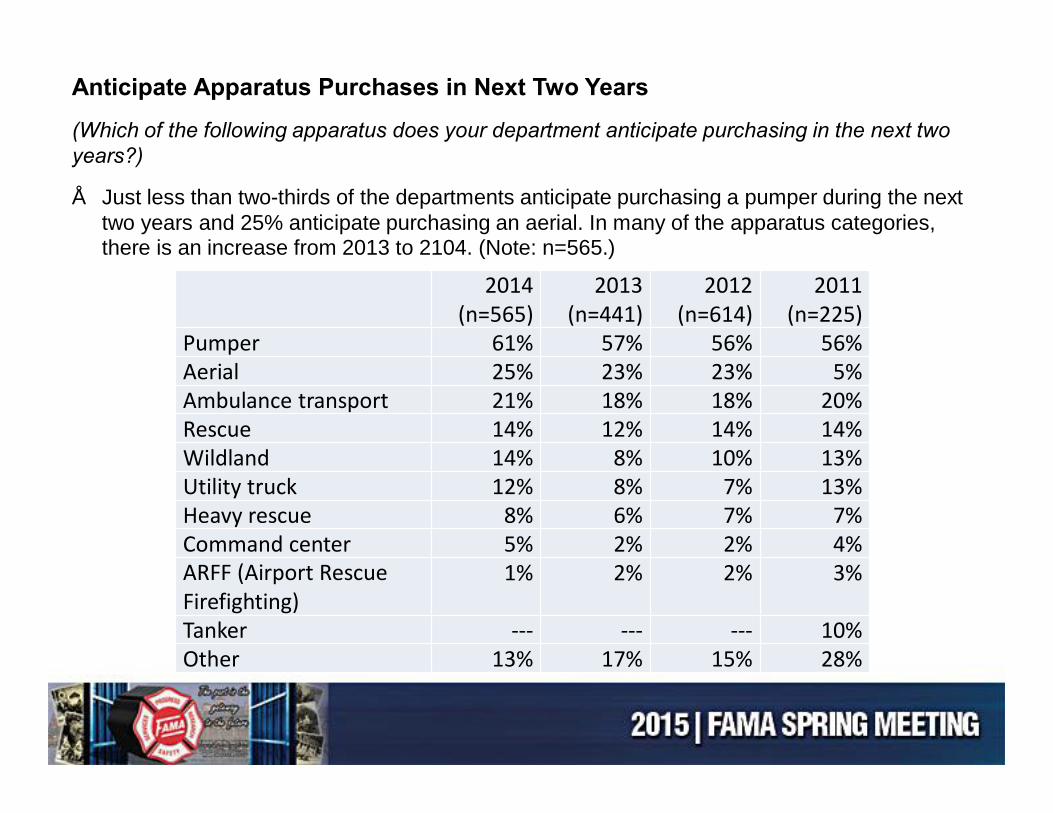
Pumper 61% 57% 56% 56%Aerial 25% 23% 23% 5%Ambulance transport 21% 18% 18% 20%Rescue 14% 12% 14% 14%Wildland 14% 8% 10% 13%Utility truck 12% 8% 7% 13%Heavy rescue 8% 6% 7% 7%Command center 5% 2% 2% 4%ARFF (Airport Rescue Firefighting)
1% 2% 2% 3%
Tanker --- --- --- 10%Other 13% 17% 15% 28%
Anticipate Apparatus Purchases in Next Two Years
(Which of the following apparatus does your department anticipate purchasing in the next two years?)
• Just less than two-thirds of the departments anticipate purchasing a pumper during the next two years and 25% anticipate purchasing an aerial. In many of the apparatus categories, there is an increase from 2013 to 2104. (Note: n=565.)

Importance of Various Factors in Apparatus/Equipment Purchases
(Please rate the importance of the factors below in purchasing apparatus and equipment.)
• Safety and quality are the two most important factors in choosing an apparatus and equipment.
• Fuel efficiency and use of alternative fuels are the least important factors in an apparatus/equipment purchase. Results mirror those of the 2013 and 2012 study. (Note: n=1,416.)
100%75%50%25%0%
Use of alternative fuels
Fuel efficiency
Product innovation
Custom cab/chassis
Interior cab size
Ease of maintenance/replacing parts
Ease of operation
Multi-function/multi-purpose use
Warranty
Price
Quality
Safety
4% 9%
19% 38%
22% 47%
28% 38%
31% 51%
46% 45%
54% 39%
55% 36%
60% 31%
66% 29%
83% 15%
84% 13%
Importance of Factors in Purchase
Very imp. Somewhat imp. Neither Not imp. Not at all imp.

Importance of Service Factors in Purchase
(How important are the following service/manufacturer attributes in the purchase of a new apparatus?)
Customer service is the most important service factor in the purchase of a new apparatus followed by after sales service. • Brand is the least important factor. (Note: n=1,535.)
100%75%50%25%0%
Brand
Speed of delivery
Ability to overnight parts
Relationship with sales person
Local dealer service
Responsiveness of sales team
Dealer reputation
Manufacturer reputation
After sales service
Customer service
15% 42% 32%
26% 49% 20%
35% 44% 15%
39% 42% 15%
46% 38% 11%
46% 42% 9%
53% 38% 6%
53% 38% 6%
62% 30% 6%
76% 20% 2%
Importance of Service Factors in Purchase
Very imp. Somewhat imp. Neither Not imp. Not at all imp.
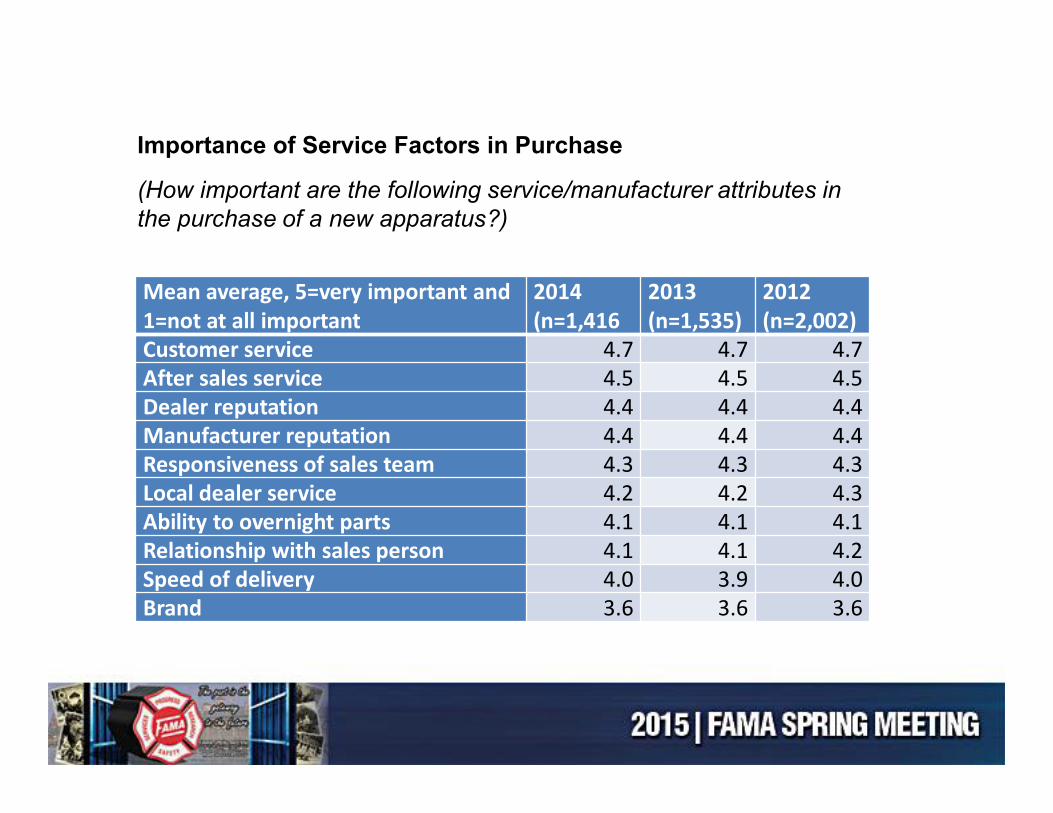
Mean average, 5=very important and 1=not at all important
2014(n=1,416
2013 (n=1,535)
2012 (n=2,002)
Customer service 4.7 4.7 4.7After sales service 4.5 4.5 4.5Dealer reputation 4.4 4.4 4.4Manufacturer reputation 4.4 4.4 4.4Responsiveness of sales team 4.3 4.3 4.3Local dealer service 4.2 4.2 4.3Ability to overnight parts 4.1 4.1 4.1Relationship with sales person 4.1 4.1 4.2Speed of delivery 4.0 3.9 4.0Brand 3.6 3.6 3.6
Importance of Service Factors in Purchase
(How important are the following service/manufacturer attributes in the purchase of a new apparatus?)

Future Trends(For each of the following, please indicate which way you believe each will change over the next five years.)
2014 (n=1,416) 2013
Tank size Pump capacity
Cab size
Tank size
Pump capacity
Cab size
Larger 33% 35% 36% 36% 38% 38%No change 58% 60% 48% 56% 58% 46%
Smaller 8% 5% 15% 9% 4% 16%
• Over the next five years, the majority of fire departments anticipate that there will not be a change to the tank size or pump capacity. Just over one-third of respondents expect all of those to increase in size. Results mirror those from 2013. (Note: n=1,416)
Patient Transport Capability
Yes–21% No–7% No change–72%Compartments
More–63% Less–8% No change–30%Chassis
Custom–49% Commercial–28% No change–23%

Importance of Various Sources
(Please rate the importance of each of the following when seeking information on apparatus and equipment.)
• Word-of-mouth/colleagues, manufacturer salesperson, and dealership salesperson are the most important sources of information.
• Social media and direct mail are the least important sources of information. (Note: n=1,191.)
100%75%50%25%0%
Direct mail
Social Media (Facebook/Twitter, etc.)
Trade Magazine advertisements
Ads on general fire industry web sites
Trade Magazine articles
General Fire industry web site articles
Search engines (Google, Bing, etc.)
Dealer website
Manufacturer website
Trade Shows/Industry Meetings
Dealership salesperson
Manufacturer salesperson
Word of mouth, colleagues
4% 29% 41%
5% 22% 43%
5% 40% 36%
5% 36% 41%
11% 56% 21%
13% 58% 22%
14% 45% 28%
18% 50% 24%
26% 56% 14%
29% 51% 14%
30% 47% 18%
30% 49% 16%
31% 53% 11%
Importance of Various Sources
Very imp. Somewhat imp. Neither Not imp. Not at all imp.

25%
23%22%
30%
2014
21.1%
26.1%19.9%
32.9%
2013
22.9%
20.7%22.1%
34.2%
2012
Data Recorder Usage
Yes
No
Not sure
Have not purchased
Usage of Data Recorder for Training
(If you have purchased a new fire apparatus since 2009, have you used the NFPA required vehicle data recorder & how often?)
• Twenty-five percent of all respondents are using the data recorder and 23% are not. Thirty percent have not purchased a new fire apparatus since 2009.
• There is a slight increase in data record usage from the 2013 study. (Note: n=1,355.)
30.1%
2.3%6.7%
31.3%
29.5%
2014
31%
5.6%6.3%31.7%
25.4%
2013
22.2%
5.4%7.3%
33.3%
31.7%
2012
Frequency of Using Data Recorder
Every time
75% of the time
50% of the time
Occasionally/rarely
Never
69%
31%
Consider Touchscreen Controls
Yes
No
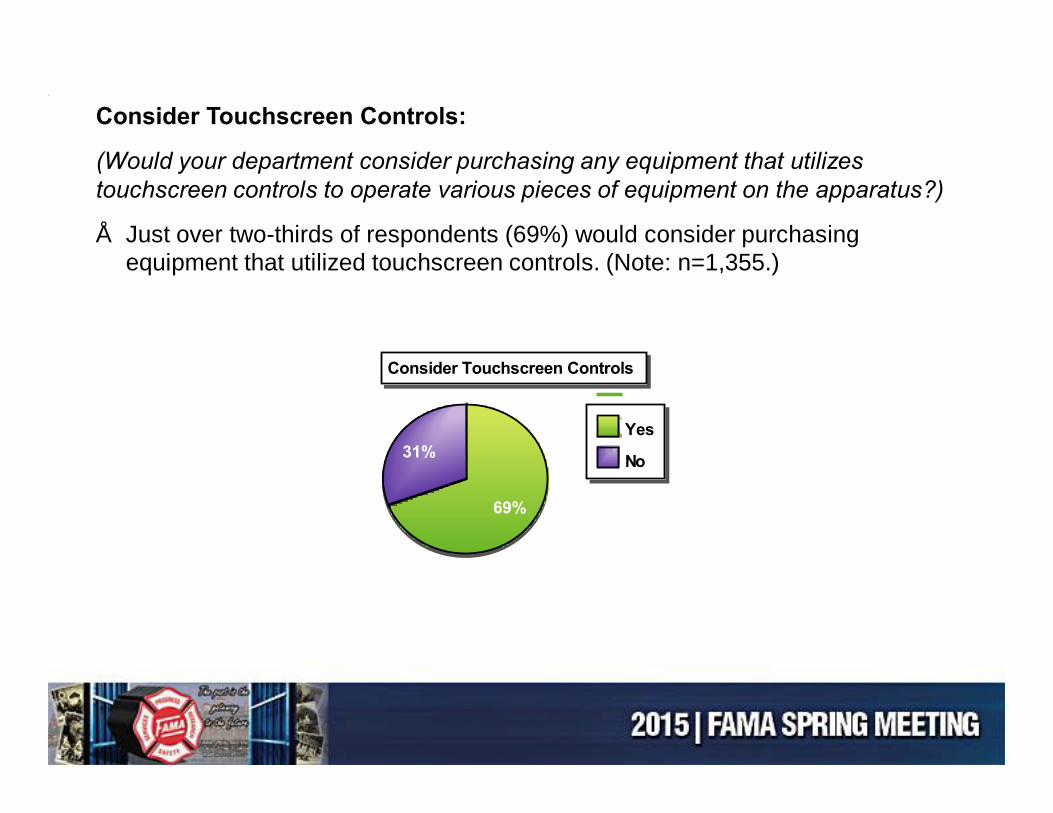
Consider Touchscreen Controls:
(Would your department consider purchasing any equipment that utilizes touchscreen controls to operate various pieces of equipment on the apparatus?)
• Just over two-thirds of respondents (69%) would consider purchasing equipment that utilized touchscreen controls. (Note: n=1,355.)
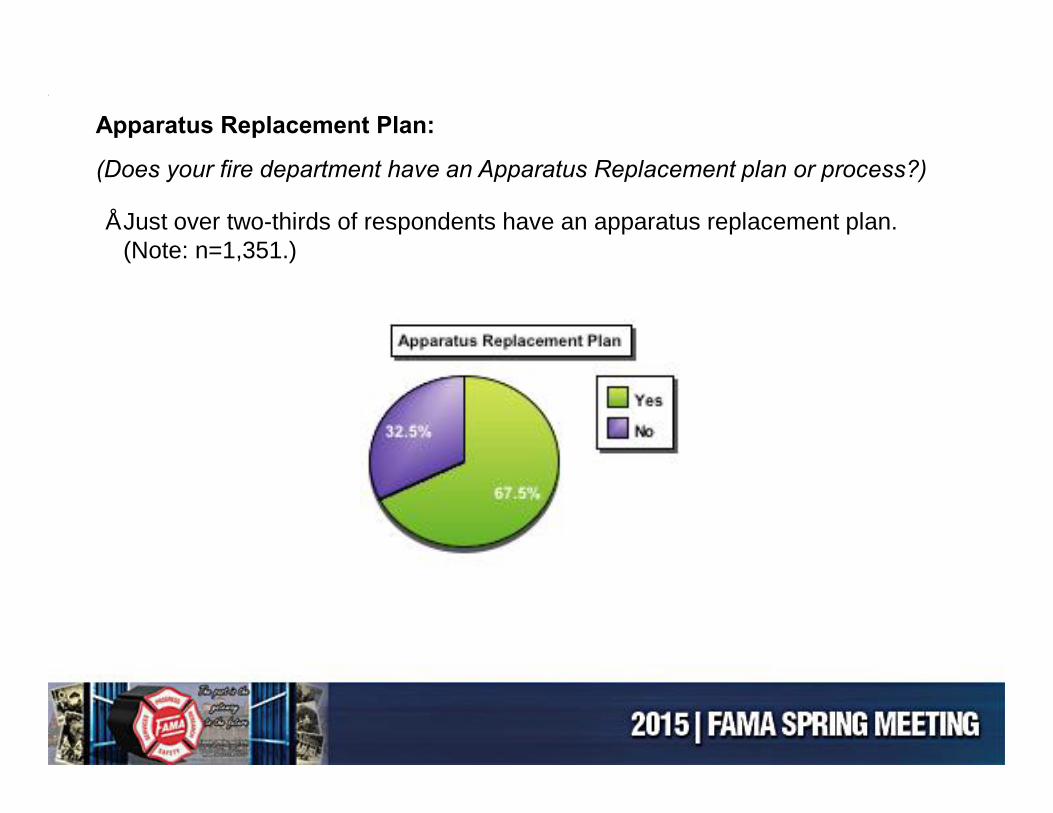
Apparatus Replacement Plan:
(Does your fire department have an Apparatus Replacement plan or process?)
• Just over two-thirds of respondents have an apparatus replacement plan. (Note: n=1,351.)
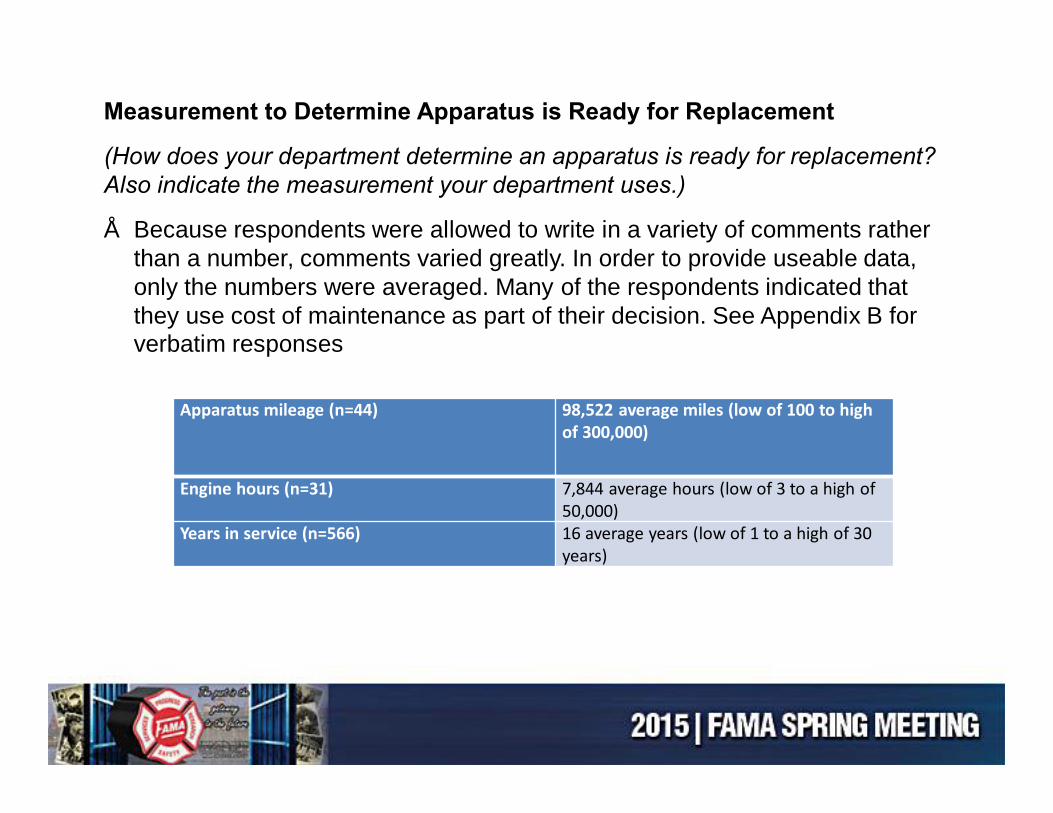
Apparatus mileage (n=44) 98,522 average miles (low of 100 to high of 300,000)
Engine hours (n=31) 7,844 average hours (low of 3 to a high of 50,000)
Years in service (n=566) 16 average years (low of 1 to a high of 30 years)
Measurement to Determine Apparatus is Ready for Replacement
(How does your department determine an apparatus is ready for replacement? Also indicate the measurement your department uses.)
• Because respondents were allowed to write in a variety of comments rather than a number, comments varied greatly. In order to provide useable data, only the numbers were averaged. Many of the respondents indicated that they use cost of maintenance as part of their decision. See Appendix B for verbatim responses

None/don't know/NA/no/doing fine 48%
Lower cost/funding/grants/price/financing/ lease/free 22%Quality control/maintenance 4%After sale service/work with us/listen/personable/customer service 4%Standardize//basic/simple/stock/mechanical 4%
Newer/better trucks/multi-functional/dependable/reliable 3%Needs assessment/options/consider our plans 3%
Clear communication/flexible/open/ responsive/interaction 2%Knowledgeable/meet/inspect/demos 2%Better design/cab size/basic/reach/storage/height 2%
Faster delivery/faster repairs/warranty/stand behind 2%Detailed/specifics on specs/manuals/info 2%Innovative/customized/technology 2%Other 4%
Suggestions to Better Meet Needs:
• Respondents were asked to provide suggestions for what an apparatus manufacturer can do to better meet their needs. These comments were then grouped into categories for easier analysis.

2014(n=1,192)
2013 (n=1,280)
2012 (n=1,604)
FDIC 38% 44% 44%Firehouse Expo 24% 20% 20%
International Association of Fire Chiefs 17% 19% 18%PA Fire Expo 15% 12% 13%Ontario Fire Chiefs Show 1% 2% 3%Other 40% 42% 41%
Industry Trade Shows Attended
(What industry trade shows do you attend at least once every three years?)
• About one out of four respondents attend FDIC at least once every three years; 24% attend Firehouse Expo. See Appendix B for complete list of other responses. (Note: n=1,192.)
• The percent of respondents attending the FDIC show has decreased slightly and those attending the Firehouse Expo have increased slightly from the previous two years.

FAMA / FEMSAAnnual Member Survey
Report for 2014
(Completed February 2015)

50%
25%
0%
49%
35%
12% 12% 6%
23%
Lines of Business
Apparatus components
Apparatus
SCBA
Protective clothing
Media
Other
Lines of Business
(What line(s) of business are you in?)
• Forty-nine percent of respondents sell apparatus components and 35% sell/manufacture apparatus. Twenty-three percent of respondents indicated “other” as their type of business.

Economy/budget cuts/gov funding/grants 38%Technology/digital options/electronic control 18%Gov regulations /OSHA/SCBA/NFPA 10%Cost/price/cash flow 10%Less municipal requests/cuts in municipal spending 10%International/exchange rates/imports 7%Competition/manufacturer mergers 5%Slow sales/up and down sales/military sales 5%Smaller 4%
Consolidation/commodity pricing/group purchasing 4%Internet/online 4%Other 7%
Trends Affecting Industry
(What are the biggest trends currently affecting your industry?)
• For 38% of the respondents, the “economy/budget cuts/gov. funding/grants” are most affecting them; 18% indicated “technology/digital options/electronic control.”

Anticipated Business Change
(How do you expect your business to change over next year/next three years?)
Anticipated change for 2015 Anticipated change for next three years
2014 (n=87)
2013(n=70)
2012 (n=136)
2011 (n=92)
2014 (n=87)
2013(n=70)
2012 (n=136
)
2011 (n=92
)Increase over 20% 7% 7% 6% 9% 29% 20% 18% 17%Increase 11–20% 28% 14% 11% 13% 32% 43% 31% 37%Increase 1–10% 54% 53% 47% 42% 36% 29% 41% 39%No change 8% 21% 29% 24% 1% 7% 6% 4%Decrease 1–10% 3% 3% 5% 12% 2% 0% 3% 2%Decrease 11–20% 0% 1% 2% 0% 0% 1% <1% 0%Decrease more than 20%
0%0% 0% 0%
0%0% 0% 0%
Results from the 2014 study are more positive than the 2013 and 2012 studies and show a positive trend overall.

Anticipated Product Lead Times, Capital Investment & Capacity Over Next Three Years
8.6%
27.2%
48.1%
16%
2014
6.3%
28.6%
46%
19%
2013
5.6%14.5%
50.8%
25.8%
2012
10%
16%
45%
28%
2011
Anticipated Capital Investment Level
Increase over 20%
Increase 11–20%
Increase 1–10%
No change
Decrease 1–10%
Decrease 11–20%
Decrease more than 20%
14.3%
49.2%
28.6%
7.9%
Current
31.7%
63.5%
4.8%
Three years
Factory Capacity
Full75% to 99%50% to 74%Less than 50%

Export Sales – Current state and three year expectations:
25.3%
29.9%29.9%
13.8%
2014
23.9%
20.9%43.3%
6%
2013
26.5%
25%36.8%
8.1%
2012
28%
32%
26%
13%
2011
Percent of Sales That are Exports
None
Less than 5%
5% to 25%
36% to 50%
More than 50%
Anticipated Export Growth 2014 2013 2012 2011Increase over 20% 13% 11% 9% 10%Increase 11–20% 22% 18% 26% 20%Increase 1–10% 47% 30% 46% 34%No change 17% 41% 17% 37%Decrease 1–10% 0% 0% 1% 0%Decrease 11–20% 2% 0% 0% 0%Decrease more than 20% 0% 0% 0% 0%

Employment:
What percentage of your business is emergency market related?
11.5%
14.9%
14.9%58.7%
2014
10%11.4%
15.7%62.9%
2013
Emergency Market Business
Less than 25%
26% to 50%
51% to 75%
More than 76%
How many of total employees at your company are involved in fire apparatusor equipment manufacturing?
49.4%33.3%
12.3%
2014
57.1%28.6%
9.5%
2013
65.3%21%
8.9%
2012
63%24%
9%
2011
Number of Employees Involved in Manufacturing
Fewer than 50 employees
50 to 199 employees
200 to 499 employees
500 to 999 employees
1,000 or more employees

Employment:What is your planned full-time employment for next year / next three years:
12.3%
59.3%
24.7%
Next year
24.7%
58%
9.9%
Next three years
Anticipated Full-time Employment
Increase over 20%
Increase 11–20%
Increase 1–10%
No change
Decrease 1–10%
Decrease 11–20%
Decrease more than 20%

Concern about Various Issues
(How concerned are you about each of the following issues? Please rate on a scale of 1 to 5, where 1 = does not impact my business and 5 = keeps me up at night.)
Keeps me up at night (5)
(4) (3) (2) Does not impact business (1)
Health care costs 37% 28% 19% 9% 6%Insurance costs 32% 28% 26% 9% 5%Overall economic conditions/general sales declines 23% 36% 30% 9% 3%Funding/budgets 19% 47% 18% 13% 3%Federal regulation 15% 32% 30% 14% 9%Competition 14% 31% 33% 19% 3%Federal taxes 10% 29% 28% 23% 9%Industry conditions 10% 41% 37% 9% 3%Product liability & litigation 8% 28% 32% 28% 4%State/local taxes 6% 31% 27% 27% 9%Energy costs 5% 31% 32% 27% 6%Cost of raw materials 5% 40% 40% 9% 6%Availability of credit 3% 14% 23% 37% 23%Housing market 1% 18% 32% 23% 26%
Overall, concerns have remained steady for the last three years.
2014(n=78
2013 (n=62)
2012(n=117)
Health care costs 3.8 3.9 4.0Insurance costs 3.7 3.8 3.8Funding/budgets 3.7 3.8 3.9Overall economic conditions/general sales declines 3.7 3.8 4.1Industry conditions 3.5 3.6 3.5Industry conditions 3.5 3.5 3.7Federal regulation 3.3 3.5 3.6Cost of raw materials 3.3 3.3 3.2Competition 3.3 3.3 3.2Federal taxes 3.1 3.2 3.6Liability 3.1 3.2 3.1State/local taxes 3.0 3.1 3.3Energy costs 3.0 3.0 3.2Housing market 2.5 2.8 2.6Availability of credit 2.4 2.4 2.5

Strategies Being Used During Economic Times
(Which of the following strategies are you using to get through these tough economic times?)
2014 (n=78)
2013(n=63)
2012(n=12
0)
2011 (n=92
)Becoming more diversified by entering new markets 60% 62% 67% 66%Becoming more specialized by focusing on niche markets 50% 38% 41% 41%Focusing on higher margins 41% 40% 43% 42%Focusing more on exports 38% 40% 44% 46%Becoming more diversified by entering new markets or focusing on several markets 36% 30% 41% 40%Developing partnerships/outsourcing 26% 22% 23% 24%Becoming a low cost provider 26% 19% 22% 18%Utilizing green technologies 4% 3% 4% 8%Other 9% 10% 9% 13%
2014 (n=78
)
2013 (n=63
)
2012(n=12
0)Becoming more specialized by focusing on niche markets 24% 19% 14%Becoming more diversified by entering new markets 22% 21% 33%Becoming more diversified by entering new markets or focusing on several markets 14% 13% 13%Focusing on higher margins 12% 15% 8%Developing partnerships/outsourcing 9% 11% 7%Focusing more on exports 9% 8% 16%Becoming a low cost provider 4% 7% 7%Utilizing green technologies 1% 2% 0%Other 5% 5% 3%
…and which have been theMost successful?

Effectiveness of Communication Strategies
(Please rate the effectiveness of each of the following methods used to market your products, where 1 = not at all effective and 5 = extremely effective.)
Mean Avg. 1=not at all effective, 5=extremely effective
2014 (n=74)
2013(n=58)
2012 (n=119)
2011 (n=92)
Website 4.4 4.1 4.1 3.8Trade Shows 4.2 3.9 3.8 Not askedFacebook 3.5 3.4 3.4 2.2Magazine ads 3.4 3.4 3.3 Not askedTwitter 2.6 2.4 2.6 2.3
Event marketing 49%
Digital media 30%
Print Media 22%
Investment Made in Core Areas(Rate the percentage of marketing investment you make in the following three core areas.)
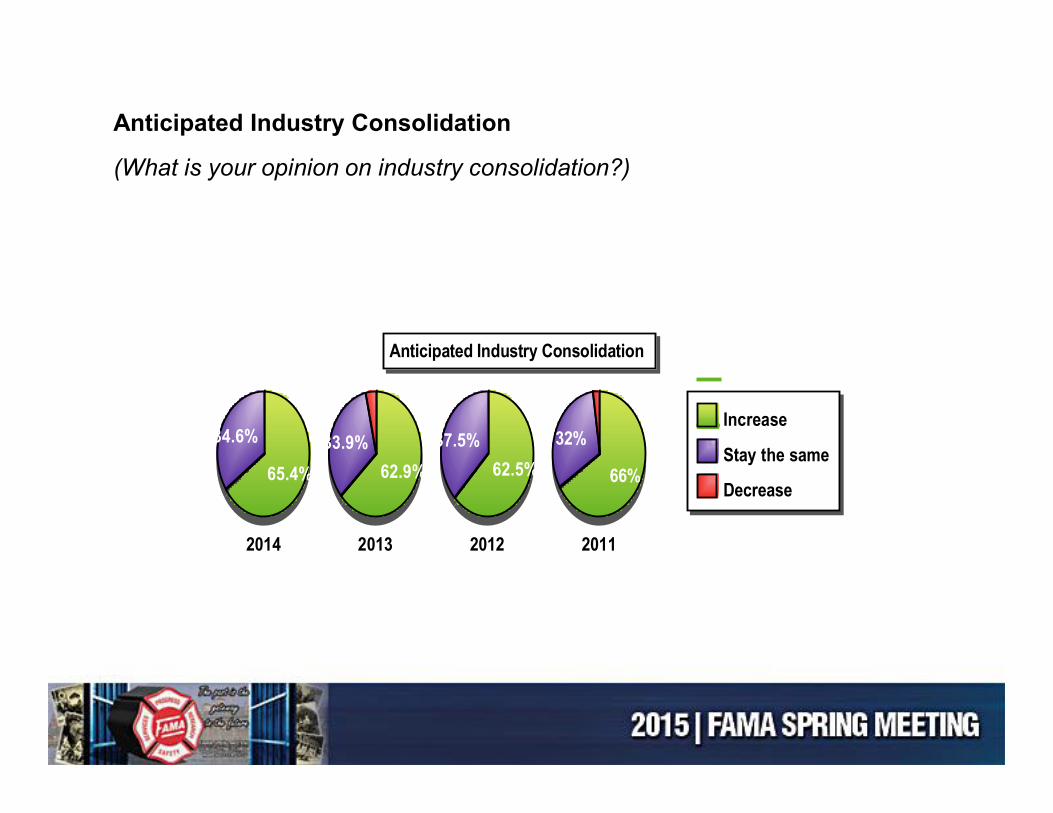
Anticipated Industry Consolidation
(What is your opinion on industry consolidation?)
65.4%
34.6%
2014
62.9%33.9%
2013
62.5%37.5%
2012
66%
32%
2011
Anticipated Industry Consolidation
Increase
Stay the same
Decrease

In Conclusion:
• The complete versions of these surveys will be provided on the website.
• Comments are appreciated, even after the fact. These surveys are improving and evolving.
• Please share the results with your business teams.
• Thank you for your time!

GOVERNMENTAL AFFAIRS COMMITTEELee Morris

GAC Members• Lee Morris, Co–Chair• Joe Mirabile, Vice-Chair• Corey Carlson• John W. McNulty,lll• Mike Natchipolsky• Craig Sharman• Cindy Morgan• David Russell
• John Granby, Co–Chair• Steve Stein• Ken Creese• Tim Dean• Rod Carringer (FEMSA
Liaison)• Steve Toren (FAMA
Liaison)

GAC Support
• Dave Gatton – Washington Consultant• Richard Boyes - CGC Liaison

2014 ActivityHill Day – Over 95 meetings, 35 attendees representing 26 companies participated (one company and one individual less than 2013, but more meetings)• Two key meetings with House leadership• Two meetings with House and Eight with Senate Full
Appropriations Committee members or Staff• Seven meetings with both House and Senate
Homeland Security Appropriations Subcommittee members or their staff
• Eight meetings with both House and Senate Homeland Security Committee members or their staff
• Other House and Senate members
2014 Activity (continued)
• We were successful in maintaining level funding for both AFG and SAFER grant programs ($340 million respectively)
• Home Days –New Jersey & Indiana home days on 6/21 & 6/28, Illinois home day on 6/8. Task Force Tips held July event. Lion’s participation in an Ohio press conference with Senator Sherrod Brown on 7/16.

2015 GoalsContinue to promote our core initiatives• Full Funding for AFG and SAFER grant
programs (Funding currently held up over President’s immigration initiatives)
• Full funding for the U.S. Fire Administration• Continued funding for the USAR program • State/Federal fire truck weight laws (FAMA)
Greater membership participation• Hill Day/CFSI Week• Home Days
2015 Goals (continued)
Reauthorization for Fire Grant programs – the present reauthorization bill has a sunset clause. If it is not reauthorized for the 2018 fiscal year, it will cease to exist
• The program will end the end of calendar year 2017 and the authorization will end the end of fiscal year 2017 (Sept 30, 2017)

GAC Activities for the MembersIt hasn’t changed, it’s a Relationship Business!!• Call your Congressional Offices and promote
AFG, SAFER, USFA and USAR funding initiatives
• Invite your congressional office to visit your facility (Home Days)
• Mark your calendar (April 15-16, 2015) for the GAC Hill Day and CFSI dinner
• Report back to the GAC about your activity

Tim VanFleetMEMBERSHIP COMMITTEE

Committee Members
• Bev Lowery – H.O. Bostrom – Co-Chair• Greg Geske – Waterous• Mike Bowman – Spartan Chassis• Rick Suche – Fort Garry• Jerry Merges – VisionMark Nameplate Co.• Karen Miller-Mellette • Steve Toren – Waterous (Board Liaison)

Committee Objectives

• CSI Emergency Apparatus• *Innovative Controls • *Precision Fire Apparatus • Warner Truck Bodies and
Accessories • Extend-O-Bed • Odyssey Specialty Vehicles • Fire Tec - Sam Massa• M. Tech - Wade Meith* Been Contacted by Chair ……….Help with others!!
Prospective Member Companies

New Member Company
• Weis Fire and Safety Equipment, Inc.

Non-Participation Survey Response
• Schedule Conflict • Value of Meeting Content – Time /
Resources• Not Into Networking and Social part of
Spring / Fall Meetings
** All Companies contacted will continue membership, participate in Tech. Com. Mtg.
MARKETING COMMITTEEAndrew Lingel

Marketing Members
• Andrew Lingel - Chair• Callan Jarabek - Co-Chair• Neil Chaney - Co-Chair• Curt Ignacio - Board Liaison
– 2 Open positions • Graphics skills or access to graphics/marketing
department preferred.

Marketing Activities• Safety Guide Sign for FRI• Safety Guide Mailer• Update FAMA Literature• FDSOA / FAMA PowerPoint slides• FDIC Sponsorship Banner and Ad• FDIC International/FAMA Showcase• Spring Meeting Graphics• Update FAMA Website

Marketing ActivitiesSafety Guide Sign at FRI

Marketing ActivitiesNew Top 10 Reasons to Join FAMA
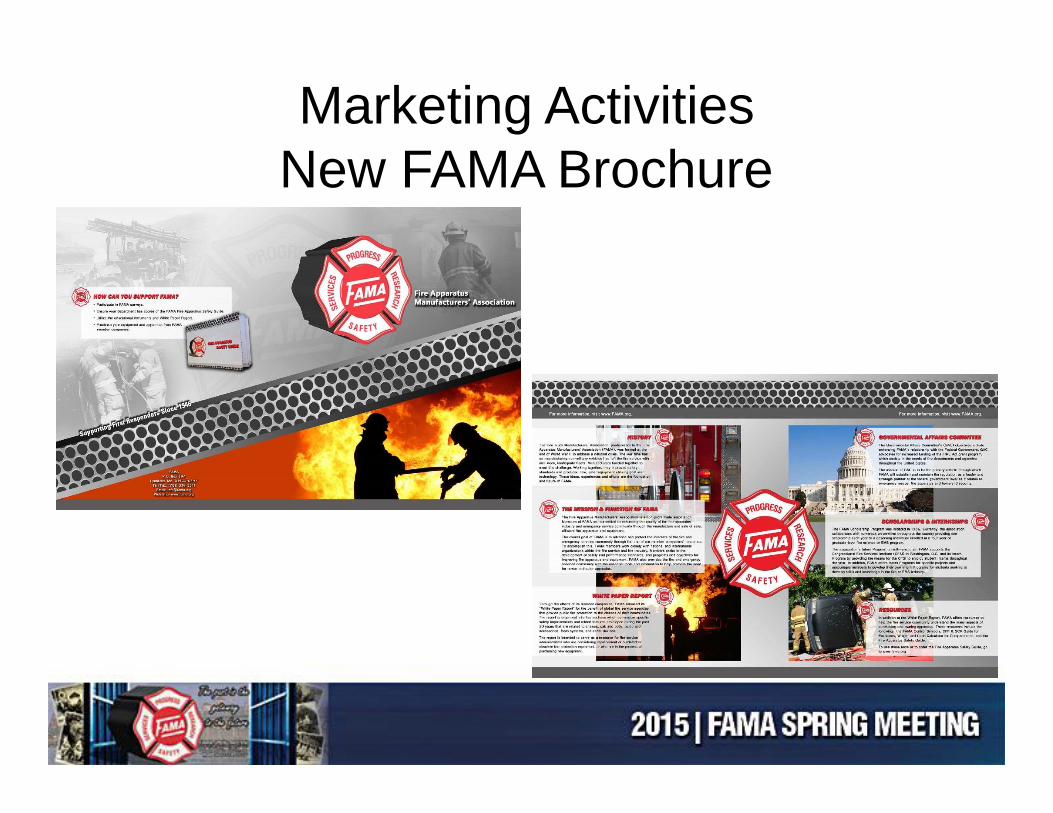
Marketing ActivitiesNew FAMA Brochure

Marketing ActivitiesFDIC Banner

Marketing ActivitiesSpring Meeting Graphics

Marketing ActivitiesUpdate FAMA Website
• Scope of Work was developed • Pricing to redesign current website received• Received quotes from 4 companies on
building a new website from the ground up• Reviewing with the Board for next actions

FDIC Event - Thursday, April 23rd at 10:30 a.m.– Featured Speaker - Chief Ricky Riley– Review of New Products - Chris McLoone

New Product Submissions due –Mon., March 30th

HONORARY MEMBERSHIP
JIM CARROLLWhat World Class Innovators Do
That Others Don’t Do
Recommended

![SK MKEK-REV FATWA COVID 19 - WordPress.comdptdokhukes.files.wordpress.com/2020/04/sk-mkek-rev-fatwa-covid-19.pdfSURAT KEPUTUSAN MAJELIS KEHORMATAN ETIK KEDOKTERAN Nomor : 016/PB/K.MKEK]04/2020](https://img.pdfslide.net/doc/110x75/5f7f6f0431bb4741a1698fc8/sk-mkek-rev-fatwa-covid-19-surat-keputusan-majelis-kehormatan-etik-kedokteran.jpg)


![[RMF] Fama](https://img.pdfslide.net/doc/110x75/577cd5381a28ab9e789a3215/rmf-fama.jpg)