Green Water Credits
Farmers’ adoption of soil
and water conservation:
potential role of payments
for watershed services

Farmers’ adoption
of soil and water conservation:
potential role of
payments for watershed services
Green Water Credits Report 5
October 2007
Ministry of Agriculture
University of Nairobi
Ministry of Water and Irrigation
International Institute for Environment and Development
Stockholm Environment Institute
International Fund for Agricultural Development
Swiss Agency for Development and Cooperation
Agricultural Economics Research Institute
ISRIC - World Soil Information

Green Water Credits is a mechanism to pay rural people for specified land and soil management activities that determine all fresh water resources at source. These activities are presently unrecognized and un-rewarded. This proof-of-concept program is supported by the International Fund for Agricultural Development (IFAD) and the Swiss Agency for Development and Cooperation (SDC) Series editor: David Dent Authors:
Ina Porras Maryanne Grieg-Gran Gerdien Meijerink
Contributions from:
Davies Onduru Evelyn Nyu Fred Muchena
Citation: Porras I, M Grieg-Gran and G Meijerink 2007 Farmers’ adoption of soil and
water conservation: potential role of payments for watershed services. Green Water Credits Report 5, ISRIC – World Soil Information, Wageningen
© 2007 ISRIC – World Soil Information Contact:
Sjef Kauffman ISRIC – World Soil Information PO Box 353 6700 AJ Wageningen The Netherlands E-mail: [email protected]

Potential role of payments for watershed services i
MAIN MESSAGES
The need for soil and water conservation is well known; there is a wealth of experience in the farming community, research and extension agencies have significant capacity, but there is an implementation deficit. Erosion of arable land is widespread and maintenance of existing conservation structures is poor. Downstream, siltation of reservoirs is severe, water supplies are inadequate and, increasingly, unreliable. Farmers are aware of their private benefits from soil and water conservation but see this as a means to an end - crop production and income generation - not an end in itself. They demand tangible benefits from the land, labour and capital involved in conservation activities. Data on economic benefits of soil and water conservation are equivocal. Farm-gate prices and price fluctuations affect the likelihood of adoption of technologies; costs often outweigh benefits. The benefits are highly specific; yields may be increased by, for instance, green manure, but may be depressed by agro-forestry. On the other hand, the costs of constructing and maintaining structures like terraces can be substantial. Poverty is a severe constraint on good land husbandry and the ability of downstream water users to pay for it. The Upper Tana is occupied by many smallholders who are usually poor, with limited access to markets and low prices for their produce. Poverty drives a preference for short-term benefits; in economic terms it means high real discount rates, at which the cost conservation measures outweighs the benefits to the farmers. Linked to poverty is the need for diversification of livelihoods. Solutions are needed to balance poverty alleviation and investment in sustainable management. There is also poverty in cities; if payments from downstream users mean higher water charges, these could further disadvantage already-vulnerable groups; many slum-dwellers already pay high charges for water purchased from vendors. Further incentives such as Green Water Credits, which are payments for watershed services, are essential if there is to be wider uptake of conservation practices. This does not necessarily mean cash for conservation. Rewards may include secure access to markets, revolving funds or favourable terms of credit, farm implements, and community benefits such as better roads, schools or clinics, and capacity building. There are advantages and disadvantages to all of these methods. Some are gender-biased and it is difficult to enforce on-going compliance with contracts in the case of up-front in-kind benefits. Implementation of Green Water Credits depends on cooperation among farmers; good examples are already in operation. Control of soil erosion depends mutually reinforcing practices on neighbouring plots, and the tasks of construction and maintenance of mechanical structures is often too great for one individual or family. Also, it will be easier to arrange and monitor contracts with groups of neighbours rather than with every individual; groups can be self-policing in matters of compliance. Farmers’ groups linked through business objectives have already established cooperative arrangements, usually related to marketing which demands quality control, group cooperation and implementation of sanctions – because non-compliance affects the quality of the produce and the competitiveness
Green Water Credits Report 5

ii Farmer's adoption of soil and water conservation
of the group. Groups have systems are in place for collecting and administering payments, decision-making, monitoring, and dealing with breaches of rules – they can serve as models for Green Water Management groups. National institutions that carry out research, capacity-building, and training in soil and water conservation have valuable experience and capacity. However, at present they are uncoordinated and do not necessarily reach the most vulnerable farmers. Green Water Credits is predicated on the delivery of better water availability and reduced flooding, soil erosion and siltation. Given the variability of rainfall in the area, the mechanism must be able to disentangle the risk of non-delivery due to failure of rains, from farmers’ failure to deliver watershed management services. Main studies and results
Sources of information Results
Modelling and livelihoods study Theoretical models to understand linkages between private land use and externalities in the Tana Basin
• Labour costs are a big part of the costs of SWC • The costs of constructing and maintaining
mechanical structures can be substantial • Several studies have found that the private costs
often outweigh the private benefits – in the absence of rewards such as Green Water Credits
Models build a supply-response curve for environmental services (in this case increased water supply) linked to biophysical model results
Focus groups Objective: exploration of farmers’ views on soil and water conservation, markets, organisational capacity and institutional settings Sample: Eight focus groups with rain-fed farmers and irrigators in 4 agro-ecological zones
• Knowledge and capacity in soil and water conservation has been built up over decades but there is much room for improvement; mechanical structures are poorly maintained
• Farmers are aware of the potential, private, on-site benefits from conservation but demand tangible benefits for the substantial inputs required
• Many farmers participate in groups and associations (marketing, benevolent, cultural, etc.)
• To ensure farmers’ ownership, the Green water Credits process should take into account their feasible suggestions about incentives and modes of payment
• Most farmers would prefer contracts of 3-5 years, the longer period being more preferred
• A group contract is preferred which, in turn, enforces the contract obligations upon its members
A clear channel is required for periodic monitoring and feedback on progress of activities
Green Water Credits Report 5

Potential role of payments for watershed services iii
Sources of information Results
Choice experiment Objective: to determine the policy components or attributes that would make Green Water Credits more attractive to farmers Sample size: 128 farmers in 4 agro-ecological areas
Variables that tend to increase attractiveness by > 10%: • Incentives, specifically:
- In-kind incentives - Tied cash - Access to revolving funds
• Ministry of Agriculture in charge of management • Medium- to long-term benefits Variables that tend to decrease attractiveness by> 10%: • Number of labour-days required • Contract length (years) Variables with low predicted effect (<10%) • Private managing institution • No of household members working regularly on the
farm • Current soil and water conservation efforts • Access to external markets Threshold level
Green Water Credits Report 5

iv Farmers' adoption of soil and water conservation
Contents
MAIN MESSAGES..........................................................................................i Acronyms and abbreviations .....................................................................vi 1 Introduction........................................................................................ 1
1.1 Green Water Credits..................................................................... 1 1.2 Methodology ............................................................................... 2
1.2.1 Target areas.................................................................... 2 1.2.2 Data collection................................................................. 2
2 The Upper Tana catchment.................................................................. 7 2.1 Biophysical description ................................................................. 8 2.2 Socio-Economic characteristics .....................................................10 2.3 Economic uses of water ...............................................................11
3 Soil and water conservation in the Tana Basin ...................................13 4 Payments for environmental services in Kenya ..................................15
4.1 Payments for environmental services.............................................15 4.2 Opportunities and challenges for Kenya..........................................15
5 Potential providers of water management services............................17 5.1 The Upper Tana Catchment ..........................................................17
5.1.1 Land holding and land use ................................................17 5.1.2 Soil and water conservation ..............................................20
5.2 Costs and benefits of SWC ...........................................................22 5.2.1 Cost of conservation measures..........................................22 5.2.2 Upstream economic benefits of Green Water Credits.............24
5.3 Modelling the supply of green and blue water..................................25 5.4 Livelihoods study ........................................................................29
5.4.1 Methodology...................................................................29 5.5 Results from the focus groups.......................................................30
5.5.1 Perception of obstacles and opportunities ...........................30 5.5.2 Recommendations...........................................................31
6 Likelihood of adoption green water management ..............................33 6.1 Theoretical framework .................................................................33
6.1.1 Introducing the situation: what are the SWC practices proposed? ......................................................................34
6.1.2 Attributes and levels: what factors may influence farmers’ participation?..................................................................35
6.1.3 Expected benefits at farm level .........................................38 6.1.4 The potential additional labour cost....................................38 6.1.5 Cooperation between farmers and threshold levels...............39 6.1.6 Institutional setting .........................................................39 6.1.7 Incentives ......................................................................39 6.1.8 Current soil and water conservation practices.....................40 6.1.9 Access to markets ...........................................................40 6.1.10 Experimental design and choice sets ..................................41 6.1.11 Estimation procedure.......................................................42
Green Water Credits Report 5

Potential role of payments for watershed services v
6.2 Results from pilot implementation .................................................42 6.2.1 Sample selection.............................................................42 6.2.2 Farmers assessment of current situation.............................43 6.2.3 Model application ............................................................44
6.3 Main outcomes from choice experiment..........................................49 7 Implications for Green Water Credits .................................................51
7.1 Potential providers and livelihoods.................................................51 7.2 Constraints ................................................................................52
7.2.1 Poverty..........................................................................52 7.2.2 Measurement..................................................................52
7.3 Conclusions................................................................................53 8 References .........................................................................................55 APPENDIX – Choice experiment questionnaire .........................................58 Figures
Figure 1 Farmers’ group discussion in Maragua, October 2006 ........................ 3 Figure 2: Tana Basin, location ..................................................................... 7 Figure 3: Tana Basin, agro-ecological zones .................................................10 Figure 4: Upper Tana, land use ..................................................................18 Figure 5: Fodder production in Kirinyaga, Maragua, Nyandarua, Nyeri and Thika19 Figure 6: Green water management by farm, 2007 .......................................21 Figure 7: Support for green water management, by AEZ................................21 Figure 8: Implementation of green water management without payments
(initial situation) .........................................................................27 Figure 9: Supply curve for Green Water Credits ............................................28 Figure 10: Describing the scenario to the farmer ............................................34 Figure 11: Current level of SWC, by AEZ .......................................................40 Figure 12: Perceived access to markets.........................................................41 Figure 13: Farmers’ assessment of the current and alternative situations ...........43 Figure 14: Impact on adoption ratings by type and level of incentive .................48 Tables
Table 1: Focus groups............................................................................... 4 Table 2: Choice experiment interviews ........................................................ 5 Table 3: Tana Basin, agro-ecological zones .................................................. 9 Table 4: Tana Basin, household characteristics ............................................11 Table 5: Evolution of soil and water conservation in the Tana Basin................13 Table 6: Arable land holdings by gender .....................................................17 Table 7: Green water maanagement in Mbeere District, 1996-2001................20 Table 8: Adoption of green water management (households) by District..........20 Table 9: Area loss and labour requirement for conservation measures, Ethiopia22 Table 10: Estimated costs of area loss and labour for conservation measures in
the Upper Tana (US$/ha).............................................................23 Table 11: Incremental financial benefits of green water management
(Ksh/ha/yr)................................................................................25 Table 12: Obstacles and opportunities for SWC .............................................30
Green Water Credits Report 5

vi Farmers' adoption of soil and water conservation
Table 13: SWC management packages.........................................................35 Table 14: Variables likely to affect adoption of SWC.......................................37 Table 15: Availability of household labour.....................................................38 Table 16: Choice experiment interviews .......................................................43 Table 17: Results of ratings regression, model 1............................................44 Table 18: Results from ratings estimation, model 2........................................46 Table 19: Model differences across agro-ecological zones................................47 Table 20: Summary of results from upstream studies.....................................51 Acronyms and abbreviations
CGMS Continuous Growth Monitoring System
FAO Food and Agricultural Organisation of the UN
IFAD International Fund for Agricultural Development, Italy
IIED International Institute for Environment and Development, UK
ISRIC ISRIC – World Soil Information
IWRM Integrated Water Resource Management
KARI Kenya Agricultural Research Institute
KenGen Kenya Electricity Generating Company
LEI Agricultural Economic Research Institute, Netherlands
MDGs Millennium Development Goals
MONQI Monitoring for Quality Improvement Methodology
MoA Ministry of Agriculture, Kenya
MWI Ministry of Water and Irrigation, Kenya
NWC Nairobi Water Company
PES Payment for Environmental Services
SDC Swiss Development Cooperation
SEI Stockholm Environment Institute
SWAT Soil and Water Assessment Tool
TRPNR Tana River Primate National Reserve
Wageningen UR Wageningen University and Research Centre
WRMA Water Resources Management Authority, Kenya
Green Water Credits Report 5

Potential role of payments for watershed services 1
1 Introduction
1.1 Green Water Credits
Green water is the water held in soil and available to plants. It is the largest fresh water resource but can only be used in situ, by plants. Blue water is groundwater and stream flow that can be tapped for use elsewhere and which, also, provides environmental services and supports wetland and aquatic environments. Green Water Credits is a mechanism for payments to rural people in return for specified water management activities that determine the supply of fresh water at source. As a shorthand, we shall call these activities green water management. This embraces the well-established technical concept of soil and water conservation but looks at the issue from the point of farmers’ field activities. Farmers’ water management activities are presently unrecognised and un-rewarded. Green Water Credits will enable them to better manage land and water resources to improve their own resilience to economic, social and environmental change by asset building (stable soils, improved local water resources, shortening the hunger gap, diversified rural incomes); to deliver enhanced blue water flows downstream and to reduce the hazards of floods and landslips; and, thereby, improve food security, water security and public health. Green Water Credits is not a poverty alleviation scheme but poor rural people will benefit directly. The objectives of the proof-of-concept are:
a) Assess the feasibility of Green Water Credits as a practical mechanism to improve water resources and diversify rural livelihoods
c) Develop a business case d) Identify potential areas for the application e) Engage international and regional partners, including the private sector, and
leverage funding. This reports deals with the engagement of potential providers of water management services - the farmers. It is the result of an extensive literature review, ten focus groups conducted by ETC East Africa in the Upper Tana, a choice experiment designed to explore the farmers’ trade-offs, and a preliminary analysis of potential on-site benefits from Green Water Credits. Farmers’ willingness to participate in a Green Water Credits scheme is judged by historical mapping of incentives for soil and water conservation, the social and economic profile of potential suppliers, estimation of willingness to participate, and identification of barriers to participation. Assessment of local benefits and costs of implementation of specific soil and water conservation practices takes account of crop yields, the potential improvement of local water supplies, the reduction of environmental hazards, and the costs to the farmer of required adaptations of the farming system.
Green Water Credits Report 5

2 Farmers' adoption of soil and water conservation
This report includes:
1. Institutional and stakeholder mapping: Assessment of the existing institutions working in the area, and their potential for managing and monitoring Green Water Credits
2. Profile of service providers: • Livelihoods in critical areas of the catchment • Within these communities, who are the poor and why are they poor?
3. Upstream costs and benefits of green water management • Costs and benefits of the desired land use changes from the farmer’s
viewpoint • Incremental cost of green water management • Benefits, in terms of farm production, household water use, and
mitigation of environmental hazards
4. Farmer willingness to participate in a Green Water Credits scheme: • Choice experiment • Likelihood of participation under different design options
5. Proposed design for most effective supplier participation
1.2 Methodology
1.2.1 Target areas
The target areas are identified in Report 3 (Kauffman and others 2007) by hydrological studies according to the potential for improvement of green water resources, regulation of stream flow, arrest of soil erosion, and mitigation of reservoir siltation.
1.2.2 Data collection
The focus areas are:
a. Population, livelihood strategies and assets, income distribution, education, sources of household income;
b. Farm production: crops, technologies, yields, access to markets, intermediaries, prices;
c. Experience of incentives for soil and water conservation and current activity;
d. Barriers to green water management. Data are derived from review of existing sources, focus groups, and a choice experiment survey of farmers’ preferences. Eight focus groups were conducted with farmers (both those practising irrigation and those not) to explore:
• Organisational capacity: A key component of successful implementation. Focus groups embraced existing farmers’ or water-users’ groups that may
Green Water Credits Report 5

Potential role of payments for watershed services 3
serve as models for local organisational and management units for Green Water Credits.
• Groups’ economic aims: Adoption of green water management is linked to the perceived economic incentives compared to the time, energy and resources required. Groups discussed their economic orientation, and how they feel that green water management will help or hinders their enterprise. Participants also discussed their limitations and strengths as a group. Data were collected on type of production, farming areas, household size, costs of implementing green water management, and income - to be cross-referenced with previous surveys.
• Experience of green water management: Existing activities, assistance, pros and cons.
• Relevance of existing governmental and non-governmental organisations: Perceived capacity and gaps of local institutions in promoting green water management.
Information from the focus groups was used in the design of a choice experiment to examine likelihood of adoption of green water management (Table 2). The questionnaire is presented as Appendix. Interviews also gathered first-hand information about:
• Households - composition, labour availability, education levels, manage-ment of cash flows
• Group membership - links within the social network, access to informal sources of credit, group bank accounts
• Markets • Current green water management activities
Figure 1: Farmers’ group discussion in Maragua, October 2006
Photo, Ina Porras
Green Water Credits Report 5

4 Farmers' adoption of soil and water conservation
Table 1: Focus groups
Rain-fed groups Location AEZ* Group composition(1)
Year of inception
Group activities
Rwika FDA Gachoka, Mbeere
IV Sunflower/maize (transitional zone)
25 committee members (44 women); covers 10 Villages
2005 Revolving credit fund Tree nursery
Mwituria Mamunyi
Mwea, Kirinyaga
III Rice/cotton/ coffee/maize (semi-humid)
18 (72) 2003 Tree nursery Crop trials Cash cropping
Kiunjugi Dairy Self-help Group
Mathira, Nyeri
I Tea/dairy (humid)
107 (60) 2004 Milk collection and marketing
Kawawa Multipurpose Self-help Group
Weithaga, Muranga
II Main coffee zone (sub-humid)
26 (38) 2004 Vegetable and tree propagation Marketing of produce Loans - revolving fund Tree planting
Mariya-ini Reafforestartion Youth Group
Murarandia, Muranga
I Tea/dairy (humid)
25 (24) 2001 (registered in 2006)
Tree nursery Revolving credit fund Tree planting
Irrigators
Rupingazi Youth Group
Gachoka, Mbeere
IV Sunflower/maize (transitional zone)
23 (15 active; 4 women)
1998 Tree nursery Planting water melon/maize Revolving credit fund
Kimbimbi Youth Horticultural Farmers
Mwea, Kirinyaga
III Rice/cotton/ coffee/maize (semi-humid)
77 (39) 2003 (registered 2004)
Merry-go-round Loans Football tournaments Horticulture
Sagana Irrigation Water Project
Sagana, Nyeri
II Main coffee zone (sub-humid)
450 (3) 1979/80; 1994(2)
Horticulture Irrigation and domestic water supply
Gakaki Small- Scale Irrigation Project
Murarandia, Muranga
II Main coffee zone (sub-humid)
340 (14) 1994 Irrigation water supply Fund raising (monthly contributions
* Source: Jaetzold and Schmidt 1983
Green Water Credits Report 5

Potential role of payments for watershed services 5
Green Water Credits Report 5
gs
Read
in
Dis
tric
t D
ivis
ion
Loca
tion
C
lust
er
Sam
ple
si
ze
Vari
ab
les
Fir
st
(wit
hin
Clu
ster)
Seco
nd
(c
en
tre o
fC
lust
er)
Th
ird
(w
ith
in C
lust
er)
Ele
vation (
m)
2048
1997
1958
Latitu
de
S 0
0 2
9’ 3
5.6
’’ S 0
0 2
9’ 2
3Tet
u
Then
gen
ge
Kari
guin
i 16
Longitude
E 3
60 5
3’ 57.8
’’ E 3
60 5
7’ 1
Ele
vation (
m)
1948
1896
Latitu
de
S 0
0 2
5’ 3
01.4
’’ S 0
0 2
4’ 57
Nye
ri
(AEZ I
)
Mat
hir
a
Mag
uta
Kia
much
eru
16
Longitude
E 3
70 0
6’ 58.4
’’ E 3
70 0
7’ 2
Ele
vation (
m)
1776
1793
Latitu
de
S 0
0 3
5’ 4
0.0
’’ S 0
0 35’ 4
0M
athio
ya
Kam
achar
ia
Ihig
a Ria
Iguri
16
Longitude
E 3
70 0
0’ 38.7
’’ E 3
70 0
0’ 2
Ele
vation (
m)
1706
1700
Latitu
de
S 0
0 4
2’ 1
1.7
’’ S 0
0 4
2’ 1
2
Mura
nga
(AEZ I
I)
Kah
uro
W
eith
aga
Ruku
i W
angu
16
Longitude
E 3
70 0
0’ 17.7
’’ E 3
70 0
0’ 0
Ele
vation (
m)
1275
1237
Latitu
de
S 0
o 3
5’ 30.4
” S 0
o 35’ 10
Mw
ea
Muri
nduku
M
ugam
ba
Ciu
ra
16
Longitude
E 3
70 2
8’ 34.6
” E 3
70 2
8’ 4
Kir
inya
ga
(AEZ I
II)
.7’’
S 0
0 2
9’ 1
1.6
’’ 4.7
’’ E 3
60 5
4’ 27.3
’’ 1882
.8’’
S 0
0 2
5’ 2
9.4
’’ 2.2
’’ E 3
70 0
7’ 19.7
’’ 1774
.9’’
S 0
0 35’ 2
7.9
’’ 5.7
’’ E 3
70 0
0’ 12.4
’’ 1700
.3’’
S 0
0 4
2’ 1
3.4
’’ 9.3
’’ E 3
70 0
0’ 01.8
’’ 1245
.7”
S 0
o 35’ 02.4
” 5.5
” E 3
70 2
8’ 49.5
” Ele
vation (
m)
1252
1235
1245
Latitu
de
S 0
o 3
6’ 03.9
” S 0
o 37’ 09.7
” S 0
o 37’ 24.5
” M
wea
Kan
gai
Kom
buin
i 16
Longitude
E 3
70 1
7’ 41.4
” E 3
70 1
8’ 03.0
” E 3
70 1
8’ 05.3
” Ele
vation (
m)
791
782
776
Latitu
de
S 0
o 4
3’ 33.5
” S 0
o 4
3’ 29.8
” S 0
o 4
4’ 42.5
” M
utu
obar
e Kat
har
i 16
Longitude
E 3
70 5
2’ 24.4
” E 3
70 5
2’ 39.4
” E 3
70 5
2’ 58.9
” Ele
vation (
m)
1177
1182
1224
Latitu
de
S 0
o 3
9’ 05.7
” S 0
o 3
8’ 38.2
” S 0
o 3
8’ 32.8
”
Mbeer
e
(AEZ I
V)
Gach
oka
Mbita
Kam
bita
16
Longitude
E 3
70 3
5’ 49.8
” E 3
70 3
5’ 21.5
” E 3
70 3
6’ 11.5
”
Tab
le 2
: C
ho
ice e
xp
eri
men
t in
terv
iew
s


Potential role of payments for watershed services 7
2 The Upper Tana catchment
The Tana basin (Figure 2) encompasses 100 000 km2, and supports more than 4 million people. The whole basin covers some part of 21 districts in Central, Eastern, North Eastern, Rift valley, and Coast provinces.
Figure 2: Tana Basin, location
Landsat true-colour image: well-vegetated, high-rainfall areas of Mt Kenya and the Aberdares Range appear green; catchment boundary overlaid in light blue, streams and reservoirs in blue
The upper Tana basin has good rainfall and many farmers, and there is significant potential for improved downstream water benefits. Water scarcity is an emerging issue.There is rich experience of green water management that can inform farmers’ participation in Green Water Credits. There are important potential downstream water users who are in a position to pay for water management services over the long term: hydro-electric power, Nairobi municipal water supply, and irrigators. Current reforms of the water sector in Kenya offer a window of opportunity for the introduction of Green Water Credits.
Green Water Credits Report 5

8 Farmers' adoption of soil and water conservation
2.1 Biophysical description
The Tana and its tributaries rises in the highlands of the Aberdares Range and Mount Kenya in central Kenya, The Tana River then runs through the eastern part of the country to enter the Indian Ocean; it is the only perennial stream in this dry region. Its a mean annual flow of 178 m3/sec constitutes more than a quarter of the total mean discharge from all the country’s rivers. The Mt Kenya catchment produces 49 per cent of the discharge of the Tana, the Aberdares 44 per cent, and 7 per cent comes from other catchments. The flow is highest in April-June and November-December and lowest in March and October. Flow has been declining; this may be attributed in part to land degradation in the upper catchment, associated with cropping, resulting in increased run-off at the expense of river base flow. Land degradation is a decline in the land’s actual or potential productivity. By any standards, land degradation is serious problem in the Central Highlands of Kenya: Bai and Dent (2006) present long-term satellite measurements of key biomass indicators of land degradation. Soil erosion, in particular, threatens food security and the sustainability of farming, and contributes substantially to rural poverty. It is associated with declining per caput availability of cultivable land without technologies for intensification of land use, which drive rural people to extend farming into marginal land and the remaining forest and woodland. It is also associated with increased runoff and declining river base flows because the regulating capacity of the soil is lost. Green Water Credits Report 3 (Kauffman and others 2007) demonstrates that improved land use and management can significantly reduce soil erosion and reservoir siltation and, at the same time, improve river base flow. Agro-ecological zones, defined according to rainfall, temperature, evaporation, soil properties and length of growing period, encompass regions of different potential for crop and water production (Table 3 and Figure 3).
Green Water Credits Report 5

Potential role of payments for watershed services 9
Table 3: Tana Basin, agro-ecological zones Agro-Ecological Zone
Altitude, m above sea level
Mean annual temp, 0C
Mean annual rainfall, mm
Land use potential
Tropical Alpine (TA)
National Park
Upper Highlands (UH)
UH0 Forest reserve
UH1 Sheep and dairy
UH2 2440 – 2740 13.7 –11.7 950 – 1600 Pyrethrum-wheat
UH3 2230 – 2900 14.9 – 10.5 700 – 1000 Upper wheat-barley
UH4 Upper Highland ranching
Lower Highlands (LH)
LH1 1830 – 2200 17.4 – 14.9 1700 – 2600 Tea-dairy
LH2 1890 – 2130 17.0 – 15.4 1200 – 1800 Wheat, maize, pyrethrum
LH3 2070 – 2220 15.8 – 15.0 700 – 1400 Wheat-maize, barley
LH4 2070 – 2210 15.8 – 15.1 600 – 850 Cattle-sheep-barley
LH5 Lower Highland ranching
Upper Midlands (UM)
UM1 1520 – 1800 19.2 – 17.6 1500 – 2400 Coffee-tea
UM2 1280 – 1680 20.6 – 18.2 1500 – 2400 Coffee
UM3 1280 – 1520 20.6 – 19.2 1400 – 2200 Marginal coffee
UM4 1520 – 1770 19.3 – 18.0 750 – 1600 Sunflower-maize
UM5 1520 – 1770 19.3 – 18.0 500 – 1100 Livestock-sorghum
UM6 Upper Midland ranching
Lower Midlands (LM)
LM3 910 – 1280 22.9 – 20.6 1000 – 1600 Cotton
LM4 760 - 1220 23.7 – 21.0 800 – 1200 Marginal cotton
LM5 700 – 910 24.0 – 22.9 600 – 900 Livestock-millet
LM6 Lower Midland ranching
Inland Lowlands (IL)
IL5 610 – 700 24.7 – 24.1 500 – 850 Lowland livestock-millet
IL6 Lowland ranching
Green Water Credits Report 5

10 Farmers' adoption of soil and water conservation
Figure 3: Tana Basin, agro-ecological zones
Source - Jaetzold and Schmidt 1983
2.2 Socio-Economic characteristics
The Tana basin supports more than four million people within the catchment while many more depend on services linked to the Tana. The Upper Tana is one of the most densely populated regions of Kenya; livelihoods depend mainly on farm- related activities. Extreme climatic events bring loss of life and property, damage to infrastructure, disruption of power supply, water shortage, famine and migration. The World Health Organization reported on January 10th, 2006, that the short rains are failing and drought are becoming more frequent and prolonged. This year, 17 districts across the country are experiencing severe food shortage. For the Tana basin, the Global Acute Malnutrition index is 19 per cent and the Severe Acute Malnutrition index is 3 per cent (WHO 2006). Selected household characteristics collected from 86 households in Nyeri, Embu, and Mbeere (Table 4) show that, overall, family earnings are low; the standard deviation shows large variations between the districts and the households. Many household members depend on farming, while farm sizes are small. The dependency on off-farm income is low on average, but varies greatly between households.
Green Water Credits Report 5

Potential role of payments for watershed services 11
Table 4: Tana Basin, household characteristics Source: MONQI
Mean Standard deviation
Number of household members 8.8 3.6
Total area per household (ha) 1.8 1.3
Dependency on off-farm income (%) 8.7 15.8
Family earnings (Ksh/yr) 103 057 85 116
Family earnings (US$/yr) 1 874 1 548
Market share (%) 12.8 44.5
2.3 Economic uses of water
The Tana is a vital water resource: for hydro-electric power, supply of water to municipalities including Nairobi, and provision of water for irrigation. For Nairobi, supply is pumped from a distance of 50 km. Following water-source expansion projects in 1984 and 1995, the available supply was increased to a design capacity of 520 000 m3/day by 2002 but during the 2006 dry season maximum supply was not more than 456 000 m3/day, compared with a daily demand of 570 000 m3 (MG Ngari, Nairobi Water, pers. comm. 2007) The supply problem is aggravated by siltation of the reservoirs and the poor state of the distribution system with losses of about 50 per cent from leaks and illegal connection (Foster and Tuinhof 2005).
Green Water Credits Report 5


Potential role of payments for watershed services 13
3 Soil and water conservation in the Tana Basin
Before independence in 1962, soil and water conservation was implemented through strict regulations, prohibitions and coercive communal work; it became linked to colonialism and was largely abandoned after independence. Sustained effort has gone into its re-establishment, in particular with a long-running National Soil and Water Conservation Program. There has been success on individual farms, especially with simpler activities, like agronomic measures, but less with terraces -which require continual maintenance and communal effort. At different stages, government agencies, international donors, NGOs and Church-based groups have been involved. Table 5: Evolution of soil and water conservation in the Tana Basin
Source: ETC (2007)
Period Detail
Pre-independence (1930-1962)
Local chiefs, headmen and technical assistants enforced soil and water conservation through prohibitions and compulsory community work
After independence (post 1962)
Farmers associated conservation with colonialism; it was rejected
1970-1980 National Soil and Water Conservation Programme , assisted by the Swedish International Development Agency offers various incentives, including subsidies and tools, to promote individual activities. Upon withdrawal of subsidies, many farmers stopped maintaining terraces - partly because of the costs, partly because the project was not effectively owned by the farmers. Subsequently, subsidies (including tools) were perceived to work against private initiative.
1980s Conservation promoted by NGOs and Church-based groups (especially after the drought of 1984). Many of these projects emphasised individual farm approaches. Many projects were phased out in the 1990s.
1987-1997 Catchment Approach established, concentrating extension efforts in one catchment per year. PLAN International distributed coupons for work in the 1990s to build terraces. Maintenance of these structures was poor due to labour constraints.
Post-2000 NSWCP ended in 2000. Current activities under the National Agriculture and Livestock Extension Program (NALEP) employ a shifting focus approach similar to that implemented in the previous period. Farmers consulted during the focus groups reckon that SWC efforts diminished over the past 20 years because: Enforcement of rules affecting steep slopes and riverbanks (Agriculture, Basic Land Usage Rules, 1965) has decayed; reduced visits from agricultural officers led to less farmers training and monitoring SWC. Increased use of forests for firewood and tea curing/processing, alongside with reduced planting efforts, has led to reduction in tree cover
Green Water Credits Report 5

14 Farmers' adoption of soil and water conservation
Structural works have been encouraged by various incentives (subsidies, food coupons, and access to equipment) but most activities ceased when these incentives were withdrawn. Lessons drawn by the focus groups include:
- Using tools as incentive was counter-productive since farmers did not carry out conservation activities unless they received them; - Subsidies for nursery establishment were counter-productive in promoting private initiative; - Indirect, intangible incentives, such as competitions and regular workshops for critical assessment were perceived as positive encouragement.
Communal work is uncommon in the Upper Tana, even for activities that would clearly benefit from cooperation, such as cut-off drains across farm boundaries and water harvesting; however, it is common practice in parts of Machakos , which has a long history of soil conservation work parties or mwethya groups.
Green Water Credits Report 5

Potential role of payments for watershed services 15
Green Water Credits Report 5
4 Payments for environmental services in Kenya
4.1 Payments for environmental services
Environmental services are the goods and services that are provided by nature. These are a public good and market failure is common; governments have usually taken up the responsibility for maintaining them. However, during recent years, there has been serious interest in establishing market-based mechanisms as a more effective and efficient way to maintain these services and to integrate economic growth and ecological integrity. These mechanisms may also address poverty reduction goals. Payments for environmental services (PES) link the demand for the services (e.g. improved water flows, storage of carbon) with the supply (e.g. forest conservation by local communities, water management by upstream resource managers). By establishing a market mechanism, the suppliers of the services can be rewarded. Green Water Credits is a PES, specifically for land and soil management activities that determine the supply of fresh water at source. Direct payments other rewards will enable better management and, therefore, less runoff, flooding, and siltation of reservoirs, and more groundwater recharge and stream base flow. At the same time, Green Water Credits will diversify rural incomes and help communities to adapt to economic and environmental change.
Source: Wunder (2005) and Porras and others (2007).
Payments for Environmental Services are: 1) Voluntary transactions on the providers’ side (otherwise it will be regulation); 2) Between a minimum of one buyer and one-seller; 3) Conditional on previously-agreed land use that is expected to provide an environmental service. Additionally, it is expected that they will: 4) Promote private sector payment for the provision of (previously considered) public goods; 5) Represent new sources of funding for watershed conservation; and 6) Provide some level of competition, which determines the extent to which individual stakeholders can influence prices. Competitiveness is associated with the number of participants; when there are fewer participants, individuals have more power and the market is less competitive. Effective participation is measured by the existence of barriers to participation.
4.2 Opportunities and challenges for Kenya
PES approaches are increasingly popular, especially in Latin America, and there are now several proposals for East Africa. Green Water Credits Report 2, Lessons learned from payments for environmental services (Grieg-Gran and others 2006) highlights the following opportunities and challenges:
• Green Water Credits addresses the short-term focus of the poverty-reduction by immediate, on-going payments for improved land and water management. However, the inclusion of many smallholders means

16 Farmers' adoption of soil and water conservation
relatively high transaction costs, reducing the amounts that can be paid to service providers.
Coordination across institutions and disciplines will require establishment of a multi-stakeholder, multidisciplinary steering group and clear lines of legal and institutional authority.
A payment system will have to take account of the multiple and overlapping sources of formal and traditional authority for land and water management. Strong customary institutions or well-functioning community development committees may assist the introduction of PES by providing a means for banding farmers together for negotiation, monitoring and channelling payments.
Success basin-wide will depend on institutional ability to reach smallholders across the catchment. Capacity gaps in existing water management institutions mean that, in the first instance, Green Water Credits will be easier to operate at a local level, or where there are other institutions such as an NGO or a community-based organisation that can provide support or facilitation.
The prevalence of shared water river basins in Africa does not rule out the introduction of Green Water Credits but makes some of the most significant river basins in the continent more challenging.
Consultations at the October 2006 Green Water Credits Workshop in Nairobi suggest that the concept is broadly welcome. Several related proposals have already emerged that aim at promoting green water management through direct incentives. For instance, the Water Management Board proposes a discount of 5 per cent from water charges to farmers implementing best practice. This would benefit big irrigators but a smallholder paying Ksh 350/year for irrigation (about US$5) would save about the amount paid by a Maragua householder for a jerry can of water from a street vendor (Ksh 15); however, the principle is already accepted. Trust funds, financed by water charges, already exist to support various projects, such as sanitation; however, if a trust fund were to be established for Green Water Credits, it should not be seen as a social welfare kitty. It was argued that use of the terms “credits” or “payment” may raise expectations that the project may not be able to fulfil; further, that the expectation of payments creates dependency – so the proof-of-concept should develop a range of options including in-kind compensations. On the one hand, it was argued that green water management is for the farmers’ own benefit and their own responsibility. On the other hand, there is clearly a need to tip the financial balance in favour of green water management. Previous incentives were only partly successful - maintenance fell away rapidly when incentives were withdrawn. Information from the focus groups shows, beyond the simplistic explanation of lack of ownership and interest, that farmers are hard-pressed by short-term issues> Family labour is limited and hired for cash, and there are hardly opportunities for the smallholder to afford even seeds to maintain vegetative measures. The following sections examine the continuing constraints on adoption of green water management, how effectively these limitations can be addressed, and compare the costs of adoption to the resources available.
Green Water Credits Report 5

Potential role of payments for watershed services 17
5 Potential providers of water management services
5.1 The Upper Tana Catchment
The Tana Basin straddles the Central, Eastern and Coast provinces of Kenya but most of the population is in the Upper Catchment, between Thika in the south, Nyeri in the north, and Embu in the West.
5.1.1 Land holding and land use
Arable area per person is highest in the dryer zones of Tharaka (3.9 acres per household) and Mbeere (3.1 acres per household) districts. Pressure on land is highest in the most productive areas: in the tea zone, family holdings range from less than ½ acre to 4 acres; in the coffee zone ½ acre to 5 acres (IFAD 2002).
Land is inherited and subdivided between sons each successive generation. Women do not inherit land, only by men. Unmarried women may be allocated a plot for a dwelling but they may not have access to the rest of the land. Even when widows become household heads, they still cannot inherit. Women own land only by purchase. This has implications for operation of Green Water Credits; contracts with land owners would exclude women. Table 6 shows land holdings according to gender in different districts. In Kirinyaga District, male-headed households had access to much bigger pieces of land (own and operated) compared with female-headed households - a ratio of 3 to 1; in Nyandarua District, male-headed households had twice as much family land as female-headed households; however, for Maragua, Nyeri and Thika districts ratios by gender are similar. Table 6: Arable land holdings by gender
Source - CKDAP 2006
Mean own land, acres (min., max.) Mean land operated (min., max.)District
Male-headed Female-headed Male-headed Female-headed
Kirinyaga 2.9 (0.1, 15) 1 (0.5-1.5) 2.0 (0.1,8) 0 (0,0)
Maragua 1.8 (1,11) 1.9 (1, 8) 1.2 (1,5) 1.1 (1,3)
Nyandarua 5.0 (1,84) 2.8 (3,3) 2.8 (1,42) 1.5 (2,2)
Nyeri 2.8 (1,60) 2.4 (2,3) 1.1 (0.1,8) 1.1 (0.3,8)
Thika 2.9 (0.2,18) 3.3 (0.3,10) 1.4 (0.01,7.5) 1.2 (0.01,3)
Green Water Credits Report 5

18 Farmers' adoption of soil and water conservation
The main land use types in the upper catchment are coffee, tea (both in the highlands), and rain-fed cereals (mainly maize) intercropped with beans and vegetables (Figure 4).
Figure 4: Upper Tana, land use
Source: FAO 2000 - East Africa Module Land Cover Tea: In the highland tea zone, three quarters of the land is under tea, managed by the Kenya Tea Development Agency which also operates the tea factories. Tea is perennial; under good management, it covers the ground entirely, except during establishment and after pruning, and so provides good soil protection. Other crops in the tea zone include a variety of horticultural crops, maize, beans, bananas, and fruit trees. Coffee: In the coffee zone, low prices in recent years have driven a shift to alternative cash crops such as French beans, tomatoes, and Asian vegetables. Farmers also maintain the subsistence part of the mix - maize, beans, potatoes and sweet potatoes intercropped with coffee. Other plots are abandoned with poor coffee bushes which cannot legally be grubbed up because coffee is a scheduled crop. This provision of the Agricultural Act is not strictly adhered to but farmers may persevere with an established crop, hoping for better times. Lower cotton/tobacco zone: The major land use systems in this zone are irrigated cropping, rain-fed cropping, and livestock production under rangeland conditions. There are three major irrigation schemes: Mitunguu, in Meru; Nguuru Gakirwe, in Tharaka; and Mwea, in Kirinyaga and Mbeere; as well as irrigated flower production in the lower Rupingazi/Kapingazi Rivers. Most of the land within Mitunguu and Nguuru Gakirwe irrigation schemes is under high-value horticultural crops. Bananas, maize and beans are grown both under irrigation and rain-fed conditions.
Green Water Credits Report 5

Potential role of payments for watershed services 19
Mwea Irrigation Scheme is a major rice producer. Small-scale irrigation includes group horticultural schemes, group food schemes, and individual smallholder enterprises (Onduru and others 2002). In other regions, the proportion of farmers practising irrigation is lower: 13, 12 and 6 per cent, respectively, in Nyandarua, Thika, and Nyeri. Irrigators mainly use bucket application; flooding is mainly practised in rice fields of Kirinyaga, overhead sprinklers only in Nyandarua and Nyeri (CKDAP 2006). Subsistence rain-fed cropping in the lower zones yields poor returns. Areas like Marimanti, lower Chuka and Mbeere are occupied by agro-pastoralists, with very limited opportunities for rain-fed cropping of maize, beans, sorghum, millets, cowpeas, and green gram; the last three are also grown for cash. Forage: Livestock are an important asset. Aggregated data for forage crops are shown in Figure 5. Napier grass is grown by more than half of the respondents, Rhodes Grass by one fifth. Forage crops can be used in green water management as grass strips, fodder trees and banana on such strips, and cover crops.
53%
15%0%
0%
1%
11%
20%
Nappier Sweet potatoes LucerneDesmodium Fodder trees Banana pseudo-stems All grasses
Figure 5: Fodder production in Kirinyaga, Maragua, Nyandarua, Nyeri and Thika
Source: CKDAP 2006
Green Water Credits Report 5

20 Farmers' adoption of soil and water conservation
5.1.2 Soil and water conservation
Many farmers practise green water management; many, up to one third, do not; amngst those that do, grass strips is the most popular method. Table 7
Table 7: Green water maanagement in Mbeere District, 1996-2001
illustrates the trends in implementation of specific practices in Mbeere District. Activity also varies between Districts (Table 8).
Source: Siakago Agricultural Office, cited by Onduru and others 2002 Practice 1996 1997 1998 1999 2000 2001
No. farms conserved 1 130 970 1 790 609 1 482 2 200
Fanya juu (m) 39 800 21 000 53 600 86 440 322 760 82 297
Stone lines/bunds (m) 10 500 5 000 15 200 15 730 45 260 6 160
Grass strips (m) 18 000 9 620 47 000 41 900 2 236 5 560
Trash lines (m) 23 500 27 600 17 300 27 900 173 650 196 000
Cut-off drains (m) 5 080 8 400 3 510 995 160 530
Retention ditch (m) 1 070 3 550 2 380 5 200 4 400 1 950
Unploughed strips (m) 5 500 NR 12 500 19 250 16 890 8 645
Riverbank protection (km) 29 8 14.6 15.8 5.5 13
Contour bunds (ha) 20 30 30 2.5 15
Negarims (ha) 1 0.5 4.3 12.5 2
Semi-circular bunds (ha) NR NR 0.7 4 3.5
Basins/9-seeds holes (ha) NR 4 4 2 4.8
Pitting (ha) NR NR NR 8 20NR: not reported Table 8: Adoption of green water management (households) by District
Source: CKDAP 2006
Kirinyaga Maragua Nyandarua Nyeri Thika Practice Freq % Freq % Freq % Freq % Freq % Trash lines 32 13 39 16 3 1 1 0.5 10 4.Stone lines 6 2 0 0 7 3 2 1 12 5Fanya juu 28 11 50 20 23 10 47 19 110 45Grass strips 62 25 135 55 118 50 128 53 46 19Cut-off drains 19 8 96 39 54 22 30 12 54 22Bench terraces 13 5 19 8 10 4 64 26 10 4Semi-circular bunds 1 0.5 1 0.5 0 0 0 0 0 0Contour farming 34 14 3 1 46 19 1 0.5 1 0.5Pitting 0 0 5 2 0 0 1 0.5 2 1Water harvesting basins 2 1 4 2 0 0 0 0 0 0Road run-off harvesting 2 1 2 1 0 0 1 0.5 1 0.5None 93 38 31 13 64 27 51 21 35 14
Green Water Credits Report 5

Potential role of payments for watershed services 21
The small sample collected during this study suggests that almost half of the farmers undertake green water management across at least half of their farm (Figure 6). Activities vary markedly between agro-ecological zones (AEZs). Little is done in AEZs I and III (72 and 66 per cent, respectively, report no activity); much more in AEZ II and IV, where 80 per cent of farmers undertake green water management across at least half of the farm. Activity is linked with support provided by Government agencies, in particular capacity building, although some farmers mentioned in-kind support (seeds, tools).
0%
10%
20%
30%
40%
No SWC Less than half of thefarm
About half of thefarm
More than half ofthe farm
All of the farm
Figure 6: Green water management by farm
Source: Choice Experiment Survey, 2007
0 10 20 30 40 50 60 70 80 90 100
AEZ I
AEZ II
AEZ III
AEZ IV
Number of farmers
100 % Government
Government (70%), Private (10%),Neighbour (20%)
Government (50%) NGO (50%)
Government (65%) , Gov+NGO (10%), Neighbour (25%)
Figure 7: Support for green water management, by AEZ
Source: Choice Experiment Survey, 2007
Green Water Credits Report 5

22 Farmers' adoption of soil and water conservation
Crop residues and mulching: The availability of crop residues for mulch and green manure depends on the farming system. In drylands, crop residues come from cereals and pulses, and are mainly used for stock feed - grazed as standing stalks or kept for feeding in the dry season; some maize stover is used as fuel. The residues are rarely incorporated into the soil or used as mulch. Mulching is practised only on high value crops. Green manuring is likewise uncommon; both through lack of knowledge and because farmers consider land too scarce to be used for non-food crops (Onduru and others 2002).
5.2 Costs and benefits of SWC
5.2.1 Cost of conservation measures
The costs and benefits to the farmers supplying water management services is a crucial element in the feasibility of Green Water Credits. Establishment and maintenance: Giger and others (1999), in a survey of 38 schemes in 15 African countries, calculated a median establishment cost of US$ 150/ha (variance 20-1000) and, for maintenance, a median of $ 20/ha/year (most between $10 and $50/ha/year). Labour is the main cost; for the Tana basin, the estimates of Shiferaw and Holden (2001) in Ethiopia (Table 9) may be comparable. Table 9: Area loss and labour requirement for conservation measures, Ethiopia
Labour requirement 2, work days/km
Labour requirement, Work days/ha Technology Slope, %
Area loss 1, ha/km Construction Maintenance Construction Maintenance
Soil bund 5 10 20 30 50
0.4 0.8 1.6 2.4 4.0
70 70 70 70 70
15 15 15 15 15
28 56 112 168 280
6 12 24 36 60
Stone bund 5 10 20 30 50
0.4 0.8 1.6 2.4 4.0
150 150 150 150 150
15 15 15 15 15
60 120 240 360 600
6 12 24 36 60
Fanya juu 5 10 20 30 50
0.4 0.8 1.6 2.4 4.0
250 250 250 250 250
15 15 15 15 15
100 200 400 600 1000
6 12 24 36 60
Grass strips 5 10 20 30 50
0.4 0.8 1.6 2.4 4.0
10 10 10 10 10
2 2 2 2 2
4 8 16 24 40
0.8 1.6 3.2 4.8 8.0
1 Land occupied by structures having a width of 1m. Unless grass and other products are harvested, this is the area loss due to conservation
2 For level and graded bunds, the average labour requirement for soil and stone bunds were used
Green Water Credits Report 5

Potential role of payments for watershed services 23
Table 10 incorporates data on labour costs and gross margins from MONQI surveys of several sites in the Tana River Basin between 1997 and 2002 to make an indicative estimates of the costs of specific conservation measures. These costs of constructing and maintaining mechanical structures are substantial, especially for steep land. Table 10: Estimated costs of area loss and labour for conservation measures in
the Upper Tana (US$/ha) Technology Slope
(%) Max Area
loss 1 Min Area
loss 2 Labour 3
Construction Maintenance 5 60 16 32 7 10 120 32 64 14 20 240 64 128 27 30 360 96 192 41 50 600 160 320 69
Soil bund
5 60 16 69 7 10 120 32 137 14 20 240 64 274 27 30 360 96 411 41 50 600 160 686 69
Stone bund
5 60 16 114 7 10 120 32 229 14 20 240 64 457 27 30 360 96 686 41 50 600 160 1143 69
Fanya juu
5 60 16 5 1 10 120 32 9 2 20 240 64 18 4 30 360 96 27 5 50 600 160 46 9
Grass strips
1 Calculated by the areas lost * maximum gross margins (US$ 1500) 2 Calculated by the areas lost * minimum gross margins (US$ 400) 3 Calculated by taking the rate for hired labour per day (80 KSh), converted to US$
Green Water Credits Report 5

24 Farmers' adoption of soil and water conservation
To arrive at the net costs of water management services, the farmers’ benefits from green water management should be deducted from the costs. Calculating the benefits is difficult because they depend on the higher sustained yields expected, which, in turn, depend on soil, terrain and weather, as well as crop management and farm-gate prices. The results of many studies are equivocal. For instance, Ekbom (2006) found that terraces and green manure contribute to increased yields but agro-forestry is associated with lower yield of the primary crops. In Kenya, Pagiola (1996) found that higher commodity prices increase incentives to adopt conservation measures on steep slopes, but not on shallower slopes; were terraces to need more land to be taken out of production than assumed in the calculations, then higher commodity prices would tend to discourage farmers from adopting them. Winter-Nelson & Amegbeto (1998) found that increased output prices tend to improve incentives for agricultural investment, but increased price variability damps investment through the effects of risk aversion, credit constraints, or option values. Winter-Nelson & Amegbeto (1998) cite Kilewe (1987) that yield losses due to erosion on fields with 15 per cent slope in Machakos are constant at 22.2 kg maize/ha and 18.6 kg beans/ha (on base yields of 1000 kg maize/ha and 800 kg beans/ha). With an average maize price of 11.54 Ksh/kg maize (Monqi 2006), this comes down to 256 Ksh/ha or 3.7 US$/ha for maize. For beans with an average price of 19.26 Ksh/kg, the benefit from reduced erosion is 358 Ksh/ha or 5.1 $US/ha. These benefits are small compared to the costs. Shiferaw and Holden (2001) found negative net present values for most soil and water conservation measures under various crops. For semi-arid Kenya, Pagiola (1994) reckoned that it takes 48 years to break even once soil conservation structures are constructed. In short, the incentive of Green Water Credits is essential to overcome the financial barriers to sustainable land management.
5.2.2 Upstream economic benefits of Green Water Credits
Very much as a first step, Table 11 summarises the incremental financial benefits of the green water management practices used for biophysical scenarios in Report 3 (Kauffman and others 2007) - contour strips, mulching, and tied ridges. For the soil loss from erosion, the nutrient nitrogen content was calculated with data from the LEINUTS MONQI survey in the Tana Basin in 1997 (data used was from samples taken in Nyeri) and the cost of replacing this with fertiliser calculated from the price of CAN (a common fertiliser in the region). Prices were not adjusted for inflation. Calculating the benefits of groundwater recharge is more difficult. Table 11 shows the groundwater recharge calculated with the price of irrigation water. This assumes that the value of water can be equated to the cost of irrigation water which may not reflect accurately the value of water; different uses of water may have different prices and values; the value of water may different throughout the season, with a peak in the dry season. Improved crop yields as a result of green water management are not included in Table 11.
Green Water Credits Report 5

Potential role of payments for watershed services 25
Table 11: Incremental financial benefits of green water management (Ksh/ha/yr)
Contour Strips Mulch Tied ridges
1996 1997 1996 1997 1996 1997
Maize
Groundwater recharge (Ksh/ha/y) 0.7 3.9 1.3 5.9 1.1 7.2
Runoff (mm/y) -0.7 -4.0 -0.8 -5.1 -1.1 -7.4
Soil loss (Ksh/ha/y) -15.4 -130.6 -15.4 -130.6 -15.4 -138.3
Tea
Groundwater recharge (Ksh/ha/y) 0.5 2.1 1.0 3.3 0.6 3.1
Runoff (mm/y) -0.4 -2.2 -0.6 -3.1 -0.6 -3.1
Soil loss (Ksh/ha/y) 0.0 -23.0 0.0 -23.0 0.0 -15.4
Coffee
Groundwater recharge (Ksh/ha/y) 0.3 1.9 0.7 2.8 0.4 2.6
Runoff (mm/y) -0.3 -1.9 -0.4 -2.7 -0.4 -2.7
Soil loss (Ksh/ha/y) -23.0 -215.1 -23.0 -215.1 -23.0 -161.3
N content of 1 kg soil 0.0040 Source: MONQI data LEINUTS Nyeri, 1997
CAN fertiliser N content 0.21 "
Price 1 kg CAN (US$) 0.40 Constant prices US$ 1997
Price 1 kg N (US$) 1.90 "
Price of 1 kg soil (US$) 0.0077 "
Price of 1 ton soil (US$) 7.68 "
Price of irrigation water ($US/m3) 0.0021 Source: field data October 2007 Constant prices US$ 2007
5.3 Modelling the supply of green and blue water
Farmers’ land use and management decisions affect biophysical systems through several mechanisms. These links must be explicit and quantified for the development of a Green Water Credits mechanism. The quantification outlined by Report 3 (Kauffman and others 2007) can be built upon by estimating the economic implications - assuming that farmers make management decisions to maximize their economic returns. These economic decisions to supply market goods (crops and livestock) also affect the supply of environmental services such as water supply. Green Water Credits aims to support the supply of environmental services by providing long-term incentives. Here we outline a procedure for constructing a supply response curve for blue water supply, following the Minimal Data approach (Antle and Valdivia 2006), applied by Immerzeel and others (2007) to estimate the supply curve for environmental services in Tibet. This approach can be implemented in the design phase of Green Water Credits to estimate the supply curve for farmers participating in Green Water Credits. The first step is to model the farmers’ decision about land use. We simplify choice to two options: one without conservation measures (activity a); and one where
Green Water Credits Report 5

26 Farmers' adoption of soil and water conservation
green water management is implemented (activity b). The land use decision in each time period is based on the maximization of expected value of the land use, which we denote by v(p, s, z) where p is a parameter (vector) reflecting the output price; s indexes the site and z= a, b indexes the activity at the site. This allows for spatial heterogeneity. The value v can be interpreted in various ways but we will interpret it as expected returns from cropping; this will differ according to AEZ and cropping pattern. For simplicity, it may be assumed that the adjustment cost associated with changing from one land use to another is nil. With this assumption activity b is chosen if ω(p, s) = v(p, s, a)- v(p, s, b)≥ 0 (vice versa for a). Implementing green water management will have several effects. It will lead to reduction of soil erosion, which means there will be more water in the reservoirs because their capacity is not reduced by siltation. It will also increase crop yields (possibly decreasing blue water) as well as reducing unproductive evaporation from the soil (increasing blue water). Most importantly, better regulation of the water cycle, will increase groundwater recharge and river base flow at the expense of destructive floods The benefits of the water management services provided by activity b consist of:
- Reduction in the amount of water removed from the soil by direct evaporation leading to an increase in blue water (mm)
- Reduction in the amount of sediments contributed to the reach (tonnes/ha) - Reduction of peak flows (and floods) and increase in base flows.
These benefits depend on the weather, which is not known beforehand but which may be forecast statistically. In principle, each of the benefits may be valued although, in practice, this may be difficult. As an example, we may consider just one benefit: reduction of evaporation. When farmers do not receive any payments, there is an initial equilibrium of ecosystem services. The initial equilibrium (starting point) will be a mix of activities a and b. Green Water Credits aims to increase the environmental benefits by a payment pe to induce farmers to switch to activity b:
epbspvaspvsp e≤−= ),,(),,(),(ϖ (1)
),( spϖ can be interpreted as the opportunity cost of implementing green water
management. The price paid to farmers must therefore equal the opportunity
costs per unit of environmental service provided. ep
The total supply of environmental services is determined by the joint spatial distribution of environmental services and opportunity cost. If
and ),,(),,( bspvaspv < 0),( <spϖ then farmers will implement b without payments
. If we define the spatial distribution of opportunity costs as epe )(ϖφ , then for
pe(0) the area under the negative of )(ϖφ represents those land units where
Green Water Credits Report 5

Potential role of payments for watershed services 27
farmers use green water management without payments (Figure 8). Define the quantity of ecosystem services supplied in this initial equilibrium as S(p). As pe
increases, the net benefits of green water management increase for additional land units and farmers adopt green water management practices on those land units, increasing the quantity of environmental services supplied.
Figure 8: Implementation of green water management without payments
(initial situation)
Let )/( eϖϕ be the spatial distribution of opportunity costs per unit of ecosystem (in
mm water) obtained by ordering all the sites s for a given p within a land unit in
increasing order, then the fraction of the total number of farmers who undertake
green water management without payments is given by:
∫∞−
=0
)/()/()( edepr ϖϖϕ (2)
The initial equilibrium supply of water before farmers are given payments is then given by:
HeprpS )()( = (3)
where H is the total area of the land unit. With payments, the number of farmers switching to green water management r(p, pe) can be found by integrating
)/( eϖϕ between zero and pe. The total supply of environmental services is then:
HepprpSppS ee ),()(),( += (4)
There are two options in offering payments: either farmers are paid only for an increase in environmental services relative to a baseline, or farmers who undertake green water management before payments were offered are paid for this services –which alternative increases the cost of producing any given quantity of
environmental service by the amount . )( pSpe
The supply curve for blue water can be derived from the spatial distribution of opportunity cost per mm water using Figure 9. The supply curve exists of three parts. Part 1 includes those land units for which opportunity costs are greater than pe which will remain in activity a. As pe increases, more land will be put under activity b. Part 2 between 0 and pe corresponds to those land units that have switched from activity a to b due to payments pe. Part 3 is the are under the spatial distribution of opportunity cost on the interval equals r(p) and represents )0,(−∞
Green Water Credits Report 5

28 Farmers' adoption of soil and water conservation
the land units where farmers implement activity b without payments. At the point
where 0/ == epe ϖ the baseline supply of green water credits equals S(p).
Figure 9: Supply curve for Green Water Credits Data needs: The data required to simulate land use decisions are the expected values for each competing land use activity at each site. Several models have been developed to integrate physical and economic models; usually these are data-intensive. The Minimal Data approach uses available data to parameterise directly the spatial distribution of net returns to competing activities and, then, simulate land allocation decision using decision rules, such as maximisation of expected returns. For this approach, average or representative costs and returns for a geographical unit are required, and data from secondary sources or quick surveys are used to estimate mean expected net returns to each activity in each region. In addition to these data, the spatial variability in expected returns are required. Several assumptions are made:
- Variable costs of production are approximately proportional to expected output: yc κ≈
- Farmers in a region have similar output/price expectations; - Farmers in a region face similar factor prices (land, labour, capital) and
average costs of production.
With these assumptions, net return are ypcpyv )( κ−≈−= , where y is yields. This
implies that the coefficient of variation ( vvvcv μσ /= ) in net returns v across land
units in a region at a point in time can be estimated by the spatial coefficient of variation for y: ( yyycv μσ /= ). Available data show that this approach provides an
approximation that is well within an order of magnitude. Thus, land use decisions in a region are determined by the spatial distribution of the difference in expected value and the variance of the difference between v(a) and
v(b) is: )]([)]([)( bvEavEvE −=Δ
Green Water Credits Report 5

Potential role of payments for watershed services 29
abbaba σσσσ 2222 −+=− (5)
where the variance in net return of practice is
222iii vCV ⋅=σ (6)
and the covariance in net returns between practice a and b is
abbbaaab vCVvCV ρσ ⋅⋅⋅⋅= (7)
where abρ is the spatial correlation coefficient.
The model constructs this distribution per site; by sampling this distribution at different pe, the supply curve of blue water of each site is calculated. These supply curves may be aggregated to obtain a supply curve for the whole catchment.
5.4 Livelihoods study
For the design studies for Green Water Credits, general information gathered by the literature review will augmented in the field by a livelihoods study.
5.4.1 Methodology
To understand the direct and opportunity costs of any land use change, information is needed on family income, share of the market, and gross margin per crop and livestock. These costs will directly affect the type and magnitude of incentives required to promote changes in land practices. The following items are estimated using the MONQI Methodology questionnaires:
a. General farm data, including the demographic structure of household, and implements owned or agriculture-related constructions (as a proxy for capital);
b. Dependence on off-farm income, estimated by the share of total income and by type of activity per household member ( a very rough estimate, but may be more reliable than estimates per household member, as income is usually a sensitive subject);
c. Crop production and income, determined by assessing the amount of cultivated land, cropping pattern, and crop calendar per season. Then the external inputs in crop production, crop management and the output from crop production (harvesting and residue management) are measured;
d. Livestock production and income, determined by livestock measuring growth and composition of herd, the external inputs, livestock feeding and care and output from livestock production;
e. Household consumption (food and non-food) is not captured, except the external purchases that are made to the stock (e.g. seeds) and sales or use of materials in the stock (excluding home consumption);
f. Use of family labour for agricultural production.
Green Water Credits Report 5

30 Farmers' adoption of soil and water conservation
The targeted areas for Green Water Credits should be the areas combining (i) the AEZs relevant for green water management, (ii) the highest erosion rates and (iii) the dominant land use. In the forthcoming design stage of Green Water Credits, this survey, alongside farmers’ focus groups, will provide information about present livelihoods, opportunities and constraints, and poverty issues. Specifically, the net returns from agriculture for the farmer, on-farm benefits and costs of specified conservation packages, and the importance of Green Water Credits in diversifying and supplementing family income will be ascertained for the main production units in the target areas.
5.5 Results from the focus groups
5.5.1 Perception of obstacles and opportunities
Farmers’ opinions about the main obstacles and opportunities for SWC are summarised in Table 12
Table 12: Obstacles and opportunities for SWC
. Attractive conservation technologies offer short-term, on-site benefits in large increments; require only affordable inputs, especially labour; do not take up productive land; have little risk; and are consistent with the farmers’ socio-economic environment. When asked about the barriers to green water management, the farmer groups mainly based their responses from experiences in implementing structural conservation measures (e.g. fanya juu, cut-off drains etc.) irrespective of agro-ecological zone and farming activities.
Factors impeding green water management
Opportunities for addressing impeding factors
Labour intensive and expensive
Promotion of conservation measures that will increase income in the short and medium term, to compensate for high labour input Use of labour work parties or hired labour
Lack of incentives and the attitude that terraces are only to be constructed when there is food for work
Awareness of the short and long-term benefits of green water management
Inadequate technical knowledge; agricultural officers no longer visit farmers frequently
Practical training Training of selected community members to instruct others Training in both structural and agronomic methods
Inadequate tools for making terraces and for deep tillage
Provide or improve accessibility and affordability of required tools to farming communities
Inadequate grass/tree seeds for vegetation required to stabilise terrace embankments
Training on appropriate seeds/vegetation/plant types required Establish seed bank
Green Water Credits Report 5

Potential role of payments for watershed services 31
Factors impeding green water management
Opportunities for addressing impeding factors
Perception that making terraces reduces available land for crop production, especially on steep land
Integrate terrace construction/conservation activities with the growing of high value crops e.g. using fodder trees and grasses in terrace embankments Promote suitable practices according to climate, soil, and slope and farming system
Urban migration has reduced available on-farm labour
Promote group work and strengthen local institutions for green water management activities
Farmers raised various opportunities for addressing barriers to green water management. In the Upper Tana, where land parcels are becoming small, technologies that are replicable and that fit within small plots were mentioned frequently. Technologies that bring increased yields and income were seen as a possibility for compensating for labour inputs, e.g. conservation practices combined with the production of high-value crops, which bring demonstrable benefits in the short term as farmers wait for the long-term benefits. Practical training and availability of equipment/tools were mentioned as ways of overcoming the slow progress in conservation activities. Awareness creation and training in a basket of appropriate green water management technologies were seen as possibilities for changing attitudes. Collective action was raised as a possibility in addressing labour constraints. However, collective actions depend on: a direct private stake in community benefits; knowledge about the problem; potential to reap productivity benefits; trans-farm boundary installation of structures agreed by the owners; previous positive experience with informal labour exchange contract; and the household belonging to an active community group.
5.5.2 Recommendations
Knowledge baseline: The need for soil and water conservation is well understood but is equated with physical structures like terraces; the wider concept of green water management with emphasis on agronomic measures such as mulch and cover crops us not well understood. Most groups said that they would appreciate additional training, access to inputs and support.
Recommendation: The conservation measures that are likely to be adopted are those leading to increased income in the short term. Practices should be integrated so that farmers are able to get short-term benefits as they wait for long-term benefits, e.g. fodder grass strips provide an immediate benefit as well as to conserving soil.
Green Water Credits Report 5

32 Farmers' adoption of soil and water conservation
Incentives: Various short-term incentives have been provided by various agencies. These have enhanced the adoption of conservation measures in the short-term but some direct incentives like cash and food for work has resulted in weak ownership of the process once the incentives are withdrawn.
Recommendations: o To ensure ownership by the farmers, communities targeted for
Green Water Credits should be involved in the design of the conservation practices and the incentives (time frame, contract obligations and mechanisms for long-term implementation and maintenance)
o Advocacy and awareness-creation need to be linked with enforcement
o Capacity building is needed both within the farming community (e.g. training on conservation measures and tree nursery management, access to tools, equipment and other inputs), and in managing and supporting agencies
o Payment preferences differed from one group to another. Based on current needs experienced by the community and on-going projects, most groups favoured in-kind payments (indirect payments) and, where cash is needed, micro-credit and revolving fund arrangements.
Contract arrangement and monitoring: Groups were willing to enter into contracts for Green Water Credits. Most farmers preferred contracts between 3 to 5 years to provide security and confidence to engage in green water management.
Recommendation: Farmers and/or their representatives should be involved in the design of contracts, especially in determining their duration and obligations. The contractual benefits and commitments should be explained in detail, as there is history of farmers entering in agreements without wholly understanding their consequences. The contract should, preferably, be signed at the group level which enforces the contract obligations on all group members. There needs to be a clear channel for monitoring and feedback on progress of activities.
Green Water Credits Report 5
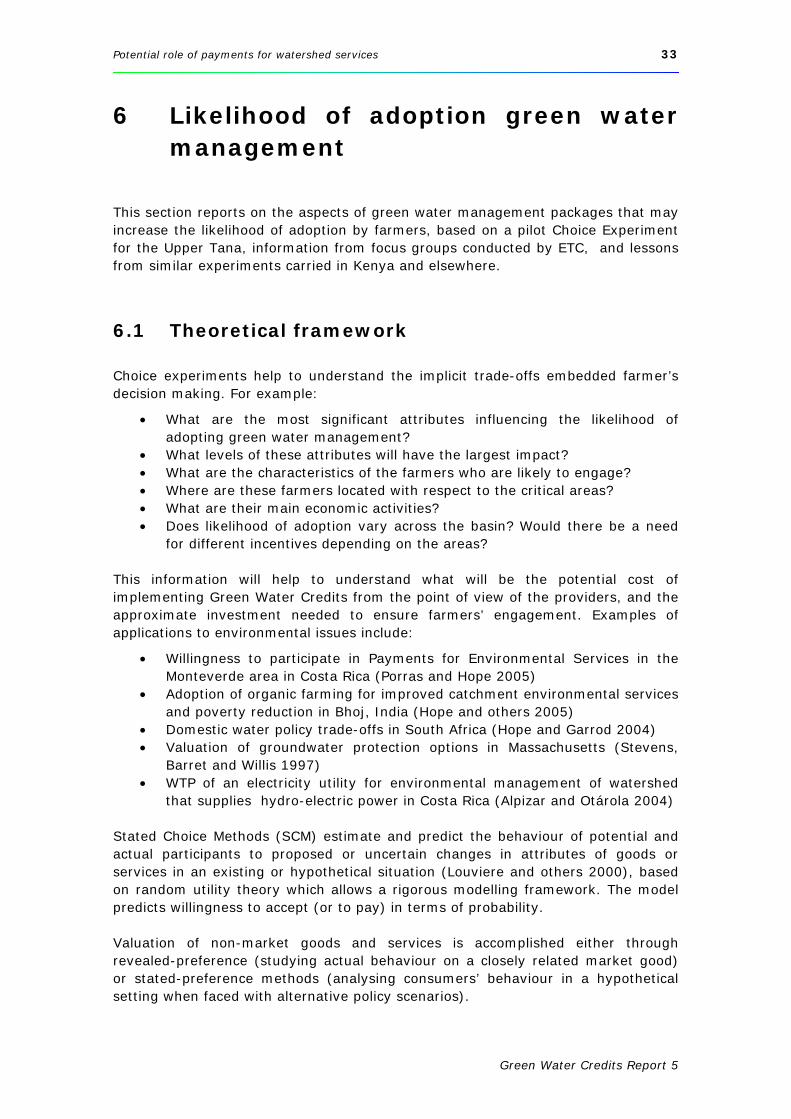
Potential role of payments for watershed services 33
6 Likelihood of adoption green water management
This section reports on the aspects of green water management packages that may increase the likelihood of adoption by farmers, based on a pilot Choice Experiment for the Upper Tana, information from focus groups conducted by ETC, and lessons from similar experiments carried in Kenya and elsewhere.
6.1 Theoretical framework
Choice experiments help to understand the implicit trade-offs embedded farmer’s decision making. For example:
• What are the most significant attributes influencing the likelihood of adopting green water management?
• What levels of these attributes will have the largest impact? • What are the characteristics of the farmers who are likely to engage? • Where are these farmers located with respect to the critical areas? • What are their main economic activities? • Does likelihood of adoption vary across the basin? Would there be a need
for different incentives depending on the areas? This information will help to understand what will be the potential cost of implementing Green Water Credits from the point of view of the providers, and the approximate investment needed to ensure farmers’ engagement. Examples of applications to environmental issues include:
• Willingness to participate in Payments for Environmental Services in the Monteverde area in Costa Rica (Porras and Hope 2005)
• Adoption of organic farming for improved catchment environmental services and poverty reduction in Bhoj, India (Hope and others 2005)
• Domestic water policy trade-offs in South Africa (Hope and Garrod 2004) • Valuation of groundwater protection options in Massachusetts (Stevens,
Barret and Willis 1997) • WTP of an electricity utility for environmental management of watershed
that supplies hydro-electric power in Costa Rica (Alpizar and Otárola 2004) Stated Choice Methods (SCM) estimate and predict the behaviour of potential and actual participants to proposed or uncertain changes in attributes of goods or services in an existing or hypothetical situation (Louviere and others 2000), based on random utility theory which allows a rigorous modelling framework. The model predicts willingness to accept (or to pay) in terms of probability. Valuation of non-market goods and services is accomplished either through revealed-preference (studying actual behaviour on a closely related market good) or stated-preference methods (analysing consumers’ behaviour in a hypothetical setting when faced with alternative policy scenarios).
Green Water Credits Report 5

34 Farmers' adoption of soil and water conservation
Choice methods investigate "what if?" questions; it is important to bear in mind their limitations - their use requires technical design and analysis, command of computing software, and the selection of the right combination of attributes to define the policy package is key; there is a danger of reductionism – it is helpful to keep the number of attributes small to help the respondents’ decision making. The main stages of a choice modelling exercise are: introducing the situation, selection of attributes and levels, choice of the experimental design, construction of the choice sets, measurement of preferences, and estimation procedure.
6.1.1 Introducing the situation: what are the SWC practices proposed?
SWC practices are locality-specific, so generic SWC packages were devised that could be adapted for different sites. For each AEZ, farmers were presented with a card giving a description (photograph or figure) of each SWC management package (Figure 10 and Table 13). These packages are presented and discussed in
.
Introducing the technological package
We would like to ask you to look at the technological package presented here. It represents relatively simple and effective measures for soil and water conservation. Some may even be already in place in your farm.
We would like to ask how likely is it for you to actively enter and keep the activities described.
You will be presented with five options representing different characteristics for the technological package.
These characteristics include the approximate amount of labour required to keep the activities, the length of the contracts that need to be signed, the institution that will manage the overall project together with the farmer’s group, and the type of incentive that might accompany the package. In all cases, farmers will receive adequate capacity building to understand the practices.
Additionally, for this project to work, group cooperation will be essential in order to achieve minimum threshold levels at the community and at the Tana level. Individual contracts will be processed through local farmers groups, who will represent, monitor and distribute the benefits among its members. The good or bad performance of each individual farmer will be reflected as overall group performance.
Show photographs representing the pre-selected technological package to the farmer.
The group will be divided in two and only one of the following question formats (E2 or E3) is presented to each farmer.
Figure 10
Figure 10: Describing the scenario to the farmer
Green Water Credits Report 5

Potential role of payments for watershed services 35
Table 13: SWC management packages AEZ - main crop
Management package Comments from focus groups
I – tea Contour strips of perennial vegetation Mulch, in young and pruned tea
Contour strips are possible just above the tea field but not within the crop itself The contour strip along the upper border may need to be combined with physical measures such as fanya juu due to steep slopes in many tea fields Prunings are currently being used as mulch within tea fields
II+III coffee
Contour strips Mulch
Perennial vegetation is currently being used to stabilize terrace risers Mulch and contour strips are commonly used in annual crop fields in the coffee zone
II, III and IV maize III + IV cotton
Contour strips Tied ridges
Contour strips and ridges but rarely tied ridges are currently practised, especially in zones III and IV Fanya juu stabilised by perennial grasses is a common practice in zones III and IV
6.1.2 Attributes and levels: what factors may influence farmers’ participation?
Once the alternative situation is selected, it is important to break it down into its most important parts, or attributes. For design of a Green Water Credits scheme, attributes can explore issues such as institutions involved, costs and benefits for the farmer, and potential externalities.
Attributes have different levels. These levels could be quantitative, for example KES500, KES 1000, KES 2000 for cost, the proportion of cropland that the farmer needs to allocate to the SWC package (5, 10, 50, 100 per cent), and the labour time involved (5 days, 10 days, 15 days). Attributes could also be qualitative, conveying descriptive information, for example the type of institution involved in managing the project at local level (public-private partnership, Ministry of Agriculture, private institution).
Selection of the attributes and their levels should be relevant to the problem in hand, credible and realistic, and easy to understand. It is important to include potential benefits as well as costs (implicit and explicit), to encourage the farmer to explore the trade-offs embedded in their decision-making process. In the case of Green Water Credits, selection of the attributes is a combined result from the focus groups in the area (conducted by ETC) which provided first-hand information from farmers, literature review, and meetings with key stakeholders, such as local offices of the Ministry of Agriculture and Ministry of Social Services.
Green Water Credits Report 5
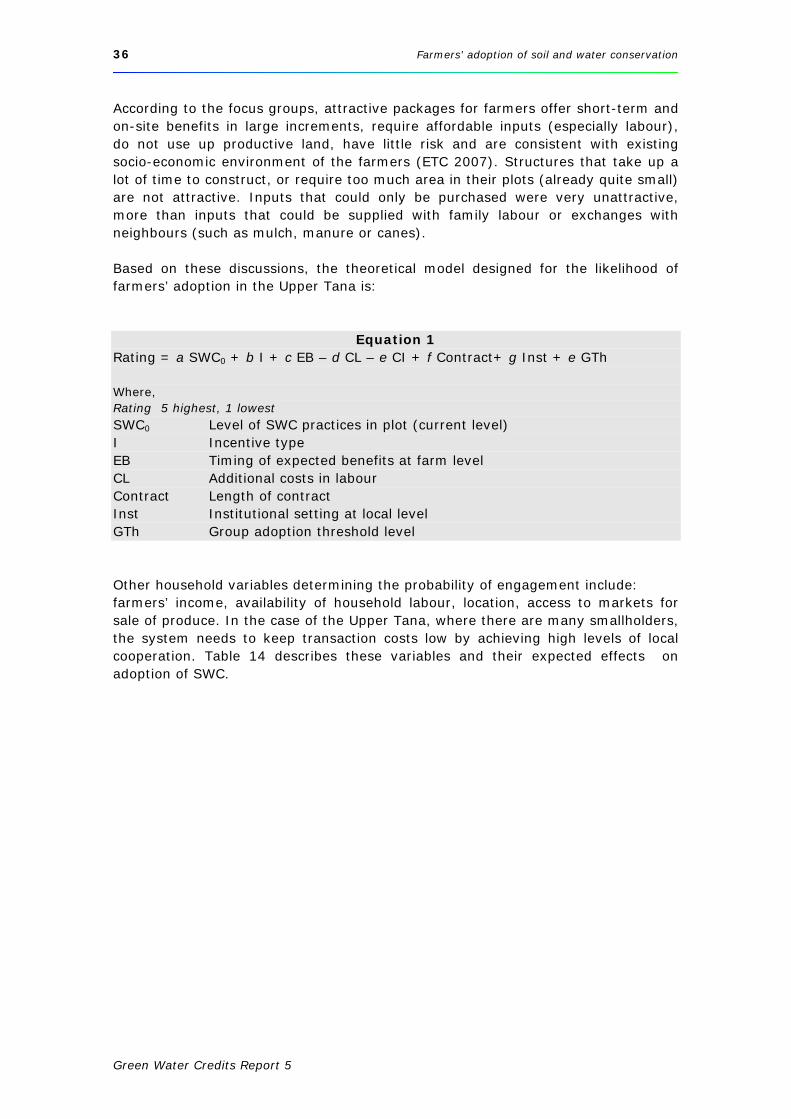
36 Farmers' adoption of soil and water conservation
According to the focus groups, attractive packages for farmers offer short-term and on-site benefits in large increments, require affordable inputs (especially labour), do not use up productive land, have little risk and are consistent with existing socio-economic environment of the farmers (ETC 2007). Structures that take up a lot of time to construct, or require too much area in their plots (already quite small) are not attractive. Inputs that could only be purchased were very unattractive, more than inputs that could be supplied with family labour or exchanges with neighbours (such as mulch, manure or canes). Based on these discussions, the theoretical model designed for the likelihood of farmers’ adoption in the Upper Tana is:
Equation 1 Rating = a SWC0 + b I + c EB – d CL – e CI + f Contract+ g Inst + e GTh Where, Rating 5 highest, 1 lowest SWC0 Level of SWC practices in plot (current level) I Incentive type EB Timing of expected benefits at farm level CL Additional costs in labour Contract Length of contract Inst Institutional setting at local level GTh Group adoption threshold level Other household variables determining the probability of engagement include: farmers’ income, availability of household labour, location, access to markets for sale of produce. In the case of the Upper Tana, where there are many smallholders, the system needs to keep transaction costs low by achieving high levels of local cooperation. describes these variables and their expected effects on adoption of SWC.
Table 14
Green Water Credits Report 5

Potential role of payments for watershed services 37
Table 14: Variables likely to affect adoption of SWC
Variable Levels Description
EB (+)
Short-term benefits at farm level
0,1 Binary variable, expected benefits will be perceived in: EB1 short term EB0 medium- long term
CL (-)
Labour days (acre/season)
10 15 20
Continuous variable
I (+)
Incentive type Several types of incentives. Each option will have only one type of incentive.
I1 In-kind compensation
No (0) Yes (1)
Access to in-kind incentives such as seed bank, or implements
I2 Access to revolving funds (soft credit)
No (0) Yes (1)
One-off payment to community group (in the form of trust-fund) as the basis for revolving credit for members
I3 Annual cash payments
KES 0 KES 1000 KES 1500 KES 2000
Continuous variable: cash payment related to the cost of labour/inputs
Contract (+/-)
Contract length 1,3,5 years Continuous variable
Inst (+/-)
Institution administering scheme
Qualitative variable: Public-private partnership, Ministry of Agriculture Independent private group
GTh (+/-)
Group threshold level
50% 80% 100%
Continuous variable: minimum group adoption levels - if adoption is lower than the threshold then incentives are lost
Additional variables that may affect adoption
SWC0
(+)
Level of present SWC practise in the plot
0,1,2,3 Continuous variable: 0 No SWC 1 Less than half of the plot 2 About half of the plot 3 More than half of the plot 4 All of the plot
Market (+)
Access to markets for produce
0,1 Binary: 0 Poor access to markets
Good access to markets
HL (+) Availability of household labour
0,1 Binary: 0 No household labour available 1 Household labour available
Green Water Credits Report 5

38 Farmers' adoption of soil and water conservation
6.1.3 Expected benefits at farm level
Farmers’ investment in SWC depends on their perception of the on-farm benefits, and when they accrue. Focus groups report the following benefits:
• Improved crop yields • Improved soil conservation • Improved water retention • Conservation of soil organic matter and applied nutrients/improved fertility • Increased fodder availability from fodder crops planted on terrace risers,
saving • costs of buying in fodder • Improved crop health
Benefits from communal work include cleaner water with reduced sediments, and reduced gullying of public areas (roads). An important consideration for the farmers is the possibility of benefits accruing in the short-term, for example, the use of grass strips along the contours generates fodder for livestock which, in turn, generate capital and manure; whereas fruit trees generate additional income only after several years. In order to measure this effect, the choice experiment includes a binary attribute on the timing of expected benefits at the farm level (short versus medium/long term). Farmer’s possibilities to bring the extra produce to the market are also likely to affect adoption. Poor access to markets makes investment in the farm less desirable; this is an issue in the Upper Tana (with the exception of tea) where marketing is hampered by bad roads and inadequate information on produce prices, quality and demand.
6.1.4 The potential additional labour cost
The impact on labour is analysed by including different levels of labour required by the SWC package. This is an important variable, as it will explore the trade-offs for the farmer. The household may be able to assume the extra cost if there is enough family labour; it becomes limiting when the farmer needs to hire labour or when the farmer needs to work somewhere else to earn cash. The values presented (Table 15) are very rough, and only indicative. Table 15: Availability of household labour
Household members
Labour- productive members Working on farm
AEZ I 3.6 2.4 1.8
AEZ II 4.6 2.6 1.8
AEZ III 4.1 3.1 2.3
AEZ IV 6.3 3.7 2.3
mean 4.6 2.9 2.0
Green Water Credits Report 5

Potential role of payments for watershed services 39
6.1.5 Cooperation between farmers and threshold levels
Most farmers belong to some kind of organisation. The importance of farmer’s cooperation is important on two counts - transaction costs and threshold levels.
Advantages of group organisation, especially for smallholders, lie in maketing and buying, where better prices may be got, and to access training and support from Government agencies. Farmers groups may be key players in Green water Credits, holding down transaction costs, in monitoring and policing of contracts, raising standards of practice, and in cooperation to achieve large projects like gully and landslide control. Threshold level refers both to the farm area that will need to be under SWC, and the cooperation among farmers to ensure achievement of minimum threshold levels in the area.
6.1.6 Institutional setting
Intangible issues are often at the heart of SWC adoption. Experience from application of choice modelling in Monteverde, Costa Rica (Porras and Hope, 2005) shows that the institution managing the scheme was one of the most important attributes determining participation. In Monteverde, farmers were reluctant to enter contracts with the Government. In the Upper Tana, operational success of Green Water Credits will depend on the way farmer groups fit into a larger management structure at the Basin level. In the focus groups, farmers were asked what institutions they have more experience with. The Ministry of Agriculture and the Ministry of Social Services were well rated; at the same time, many groups were linked to private institutions, mostly for commercial reasons. The new institutional units WRUAS established under the new water legislation are still only nascent and oriented mostly to management of irrigation water; some farmer groups also have dealings with banks, such as K-Rep.
6.1.7 Incentives
It is argued that SWC is in the farmers’ best interest and there have been many attempts to promote SWC through information, training and short-term incentives. However, the reality is that adoption and maintenance is poor; land degradation continues apace and this is affecting water supplies and siltation downstream. This attribute, therefore, explore different incentives to improve adoption and maintenance of SWC. Two kinds of incentives are explored:
• Monetary: Three monetary incentives are suggested: a) access to soft credit through revolving funds, b) direct cash payments to the farmer, c) tied-cash rewards, like school vouchers
• Non-monetary: Seeds, seedlings, implements and equipment • No incentive: Training and capacity building offered to all
Green Water Credits Report 5

40 Farmers' adoption of soil and water conservation
6.1.8 Current soil and water conservation practices
The model predicts that uptake of SWC practices will be higher for farmers that have already invested in SWC. The level of practice varies considerably across AEZs (Figure 11).
Agroecological zone I
0% 20% 40% 60% 80%
No SWC
Less than half ofthe farm
About half of thefarm
More than half ofthe farm
All of the farm
Agroecological zone II
0% 10% 20% 30% 40% 50%
No SWC
Less than half ofthe farm
About half of thefarm
More than half ofthe farm
All of the farm
Agroecological zone III
0% 10% 20% 30% 40% 50% 60% 70%
No SWC
Less than half ofthe farm
About half of thefarm
More than half ofthe farm
All of the farm
Agroecological zone IV
0% 10% 20% 30% 40% 50%
No SWC
Less than half ofthe farm
About half of thefarm
More than half ofthe farm
All of the farm
Figure 11: Current level of SWC, by AEZ
6.1.9 Access to markets
This variable measure farmers’ perceptions of how easy or difficult it would be for them to sell any additional produce obtained through improved farming practices. techniques. Results (Figure 12) show that the perceived access to markets varies significantly with farmers in AEZ I reporting easier access to markets than farmers in AEZ IV. There is also a counter-intuitive, negative correlation between the perceived access to markets and the level of SWC.
Green Water Credits Report 5

Potential role of payments for watershed services 41
0% 25% 50% 75% 100%
AEZ I
AEZ II
AEZ III
AEZ IV
DifficultEasy
Figure 12: Perceived access to markets
6.1.10 Experimental design and choice sets
The next step is the design of random combination of attribute levels to generate the alternative scenarios presented to respondents. Ideally, respondents should be asked to rate each one of the scenarios involved (complete factorial design). This is difficult to implement; in practice respondents are asked to rate a fraction of randomly assigned scenarios (fractional factorial design), chosen using a special software package.
Respondents are presented with different profile packages, and are asked to rate them according to their likelihood of engaging in each one of them. It is important to ask respondents to rate their own status quo, in order to have a comparison point for the other scenarios. Choice sets may be presented in different ways:
• Respondents are presented with separate scenarios one at the time, and are asked to rate them individually. The rating could be in the form: ‘How likely are you to engage in this policy package?’ Levels are from 1 to 5, with 1 indicating not likely to 5 indicating very likely.
• Paired comparison. Respondents are presented with two cards side-by-side and asked to choose one of the options. The decision could be binomial (A, B or none), or a continuous from ‘more likely A’, ‘indifferent’, to ‘more likely B’, or ,’none’.
• Group comparison. Respondents are presented with more than two options and asked to rate them. The rating could be individual, or could be in order of preference. This method has the advantage of showing fewer scenarios, but it could overload the respondent.
Green Water Credits Report 5

42 Farmers' adoption of soil and water conservation
6.1.11 Estimation procedure
Roe and others (1996) suggest that estimates of compensating variation can be derived by looking at the respondent’s rating of the status quo (no project) and the alternative condition being proposed. The choice model can also be tested for consistency by stating it in different forms. Porras (1999) suggests 3 forms:
1. A model based on a linear combination of the attributes. Its orthogonal design means that the variation of each attribute is independent of the variation of all other attributes, so it is possible to obtain marginal rates of substitution for the different attributes;
2. Ratings Difference: This uses the rating of the status quo as a reference point to analyse the increase/decrease in utility from alternative scenarios;
3. Binary Response: This converts the continuous scale 0 to 10 into binary responses (YES or NO) and estimates the corresponding probability of accepting certain rating. This may be achieved either by estimating the probability of the alternative scenario being preferred to the status quo, or by assuming a threshold above which reponses are considered ‘yes’ and below which ‘no’.
Estimation is done using Ordinary Least Squares estimation (OLS) or maximum-likelihood estimation procedures; these includes binary options like logit and probit, and continuous forms like ordered logit, nested logit, and panel data models. The decision-making can be correlated with personal information, such as income, education, gender, farm information, and location.
6.2 Results from pilot implementation
6.2.1 Sample selection
A farmers survey was implemented in the Tana Basin in March 2007 for this study. This exploratory survey covered four agro-ecological zones, and interviewed a total of 128 farmers (see methodology in Section 1.2.2)
Green Water Credits Report 5

Potential role of payments for watershed services 43
Table 16: Choice experiment interviews AEZ District Division Location Cluster No. households
Tetu Thegenge Kariguini 16 I Nyeri
Mathira Maguta Kiamucheru 16
Kahuro Weithaga Rukui-Wangu 16 II Muranga
Mathioya Kamacharia Ihiga ria Iguru 16
Mwea Murinduku Mugamba Ciura 16 III Kirinyaga
Mwea Kangai Kombuini 16
Gachoka Mutuobare Kathari 16 IV Mbeere
Mbita Kambita 16
6.2.2 Farmers assessment of current situation
Assessment of the current situation helps to understand the likelihood of farmers wanting to engage in alternatives; the likelihood of participation in alternative scenarios will increase if the farmer is dissatisfied with the present situation. Figure 13 shows the initial distribution of the farmer’s rating of current and alternative scenarios. Ratings are well distributed across the categories (1 to 5), which minimizes the statistical errors of co-linearity.
0%
15%
30%
45%
60%
1 (I don'tlike it at
all)
2 3 4 5 (I like itvery
much)
Level of satisfaction w ith current farming
0%
10%
20%
30%
40%
1 (low est)
2 3 4 5(highest)
Distribution of Ratings of alternative scenarios
Figure 13: Farmers’ assessment of the current and alternative situations
Green Water Credits Report 5

44 Farmers' adoption of soil and water conservation
6.2.3 Model application
The theoretical model estimate the likelihood of farmers’ adoption in the Upper Tana is:
Equation 1 Rating = a SWC0 + b I + c EB – d CL – e CI + f Contract+ g Inst + e GTh Where: SWC0 Level of SWC practices in plot (current level) I Incentive type EB Timing of expected benefits at farm level CL Additional costs in labour Contract Length of contract Inst Institutional setting at local level GTh Group adoption threshold level Other household variables that could affect the probability of engaging include: farmers’ income, availability of household labour, location, and access to markets to sale produce. Table 17
Table 17: Results of ratings regression, model 1
presents a reduced model form, where the estimation is based only on the existence of an incentive (any) as opposed to no incentive at all. The most statistically significant variables of the regression are incentive, term of expected benefits, and managing institution. At lower confidence levels we find the contract length and the number of labour days required.
Unstandardized coefficients Attributes
B Std. Error
Standardized Beta
(Constant) 2.098** 0.619
Current level of SWC 0.044 0.054 0.046
Term of expected benefits 0.348** 0.181 0.109
Number of labour days required -0.038 0.025 -0.096
Contract length (years) -0.084 0.055 -0.086
Managing institution - Min of Ag 0.407* 0.219 0.122
Managing institution - Private 0.264 0.225 0.078
Threshold level 0.003 0.005 0.039
No of household members working regularly on farm 0.093 0.098 0.054
Incentive 0.801** 0.215 0.21
Access to external markets 0.162 0.201 0.046
Dependent Variable: Rating ** significant at 0.05 confidence level; * significant at 0.1 confidence level
Green Water Credits Report 5

Potential role of payments for watershed services 45
We can predict the weight of each variable with the standardized beta1. According to the regression analysis, the variables that have a stronger effect on participation are:
• Increase the rating by more than 10 per cent o Incentive (21 per cent) o Managing institution – Ministry ofAgriculture o Term of expected benefits
• Decrease the rating by more than 10 per cent
o Number of labour days required o Contract length (years)
• Very low effect (less than 10 per cent)
o Managing Institution - Private o No of household members working regularly in the farm o Current level of SWC o Access to external markets o Threshold level
Because, in all cases, farmers were offered capacity building, this model shows that using an incentive, of any kind, will increase participation rates by more than 20 per cent. A more in-depth analysis of the types of incentives suggested is shown in Table 18. This regression model breaks-down the different types of incentives offered: tools, cash (Ksh 1000, 1500 and 2000), tied cash (i.e. school vouchers) and access to a revolving fund.
1 The standardized beta is used to compare the strength of different independent variables measured in different ways. They vary from -1 to 0 to +1 and are similar to correlation coefficients. The unstandardized beta is used to make actual predictions in the regression model.
Green Water Credits Report 5
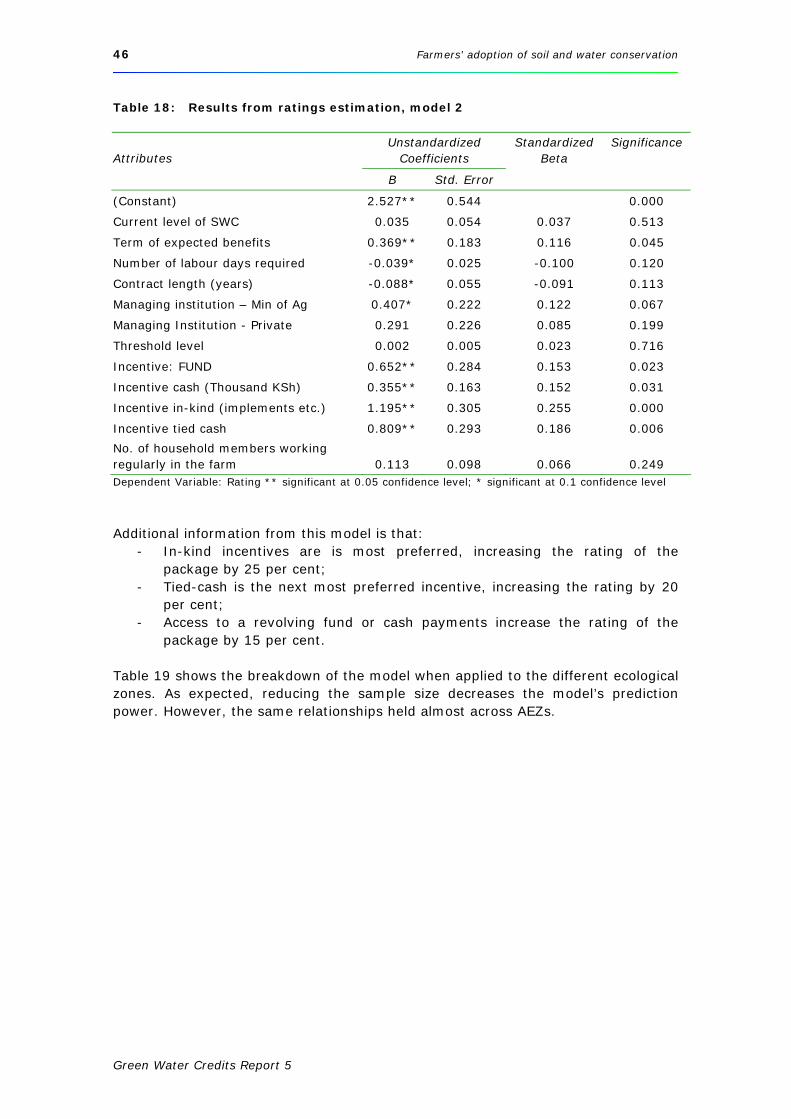
46 Farmers' adoption of soil and water conservation
Table 18: Results from ratings estimation, model 2
Attributes Unstandardized
Coefficients
B Std. Error
Standardized Beta
Significance
(Constant) 2.527** 0.544 0.000
Current level of SWC 0.035 0.054 0.037 0.513
Term of expected benefits 0.369** 0.183 0.116 0.045
Number of labour days required -0.039* 0.025 -0.100 0.120
Contract length (years) -0.088* 0.055 -0.091 0.113
Managing institution – Min of Ag 0.407* 0.222 0.122 0.067
Managing Institution - Private 0.291 0.226 0.085 0.199
Threshold level 0.002 0.005 0.023 0.716
Incentive: FUND 0.652** 0.284 0.153 0.023
Incentive cash (Thousand KSh) 0.355** 0.163 0.152 0.031
Incentive in-kind (implements etc.) 1.195** 0.305 0.255 0.000
Incentive tied cash 0.809** 0.293 0.186 0.006
No. of household members working regularly in the farm 0.113 0.098 0.066 0.249 Dependent Variable: Rating ** significant at 0.05 confidence level; * significant at 0.1 confidence level
Additional information from this model is that:
- In-kind incentives are is most preferred, increasing the rating of the package by 25 per cent;
- Tied-cash is the next most preferred incentive, increasing the rating by 20 per cent;
- Access to a revolving fund or cash payments increase the rating of the package by 15 per cent.
Table 19 shows the breakdown of the model when applied to the different ecological zones. As expected, reducing the sample size decreases the model’s prediction power. However, the same relationships held almost across AEZs.
Green Water Credits Report 5

Potential role of payments for watershed services 47
Table 19: Model differences across agro-ecological zones AEZ Comments
I Only incentive variables Fund and Tied-cash are statistically significant ; rating increases 38% with access to Fund, and 35% with Tied-cash Management by Min of Ag increases rating by 17% (not statistically significant) Ratings decrease when the community threshold adoption level increases, and with days of labour for work (part-explained by poor track record of SWC in zone) All other variables have little effect on the rating (3-8%)
II Only Contract Length statistically significant, longer contract lengths will decrease the rating of the package by 38% In-kind incentives, cash, threshold level and Ministry of Agriculture as managing organisation each increase rating by 15% The difference in sign for threshold level with respect to AEZ I may be explained by stronger presence of SWC, giving farmers confidence that neighbours are likely to meet the target
III Only Ministry of Agriculture managing the program is statistically significant, increasing ratings by 30% Private institution as program manager next most-preferred, increasing rating by 15%
IV In-kind benefits are most preferred and increased ratings by 47% All other incentives increase ratings (cash 24%, revolving fund 21%, and tied cash 21%) Contract length (-20%) and number of days required for SWC package (-14%) decrease the rating
Green Water Credits Report 5

48 Farmers' adoption of soil and water conservation
Example: This section presents a simple exercise applying the results of the model. Except for incentives, attributes are kept constant at the following levels: Attributes Levels
Labour requirements 10 days
Program management Ministry of Agriculture
Time horizon of expected benefits Medium to Long-term
Number of household members working on-farm 3
Existing SWC measures in farm About half the plot
Threshold level About 50% of association members
Contract length 3 years
Using "no incentive" to estimate a baseline, the estimated ratings level is 3.2 out of 5 (5 being definitively engage, and 1 being definitely not engage). This result shows that there is some degree of interest, partly because farmers are offered capacity building, but the existence of the incentive increases the potential engagement. If farmers were offered cash, rather than tools, the ratings increase as the amount of cash increases. Figure 14 shows the effect on adoption rates if all is kept constant except the type and level of incentive. An incentive of 1000 KSh increases the ratings by 10 per cent, followed by access to revolving funds. The higher ratings are obtained with in-kind incentives (nearly 40% increase).
0%
10%
20%
30%
40%
1000 KES Access torevolving
fund
2000 KES Tied cash 3000 KES In kindIncr
ease
d %
with
resp
ect t
o N
o In
cent
ive
Figure 14: Impact on adoption ratings by type and level of incentive
Note: the baseline is drawn by estimating the rating using No Incentive
Green Water Credits Report 5

Potential role of payments for watershed services 49
6.3 Main outcomes from choice experiment
For the proof-of-concept, only an exploratory exercise has been undertaken; its results should be considered only indicative rather than definite. The main issues highlighted by this exercise are:
Variables that tend to increase the rating by more than 10 per cent • Incentives, in order of preference:
- In-kind incentives - Tied-cash - Cash and access to revolving funds
• Management by the Ministry of Agriculture • Benefits expected at medium to long term (not necessarily on the
short term)
Variables that tend to decrease the rating by more than 10 per cent • Number of labour- days required, more labour = less attractive • Contract length – shorter contract = less attractive
Variables with low to negligible effect
• Management by a private institution • Number of household members working regularly in the farm • Current level of SWC • Access to external markets • Threshold level
An uncomplicated program based on simple, easy-to-understand and easy-to-adopt practices, and providing a suitable incentive, could have a significant uptake in the Upper Tana. Concentrating time and effort on those variables that may not have a large effect on uptake, like access to markets, or enforcement of threshold levels may divert scarce funds from where they are most needed. Some issues need clarification for the design of a Green Water Credits mechanism:
1. Cash is an important asset in the household but farmers apparently perceive some in-kind incentives, like implements and equipment, as a more permanent benefit; cash incentives can be withdrawn but the farmer gets to keep the implements;
2. The marked preference for the Ministry of Agriculture as the project manager could be due to the way in which the question was framed; the alternatives offered were vague (private institution, or public-private partnership) and farmers may have been preferred a known institution to an unknown.
Green Water Credits Report 5


Potential role of payments for watershed services 51
7 Implications for Green Water Credits
7.1 Potential providers and livelihoods
Potential service providers in the Upper Tana Basin are many and varied. Farmers are mostly smallholders depending on maize, usually intercropped with beans, as the main subsistence crop. The main cash crops are tea, coffee and cotton and irrigated rice, depending on rainfall, terrain and soils. However, on the farm the crops are much more diverse; households can own as many as 20 plots on which different crops are grown, often intercropped. Most households also own livestock. Average earnings per farm type range from almost no income, due to crop losses, to over 7000 US$ per year (MONQI data for Nyeri, Embu and Mbeere). The need for incentives to secure SWC in the long term is indicated by analyses of opportunity costs. Information on the kind incentives that farmers would be willing to accept under Green Water Credits is based on results from the Focus Groups, the Choice Experiment (Table 19). Table 20: Summary of results from upstream studies
Sources of information Main Results
Modelling and livelihoods study Theoretical models to understand linkages between private land use and externalities in the Upper Tana
Labour costs are the main part of farmer’s costs
The costs of constructing and maintaining SWC structures can be substantial, these costs often outweigh the benefits, requiring Green Water Credits to overcome these costs
A supply-response curve for water management services can be built, linking to SWAT model results, to support the design studies for Green Water Credits
Focus groups Elicit farmers’ views on SWC, markets, organisational capacity and institutional settings in the Upper Tana Sample: Eight focus groups with irrigation and non-irrigation farmers in 4 agro-ecological zones
Wealth of knowledge and capacity in SWC has been won through decades of implementation, but there is much scope for improvement; maintenance of structures is poor
Farmers are aware of their private benefits from SWC, but demand tangible, short-term benefits
Existing farmers’ associations (marketing, benevolence, cultural) may serve as a foundation for collaboration in Green Water Credits
To ensure ownership by the farmers, the project design process should take into account farmers’ views on incentives and modes of payments
The contract should preferably be signed at the group level which, in turn, enforces the contract obligations upon members. Most farmers preferred contracts between 3 to 5 years with higher preference to 5 years.
There is need for a clear channel for periodic monitoring and feedback on progress of activities
Green Water Credits Report 5

52 Farmers' adoption of soil and water conservation
Sources of information Main Results
Choice experiment Objective: pre-feasibility study to determine the policy components (or attributes) that would make GWC more attractive (higher ratings) to farmers Sample size: 128 farmers in 4 agro-ecological areas
Variables that tend to increase the rating by >10%: - Incentives, in order of preference: in-kind incentives, tied-
cash, cash and access to revolving funds - Management by Ministry of Agriculture - Benefits expected at medium to long term Variables that tend to decrease the rating by >10%: - Higher labour requirement - Length of contract (e.g. 3, 5 10 years) Variables with low predicted effect: - Managing institution - private - Number of household members working on-farm - Current level of SWC - Access to markets - Threshold level
7.2 Constraints
7.2.1 Poverty
Farmland in the Upper Tana is occupied by very many smallholders, holdings are not only small but sub-divided. Farmers are usually poor, with limited access to markets and low prices for their produce. Linked to poverty are the need for diversification of livelihoods and preference for short-term benefits. The cost of SWC measures is likely to outweigh the benefits received at the high discount rates driven by poverty so innovative solutions are needed to balance poverty alleviation and investment in sustainable land and water management. Green Water Credits appears to offer just such a solution. However, poverty must also be taken into account if payments from downstream users result in higher water rates. Farmers in the Upper Tana are poor but so are very many city dwellers, and many of these already pay high rates for water (mostly purchased through vendors). Increased water fees could have negative effects on these already vulnerable groups.
7.2.2 Measurement
Willingness of downstream water users to pay for water management services in the medium to long term hinges on the clear link between efforts made by farmers upstream and water delivery downstream. Given the high variability of rainfall in the catchment, it will be difficult to disentangle the risk of no delivery due to variable rainfall from the risk from farmers’ failure to comply? Who assumes this risk?
Green Water Credits Report 5
Potential role of payments for watershed services 53
7.3 Conclusions
• While there is wealth of information and capacity in SWC, won through decades of implementation, maintenance of SWC structures is often poor. Soil erosion, destructive runoff and downstream floods and siltation of reservoirs are increasing; river base flows are decreasing.
• Farmers are aware of their private benefits from SWC but demand tangible
rewards for them to keep up with the labour involved; they see SWC as means to an end (i.e. production and income generation), rather than a goal in itself. There are existing initiatives rewarding farmers for SWC investments - for example, a reduction of 5% from water charges is proposed for farmers doing good SWC. The effects on small farmers will be small or negligible for rain-fed agriculture, but it shows willingness to try financial mechanisms for rewarding SWC.
Potential rewards include cash payments and revolving funds or soft credit, and in-kind benefits such as implements. Other suggestions include community benefits such as better roads, schools or clinics. There are advantages and disadvantages to all of these methods, especially linked to the creation of negative expectations, a climate of dependence (in the case of cash payments), and difficulties of enforcing project requirements in the case of up-front in-kind benefits. These issues are taken up in Report 6.
• Cooperation among farmers and local organisations will be key in
developing an efficient reward mechanism for the Tana Basin. There will be many cases where local erosion falls beyond the private plot of a particular individual (i.e. gully erosion, road sedimentation), or the level of the task is too demanding for one person (i.e. landslides). In these cases, group cooperation, together with local Government units, will be key in ensuring a low sediment delivery downstream.
There are farmer groups and associations in place, usually linked through a
business-objective such as market production. These groups have to enforce regulations related to quality control, including fertilizers, promotion of group cooperation and implementation of sanctions, as non-compliance affects the quality of the final produce and the competitiveness of the group in the markets (for example, if produce is for export). These groups could be a framework for SWC, as part of a ‘quality control’ package for their associates.
• There is capacity in existing Government institutions carrying out training
on SWC. At first sight, however, their efforts seem uncoordinated and not necessarily reaching the most vulnerable farmers.
Green Water Credits Report 5


Potential role of payments for watershed services 55
8 References
Agwata JF 2005. Water Management in the Tana Basin of Kenya: Potential Conflicts and Interventions. Asian Journal of Water, Environment and Pollution 2, 2, 69-74
Alpízar F and M Otárola 2004. Estimación de la voluntad de pago de clientes de JASEC para financiar el manejo ambiental de las subcuencas del Sistema Hidroeléctrico Birrís. Taller de Economía Ecológica Estado Actual de la Valoración Económica Ecológica en Iberoamérica, San José, Costa Rica. 28 y 29 de Setiembre de 2004
Antle JM and RO Valdivia 2006. Modelling the supply of ecosystem services from agriculture: a minimum-data approach. Australian J. Agricultural and Resource Economics 50, 1, 1
Bai ZG and DL Dent 2006. Global assessment of land degradation and improvement: pilot study in Kenya. Report 2006/01, ISRIC – World Soil Information, Wageningen
CKDAP 2006. Household study for agricultural services. Kenya Dry Area Smallholder and Community Services Development Project, Ministry of Planning and National Development (MPND) and the International Fund for Agricultural Development (IFAD), Kenya
Droogers P, S Kauffman, K Dijkshoorn, W Immerzeel, and J Huting 2006. "Green and Blue Water Services in Tana River Basin, Kenya. Exploring Options Using an Integrated Modeling Framework", ISRIC - World Soil Information, Wageningen, 66 p
Dunne T 1979. Sediment Yield and Land Use in Tropical Catchments, Journal of Hydrology 42, 130-140
Ekbom A 2006. Soil Properties and Conservation Technologies in Agricultural Production - a Case Study of Kenya’s Central Highlands. Paper presented at the Third World Congress of Environmental and Resource Economists, Kyoto, Japan, July 3-7, 2006
ETC 2007. Preliminary feasibility study for Upper Tana Catchment using focus group discussions. Green Water Credits working document, ETC East Africa, Nairobi
FAO 2000. "East Africa Module Land Cover Mapping Based on Satellite Remote Sensing", Rome: Food and Agriculture Organisation of the United States. pages
Foster S and A Tuinhof 2005. Sustainable groundwater management, concepts and tools, Kenya: the role of groundwater in the water supply of Greater Nairobi. Case Profile Collection 13, Groundwater Management Advisory Team, The World Bank, Washington DC
Green Water Credits Report 5

56 Farmers' adoption of soil and water conservation
Gachene C, JP Mbuvi, NJ Jarvis, H Linner 1998. Maize yield reduction due to erosion in a high potential area of Central Kenya Highlands. African Crop Science Journal. 6(1): 29-38
Gachene CKK 1995. Effects of Soil Erosion on Soil Properties and Crop Response in Central Kenya (Ph.D. thesis), Department of Soil Sciences, Reports and Dissertations No. 22, Uppsala, Sweden
Giger M, HP Liniger and W Critchley 1999. Use of incentives and profitability of soil and water conservation. In: D Sanders Incentives in soil conservation. Oxford & IBH , New Delhi. http://www.wocat.net/MATERIALS/incent.pdf
Grieg-Gran M, S Noel and I Porras 2006. Lessons learned from payments for environmental services. Green Water Credits Rept 2, ISRIC – World Soil Information, Wageningen
Hope RA and GD Garrod 2004. Is water policy responding to rural preferences? A choice experiment model evaluating household domestic water trade-offs in rural South Africa. CAMP - TR: 1-11
IFAD 2002. Socio-economic reconnaissance study for the proposed Mt Kenya East – Tana River Catchment. Conservation, land use and water Management pilot project, Internal project document, IFAD, Rome
Immerzeel W, J Stoorvogel and J Antle 2007. Can payments for environmental services secure the water tower of Tibet? Agricultural Systems, in press
Jaetzold R and H Schmidt 1983. Farm management handbook of Kenya. Ministry of Agriculture, Kenya and German Agency for Technical Cooperation, Nairobi
Kauffman JH, P Droogers, E Odada, P Macharia, P Gicheru and K Dijkshoorn 2007. Green and blue water resources and assessment of improved soil and water management scenarios using an integrated modelling framework: Upper Tana Basin, Kenya. Green Water Credits Report 3, ISRIC – World Soil Information, Wageningen
Kilewe AM 1987. Prediction of erosion rates and the effects of topsoil thickness on soil productivity. PhD Thesis, Dept Soil Science, University of Nairobi
Lewis LA 1985. Assessing soil loss in Kiambu and Murang’a Districts, Kenya, Geografiska Annaler, 67 A, (3-4): 273-284.
Louviere JJ, DA Hensher and JD Swait 2000. Stated choice methods. Analysis and application. Cambridge University Press
Meijerink G 2007. Assessment of the supply economics for improved soil and water management scenarios . Green Water Credits Report. Wageningen: ISRIC
Meijerink G, F Muchena, E Njue, S Noel, D Onduru, and I Porras 2007. "Political, Institutional and Financial Framework for Promoting S&W Techniques in the Context of Poverty and Climatic Variability", Wageningen: ISRIC. Green Water Credits Report. 54 p
Green Water Credits Report 5

Potential role of payments for watershed services 57
Monqi 2006. Household survey data. www.monqi.org
Moore TR 1979. Land Use and Erosion in the Machakos Hills, Annals of the Association of American Geographers 69, 3, 419-431
Onduru D, L Gachimbi, F Maina, FN Muchena and A de Jager 2002. Sustaining agricultural production in the semiarid Areas of eastern kenya: a case study of Mbeere district. INMASP Report Ke-03, ETC/KARI/ LEI, Nairobi
Pagiola S 1994. Soil conservation in a semi-arid region of Kenya: rates of return and adoption by farmers. In: T Naapier and others (editors) Adopting conservation on the farm. Soil and Water Conservation Society, Ankeny IO
Pagiola S 1996. Price policy and returns to soil conservation in semi-arid Kenya. J. Environmental and Resource Economics 8, 3 225-271
Porras I 1999. Off-site value of visibility: New Hampshire's White Mountains case study. Thesis, Univ Massachusetts, Dept of Resource Economics.
Porras I and R Hope 2005. Using stated choice methods in the design of payments for environmental services schemes. Centre for Land Use and Water Resource Research, University of Newcastle-upon-Tyne
Porras I, M Grieg-Gran and N Neves 2007. All that glitters: review of payments for watershed services in developing countries. IIED, London
Shiferaw B and S Holden 2001. Farm-level benefits to investments for mitigating land degradation: empirical evidence from Ethiopia. Environment and Development Economicsl 6, 335-358
Stevens T, C Barrett, and C Willis 1997. Conjoint Analysis of Groundwater Protection Programs. Agricultural and Resource Economics Review 27(2), 229-236
Stocking, Michael, and Niamh Murnaghan, 2001. Handbook for the Field Assessment of Land Degradation, Earthscan, UK
Winter-Nelson A and K Amegbeto 1998. Option values to conservation and agricultural price policy: application to terrace construction in Kenya. Am. J. Agricultural Economics 80, 409-418
WHO 2006. Working together for health. The world health report 2006. http://www.who.int/whr/2006/en/
Wunder S 2005. Payments for environmental services: some nuts and bolts. CIFOR Occasional Paper 42, Jakarta
Green Water Credits Report 5

58 Farmers' adoption of soil and water conservation
APPENDIX – Choice experiment questionnaire
Farmers’ Preference Survey Tana Basin, February 2007
The Green Water Project is a combined effort of local and national institutions aiming at improving management of soil at farm level as ways to improve water availability downstream. By introducing and sustaining simple and inexpensive soil and water conservation measures, farmers are able to maintain farm fertility by avoiding soil losses and maximising the use of rainfall. At the same time, appropriate measures can help important downstream impacts, such as reduction of sediments. With this study we aim at understanding farmers’ preferences towards technological packages for soil and water conservation, and what are the best forms of organisation at the Tana level that will ensure appropriate feedback. The results from this survey will feed directly into the national debate on soil and water policies. THANK YOU VERY MUCH FOR YOUR COOPERATION.
0.1 Name of interviewer 0.2 Date (day/month/year)
A. BASIC INFORMATION
Geographical information
A1 District
A2 Agro-ecological zone
A3 GIS information
Household information
A4 Name of interviewee
A5 Gender 1 = Male 2 = Female
A6 # household members
A7 # (labour) able members in household
A8 # household members working in farm on a regular basis
A9 Who manages the cash in the household?
1= husband 2=wife 3=both husband and wife
A10 What is the highest education level achieved in the household head?
1 = Non educated; 2= Primary or elementary school; 3 = post primary vocational; 4 = secondary school; 5 = post secondary vocational; 6 = formal education above secondary level; 7 = others
Green Water Credits Report 5

Potential role of payments for watershed services 59
B. Group membership
B1 Is the farmer member of a group? 1=YES 2 = NO
B2 Main activity of the group (cultural, marketing, etc)
1 = Benevolence/cultural; 2 = Merry-go-round/credit; 3 = Enterprise/marketing 4= Other (explain)
B3 Number of members in group
B4 How long have you been a member? (years)
B5 How satisfied are you with the group?
1 =Very 2= Not very 3 = Not at all
B6 What is your level of participation? 1 = Regular 2 = Occasional
B7 Does your group keep a bank account?
1= YES 2 =NO
B8 Is the group officially registered? 1 = YES 2 = NO
Please describe briefly:
B9 Group composition
B9.1 Total group membership
B9.2 Number of women
B10 Monitoring and/or control of infractions This question should address what happens (i.e. penalties) when members break the group by-laws
B11 Does the group members to whom you belong to make financial contributions?
1 = Yes 2 = No
B12 If yes, how are the funds allocated?
C. Production and access to markets
C1 What is your farm size? (acres)
C2 What are the three main enterprises/products from your farm? Write in order of importance
C3.1 Production for export
C3.2 Production for local markets
C3 Please rate the importance of these activities in your production 1 is the most important activity, 3 is the less important activity
C3.3. Production for self-subsistence
Green Water Credits Report 5

60 Farmers' adoption of soil and water conservation
C4a. External markets C4ai. Easy C4aii. Difficult
C4 How easy is it for you to sell your produce? This question is not about prices, it is about how difficult is it to reach the markets
C4b Local markets C4bi. Easy C4bii. Difficult
D. Soil and Water Conservation experience
D1 What is the current level of SWC practice in the farm/cultivated area?
0 No SWC 1 Less than half of the plot 2 About half of the plot 3 More than half of the plot 4 All of the plot
D2 Do you currently receive support for SWC?
YES NO
D3 Describe (see below)
In what form From whom Provides support 1 = Yes; 2 = No
a. knowledge /training
b. In-kind (tools, seeds etc)
c. Cash
d. How often (the most dominant frequency)
D3.1 NGO
D3.2 Govt
D3.3 Church
D3.4 Private companies
D3.5 Financial institutions
Option (choose one) 1. Monthly 2. Quarterly 3. Half yearly 4. Annually 5. Ad hoc 6. Initially, and
then stop
E. Choice Experiment question E1 Current Situation
What is the level of satisfaction with your current farming conditions in your farm? [Please rate from 1 to 5 where 1 = lowest; and 5 = highest]
1. I don’t like it at all 2. I don’t like it 3. I am indifferent 4. I like it 5. I like it very much
Green Water Credits Report 5

Potential role of payments for watershed services 61
Introducing the technology package We would like to ask you to look at the technology package presented here. It represents relatively simple and effective measures for soil and water conservation. Some may be already in place in your farm. We would like to ask how likely is it for you to actively enter and keep the activities described. Additionally, for this project to work, group cooperation will be essential in order to achieve minimum threshold levels at the community and at the Tana level.
The group will be divided in two and only one of the
following question formats (E2 or E3) is presented to
each farmer. Individual contracts will be processed through local farmers groups, who will represent, monitor and distribute the benefits among its members. You will be presented with five options representing different characteristics for the technological package. Can you please let us know which are your preferred options by:
E2) Ranking the following options from 1 to 5, with 5 being the preferred option and 1 the least preferred one. If the farmer does not like any option write ZERO, but try to avoid this situation by explaining as much as possible.
E2 Alternative Scenario (*): RANKING Ranking (most preferred one on top)
1 Scenario #
2 Scenario #
3 Scenario #
4 Scenario #
5 Scenario #
(*) write here the scenario # from card options
Show photographs representing the
technological package to the farmer
Green Water Credits Report 5

62 Farmers' adoption of soil and water conservation
E3) Rating the following options from 1 to 5, with “1” indicating that you do not like the option at all and will not enter a contract for the technological package, "3" indicates that you are indifferent to the option, and “5” indicates that you will definitely take the option. In this case present the farmer with each option at the time. Make sure that you do not introduce the card with cash incentive first to avoid biased responses. E3 Alternative Scenario (*):
RATING Rating (each scenario 1 to 5)
Ranking (1 to 5) (ask the farmer to rank all the options at the end)
1 Scenario # 2 Scenario # 3 Scenario # 4 Scenario # 5 Scenario # (*) write here the scenario # from card options
Green Water Credits Report 5

Green Water Credits reports
GWC 1 Basin identification Droogers P and others 2006
GWC 2 Lessons learned from payments for environmental services
Grieg-Gran M and others 2006
GWC 3 Green and blue water resources and assessment of improved soil and water management scenarios using an integrated modelling framework.
Kauffman JH and others 2007
GWC 4 Quantifying water usage and demand in the Tana River basin: an analysis using the Water and Evaluation and Planning Tool (WEAP)
Hoff H and others 2007
GWC 5 Farmers' adoption of soil and water conservation: the potential role of payments for watershed services
Porras I and others 2007
GWC 6 Political, institutional and financial framework for Green Water Credits in Kenya
Meijerink G and others 2007
GWC 7 The spark has jumped the gap. Green Water Credits proof of concept
Dent DL and JH Kauffman 2007
Recommended