THIS FILING IS
Item 1: An Initial (Original)
Submission
OR Resubmission No. ____X
FERC FINANCIAL REPORT
FERC FORM No. 1: Annual Report of
Major Electric Utilities, Licensees
and Others and Supplemental
Form 3-Q: Quarterly Financial Report
These reports are mandatory under the Federal Power Act, Sections 3, 4(a), 304 and 309, and
18 CFR 141.1 and 141.400. Failure to report may result in criminal fines, civil penalties and
other sanctions as provided by law. The Federal Energy Regulatory Commission does not
consider these reports to be of confidential nature
OMB No.1902-0021
OMB No.1902-0029
OMB No.1902-0205
(Expires 12/31/2019)
(Expires 12/31/2019)
(Expires 12/31/2019)
Form 1 Approved
Form 1-F Approved
Form 3-Q Approved
FERC FORM No.1/3-Q (REV. 02-04)
Exact Legal Name of Respondent (Company) Year/Period of Report
End of 2016/Q4Westar Energy, Inc.
20170505-8016 FERC PDF (Unofficial) 04/07/2017
INSTRUCTIONS FOR FILING FERC FORM NOS. 1 and 3-Q
GENERAL INFORMATION
I. Purpose
FERC Form No. 1 (FERC Form 1) is an annual regulatory requirement for Major electric utilities, licensees and others
(18 C.F.R. § 141.1). FERC Form No. 3-Q ( FERC Form 3-Q)is a quarterly regulatory requirement which supplements the
annual financial reporting requirement (18 C.F.R. § 141.400). These reports are designed to collect financial and
operational information from electric utilities, licensees and others subject to the jurisdiction of the Federal Energy
Regulatory Commission. These reports are also considered to be non-confidential public use forms.
II. Who Must Submit
Each Major electric utility, licensee, or other, as classified in the Commission’s Uniform System of AccountsPrescribed for Public Utilities and Licensees Subject To the Provisions of The Federal Power Act (18 C.F.R. Part 101),must submit FERC Form 1 (18 C.F.R. § 141.1), and FERC Form 3-Q (18 C.F.R. § 141.400).
Note: Major means having, in each of the three previous calendar years, sales or transmission service thatexceeds one of the following: (1) one million megawatt hours of total annual sales, (2) 100 megawatt hours of annual sales for resale, (3) 500 megawatt hours of annual power exchanges delivered, or (4) 500 megawatt hours of annual wheeling for others (deliveries plus losses).
III. What and Where to Submit
(a) Submit FERC Forms 1 and 3-Q electronically through the forms submission software. Retain one copy of each report
for your files. Any electronic submission must be created by using the forms submission software provided free by the
Commission at its web site: http://www.ferc.gov/docs-filing/forms/form-1/elec-subm-soft.asp. The software is
used to submit the electronic filing to the Commission via the Internet.
(b) The Corporate Officer Certification must be submitted electronically as part of the FERC Forms 1 and 3-Q filings.
(c) Submit immediately upon publication, by either eFiling or mail, two (2) copies to the Secretary of the Commission, thelatest Annual Report to Stockholders. Unless eFiling the Annual Report to Stockholders, mail the stockholders report tothe Secretary of the Commission at:
Secretary Federal Energy Regulatory Commission
888 First Street, NE Washington, DC 20426
(d) For the CPA Certification Statement, submit within 30 days after filing the FERC Form 1, a letter or report (notapplicable to filers classified as Class C or Class D prior to January 1, 1984). The CPA Certification Statement can beeither eFiled or mailed to the Secretary of the Commission at the address above.
FERC FORM 1 & 3-Q (ED. 03-07) i
20170505-8016 FERC PDF (Unofficial) 04/07/2017
The CPA Certification Statement should:
a) Attest to the conformity, in all material aspects, of the below listed (schedules and pages) with the
Commission's applicable Uniform System of Accounts (including applicable notes relating thereto and the
Chief Accountant's published accounting releases), and
b) Be signed by independent certified public accountants or an independent licensed public accountant
certified or licensed by a regulatory authority of a State or other political subdivision of the U. S. (See 18
C.F.R. §§ 41.10-41.12 for specific qualifications.)
Reference Schedules Pages
Comparative Balance Sheet 110-113
Statement of Income 114-117 Statement of Retained Earnings 118-119 Statement of Cash Flows 120-121 Notes to Financial Statements 122-123
e) The following format must be used for the CPA Certification Statement unless unusual circumstances or conditions,
explained in the letter or report, demand that it be varied. Insert parenthetical phrases only when exceptions are
reported.
“In connection with our regular examination of the financial statements of for the year ended on which we have
reported separately under date of , we have also reviewed schedules
of FERC Form No. 1 for the year filed with the Federal Energy Regulatory Commission, for
conformity in all material respects with the requirements of the Federal Energy Regulatory Commission as set forth in itsapplicable Uniform System of Accounts and published accounting releases. Our review for this purpose included such
tests of the accounting records and such other auditing procedures as we considered necessary in the circumstances.
Based on our review, in our opinion the accompanying schedules identified in the preceding paragraph(except as noted below) conform in all material respects with the accounting requirements of the Federal EnergyRegulatory Commission as set forth in its applicable Uniform System of Accounts and published accounting releases.”
The letter or report must state which, if any, of the pages above do not conform to the Commission’s requirements. Describe the discrepancies that exist.
(f) Filers are encouraged to file their Annual Report to Stockholders, and the CPA Certification Statement using eFiling.
To further that effort, new selections, “Annual Report to Stockholders,” and “CPA Certification Statement” have been
added to the dropdown “pick list” from which companies must choose when eFiling. Further instructions are found on the
Commission’s website at http://www.ferc.gov/help/how-to.asp.
(g) Federal, State and Local Governments and other authorized users may obtain additional blank copies of
FERC Form 1 and 3-Q free of charge from http://www.ferc.gov/docs-filing/forms/form-1/form-1.pdf and
http://www.ferc.gov/docs-filing/forms.asp#3Q-gas .
IV. When to Submit:
FERC Forms 1 and 3-Q must be filed by the following schedule:
FERC FORM 1 & 3-Q (ED. 03-07) ii
20170505-8016 FERC PDF (Unofficial) 04/07/2017
a) FERC Form 1 for each year ending December 31 must be filed by April 18th of the following year (18 CFR § 141.1), and
b) FERC Form 3-Q for each calendar quarter must be filed within 60 days after the reporting quarter (18 C.F.R. §141.400).
V. Where to Send Comments on Public Reporting Burden.
The public reporting burden for the FERC Form 1 collection of information is estimated to average 1,144hours per response, including the time for reviewing instructions, searching existing data sources, gathering andmaintaining the data-needed, and completing and reviewing the collection of information. The public reporting burden forthe FERC Form 3-Q collection of information is estimated to average 150 hours per response.
Send comments regarding these burden estimates or any aspect of these collections of information, includingsuggestions for reducing burden, to the Federal Energy Regulatory Commission, 888 First Street NE, Washington, DC20426 (Attention: Information Clearance Officer); and to the Office of Information and Regulatory Affairs, Office ofManagement and Budget, Washington, DC 20503 (Attention: Desk Officer for the Federal Energy RegulatoryCommission). No person shall be subject to any penalty if any collection of information does not display a valid controlnumber (44 U.S.C. § 3512 (a)).
FERC FORM 1 & 3-Q (ED. 03-07) iii
20170505-8016 FERC PDF (Unofficial) 04/07/2017
GENERAL INSTRUCTIONS
I. Prepare this report in conformity with the Uniform System of Accounts (18 CFR Part 101) (USofA). Interpretall accounting words and phrases in accordance with the USofA.
II. Enter in whole numbers (dollars or MWH) only, except where otherwise noted. (Enter cents for averages andfigures per unit where cents are important. The truncating of cents is allowed except on the four basic financial statementswhere rounding is required.) The amounts shown on all supporting pages must agree with the amounts entered on thestatements that they support. When applying thresholds to determine significance for reporting purposes, use for balancesheet accounts the balances at the end of the current reporting period, and use for statement of income accounts thecurrent year's year to date amounts.
III Complete each question fully and accurately, even if it has been answered in a previous report. Enter theword "None" where it truly and completely states the fact.
IV. For any page(s) that is not applicable to the respondent, omit the page(s) and enter "NA," "NONE," or "NotApplicable" in column (d) on the List of Schedules, pages 2 and 3.
V. Enter the month, day, and year for all dates. Use customary abbreviations. The "Date of Report" included in the
header of each page is to be completed only for resubmissions (see VII. below).
VI. Generally, except for certain schedules, all numbers, whether they are expected to be debits or credits, mustbe reported as positive. Numbers having a sign that is different from the expected sign must be reported by enclosing thenumbers in parentheses.
VII For any resubmissions, submit the electronic filing using the form submission software only. Please explainthe reason for the resubmission in a footnote to the data field.
VIII. Do not make references to reports of previous periods/years or to other reports in lieu of required entries,except as specifically authorized.
IX. Wherever (schedule) pages refer to figures from a previous period/year, the figures reported must be basedupon those shown by the report of the previous period/year, or an appropriate explanation given as to why the differentfigures were used.
Definitions for statistical classifications used for completing schedules for transmission system reporting are as follows:
FNS - Firm Network Transmission Service for Self. "Firm" means service that can not be interrupted for economic reasonsand is intended to remain reliable even under adverse conditions. "Network Service" is Network Transmission Service asdescribed in Order No. 888 and the Open Access Transmission Tariff. "Self" means the respondent.
FNO - Firm Network Service for Others. "Firm" means that service cannot be interrupted for economic reasons and isintended to remain reliable even under adverse conditions. "Network Service" is Network Transmission Service asdescribed in Order No. 888 and the Open Access Transmission Tariff.
LFP - for Long-Term Firm Point-to-Point Transmission Reservations. "Long-Term" means one year or longer and” firm"means that service cannot be interrupted for economic reasons and is intended to remain reliable even under adverseconditions. "Point-to-Point Transmission Reservations" are described in Order No. 888 and the Open AccessTransmission Tariff. For all transactions identified as LFP, provide in a footnote the
FERC FORM 1 & 3-Q (ED. 03-07) iv
20170505-8016 FERC PDF (Unofficial) 04/07/2017
termination date of the contract defined as the earliest date either buyer or seller can unilaterally cancel the contract.
OLF - Other Long-Term Firm Transmission Service. Report service provided under contracts which do not conform to theterms of the Open Access Transmission Tariff. "Long-Term" means one year or longer and “firm” means that servicecannot be interrupted for economic reasons and is intended to remain reliable even under adverse conditions. For alltransactions identified as OLF, provide in a footnote the termination date of the contract defined as the earliest date eitherbuyer or seller can unilaterally get out of the contract.
SFP - Short-Term Firm Point-to-Point Transmission Reservations. Use this classification for all firm point-to-pointtransmission reservations, where the duration of each period of reservation is less than one-year.
NF - Non-Firm Transmission Service, where firm means that service cannot be interrupted for economic reasons and isintended to remain reliable even under adverse conditions.
OS - Other Transmission Service. Use this classification only for those services which can not be placed in theabove-mentioned classifications, such as all other service regardless of the length of the contract and service FERC Form.Describe the type of service in a footnote for each entry.
AD - Out-of-Period Adjustments. Use this code for any accounting adjustments or "true-ups" for service provided in priorreporting periods. Provide an explanation in a footnote for each adjustment.
DEFINITIONSI. Commission Authorization (Comm. Auth.) -- The authorization of the Federal Energy Regulatory Commission, or anyother Commission. Name the commission whose authorization was obtained and give date of the authorization.
II. Respondent -- The person, corporation, licensee, agency, authority, or other Legal entity or instrumentality in whosebehalf the report is made.
FERC FORM 1 & 3-Q (ED. 03-07) v
20170505-8016 FERC PDF (Unofficial) 04/07/2017
EXCERPTS FROM THE LAW
Federal Power Act, 16 U.S.C. § 791a-825r
Sec. 3. The words defined in this section shall have the following meanings for purposes of this Act, to with:
(3) ’Corporation' means any corporation, joint-stock company, partnership, association, business trust,organized group of persons, whether incorporated or not, or a receiver or receivers, trustee or trustees of any of theforegoing. It shall not include 'municipalities, as hereinafter defined;
(4) 'Person' means an individual or a corporation;
(5) 'Licensee, means any person, State, or municipality Licensed under the provisions of section 4 of this Act,and any assignee or successor in interest thereof;
(7) 'municipality means a city, county, irrigation district, drainage district, or other political subdivision oragency of a State competent under the Laws thereof to carry and the business of developing, transmitting, unitizing, ordistributing power; ......
(11) "project' means. a complete unit of improvement or development, consisting of a power house, all waterconduits, all dams and appurtenant works and structures (including navigation structures) which are a part of said unit, andall storage, diverting, or fore bay reservoirs directly connected therewith, the primary line or lines transmitting power therefrom to the point of junction with the distribution system or with the interconnected primary transmission system, allmiscellaneous structures used and useful in connection with said unit or any part thereof, and all water rights,rights-of-way, ditches, dams, reservoirs, Lands, or interest in Lands the use and occupancy of which are necessary orappropriate in the maintenance and operation of such unit;
"Sec. 4. The Commission is hereby authorized and empowered
(a) To make investigations and to collect and record data concerning the utilization of the water 'resources of any region tobe developed, the water-power industry and its relation to other industries and to interstate or foreign commerce, andconcerning the location, capacity, development -costs, and relation to markets of power sites; ... to the extent theCommission may deem necessary or useful for the purposes of this Act."
"Sec. 304. (a) Every Licensee and every public utility shall file with the Commission such annual and other periodic orspecial* reports as the Commission may be rules and regulations or other prescribe as necessary or appropriate to assistthe Commission in the -proper administration of this Act. The Commission may prescribe the manner and FERC Form inwhich such reports salt be made, and require from such persons specific answers to all questions upon which theCommission may need information. The Commission may require that such reports shall include, among other things, fullinformation as to assets and Liabilities, capitalization, net investment, and reduction thereof, gross receipts, interest dueand paid, depreciation, and other reserves, cost of project and other facilities, cost of maintenance and operation of theproject and other facilities, cost of renewals and replacement of the project works and other facilities, depreciation,generation, transmission, distribution, delivery, use, and sale of electric energy. The Commission may require any suchperson to make adequate provision for currently determining such costs and other facts. Such reports shall be made underoath unless the Commission otherwise specifies*.10
FERC FORM 1 & 3-Q (ED. 03-07) vi
20170505-8016 FERC PDF (Unofficial) 04/07/2017

"Sec. 309. The Commission shall have power to perform any and all acts, and to prescribe, issue, make, and rescind such
orders, rules and regulations as it may find necessary or appropriate to carry out the provisions of this Act. Among other
things, such rules and regulations may define accounting, technical, and trade terms used in this Act; and may prescribe
the FERC Form or FERC Forms of all statements, declarations, applications, and reports to be filed with the Commission,
the information which they shall contain, and the time within which they shall be field..."
General Penalties
The Commission may assess up to $1 million per day per violation of its rules and regulations. See
FPA § 316(a) (2005), 16 U.S.C. § 825o(a).
FERC FORM 1 & 3-Q (ED. 03-07) vii
20170505-8016 FERC PDF (Unofficial) 04/07/2017
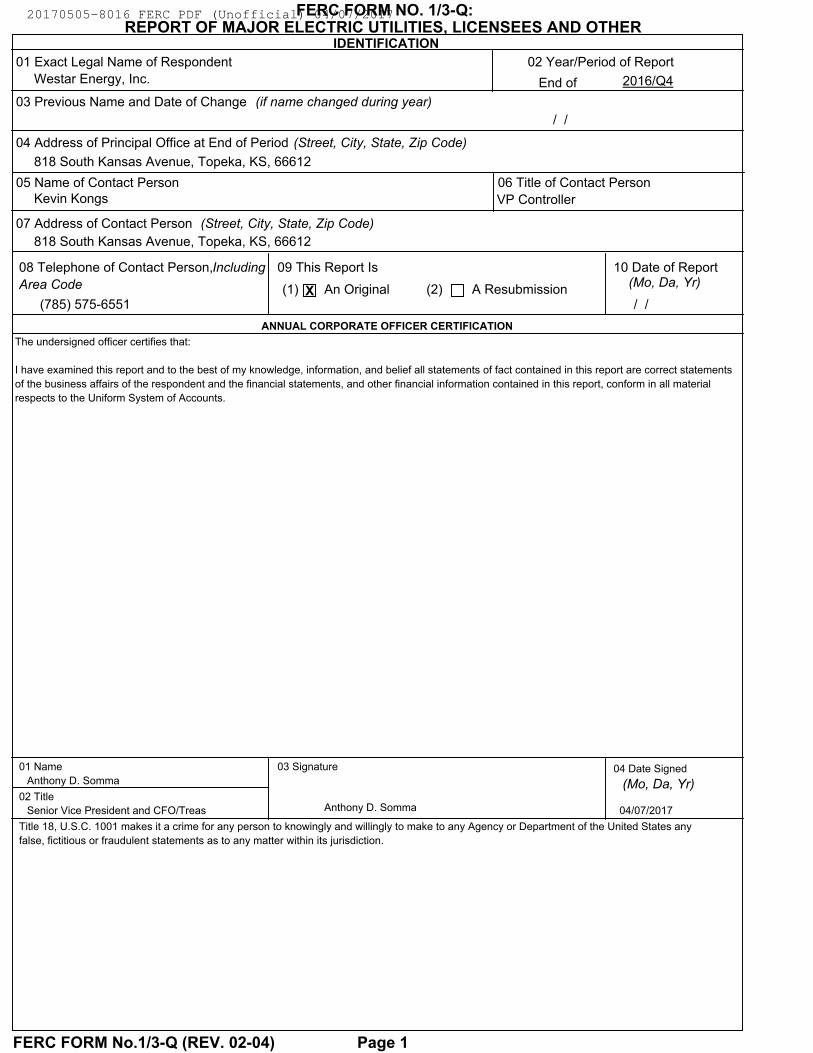
IDENTIFICATION
FERC FORM NO. 1/3-Q:REPORT OF MAJOR ELECTRIC UTILITIES, LICENSEES AND OTHER
Anthony D. Somma
818 South Kansas Avenue, Topeka, KS, 66612
2016/Q4
818 South Kansas Avenue, Topeka, KS, 66612
01 Exact Legal Name of Respondent
(1) An Original (2) A ResubmissionX
02 Year/Period of Report
End ofWestar Energy, Inc.
03 Previous Name and Date of Change (if name changed during year)
04 Address of Principal Office at End of Period (Street, City, State, Zip Code)
05 Name of Contact Person 06 Title of Contact Person
07 Address of Contact Person (Street, City, State, Zip Code)
08 Telephone of Contact Person,Including
Area Code
09 This Report Is 10 Date of Report(Mo, Da, Yr)
01 Name
02 Title
03 Signature 04 Date Signed
(Mo, Da, Yr)
Title 18, U.S.C. 1001 makes it a crime for any person to knowingly and willingly to make to any Agency or Department of the United States any
false, fictitious or fraudulent statements as to any matter within its jurisdiction.
/ /
Kevin Kongs VP Controller
(785) 575-6551 / /
Anthony D. Somma
Senior Vice President and CFO/Treas 04/07/2017
ANNUAL CORPORATE OFFICER CERTIFICATION
The undersigned officer certifies that:
I have examined this report and to the best of my knowledge, information, and belief all statements of fact contained in this report are correct statements
of the business affairs of the respondent and the financial statements, and other financial information contained in this report, conform in all material
respects to the Uniform System of Accounts.
FERC FORM No.1/3-Q (REV. 02-04) Page 1
20170505-8016 FERC PDF (Unofficial) 04/07/2017
Name of Respondent This Report Is:(1) An Original
(2) A Resubmission
Date of Report(Mo, Da, Yr)
Year/Period of Report
End of
LIST OF SCHEDULES (Electric Utility)
Westar Energy, Inc.X
/ /2016/Q4
Line
No.
Title of Schedule Reference
Page No.
Remarks
(c)(b)(a)
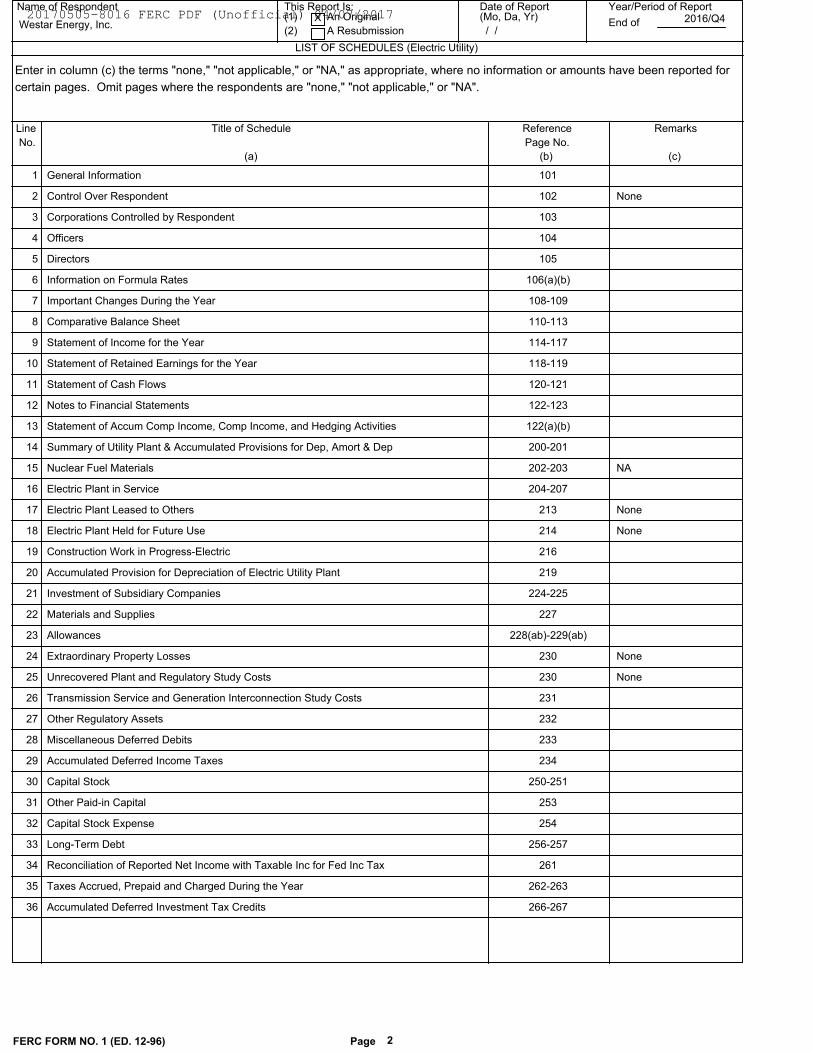
Enter in column (c) the terms "none," "not applicable," or "NA," as appropriate, where no information or amounts have been reported for
certain pages. Omit pages where the respondents are "none," "not applicable," or "NA".
101General Information 1
None102Control Over Respondent 2
103Corporations Controlled by Respondent 3
104Officers 4
105Directors 5
106(a)(b)Information on Formula Rates 6
108-109Important Changes During the Year 7
110-113Comparative Balance Sheet 8
114-117Statement of Income for the Year 9
118-119Statement of Retained Earnings for the Year 10
120-121Statement of Cash Flows 11
122-123Notes to Financial Statements 12
122(a)(b)Statement of Accum Comp Income, Comp Income, and Hedging Activities 13
200-201Summary of Utility Plant & Accumulated Provisions for Dep, Amort & Dep 14
NA202-203Nuclear Fuel Materials 15
204-207Electric Plant in Service 16
None213Electric Plant Leased to Others 17
None214Electric Plant Held for Future Use 18
216Construction Work in Progress-Electric 19
219Accumulated Provision for Depreciation of Electric Utility Plant 20
224-225Investment of Subsidiary Companies 21
227Materials and Supplies 22
228(ab)-229(ab)Allowances 23
None230Extraordinary Property Losses 24
None230Unrecovered Plant and Regulatory Study Costs 25
231Transmission Service and Generation Interconnection Study Costs 26
232Other Regulatory Assets 27
233Miscellaneous Deferred Debits 28
234Accumulated Deferred Income Taxes 29
250-251Capital Stock 30
253Other Paid-in Capital 31
254Capital Stock Expense 32
256-257Long-Term Debt 33
261Reconciliation of Reported Net Income with Taxable Inc for Fed Inc Tax 34
262-263Taxes Accrued, Prepaid and Charged During the Year 35
266-267Accumulated Deferred Investment Tax Credits 36
FERC FORM NO. 1 (ED. 12-96) Page 2
20170505-8016 FERC PDF (Unofficial) 04/07/2017
LIST OF SCHEDULES (Electric Utility) (continued)
Name of Respondent This Report Is:(1) An Original
(2) A Resubmission
Date of Report(Mo, Da, Yr)
Year/Period of Report
End ofWestar Energy, Inc.X
/ /2016/Q4
Line
No.
Title of Schedule Reference
Page No.
Remarks
(c)(b)(a)
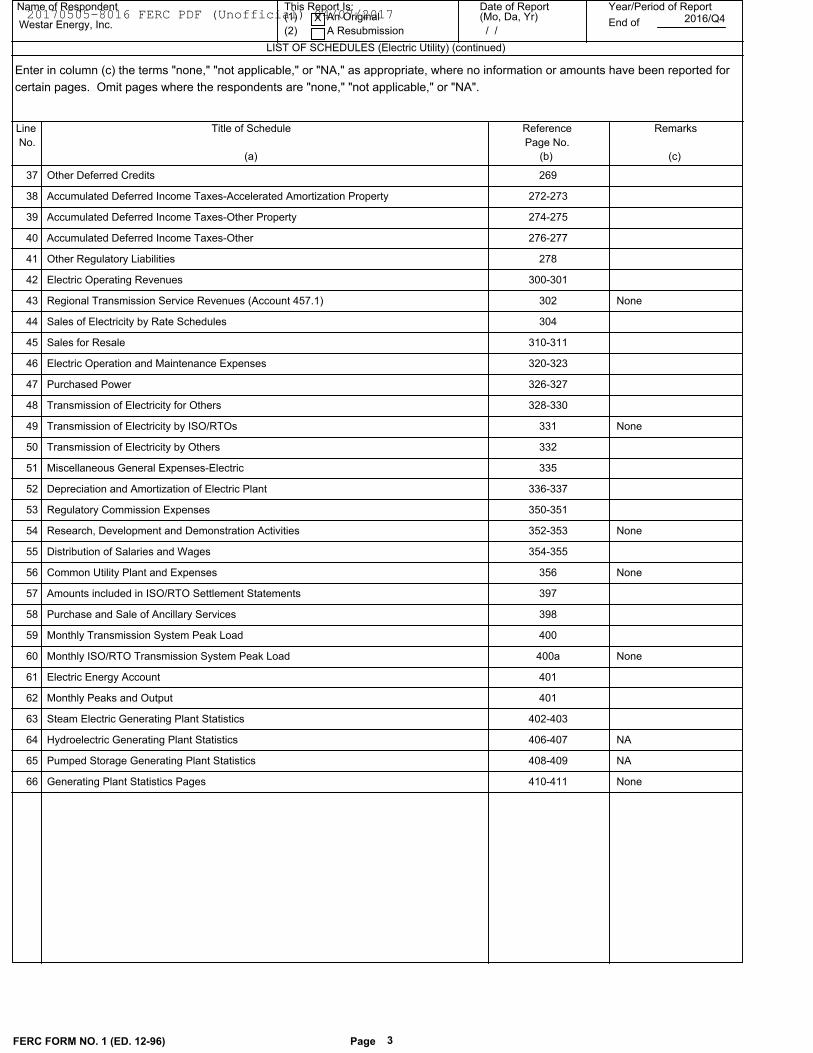
Enter in column (c) the terms "none," "not applicable," or "NA," as appropriate, where no information or amounts have been reported for
certain pages. Omit pages where the respondents are "none," "not applicable," or "NA".
269Other Deferred Credits 37
272-273Accumulated Deferred Income Taxes-Accelerated Amortization Property 38
274-275Accumulated Deferred Income Taxes-Other Property 39
276-277Accumulated Deferred Income Taxes-Other 40
278Other Regulatory Liabilities 41
300-301Electric Operating Revenues 42
None302Regional Transmission Service Revenues (Account 457.1) 43
304Sales of Electricity by Rate Schedules 44
310-311Sales for Resale 45
320-323Electric Operation and Maintenance Expenses 46
326-327Purchased Power 47
328-330Transmission of Electricity for Others 48
None331Transmission of Electricity by ISO/RTOs 49
332Transmission of Electricity by Others 50
335Miscellaneous General Expenses-Electric 51
336-337Depreciation and Amortization of Electric Plant 52
350-351Regulatory Commission Expenses 53
None352-353Research, Development and Demonstration Activities 54
354-355Distribution of Salaries and Wages 55
None356Common Utility Plant and Expenses 56
397Amounts included in ISO/RTO Settlement Statements 57
398Purchase and Sale of Ancillary Services 58
400Monthly Transmission System Peak Load 59
None400aMonthly ISO/RTO Transmission System Peak Load 60
401Electric Energy Account 61
401Monthly Peaks and Output 62
402-403Steam Electric Generating Plant Statistics 63
NA406-407Hydroelectric Generating Plant Statistics 64
NA408-409Pumped Storage Generating Plant Statistics 65
None410-411Generating Plant Statistics Pages 66
FERC FORM NO. 1 (ED. 12-96) Page 3
20170505-8016 FERC PDF (Unofficial) 04/07/2017
LIST OF SCHEDULES (Electric Utility) (continued)
Name of Respondent This Report Is:(1) An Original
(2) A Resubmission
Date of Report(Mo, Da, Yr)
Year/Period of Report
End ofWestar Energy, Inc.X
/ /2016/Q4
Line
No.
Title of Schedule Reference
Page No.
Remarks
(c)(b)(a)
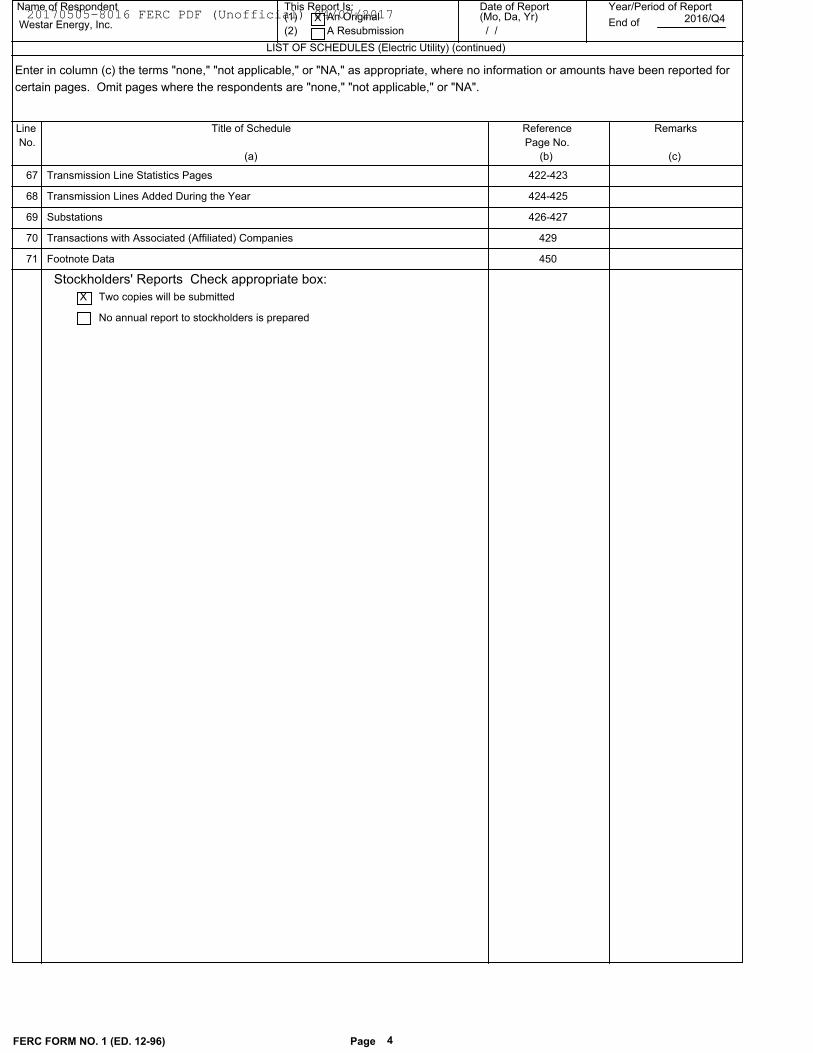
Enter in column (c) the terms "none," "not applicable," or "NA," as appropriate, where no information or amounts have been reported for
certain pages. Omit pages where the respondents are "none," "not applicable," or "NA".
422-423Transmission Line Statistics Pages 67
424-425Transmission Lines Added During the Year 68
426-427Substations 69
429Transactions with Associated (Affiliated) Companies 70
450Footnote Data 71
Stockholders' Reports Check appropriate box:
X Two copies will be submitted
No annual report to stockholders is prepared
FERC FORM NO. 1 (ED. 12-96) Page 4
20170505-8016 FERC PDF (Unofficial) 04/07/2017
Name of Respondent This Report Is:
(1) An Original
(2) A Resubmission
Date of Report(Mo, Da, Yr)
Year/Period of Report
End of
GENERAL INFORMATION
Westar Energy, Inc. X
/ /2016/Q4
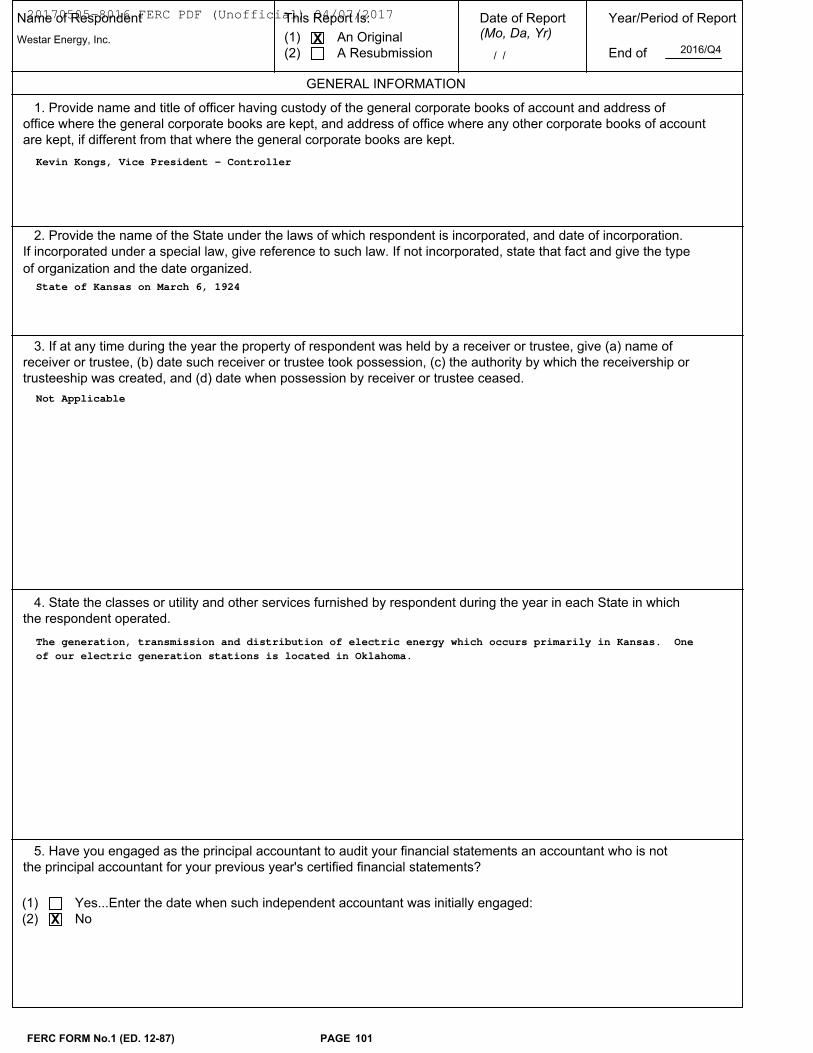
State of Kansas on March 6, 1924
Kevin Kongs, Vice President - Controller
1. Provide name and title of officer having custody of the general corporate books of account and address of
office where the general corporate books are kept, and address of office where any other corporate books of account
are kept, if different from that where the general corporate books are kept.
2. Provide the name of the State under the laws of which respondent is incorporated, and date of incorporation.
If incorporated under a special law, give reference to such law. If not incorporated, state that fact and give the type
of organization and the date organized.
3. If at any time during the year the property of respondent was held by a receiver or trustee, give (a) name of
receiver or trustee, (b) date such receiver or trustee took possession, (c) the authority by which the receivership or
trusteeship was created, and (d) date when possession by receiver or trustee ceased.
4. State the classes or utility and other services furnished by respondent during the year in each State in which
the respondent operated.
5. Have you engaged as the principal accountant to audit your financial statements an accountant who is not
the principal accountant for your previous year's certified financial statements?
(1) Yes...Enter the date when such independent accountant was initially engaged:
(2) NoX
Not Applicable
The generation, transmission and distribution of electric energy which occurs primarily in Kansas. One
of our electric generation stations is located in Oklahoma.
FERC FORM No.1 (ED. 12-87) PAGE 101
20170505-8016 FERC PDF (Unofficial) 04/07/2017
Name of Respondent This Report Is:
(1) An Original
(2) A Resubmission
Date of Report(Mo, Da, Yr)
Year/Period of Report
End of
CONTROL OVER RESPONDENT
Westar Energy, Inc. X
/ /2016/Q4
1. If any corporation, business trust, or similar organization or a combination of such organizations jointly held
control over the repondent at the end of the year, state name of controlling corporation or organization, manner inwhich control was held, and extent of control. If control was in a holding company organization, show the chain
of ownership or control to the main parent company or organization. If control was held by a trustee(s), state name of trustee(s), name of beneficiary or beneficiearies for whom trust was maintained, and purpose of the trust.
Page 102FERC FORM NO. 1 (ED. 12-96)
20170505-8016 FERC PDF (Unofficial) 04/07/2017
Name of Respondent This Report Is:(1) An Original
(2) A Resubmission
Date of Report(Mo, Da, Yr)
Year/Period of Report
End of
CORPORATIONS CONTROLLED BY RESPONDENT
Westar Energy, Inc.X
/ /2016/Q4
Line
No.
Name of Company Controlled Kind of Business Percent VotingStock Owned
(c)(b)(a)
FootnoteRef.(d)
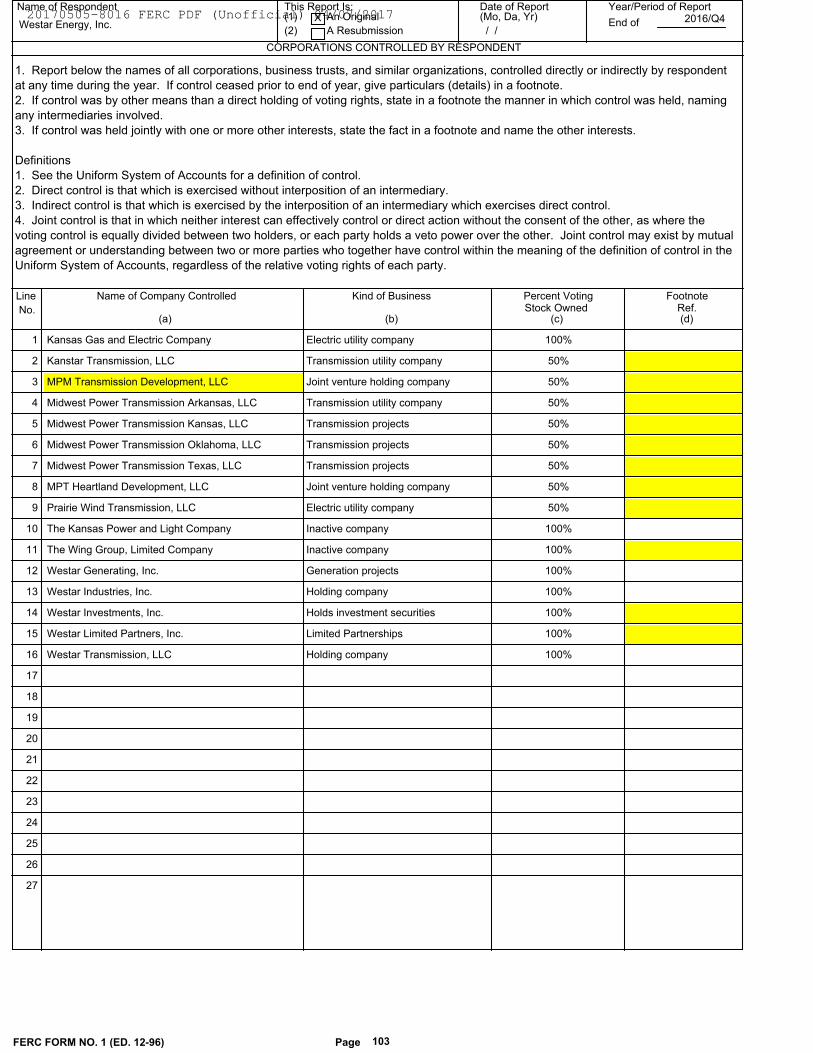
1. Report below the names of all corporations, business trusts, and similar organizations, controlled directly or indirectly by respondent
at any time during the year. If control ceased prior to end of year, give particulars (details) in a footnote.
2. If control was by other means than a direct holding of voting rights, state in a footnote the manner in which control was held, naming
any intermediaries involved.
3. If control was held jointly with one or more other interests, state the fact in a footnote and name the other interests.
Definitions
1. See the Uniform System of Accounts for a definition of control.
2. Direct control is that which is exercised without interposition of an intermediary.
3. Indirect control is that which is exercised by the interposition of an intermediary which exercises direct control.
4. Joint control is that in which neither interest can effectively control or direct action without the consent of the other, as where the
voting control is equally divided between two holders, or each party holds a veto power over the other. Joint control may exist by mutual
agreement or understanding between two or more parties who together have control within the meaning of the definition of control in the
Uniform System of Accounts, regardless of the relative voting rights of each party.
Electric utility company 100% 1 Kansas Gas and Electric Company
Transmission utility company 50% 2 Kanstar Transmission, LLC
Joint venture holding company 50% 3 MPM Transmission Development, LLC
Transmission utility company 50% 4 Midwest Power Transmission Arkansas, LLC
Transmission projects 50% 5 Midwest Power Transmission Kansas, LLC
Transmission projects 50% 6 Midwest Power Transmission Oklahoma, LLC
Transmission projects 50% 7 Midwest Power Transmission Texas, LLC
Joint venture holding company 50% 8 MPT Heartland Development, LLC
Electric utility company 50% 9 Prairie Wind Transmission, LLC
Inactive company 100% 10 The Kansas Power and Light Company
Inactive company 100% 11 The Wing Group, Limited Company
Generation projects 100% 12 Westar Generating, Inc.
Holding company 100% 13 Westar Industries, Inc.
Holds investment securities 100% 14 Westar Investments, Inc.
Limited Partnerships 100% 15 Westar Limited Partners, Inc.
Holding company 100% 16 Westar Transmission, LLC
17
18
19
20
21
22
23
24
25
26
27
FERC FORM NO. 1 (ED. 12-96) Page 103
20170505-8016 FERC PDF (Unofficial) 04/07/2017
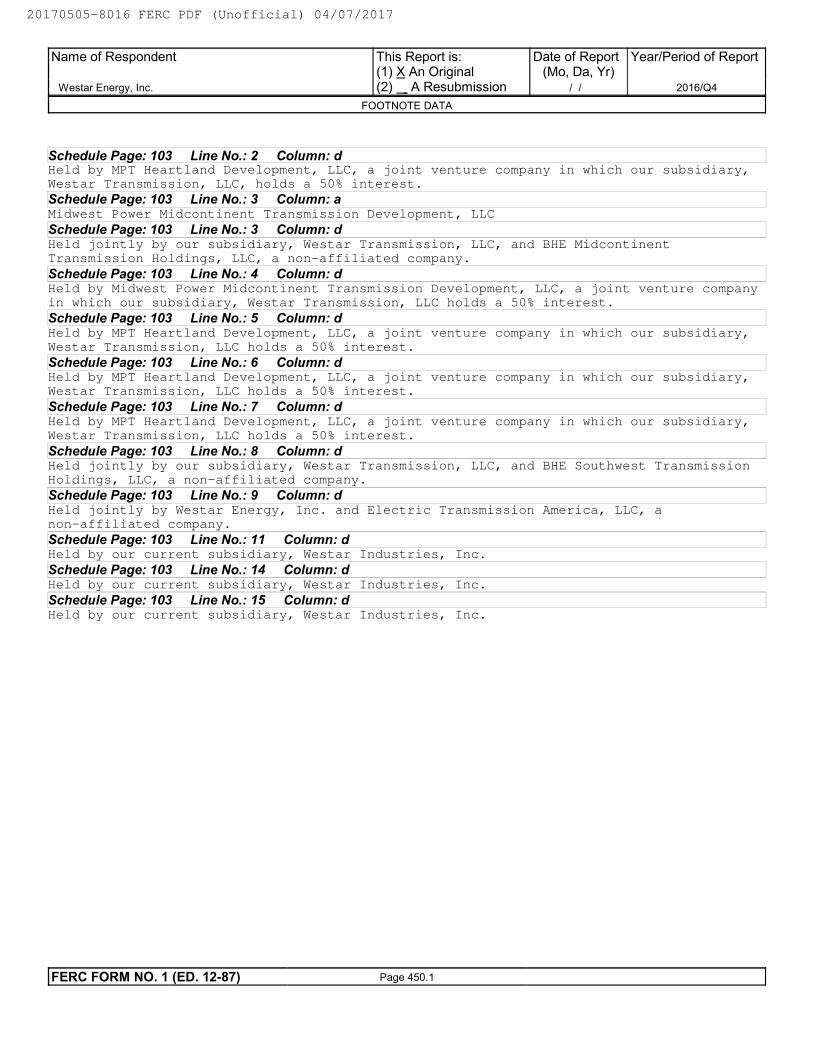
Schedule Page: 103 Line No.: 2 Column: dHeld by MPT Heartland Development, LLC, a joint venture company in which our subsidiary,
Westar Transmission, LLC, holds a 50% interest.
Schedule Page: 103 Line No.: 3 Column: aMidwest Power Midcontinent Transmission Development, LLC
Schedule Page: 103 Line No.: 3 Column: dHeld jointly by our subsidiary, Westar Transmission, LLC, and BHE Midcontinent
Transmission Holdings, LLC, a non-affiliated company.
Schedule Page: 103 Line No.: 4 Column: dHeld by Midwest Power Midcontinent Transmission Development, LLC, a joint venture company
in which our subsidiary, Westar Transmission, LLC holds a 50% interest.
Schedule Page: 103 Line No.: 5 Column: dHeld by MPT Heartland Development, LLC, a joint venture company in which our subsidiary,
Westar Transmission, LLC holds a 50% interest.
Schedule Page: 103 Line No.: 6 Column: dHeld by MPT Heartland Development, LLC, a joint venture company in which our subsidiary,
Westar Transmission, LLC holds a 50% interest.
Schedule Page: 103 Line No.: 7 Column: dHeld by MPT Heartland Development, LLC, a joint venture company in which our subsidiary,
Westar Transmission, LLC holds a 50% interest.
Schedule Page: 103 Line No.: 8 Column: dHeld jointly by our subsidiary, Westar Transmission, LLC, and BHE Southwest Transmission
Holdings, LLC, a non-affiliated company.
Schedule Page: 103 Line No.: 9 Column: dHeld jointly by Westar Energy, Inc. and Electric Transmission America, LLC, a
non-affiliated company.
Schedule Page: 103 Line No.: 11 Column: dHeld by our current subsidiary, Westar Industries, Inc.
Schedule Page: 103 Line No.: 14 Column: dHeld by our current subsidiary, Westar Industries, Inc.
Schedule Page: 103 Line No.: 15 Column: dHeld by our current subsidiary, Westar Industries, Inc.
Name of Respondent
Westar Energy, Inc.
This Report is:(1) X An Original(2) A Resubmission
Date of Report(Mo, Da, Yr)
/ /
Year/Period of Report
2016/Q4
FOOTNOTE DATA
FERC FORM NO. 1 (ED. 12-87) Page 450.1
20170505-8016 FERC PDF (Unofficial) 04/07/2017
Name of Respondent This Report Is:(1) An Original
(2) A Resubmission
Date of Report(Mo, Da, Yr)
Year/Period of Report
End of
OFFICERS
Westar Energy, Inc.X
/ /2016/Q4
Line
No.
Title Name of Officer Salaryfor Year
(c)(b)(a)
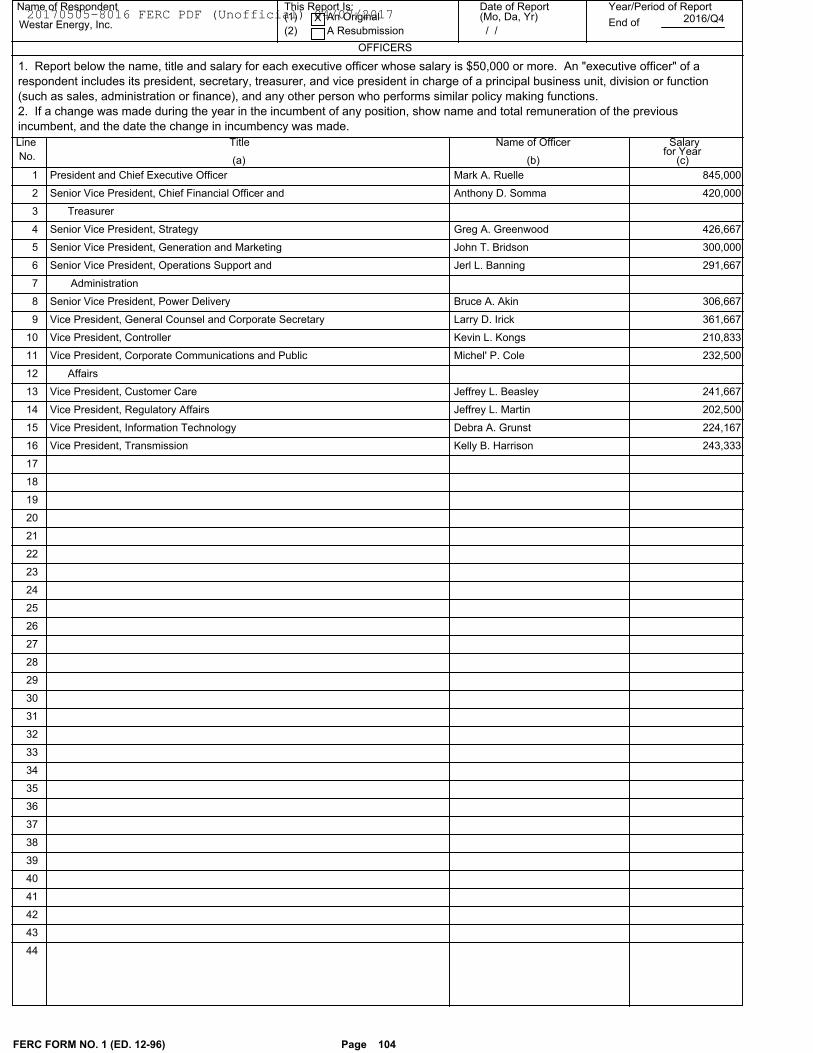
1. Report below the name, title and salary for each executive officer whose salary is $50,000 or more. An "executive officer" of a
respondent includes its president, secretary, treasurer, and vice president in charge of a principal business unit, division or function
(such as sales, administration or finance), and any other person who performs similar policy making functions.
2. If a change was made during the year in the incumbent of any position, show name and total remuneration of the previous
incumbent, and the date the change in incumbency was made.
President and Chief Executive Officer 845,000Mark A. Ruelle 1
Senior Vice President, Chief Financial Officer and 420,000Anthony D. Somma 2
Treasurer 3
Senior Vice President, Strategy 426,667Greg A. Greenwood 4
Senior Vice President, Generation and Marketing 300,000John T. Bridson 5
Senior Vice President, Operations Support and 291,667Jerl L. Banning 6
Administration 7
Senior Vice President, Power Delivery 306,667Bruce A. Akin 8
Vice President, General Counsel and Corporate Secretary 361,667Larry D. Irick 9
Vice President, Controller 210,833Kevin L. Kongs 10
Vice President, Corporate Communications and Public 232,500Michel' P. Cole 11
Affairs 12
Vice President, Customer Care 241,667Jeffrey L. Beasley 13
Vice President, Regulatory Affairs 202,500Jeffrey L. Martin 14
Vice President, Information Technology 224,167Debra A. Grunst 15
Vice President, Transmission 243,333Kelly B. Harrison 16
17
18
19
20
21
22
23
24
25
26
27
28
29
30
31
32
33
34
35
36
37
38
39
40
41
42
43
44
FERC FORM NO. 1 (ED. 12-96) Page 104
20170505-8016 FERC PDF (Unofficial) 04/07/2017
Name of Respondent This Report Is:(1) An Original
(2) A Resubmission
Date of Report(Mo, Da, Yr)
Year/Period of Report
End of
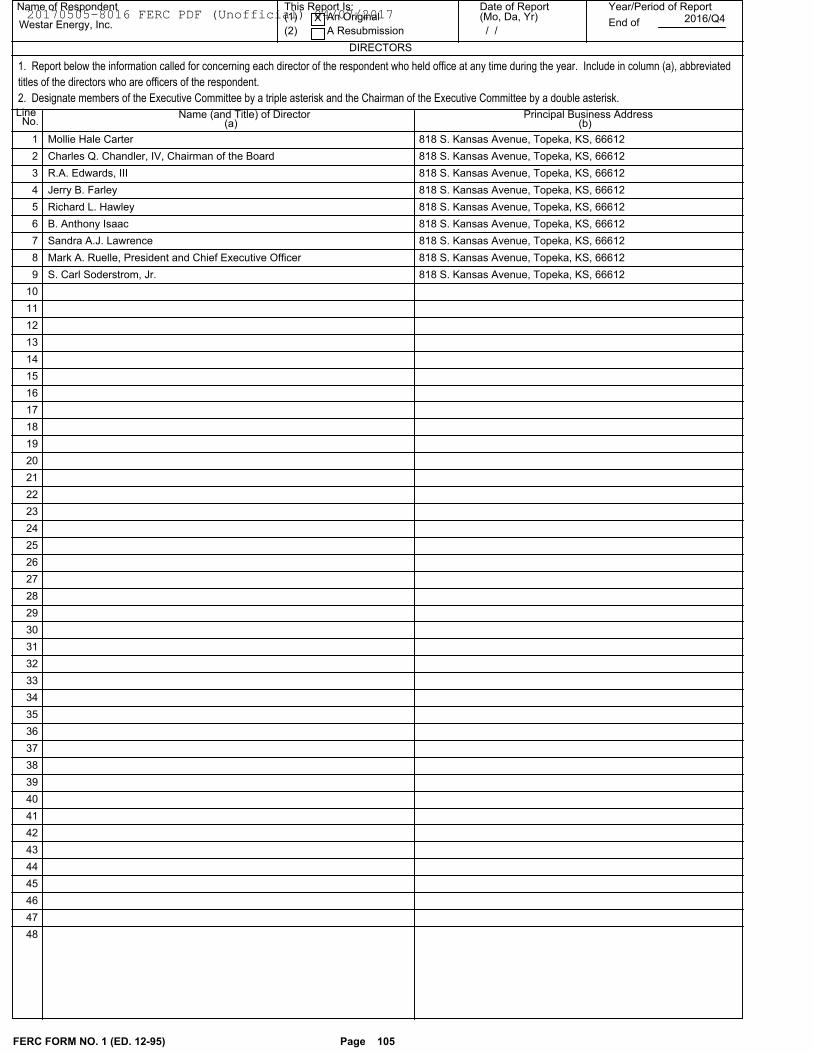
DIRECTORS
Westar Energy, Inc.X
/ /2016/Q4
Line Name (and Title) of Director Principal Business Address(b)(a)No.
1. Report below the information called for concerning each director of the respondent who held office at any time during the year. Include in column (a), abbreviated
titles of the directors who are officers of the respondent.
2. Designate members of the Executive Committee by a triple asterisk and the Chairman of the Executive Committee by a double asterisk.
818 S. Kansas Avenue, Topeka, KS, 66612Mollie Hale Carter 1
818 S. Kansas Avenue, Topeka, KS, 66612Charles Q. Chandler, IV, Chairman of the Board 2
818 S. Kansas Avenue, Topeka, KS, 66612R.A. Edwards, III 3
818 S. Kansas Avenue, Topeka, KS, 66612Jerry B. Farley 4
818 S. Kansas Avenue, Topeka, KS, 66612Richard L. Hawley 5
818 S. Kansas Avenue, Topeka, KS, 66612B. Anthony Isaac 6
818 S. Kansas Avenue, Topeka, KS, 66612Sandra A.J. Lawrence 7
818 S. Kansas Avenue, Topeka, KS, 66612Mark A. Ruelle, President and Chief Executive Officer 8
818 S. Kansas Avenue, Topeka, KS, 66612S. Carl Soderstrom, Jr. 9
10
11
12
13
14
15
16
17
18
19
20
21
22
23
24
25
26
27
28
29
30
31
32
33
34
35
36
37
38
39
40
41
42
43
44
45
46
47
48
FERC FORM NO. 1 (ED. 12-95) Page 105
20170505-8016 FERC PDF (Unofficial) 04/07/2017
Name of Respondent This Report Is:(1) An Original
(2) A Resubmission
Date of Report(Mo, Da, Yr)
Year/Period of Report
End of
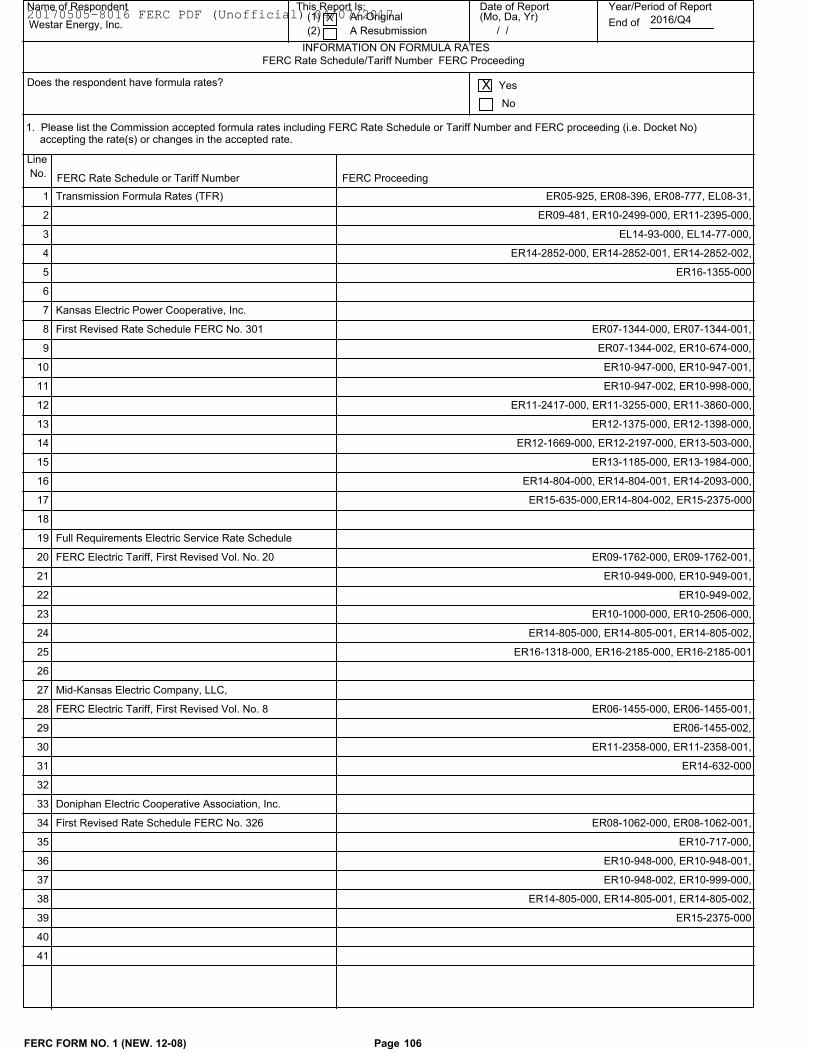
INFORMATION ON FORMULA RATES
Westar Energy, Inc.X
/ /2016/Q4
Line
No. FERC Rate Schedule or Tariff Number FERC Proceeding
Does the respondent have formula rates? Yes
No
X
1. Please list the Commission accepted formula rates including FERC Rate Schedule or Tariff Number and FERC proceeding (i.e. Docket No)accepting the rate(s) or changes in the accepted rate.
FERC Rate Schedule/Tariff Number FERC Proceeding
ER05-925, ER08-396, ER08-777, EL08-31,Transmission Formula Rates (TFR) 1
ER09-481, ER10-2499-000, ER11-2395-000, 2
EL14-93-000, EL14-77-000, 3
ER14-2852-000, ER14-2852-001, ER14-2852-002, 4
ER16-1355-000 5
6
Kansas Electric Power Cooperative, Inc. 7
ER07-1344-000, ER07-1344-001,First Revised Rate Schedule FERC No. 301 8
ER07-1344-002, ER10-674-000, 9
ER10-947-000, ER10-947-001, 10
ER10-947-002, ER10-998-000, 11
ER11-2417-000, ER11-3255-000, ER11-3860-000, 12
ER12-1375-000, ER12-1398-000, 13
ER12-1669-000, ER12-2197-000, ER13-503-000, 14
ER13-1185-000, ER13-1984-000, 15
ER14-804-000, ER14-804-001, ER14-2093-000, 16
ER15-635-000,ER14-804-002, ER15-2375-000 17
18
Full Requirements Electric Service Rate Schedule 19
ER09-1762-000, ER09-1762-001,FERC Electric Tariff, First Revised Vol. No. 20 20
ER10-949-000, ER10-949-001, 21
ER10-949-002, 22
ER10-1000-000, ER10-2506-000, 23
ER14-805-000, ER14-805-001, ER14-805-002, 24
ER16-1318-000, ER16-2185-000, ER16-2185-001 25
26
Mid-Kansas Electric Company, LLC, 27
ER06-1455-000, ER06-1455-001,FERC Electric Tariff, First Revised Vol. No. 8 28
ER06-1455-002, 29
ER11-2358-000, ER11-2358-001, 30
ER14-632-000 31
32
Doniphan Electric Cooperative Association, Inc. 33
ER08-1062-000, ER08-1062-001,First Revised Rate Schedule FERC No. 326 34
ER10-717-000, 35
ER10-948-000, ER10-948-001, 36
ER10-948-002, ER10-999-000, 37
ER14-805-000, ER14-805-001, ER14-805-002, 38
ER15-2375-000 39
40
41
FERC FORM NO. 1 (NEW. 12-08) Page 106
20170505-8016 FERC PDF (Unofficial) 04/07/2017
Name of Respondent This Report Is:(1) An Original
(2) A Resubmission
Date of Report(Mo, Da, Yr)
Year/Period of Report
End of
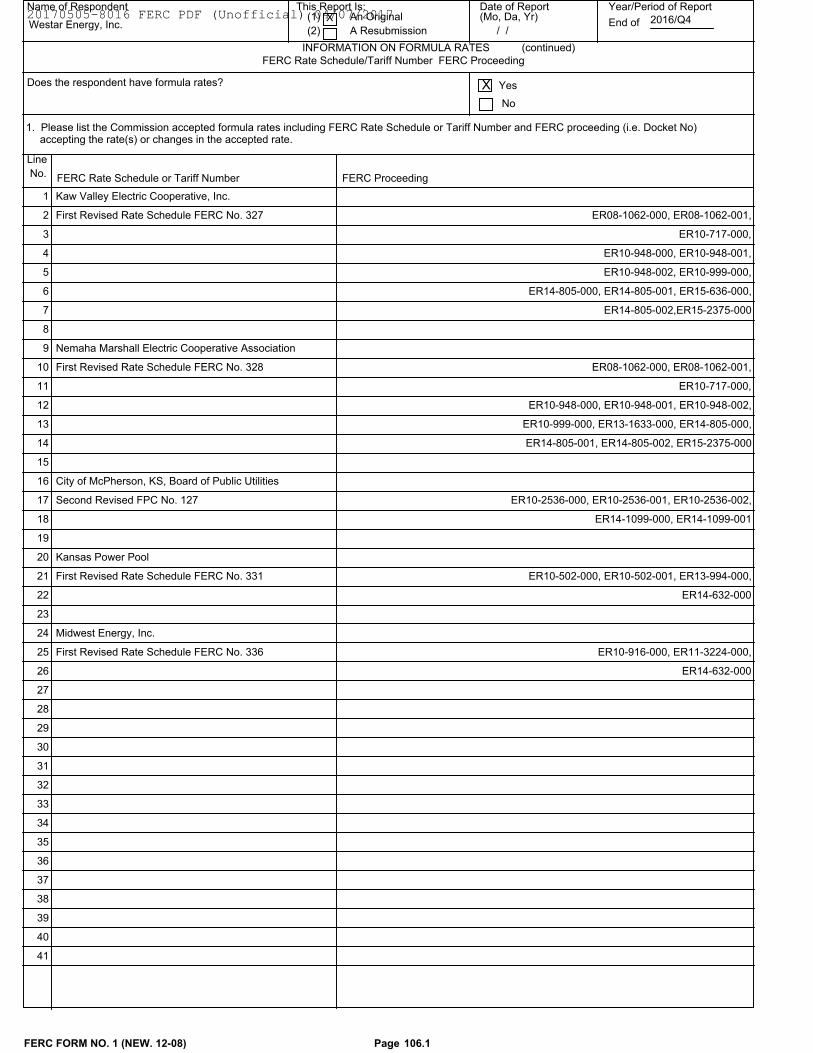
INFORMATION ON FORMULA RATES
Westar Energy, Inc.X
/ /2016/Q4
Line
No. FERC Rate Schedule or Tariff Number FERC Proceeding
(continued)
Does the respondent have formula rates? Yes
No
X
1. Please list the Commission accepted formula rates including FERC Rate Schedule or Tariff Number and FERC proceeding (i.e. Docket No)accepting the rate(s) or changes in the accepted rate.
FERC Rate Schedule/Tariff Number FERC Proceeding
Kaw Valley Electric Cooperative, Inc. 1
ER08-1062-000, ER08-1062-001,First Revised Rate Schedule FERC No. 327 2
ER10-717-000, 3
ER10-948-000, ER10-948-001, 4
ER10-948-002, ER10-999-000, 5
ER14-805-000, ER14-805-001, ER15-636-000, 6
ER14-805-002,ER15-2375-000 7
8
Nemaha Marshall Electric Cooperative Association 9
ER08-1062-000, ER08-1062-001,First Revised Rate Schedule FERC No. 328 10
ER10-717-000, 11
ER10-948-000, ER10-948-001, ER10-948-002, 12
ER10-999-000, ER13-1633-000, ER14-805-000, 13
ER14-805-001, ER14-805-002, ER15-2375-000 14
15
City of McPherson, KS, Board of Public Utilities 16
ER10-2536-000, ER10-2536-001, ER10-2536-002,Second Revised FPC No. 127 17
ER14-1099-000, ER14-1099-001 18
19
Kansas Power Pool 20
ER10-502-000, ER10-502-001, ER13-994-000,First Revised Rate Schedule FERC No. 331 21
ER14-632-000 22
23
Midwest Energy, Inc. 24
ER10-916-000, ER11-3224-000,First Revised Rate Schedule FERC No. 336 25
ER14-632-000 26
27
28
29
30
31
32
33
34
35
36
37
38
39
40
41
FERC FORM NO. 1 (NEW. 12-08) Page 106.1
20170505-8016 FERC PDF (Unofficial) 04/07/2017
Name of Respondent This Report Is:(1) An Original
(2) A Resubmission
Date of Report(Mo, Da, Yr)
Year/Period of Report
End ofWestar Energy, Inc.X
/ /2016/Q4
Line
No. \ Filed DateAccession No.
Date
Docket No. Description
Formula Rate FERC RateSchedule Number orTariff Number
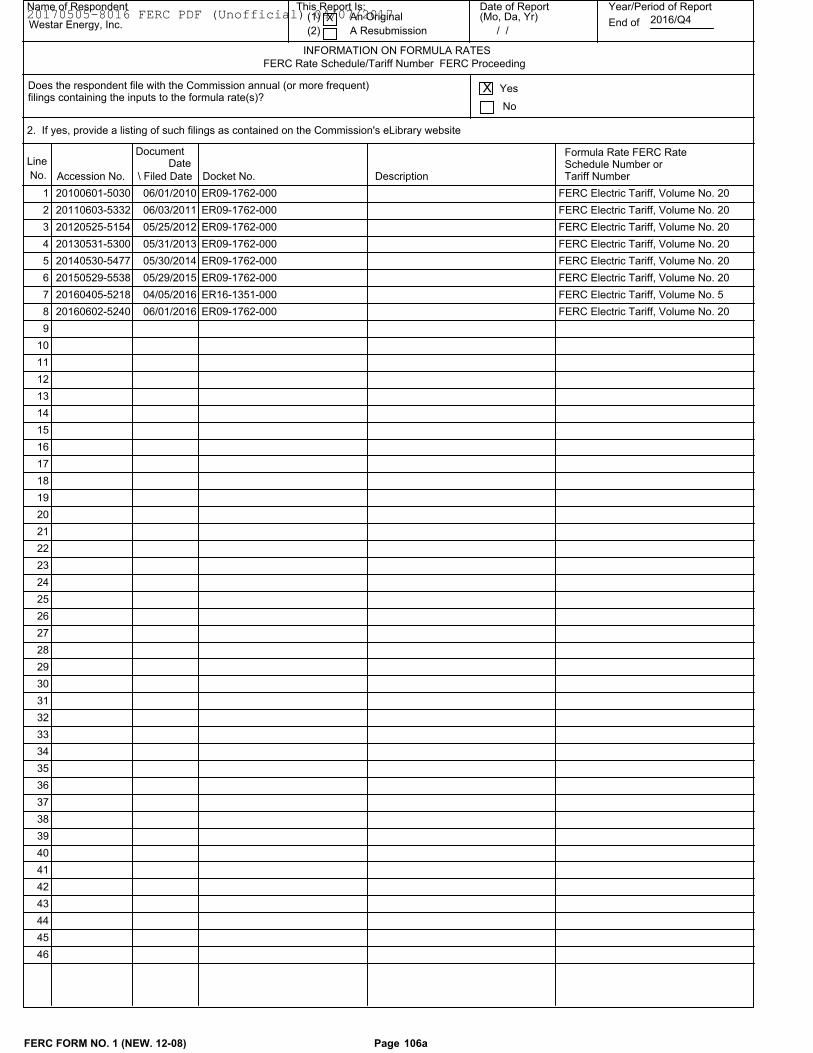
INFORMATION ON FORMULA RATES
Does the respondent file with the Commission annual (or more frequent) Yes
No
X
2. If yes, provide a listing of such filings as contained on the Commission's eLibrary website
FERC Rate Schedule/Tariff Number FERC Proceeding
filings containing the inputs to the formula rate(s)?
Document
06/01/201020100601-5030 ER09-1762-000 FERC Electric Tariff, Volume No. 20 1
06/03/201120110603-5332 ER09-1762-000 FERC Electric Tariff, Volume No. 20 2
05/25/201220120525-5154 ER09-1762-000 FERC Electric Tariff, Volume No. 20 3
05/31/201320130531-5300 ER09-1762-000 FERC Electric Tariff, Volume No. 20 4
05/30/201420140530-5477 ER09-1762-000 FERC Electric Tariff, Volume No. 20 5
05/29/201520150529-5538 ER09-1762-000 FERC Electric Tariff, Volume No. 20 6
04/05/201620160405-5218 ER16-1351-000 FERC Electric Tariff, Volume No. 5 7
06/01/201620160602-5240 ER09-1762-000 FERC Electric Tariff, Volume No. 20 8
9
10
11
12
13
14
15
16
17
18
19
20
21
22
23
24
25
26
27
28
29
30
31
32
33
34
35
36
37
38
39
40
41
42
43
44
45
46
FERC FORM NO. 1 (NEW. 12-08) Page 106a
20170505-8016 FERC PDF (Unofficial) 04/07/2017
Name of Respondent This Report Is:(1) An Original
(2) A Resubmission
Date of Report(Mo, Da, Yr)
Year/Period of Report
End ofWestar Energy, Inc.X
/ /2016/Q4
Line
No. Page No(s). Schedule Column Line No
INFORMATION ON FORMULA RATES
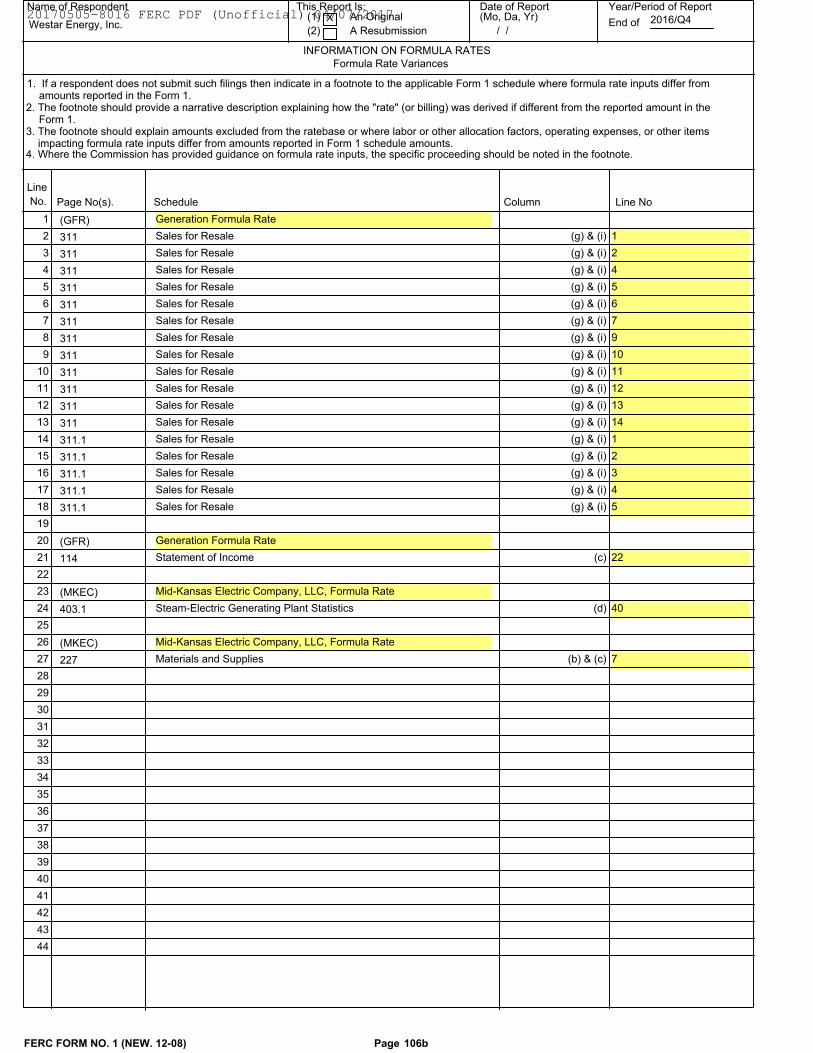
1. If a respondent does not submit such filings then indicate in a footnote to the applicable Form 1 schedule where formula rate inputs differ from
Formula Rate Variances
amounts reported in the Form 1.2. The footnote should provide a narrative description explaining how the "rate" (or billing) was derived if different from the reported amount in the
Form 1.3. The footnote should explain amounts excluded from the ratebase or where labor or other allocation factors, operating expenses, or other items
impacting formula rate inputs differ from amounts reported in Form 1 schedule amounts.4. Where the Commission has provided guidance on formula rate inputs, the specific proceeding should be noted in the footnote.
(GFR) Generation Formula Rate 1
311 Sales for Resale (g) & (i) 1 2
311 Sales for Resale (g) & (i) 2 3
311 Sales for Resale (g) & (i) 4 4
311 Sales for Resale (g) & (i) 5 5
311 Sales for Resale (g) & (i) 6 6
311 Sales for Resale (g) & (i) 7 7
311 Sales for Resale (g) & (i) 9 8
311 Sales for Resale (g) & (i) 10 9
311 Sales for Resale (g) & (i) 11 10
311 Sales for Resale (g) & (i) 12 11
311 Sales for Resale (g) & (i) 13 12
311 Sales for Resale (g) & (i) 14 13
311.1 Sales for Resale (g) & (i) 1 14
311.1 Sales for Resale (g) & (i) 2 15
311.1 Sales for Resale (g) & (i) 3 16
311.1 Sales for Resale (g) & (i) 4 17
311.1 Sales for Resale (g) & (i) 5 18
19
(GFR) Generation Formula Rate 20
114 Statement of Income (c) 22 21
22
(MKEC) Mid-Kansas Electric Company, LLC, Formula Rate 23
403.1 Steam-Electric Generating Plant Statistics (d) 40 24
25
(MKEC) Mid-Kansas Electric Company, LLC, Formula Rate 26
227 Materials and Supplies (b) & (c) 7 27
28
29
30
31
32
33
34
35
36
37
38
39
40
41
42
43
44
FERC FORM NO. 1 (NEW. 12-08) Page 106b
20170505-8016 FERC PDF (Unofficial) 04/07/2017
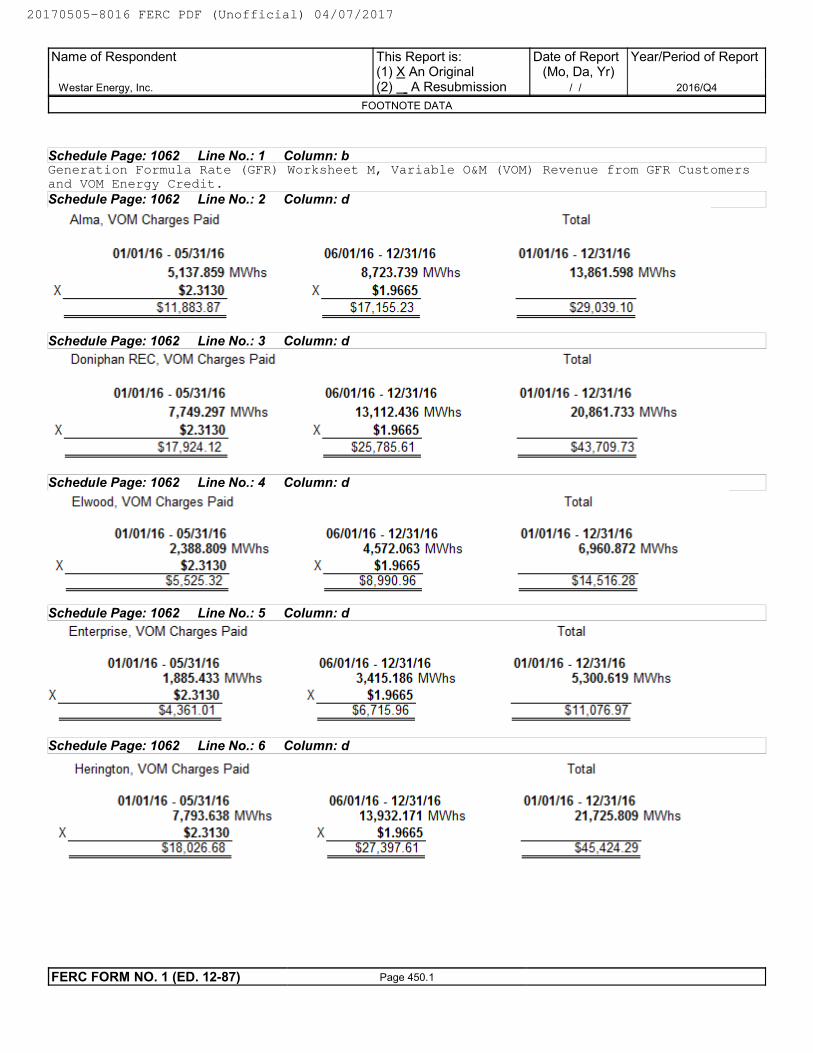
Schedule Page: 1062 Line No.: 1 Column: bGeneration Formula Rate (GFR) Worksheet M, Variable O&M (VOM) Revenue from GFR Customersand VOM Energy Credit.
Schedule Page: 1062 Line No.: 2 Column: d
Schedule Page: 1062 Line No.: 3 Column: d
Schedule Page: 1062 Line No.: 4 Column: d
Schedule Page: 1062 Line No.: 5 Column: d
Schedule Page: 1062 Line No.: 6 Column: d
Name of Respondent
Westar Energy, Inc.
This Report is:(1) X An Original(2) A Resubmission
Date of Report(Mo, Da, Yr)
/ /
Year/Period of Report
2016/Q4
FOOTNOTE DATA
FERC FORM NO. 1 (ED. 12-87) Page 450.1
20170505-8016 FERC PDF (Unofficial) 04/07/2017
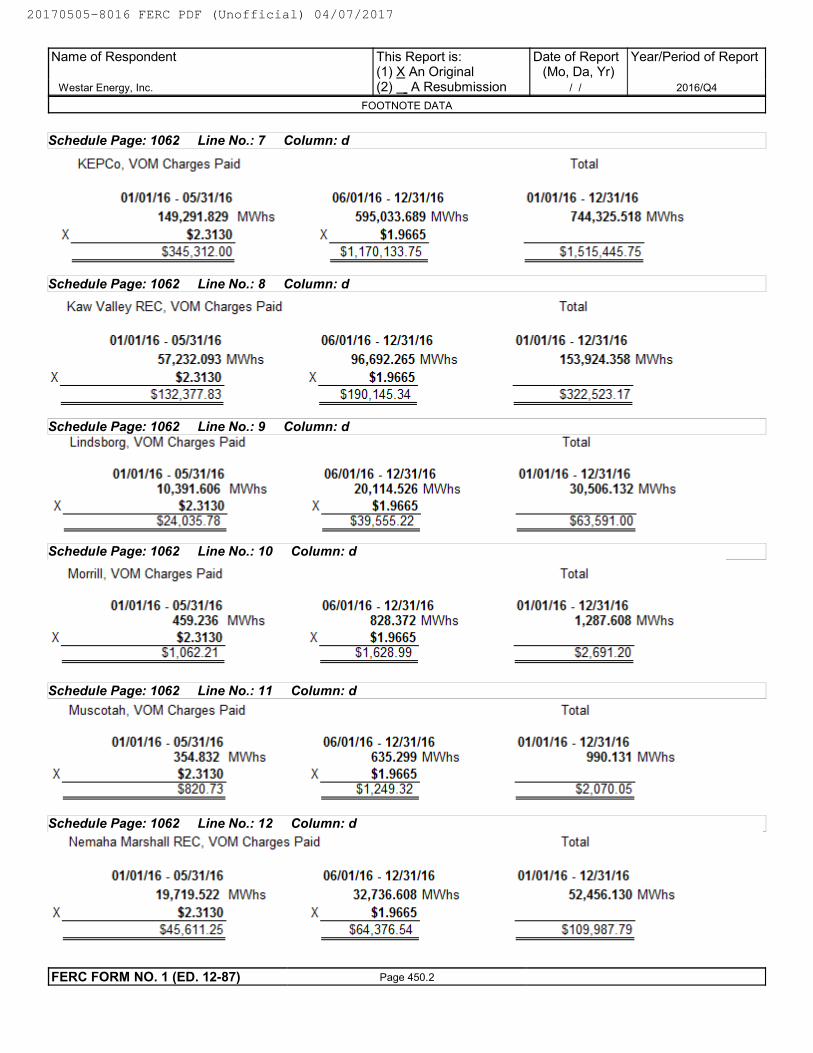
Schedule Page: 1062 Line No.: 7 Column: d
Schedule Page: 1062 Line No.: 8 Column: d
Schedule Page: 1062 Line No.: 9 Column: d
Schedule Page: 1062 Line No.: 10 Column: d
Schedule Page: 1062 Line No.: 11 Column: d
Schedule Page: 1062 Line No.: 12 Column: d
Name of Respondent
Westar Energy, Inc.
This Report is:(1) X An Original(2) A Resubmission
Date of Report(Mo, Da, Yr)
/ /
Year/Period of Report
2016/Q4
FOOTNOTE DATA
FERC FORM NO. 1 (ED. 12-87) Page 450.2
20170505-8016 FERC PDF (Unofficial) 04/07/2017
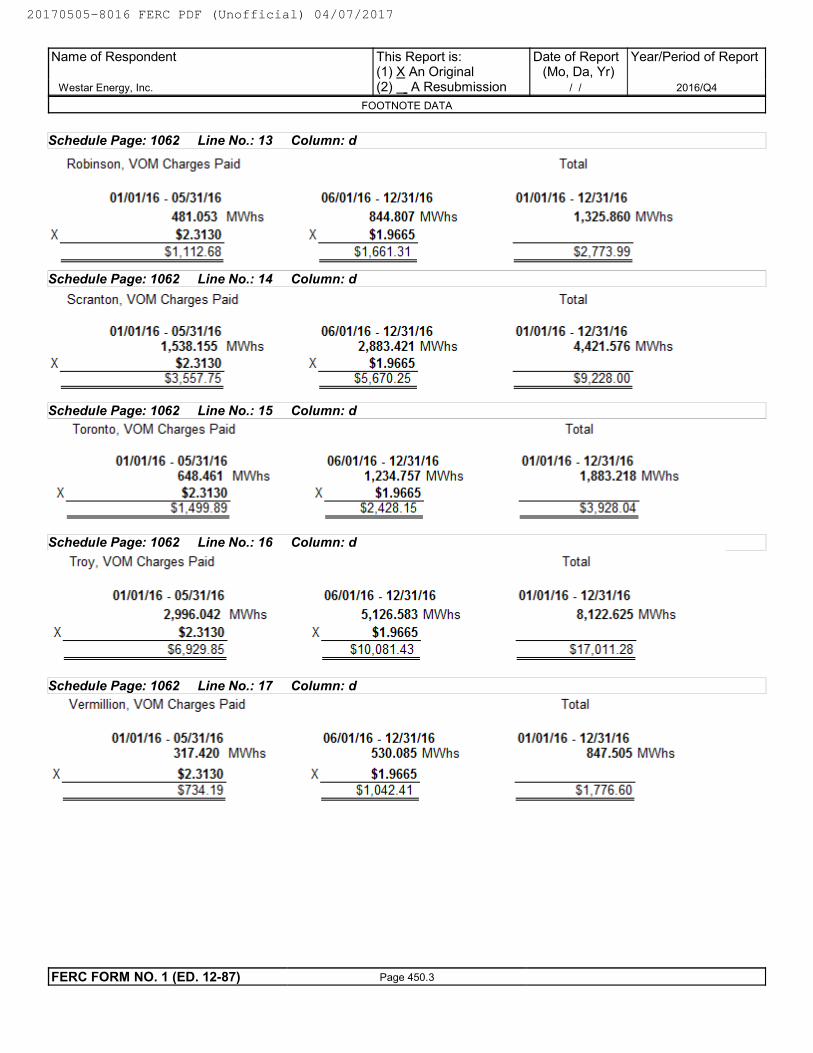
Schedule Page: 1062 Line No.: 13 Column: d
Schedule Page: 1062 Line No.: 14 Column: d
Schedule Page: 1062 Line No.: 15 Column: d
Schedule Page: 1062 Line No.: 16 Column: d
Schedule Page: 1062 Line No.: 17 Column: d
Name of Respondent
Westar Energy, Inc.
This Report is:(1) X An Original(2) A Resubmission
Date of Report(Mo, Da, Yr)
/ /
Year/Period of Report
2016/Q4
FOOTNOTE DATA
FERC FORM NO. 1 (ED. 12-87) Page 450.3
20170505-8016 FERC PDF (Unofficial) 04/07/2017
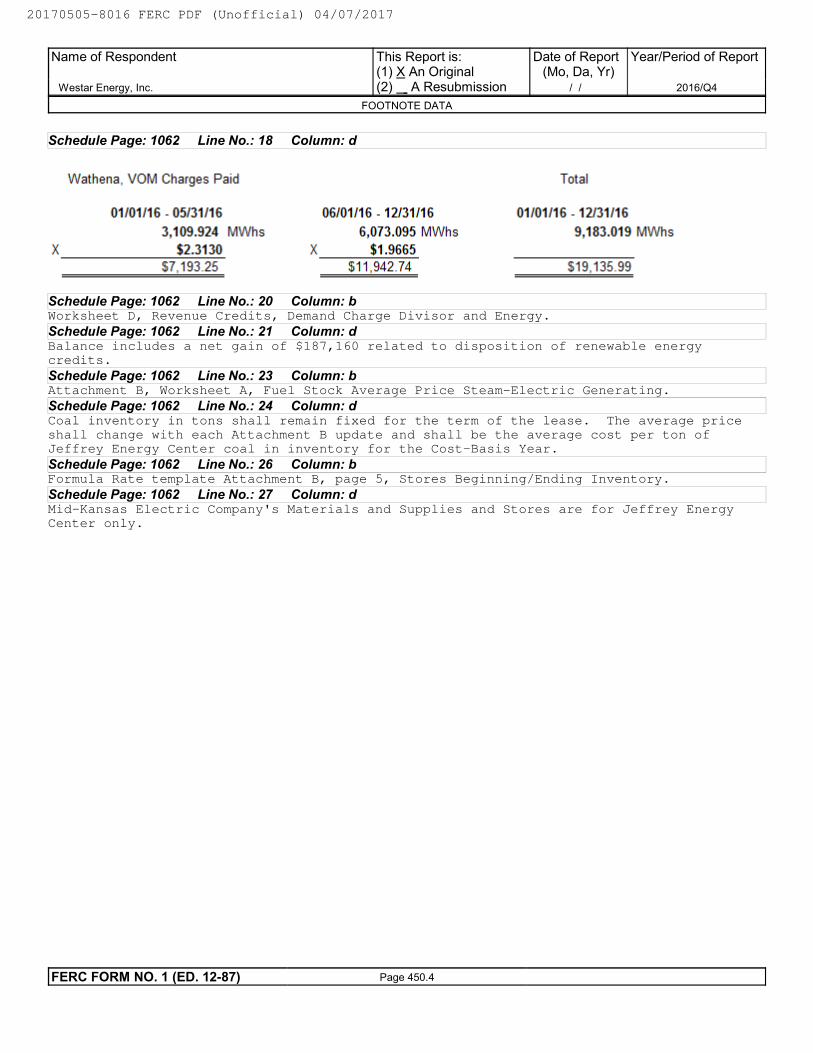
Schedule Page: 1062 Line No.: 18 Column: d
Schedule Page: 1062 Line No.: 20 Column: bWorksheet D, Revenue Credits, Demand Charge Divisor and Energy.
Schedule Page: 1062 Line No.: 21 Column: dBalance includes a net gain of $187,160 related to disposition of renewable energycredits.
Schedule Page: 1062 Line No.: 23 Column: bAttachment B, Worksheet A, Fuel Stock Average Price Steam-Electric Generating.
Schedule Page: 1062 Line No.: 24 Column: dCoal inventory in tons shall remain fixed for the term of the lease. The average priceshall change with each Attachment B update and shall be the average cost per ton ofJeffrey Energy Center coal in inventory for the Cost-Basis Year.
Schedule Page: 1062 Line No.: 26 Column: bFormula Rate template Attachment B, page 5, Stores Beginning/Ending Inventory.
Schedule Page: 1062 Line No.: 27 Column: dMid-Kansas Electric Company's Materials and Supplies and Stores are for Jeffrey EnergyCenter only.
Name of Respondent
Westar Energy, Inc.
This Report is:(1) X An Original(2) A Resubmission
Date of Report(Mo, Da, Yr)
/ /
Year/Period of Report
2016/Q4
FOOTNOTE DATA
FERC FORM NO. 1 (ED. 12-87) Page 450.4
20170505-8016 FERC PDF (Unofficial) 04/07/2017
Name of Respondent This Report Is:(1) An Original
(2) A Resubmission
Date of Report Year/Period of Report
End of
IMPORTANT CHANGES DURING THE QUARTER/YEAR
Westar Energy, Inc. X / /
2016/Q4
PAGE 108 INTENTIONALLY LEFT BLANK
SEE PAGE 109 FOR REQUIRED INFORMATION.
Give particulars (details) concerning the matters indicated below. Make the statements explicit and precise, and number them in
accordance with the inquiries. Each inquiry should be answered. Enter "none," "not applicable," or "NA" where applicable. If
information which answers an inquiry is given elsewhere in the report, make a reference to the schedule in which it appears.
1. Changes in and important additions to franchise rights: Describe the actual consideration given therefore and state from whom the
franchise rights were acquired. If acquired without the payment of consideration, state that fact.
2. Acquisition of ownership in other companies by reorganization, merger, or consolidation with other companies: Give names of
companies involved, particulars concerning the transactions, name of the Commission authorizing the transaction, and reference to
Commission authorization.
3. Purchase or sale of an operating unit or system: Give a brief description of the property, and of the transactions relating thereto,
and reference to Commission authorization, if any was required. Give date journal entries called for by the Uniform System of Accounts
were submitted to the Commission.
4. Important leaseholds (other than leaseholds for natural gas lands) that have been acquired or given, assigned or surrendered: Give
effective dates, lengths of terms, names of parties, rents, and other condition. State name of Commission authorizing lease and give
reference to such authorization.
5. Important extension or reduction of transmission or distribution system: State territory added or relinquished and date operations
began or ceased and give reference to Commission authorization, if any was required. State also the approximate number of
customers added or lost and approximate annual revenues of each class of service. Each natural gas company must also state major
new continuing sources of gas made available to it from purchases, development, purchase contract or otherwise, giving location and
approximate total gas volumes available, period of contracts, and other parties to any such arrangements, etc.
6. Obligations incurred as a result of issuance of securities or assumption of liabilities or guarantees including issuance of short-term
debt and commercial paper having a maturity of one year or less. Give reference to FERC or State Commission authorization, as
appropriate, and the amount of obligation or guarantee.
7. Changes in articles of incorporation or amendments to charter: Explain the nature and purpose of such changes or amendments.
8. State the estimated annual effect and nature of any important wage scale changes during the year.
9. State briefly the status of any materially important legal proceedings pending at the end of the year, and the results of any such
proceedings culminated during the year.
10. Describe briefly any materially important transactions of the respondent not disclosed elsewhere in this report in which an officer,
director, security holder reported on Page 104 or 105 of the Annual Report Form No. 1, voting trustee, associated company or known
associate of any of these persons was a party or in which any such person had a material interest.
11. (Reserved.)
12. If the important changes during the year relating to the respondent company appearing in the annual report to stockholders are
applicable in every respect and furnish the data required by Instructions 1 to 11 above, such notes may be included on this page.
13. Describe fully any changes in officers, directors, major security holders and voting powers of the respondent that may have
occurred during the reporting period.
14. In the event that the respondent participates in a cash management program(s) and its proprietary capital ratio is less than 30
percent please describe the significant events or transactions causing the proprietary capital ratio to be less than 30 percent, and the
extent to which the respondent has amounts loaned or money advanced to its parent, subsidiary, or affiliated companies through a
cash management program(s). Additionally, please describe plans, if any to regain at least a 30 percent proprietary ratio.
FERC FORM NO. 1 (ED. 12-96) Page 108
20170505-8016 FERC PDF (Unofficial) 04/07/2017
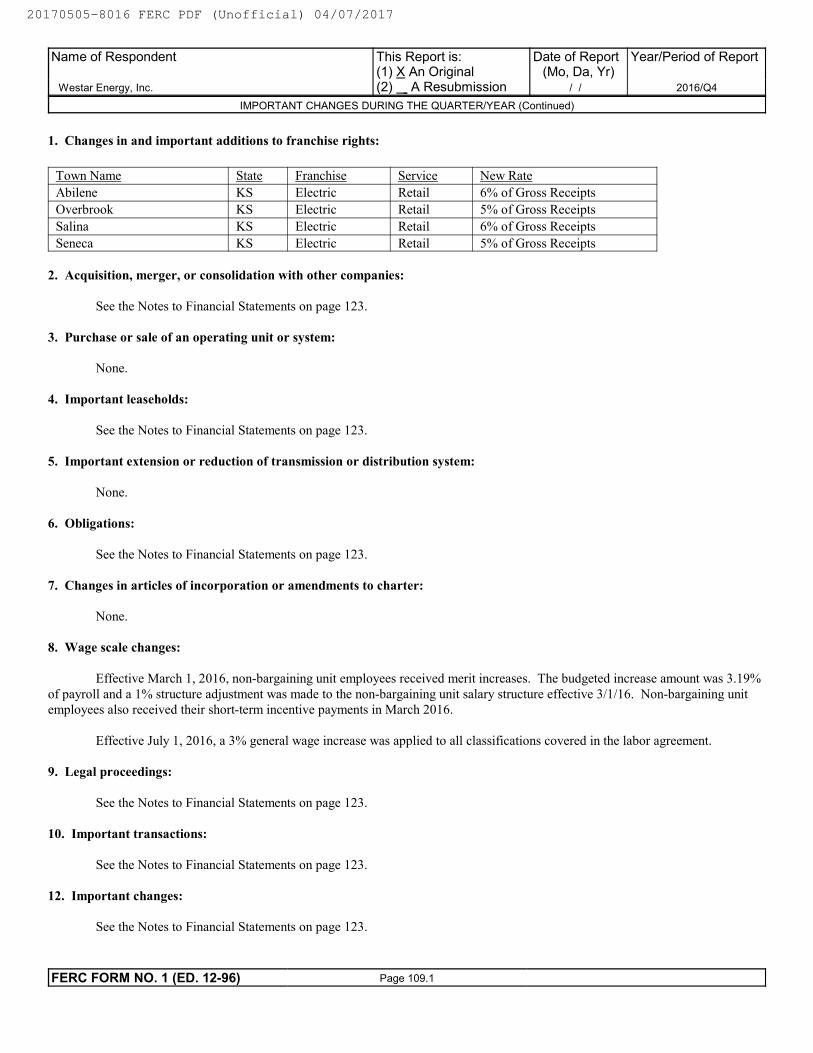
1. Changes in and important additions to franchise rights:
Town Name State Franchise Service New Rate
Abilene KS Electric Retail 6% of Gross Receipts
Overbrook KS Electric Retail 5% of Gross Receipts
Salina KS Electric Retail 6% of Gross Receipts
Seneca KS Electric Retail 5% of Gross Receipts
2. Acquisition, merger, or consolidation with other companies:
See the Notes to Financial Statements on page 123.
3. Purchase or sale of an operating unit or system:
None.
4. Important leaseholds:
See the Notes to Financial Statements on page 123.
5. Important extension or reduction of transmission or distribution system:
None.
6. Obligations:
See the Notes to Financial Statements on page 123.
7. Changes in articles of incorporation or amendments to charter:
None.
8. Wage scale changes:
Effective March 1, 2016, non-bargaining unit employees received merit increases. The budgeted increase amount was 3.19%
of payroll and a 1% structure adjustment was made to the non-bargaining unit salary structure effective 3/1/16. Non-bargaining unit
employees also received their short-term incentive payments in March 2016.
Effective July 1, 2016, a 3% general wage increase was applied to all classifications covered in the labor agreement.
9. Legal proceedings:
See the Notes to Financial Statements on page 123.
10. Important transactions:
See the Notes to Financial Statements on page 123.
12. Important changes:
See the Notes to Financial Statements on page 123.
Name of Respondent
Westar Energy, Inc.
This Report is:(1) X An Original(2) A Resubmission
Date of Report(Mo, Da, Yr)
/ /
Year/Period of Report
2016/Q4
IMPORTANT CHANGES DURING THE QUARTER/YEAR (Continued)
FERC FORM NO. 1 (ED. 12-96) Page 109.1
20170505-8016 FERC PDF (Unofficial) 04/07/2017
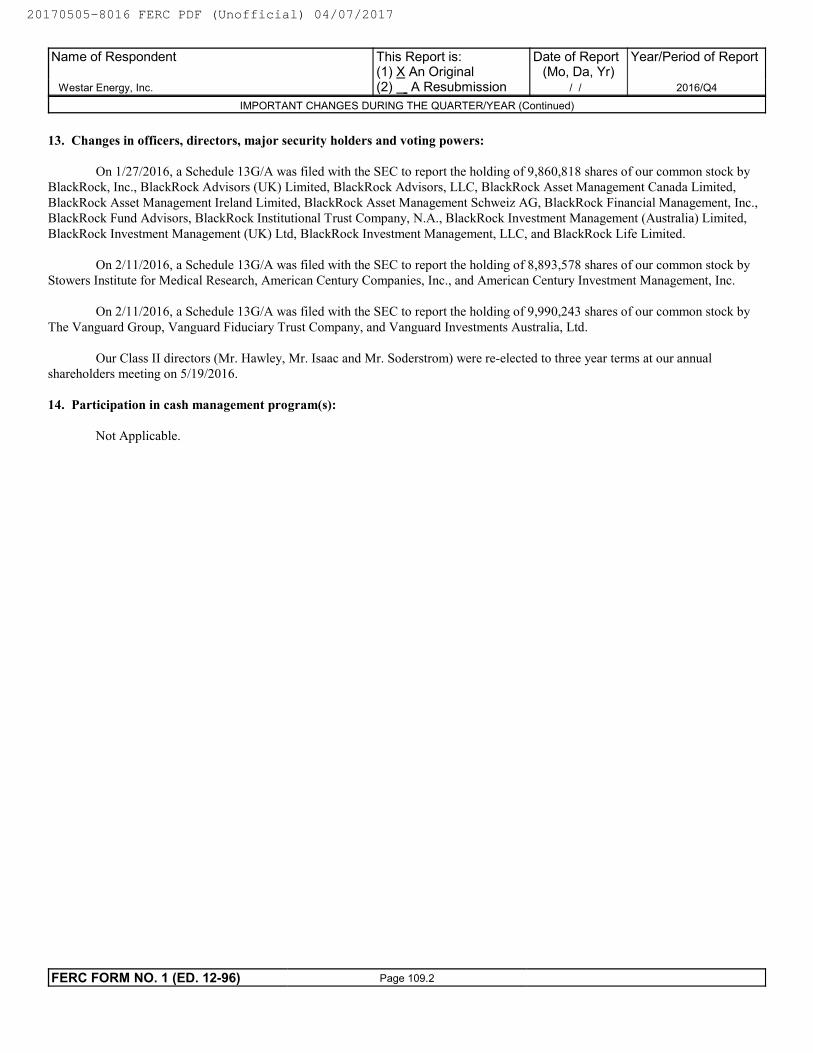
13. Changes in officers, directors, major security holders and voting powers:
On 1/27/2016, a Schedule 13G/A was filed with the SEC to report the holding of 9,860,818 shares of our common stock by
BlackRock, Inc., BlackRock Advisors (UK) Limited, BlackRock Advisors, LLC, BlackRock Asset Management Canada Limited,
BlackRock Asset Management Ireland Limited, BlackRock Asset Management Schweiz AG, BlackRock Financial Management, Inc.,
BlackRock Fund Advisors, BlackRock Institutional Trust Company, N.A., BlackRock Investment Management (Australia) Limited,
BlackRock Investment Management (UK) Ltd, BlackRock Investment Management, LLC, and BlackRock Life Limited.
On 2/11/2016, a Schedule 13G/A was filed with the SEC to report the holding of 8,893,578 shares of our common stock by
Stowers Institute for Medical Research, American Century Companies, Inc., and American Century Investment Management, Inc.
On 2/11/2016, a Schedule 13G/A was filed with the SEC to report the holding of 9,990,243 shares of our common stock by
The Vanguard Group, Vanguard Fiduciary Trust Company, and Vanguard Investments Australia, Ltd.
Our Class II directors (Mr. Hawley, Mr. Isaac and Mr. Soderstrom) were re-elected to three year terms at our annual
shareholders meeting on 5/19/2016.
14. Participation in cash management program(s):
Not Applicable.
Name of Respondent
Westar Energy, Inc.
This Report is:(1) X An Original(2) A Resubmission
Date of Report(Mo, Da, Yr)
/ /
Year/Period of Report
2016/Q4
IMPORTANT CHANGES DURING THE QUARTER/YEAR (Continued)
FERC FORM NO. 1 (ED. 12-96) Page 109.2
20170505-8016 FERC PDF (Unofficial) 04/07/2017
Name of Respondent This Report Is:
(1) An Original
(2) A ResubmissionX
Date of Report(Mo, Da, Yr)
Year/Period of Report
End of
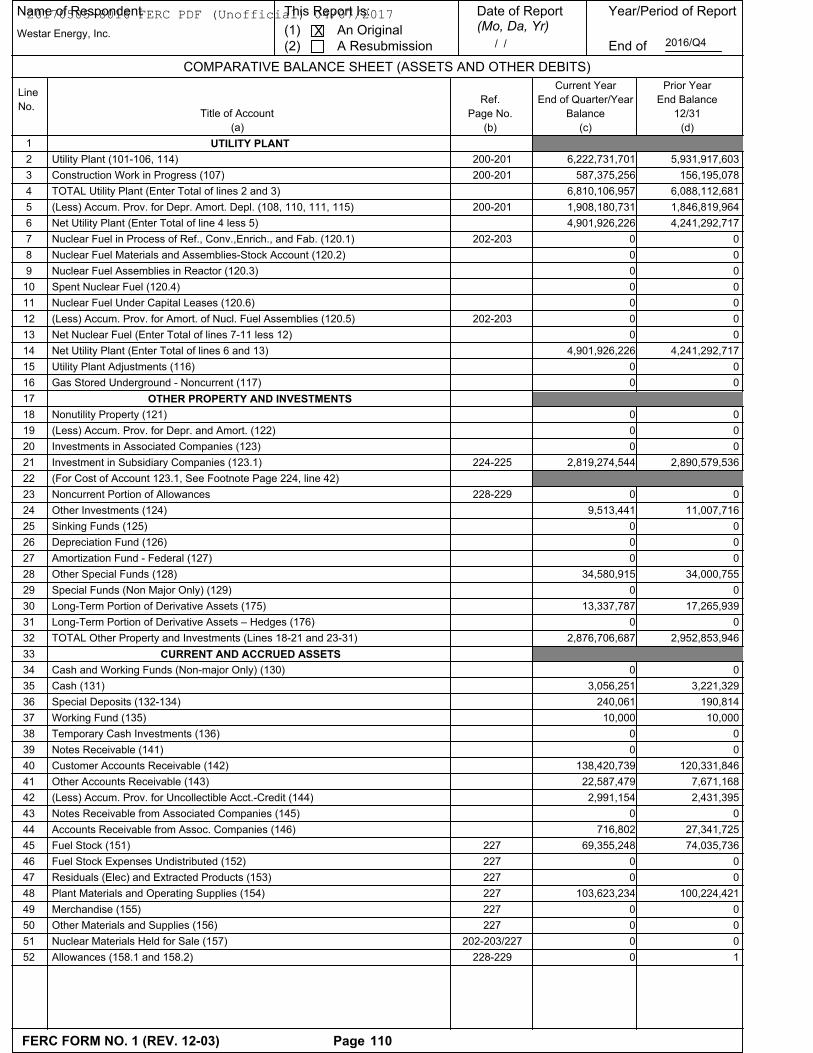
COMPARATIVE BALANCE SHEET (ASSETS AND OTHER DEBITS)
Line
No.Title of Account
(a)
Ref.
Page No.
(b)
Current Year
End of Quarter/Year
Balance
(c)
Prior Year
End Balance
12/31
(d)
Westar Energy, Inc. / / 2016/Q4
UTILITY PLANT 1
6,222,731,701 5,931,917,603200-201Utility Plant (101-106, 114) 2
587,375,256 156,195,078200-201Construction Work in Progress (107) 3
6,810,106,957 6,088,112,681TOTAL Utility Plant (Enter Total of lines 2 and 3) 4
1,908,180,731 1,846,819,964200-201(Less) Accum. Prov. for Depr. Amort. Depl. (108, 110, 111, 115) 5
4,901,926,226 4,241,292,717Net Utility Plant (Enter Total of line 4 less 5) 6
0 0202-203Nuclear Fuel in Process of Ref., Conv.,Enrich., and Fab. (120.1) 7
0 0Nuclear Fuel Materials and Assemblies-Stock Account (120.2) 8
0 0Nuclear Fuel Assemblies in Reactor (120.3) 9
0 0Spent Nuclear Fuel (120.4) 10
0 0Nuclear Fuel Under Capital Leases (120.6) 11
0 0202-203(Less) Accum. Prov. for Amort. of Nucl. Fuel Assemblies (120.5) 12
0 0Net Nuclear Fuel (Enter Total of lines 7-11 less 12) 13
4,901,926,226 4,241,292,717Net Utility Plant (Enter Total of lines 6 and 13) 14
0 0Utility Plant Adjustments (116) 15
0 0Gas Stored Underground - Noncurrent (117) 16
OTHER PROPERTY AND INVESTMENTS 17
0 0Nonutility Property (121) 18
0 0(Less) Accum. Prov. for Depr. and Amort. (122) 19
0 0Investments in Associated Companies (123) 20
2,819,274,544 2,890,579,536224-225Investment in Subsidiary Companies (123.1) 21
(For Cost of Account 123.1, See Footnote Page 224, line 42) 22
0 0228-229Noncurrent Portion of Allowances 23
9,513,441 11,007,716Other Investments (124) 24
0 0Sinking Funds (125) 25
0 0Depreciation Fund (126) 26
0 0Amortization Fund - Federal (127) 27
34,580,915 34,000,755Other Special Funds (128) 28
0 0Special Funds (Non Major Only) (129) 29
13,337,787 17,265,939Long-Term Portion of Derivative Assets (175) 30
0 0Long-Term Portion of Derivative Assets – Hedges (176) 31
2,876,706,687 2,952,853,946TOTAL Other Property and Investments (Lines 18-21 and 23-31) 32
CURRENT AND ACCRUED ASSETS 33
0 0Cash and Working Funds (Non-major Only) (130) 34
3,056,251 3,221,329Cash (131) 35
240,061 190,814Special Deposits (132-134) 36
10,000 10,000Working Fund (135) 37
0 0Temporary Cash Investments (136) 38
0 0Notes Receivable (141) 39
138,420,739 120,331,846Customer Accounts Receivable (142) 40
22,587,479 7,671,168Other Accounts Receivable (143) 41
2,991,154 2,431,395(Less) Accum. Prov. for Uncollectible Acct.-Credit (144) 42
0 0Notes Receivable from Associated Companies (145) 43
716,802 27,341,725Accounts Receivable from Assoc. Companies (146) 44
69,355,248 74,035,736227Fuel Stock (151) 45
0 0227Fuel Stock Expenses Undistributed (152) 46
0 0227Residuals (Elec) and Extracted Products (153) 47
103,623,234 100,224,421227Plant Materials and Operating Supplies (154) 48
0 0227Merchandise (155) 49
0 0227Other Materials and Supplies (156) 50
0 0202-203/227Nuclear Materials Held for Sale (157) 51
0 1228-229Allowances (158.1 and 158.2) 52
FERC FORM NO. 1 (REV. 12-03) Page 110
20170505-8016 FERC PDF (Unofficial) 04/07/2017
Name of Respondent This Report Is:
(1) An Original
(2) A ResubmissionX
Date of Report(Mo, Da, Yr)
Year/Period of Report
End of
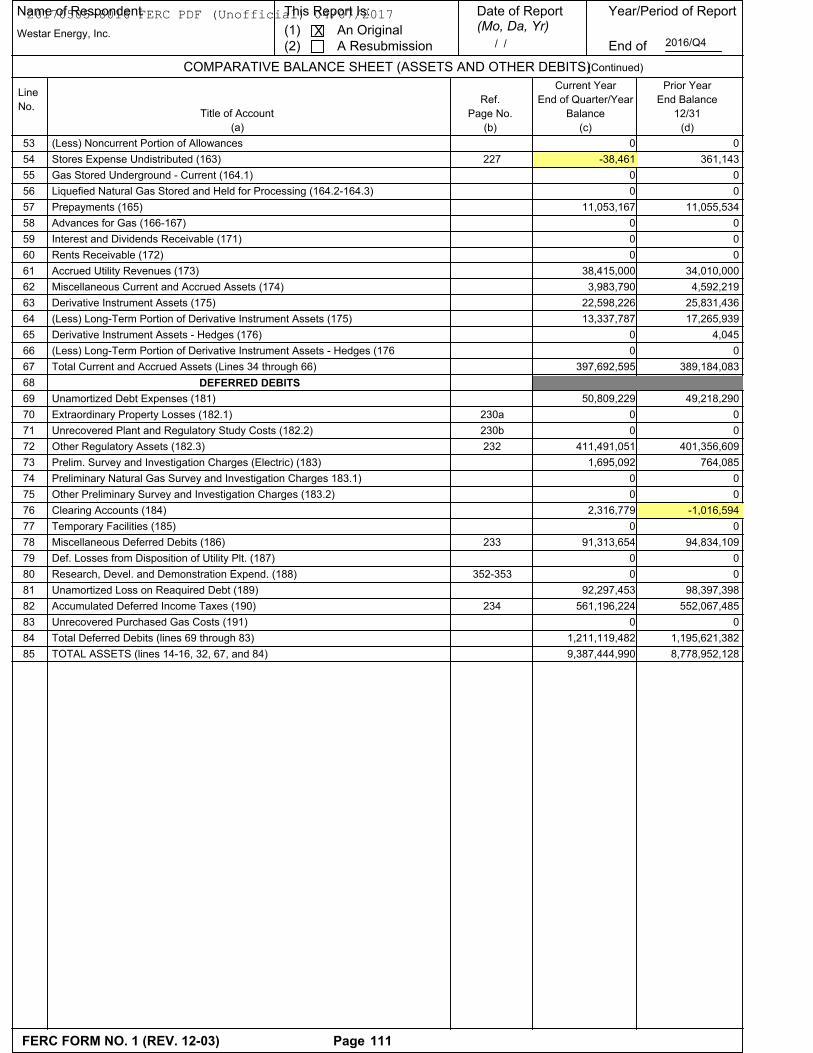
COMPARATIVE BALANCE SHEET (ASSETS AND OTHER DEBITS)
Line
No.Title of Account
(a)
Ref.
Page No.
(b)
Current Year
End of Quarter/Year
Balance
(c)
Prior Year
End Balance
12/31
(d)
Westar Energy, Inc. / / 2016/Q4
(Continued)
0 0(Less) Noncurrent Portion of Allowances 53
-38,461 361,143227Stores Expense Undistributed (163) 54
0 0Gas Stored Underground - Current (164.1) 55
0 0Liquefied Natural Gas Stored and Held for Processing (164.2-164.3) 56
11,053,167 11,055,534Prepayments (165) 57
0 0Advances for Gas (166-167) 58
0 0Interest and Dividends Receivable (171) 59
0 0Rents Receivable (172) 60
38,415,000 34,010,000Accrued Utility Revenues (173) 61
3,983,790 4,592,219Miscellaneous Current and Accrued Assets (174) 62
22,598,226 25,831,436Derivative Instrument Assets (175) 63
13,337,787 17,265,939(Less) Long-Term Portion of Derivative Instrument Assets (175) 64
0 4,045Derivative Instrument Assets - Hedges (176) 65
0 0(Less) Long-Term Portion of Derivative Instrument Assets - Hedges (176 66
397,692,595 389,184,083Total Current and Accrued Assets (Lines 34 through 66) 67
DEFERRED DEBITS 68
50,809,229 49,218,290Unamortized Debt Expenses (181) 69
0 0230aExtraordinary Property Losses (182.1) 70
0 0230bUnrecovered Plant and Regulatory Study Costs (182.2) 71
411,491,051 401,356,609232Other Regulatory Assets (182.3) 72
1,695,092 764,085Prelim. Survey and Investigation Charges (Electric) (183) 73
0 0Preliminary Natural Gas Survey and Investigation Charges 183.1) 74
0 0Other Preliminary Survey and Investigation Charges (183.2) 75
2,316,779 -1,016,594Clearing Accounts (184) 76
0 0Temporary Facilities (185) 77
91,313,654 94,834,109233Miscellaneous Deferred Debits (186) 78
0 0Def. Losses from Disposition of Utility Plt. (187) 79
0 0352-353Research, Devel. and Demonstration Expend. (188) 80
92,297,453 98,397,398Unamortized Loss on Reaquired Debt (189) 81
561,196,224 552,067,485234Accumulated Deferred Income Taxes (190) 82
0 0Unrecovered Purchased Gas Costs (191) 83
1,211,119,482 1,195,621,382Total Deferred Debits (lines 69 through 83) 84
9,387,444,990 8,778,952,128TOTAL ASSETS (lines 14-16, 32, 67, and 84) 85
FERC FORM NO. 1 (REV. 12-03) Page 111
20170505-8016 FERC PDF (Unofficial) 04/07/2017
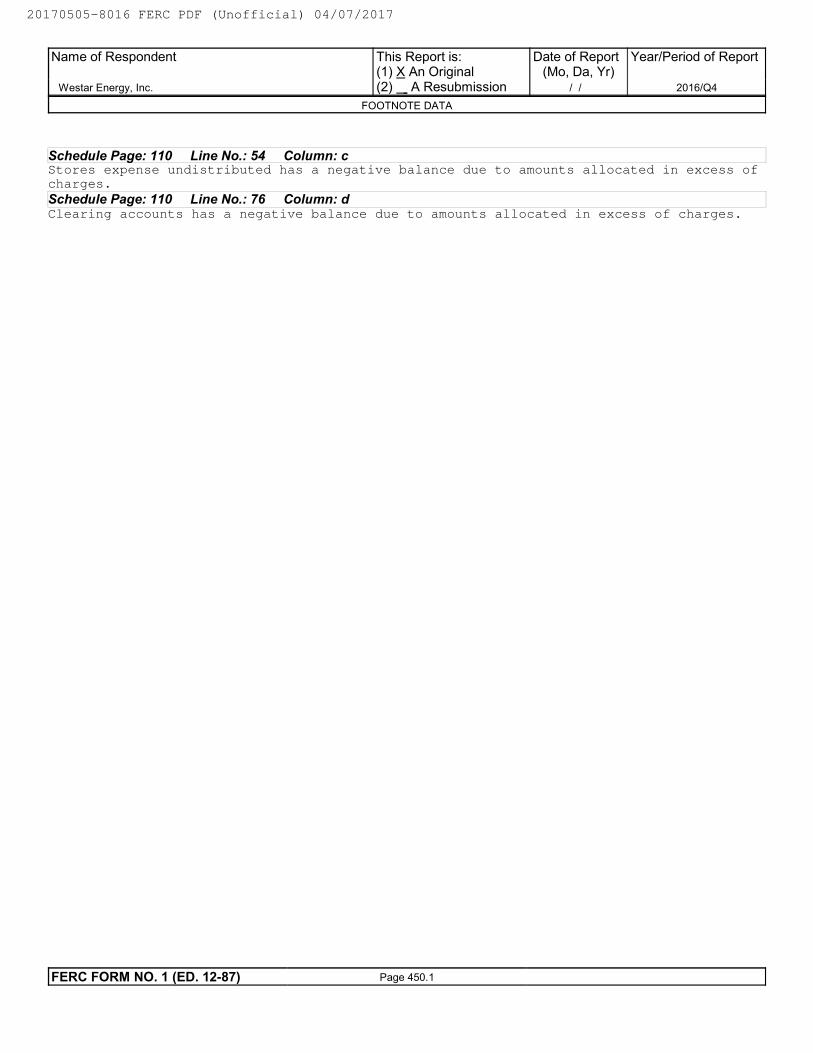
Schedule Page: 110 Line No.: 54 Column: cStores expense undistributed has a negative balance due to amounts allocated in excess of
charges.
Schedule Page: 110 Line No.: 76 Column: dClearing accounts has a negative balance due to amounts allocated in excess of charges.
Name of Respondent
Westar Energy, Inc.
This Report is:(1) X An Original(2) A Resubmission
Date of Report(Mo, Da, Yr)
/ /
Year/Period of Report
2016/Q4
FOOTNOTE DATA
FERC FORM NO. 1 (ED. 12-87) Page 450.1
20170505-8016 FERC PDF (Unofficial) 04/07/2017
Year/Period of ReportName of Respondent This Report is:
(1) An Original
(2) A Resubmissionx
Date of Report(mo, da, yr)
end of
Line
No.Title of Account
(a)
Ref.
Page No.
(b)
Current Year
End of Quarter/Year
Balance
(c)
Prior Year
End Balance
12/31
(d)
Westar Energy, Inc. / / 2016/Q4
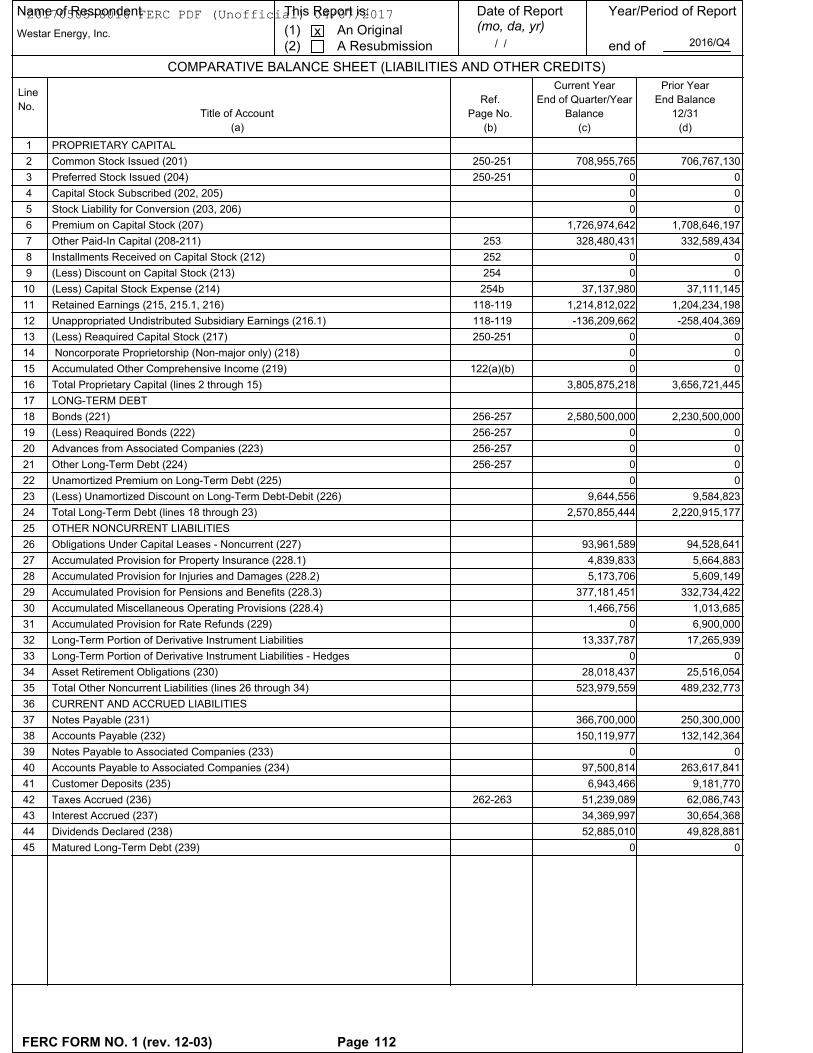
COMPARATIVE BALANCE SHEET (LIABILITIES AND OTHER CREDITS)
PROPRIETARY CAPITAL 1
706,767,130708,955,765Common Stock Issued (201) 2 250-251
00Preferred Stock Issued (204) 3 250-251
00Capital Stock Subscribed (202, 205) 4
00Stock Liability for Conversion (203, 206) 5
1,708,646,1971,726,974,642Premium on Capital Stock (207) 6
332,589,434328,480,431Other Paid-In Capital (208-211) 7 253
00Installments Received on Capital Stock (212) 8 252
00(Less) Discount on Capital Stock (213) 9 254
37,111,14537,137,980(Less) Capital Stock Expense (214) 10 254b
1,204,234,1981,214,812,022Retained Earnings (215, 215.1, 216) 11 118-119
-258,404,369-136,209,662Unappropriated Undistributed Subsidiary Earnings (216.1) 12 118-119
00(Less) Reaquired Capital Stock (217) 13 250-251
00 Noncorporate Proprietorship (Non-major only) (218) 14
00Accumulated Other Comprehensive Income (219) 15 122(a)(b)
3,656,721,4453,805,875,218Total Proprietary Capital (lines 2 through 15) 16
LONG-TERM DEBT 17
2,230,500,0002,580,500,000Bonds (221) 18 256-257
00(Less) Reaquired Bonds (222) 19 256-257
00Advances from Associated Companies (223) 20 256-257
00Other Long-Term Debt (224) 21 256-257
00Unamortized Premium on Long-Term Debt (225) 22
9,584,8239,644,556(Less) Unamortized Discount on Long-Term Debt-Debit (226) 23
2,220,915,1772,570,855,444Total Long-Term Debt (lines 18 through 23) 24
OTHER NONCURRENT LIABILITIES 25
94,528,64193,961,589Obligations Under Capital Leases - Noncurrent (227) 26
5,664,8834,839,833Accumulated Provision for Property Insurance (228.1) 27
5,609,1495,173,706Accumulated Provision for Injuries and Damages (228.2) 28
332,734,422377,181,451Accumulated Provision for Pensions and Benefits (228.3) 29
1,013,6851,466,756Accumulated Miscellaneous Operating Provisions (228.4) 30
6,900,0000Accumulated Provision for Rate Refunds (229) 31
17,265,93913,337,787Long-Term Portion of Derivative Instrument Liabilities 32
00Long-Term Portion of Derivative Instrument Liabilities - Hedges 33
25,516,05428,018,437Asset Retirement Obligations (230) 34
489,232,773523,979,559Total Other Noncurrent Liabilities (lines 26 through 34) 35
CURRENT AND ACCRUED LIABILITIES 36
250,300,000366,700,000Notes Payable (231) 37
132,142,364150,119,977Accounts Payable (232) 38
00Notes Payable to Associated Companies (233) 39
263,617,84197,500,814Accounts Payable to Associated Companies (234) 40
9,181,7706,943,466Customer Deposits (235) 41
62,086,74351,239,089Taxes Accrued (236) 42 262-263
30,654,36834,369,997Interest Accrued (237) 43
49,828,88152,885,010Dividends Declared (238) 44
00Matured Long-Term Debt (239) 45
FERC FORM NO. 1 (rev. 12-03) Page 112
20170505-8016 FERC PDF (Unofficial) 04/07/2017
Year/Period of ReportName of Respondent This Report is:
(1) An Original
(2) A Resubmissionx
Date of Report(mo, da, yr)
end of
Line
No.Title of Account
(a)
Ref.
Page No.
(b)
Current Year
End of Quarter/Year
Balance
(c)
Prior Year
End Balance
12/31
(d)
Westar Energy, Inc. / / 2016/Q4
(continued)COMPARATIVE BALANCE SHEET (LIABILITIES AND OTHER CREDITS)
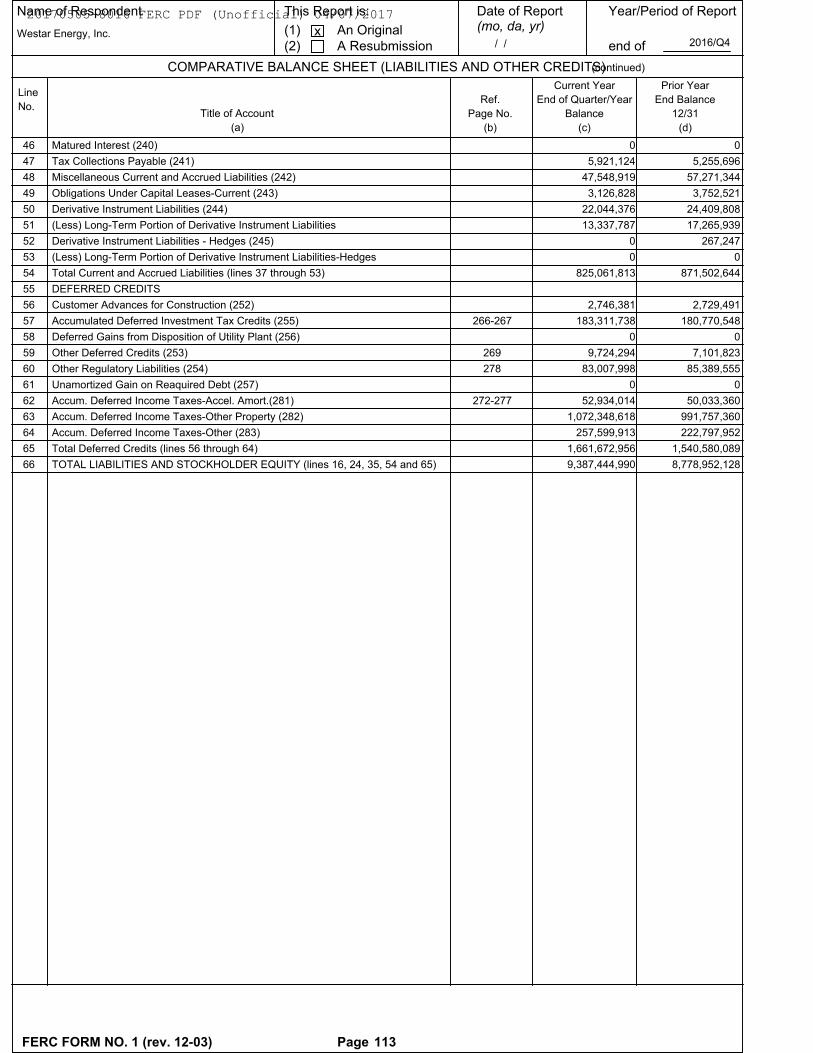
00Matured Interest (240) 46
5,255,6965,921,124Tax Collections Payable (241) 47
57,271,34447,548,919Miscellaneous Current and Accrued Liabilities (242) 48
3,752,5213,126,828Obligations Under Capital Leases-Current (243) 49
24,409,80822,044,376Derivative Instrument Liabilities (244) 50
17,265,93913,337,787(Less) Long-Term Portion of Derivative Instrument Liabilities 51
267,2470Derivative Instrument Liabilities - Hedges (245) 52
00(Less) Long-Term Portion of Derivative Instrument Liabilities-Hedges 53
871,502,644825,061,813Total Current and Accrued Liabilities (lines 37 through 53) 54
DEFERRED CREDITS 55
2,729,4912,746,381Customer Advances for Construction (252) 56
180,770,548183,311,738Accumulated Deferred Investment Tax Credits (255) 57 266-267
00Deferred Gains from Disposition of Utility Plant (256) 58
7,101,8239,724,294Other Deferred Credits (253) 59 269
85,389,55583,007,998Other Regulatory Liabilities (254) 60 278
00Unamortized Gain on Reaquired Debt (257) 61
50,033,36052,934,014Accum. Deferred Income Taxes-Accel. Amort.(281) 62 272-277
991,757,3601,072,348,618Accum. Deferred Income Taxes-Other Property (282) 63
222,797,952257,599,913Accum. Deferred Income Taxes-Other (283) 64
1,540,580,0891,661,672,956Total Deferred Credits (lines 56 through 64) 65
8,778,952,1289,387,444,990TOTAL LIABILITIES AND STOCKHOLDER EQUITY (lines 16, 24, 35, 54 and 65) 66
FERC FORM NO. 1 (rev. 12-03) Page 113
20170505-8016 FERC PDF (Unofficial) 04/07/2017
Name of Respondent This Report Is:(1) An Original
(2) A Resubmission
Date of Report(Mo, Da, Yr)
Year/Period of Report
End of
STATEMENT OF INCOME
Westar Energy, Inc.X
/ /2016/Q4
Line
(c)(b)(a)
Title of Account
No.
Total
Current Year to
Date Balance for
Quarter/Year
(d)
(Ref.)
Page No.
Quarterly
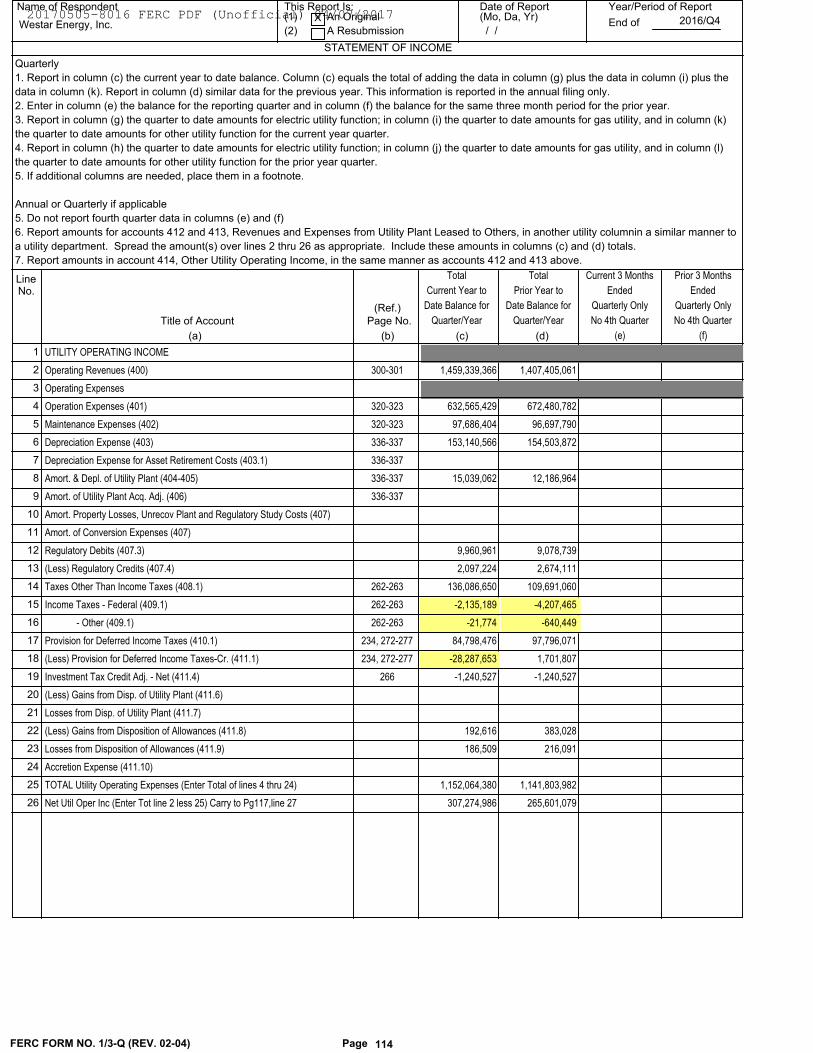
1. Report in column (c) the current year to date balance. Column (c) equals the total of adding the data in column (g) plus the data in column (i) plus the
data in column (k). Report in column (d) similar data for the previous year. This information is reported in the annual filing only.
2. Enter in column (e) the balance for the reporting quarter and in column (f) the balance for the same three month period for the prior year.
3. Report in column (g) the quarter to date amounts for electric utility function; in column (i) the quarter to date amounts for gas utility, and in column (k)
the quarter to date amounts for other utility function for the current year quarter.
4. Report in column (h) the quarter to date amounts for electric utility function; in column (j) the quarter to date amounts for gas utility, and in column (l)
the quarter to date amounts for other utility function for the prior year quarter.
5. If additional columns are needed, place them in a footnote.
Annual or Quarterly if applicable
5. Do not report fourth quarter data in columns (e) and (f)
6. Report amounts for accounts 412 and 413, Revenues and Expenses from Utility Plant Leased to Others, in another utility columnin a similar manner to
a utility department. Spread the amount(s) over lines 2 thru 26 as appropriate. Include these amounts in columns (c) and (d) totals.
7. Report amounts in account 414, Other Utility Operating Income, in the same manner as accounts 412 and 413 above.
Current 3 Months
Ended
Quarterly Only
No 4th Quarter
(e)
Prior 3 Months
Ended
Quarterly Only
No 4th Quarter
(f)
Total
Prior Year to
Date Balance for
Quarter/Year
UTILITY OPERATING INCOME 1
1,459,339,366 1,407,405,061300-301Operating Revenues (400) 2
Operating Expenses 3
632,565,429 672,480,782320-323Operation Expenses (401) 4
97,686,404 96,697,790320-323Maintenance Expenses (402) 5
153,140,566 154,503,872336-337Depreciation Expense (403) 6
336-337Depreciation Expense for Asset Retirement Costs (403.1) 7
15,039,062 12,186,964336-337Amort. & Depl. of Utility Plant (404-405) 8
336-337Amort. of Utility Plant Acq. Adj. (406) 9
Amort. Property Losses, Unrecov Plant and Regulatory Study Costs (407) 10
Amort. of Conversion Expenses (407) 11
9,960,961 9,078,739Regulatory Debits (407.3) 12
2,097,224 2,674,111(Less) Regulatory Credits (407.4) 13
136,086,650 109,691,060262-263Taxes Other Than Income Taxes (408.1) 14
-2,135,189 -4,207,465262-263Income Taxes - Federal (409.1) 15
-21,774 -640,449262-263 - Other (409.1) 16
84,798,476 97,796,071234, 272-277Provision for Deferred Income Taxes (410.1) 17
-28,287,653 1,701,807234, 272-277(Less) Provision for Deferred Income Taxes-Cr. (411.1) 18
-1,240,527 -1,240,527266Investment Tax Credit Adj. - Net (411.4) 19
(Less) Gains from Disp. of Utility Plant (411.6) 20
Losses from Disp. of Utility Plant (411.7) 21
192,616 383,028(Less) Gains from Disposition of Allowances (411.8) 22
186,509 216,091Losses from Disposition of Allowances (411.9) 23
Accretion Expense (411.10) 24
1,152,064,380 1,141,803,982TOTAL Utility Operating Expenses (Enter Total of lines 4 thru 24) 25
307,274,986 265,601,079Net Util Oper Inc (Enter Tot line 2 less 25) Carry to Pg117,line 27 26
FERC FORM NO. 1/3-Q (REV. 02-04) Page 114
20170505-8016 FERC PDF (Unofficial) 04/07/2017
Name of Respondent This Report Is:(1) An Original
(2) A Resubmission
Date of Report(Mo, Da, Yr)
Year/Period of Report
End of
STATEMENT OF INCOME FOR THE YEAR (Continued)
Westar Energy, Inc.X
/ /2016/Q4
Line Previous Year to Date
(in dollars)
(k)(j)(g)
ELECTRIC UTILITY
No.Current Year to Date
(in dollars)
OTHER UTILITY
(l)
GAS UTILITY
Previous Year to Date
(in dollars)
Current Year to Date
(in dollars)
Previous Year to Date
(in dollars)
Current Year to Date
(in dollars)
(h) (i)
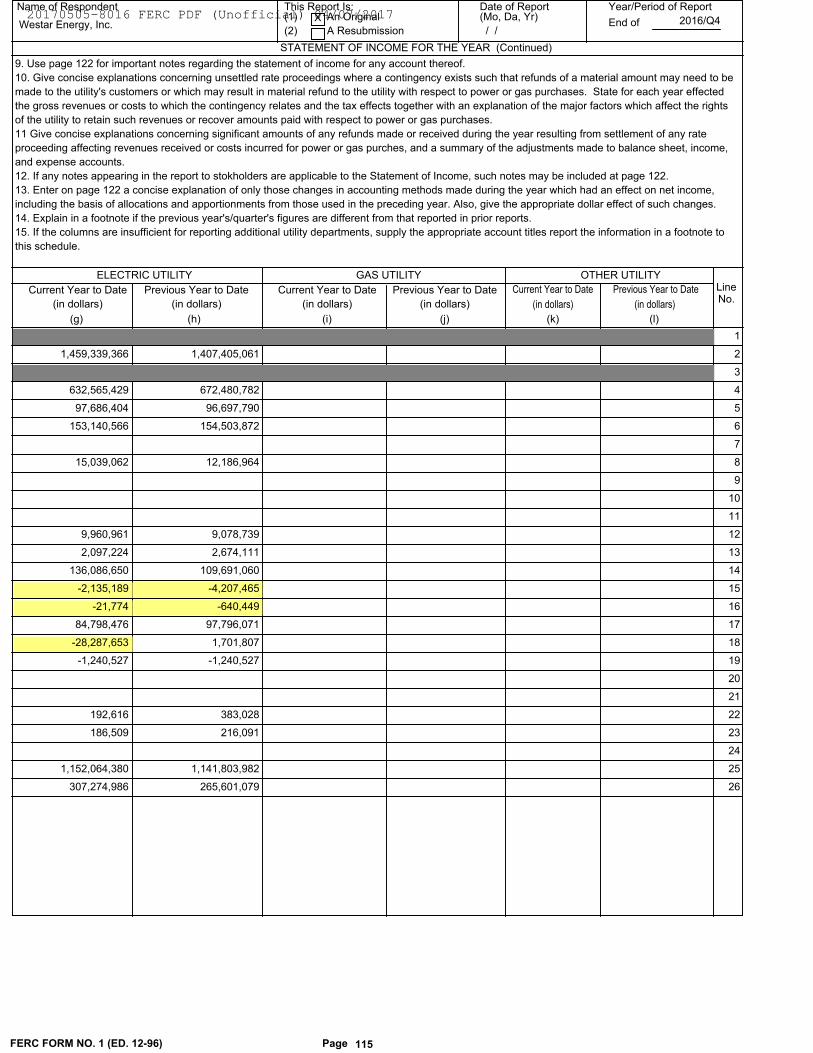
9. Use page 122 for important notes regarding the statement of income for any account thereof.
10. Give concise explanations concerning unsettled rate proceedings where a contingency exists such that refunds of a material amount may need to be
made to the utility's customers or which may result in material refund to the utility with respect to power or gas purchases. State for each year effected
the gross revenues or costs to which the contingency relates and the tax effects together with an explanation of the major factors which affect the rights
of the utility to retain such revenues or recover amounts paid with respect to power or gas purchases.
11 Give concise explanations concerning significant amounts of any refunds made or received during the year resulting from settlement of any rate
proceeding affecting revenues received or costs incurred for power or gas purches, and a summary of the adjustments made to balance sheet, income,
and expense accounts.
12. If any notes appearing in the report to stokholders are applicable to the Statement of Income, such notes may be included at page 122.
13. Enter on page 122 a concise explanation of only those changes in accounting methods made during the year which had an effect on net income,
including the basis of allocations and apportionments from those used in the preceding year. Also, give the appropriate dollar effect of such changes.
14. Explain in a footnote if the previous year's/quarter's figures are different from that reported in prior reports.
15. If the columns are insufficient for reporting additional utility departments, supply the appropriate account titles report the information in a footnote to
this schedule.
1
1,459,339,366 1,407,405,061 2
3
632,565,429 672,480,782 4
97,686,404 96,697,790 5
153,140,566 154,503,872 6
7
15,039,062 12,186,964 8
9
10
11
9,960,961 9,078,739 12
2,097,224 2,674,111 13
136,086,650 109,691,060 14
-2,135,189 -4,207,465 15
-21,774 -640,449 16
84,798,476 97,796,071 17
-28,287,653 1,701,807 18
-1,240,527 -1,240,527 19
20
21
192,616 383,028 22
186,509 216,091 23
24
1,152,064,380 1,141,803,982 25
307,274,986 265,601,079 26
FERC FORM NO. 1 (ED. 12-96) Page 115
20170505-8016 FERC PDF (Unofficial) 04/07/2017
Name of Respondent This Report Is:(1) An Original
(2) A Resubmission
Date of Report(Mo, Da, Yr)
Year/Period of Report
End of
STATEMENT OF INCOME FOR THE YEAR (continued)
Westar Energy, Inc.X
/ /2016/Q4
Line
Previous Year
(c)(b)(a)
Title of Account
No.
Current Year
TOTAL
(d)
(Ref.)
Page No.
Current 3 Months
Ended
Quarterly Only
No 4th Quarter
(e)
Prior 3 Months
Ended
Quarterly Only
No 4th Quarter
(f)
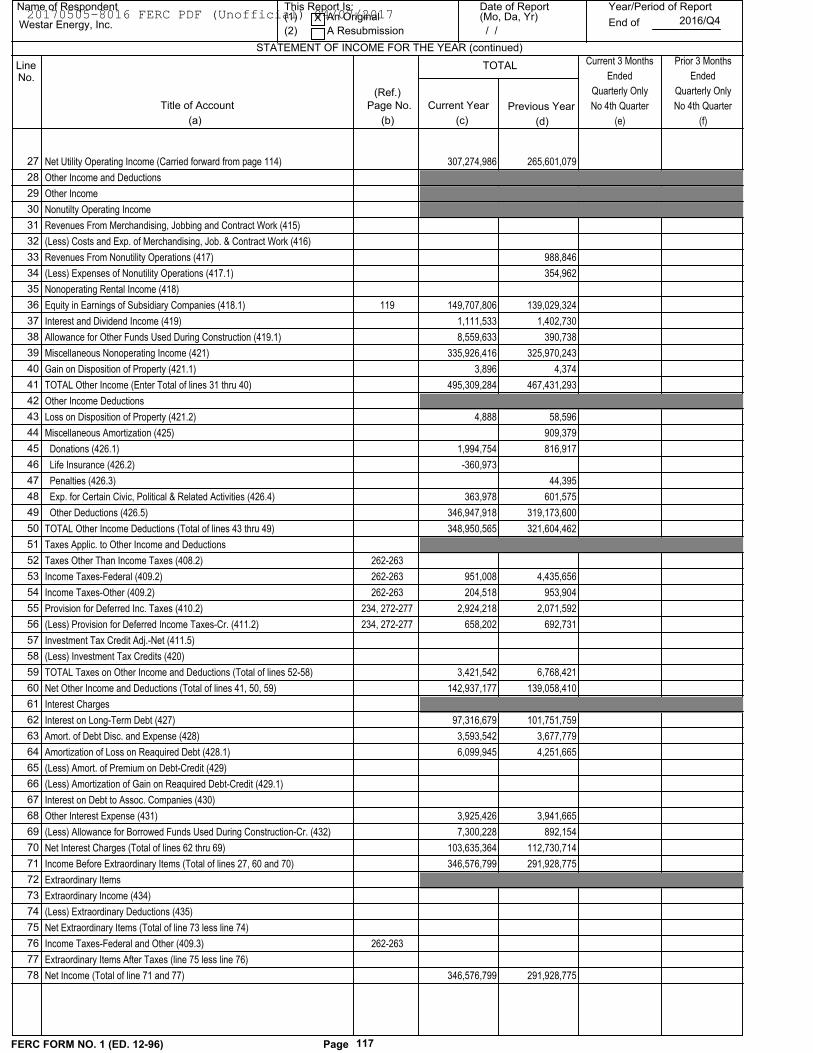
307,274,986 265,601,079Net Utility Operating Income (Carried forward from page 114) 27
Other Income and Deductions 28
Other Income 29
Nonutilty Operating Income 30
Revenues From Merchandising, Jobbing and Contract Work (415) 31
(Less) Costs and Exp. of Merchandising, Job. & Contract Work (416) 32
988,846Revenues From Nonutility Operations (417) 33
354,962(Less) Expenses of Nonutility Operations (417.1) 34
Nonoperating Rental Income (418) 35
149,707,806 139,029,324119Equity in Earnings of Subsidiary Companies (418.1) 36
1,111,533 1,402,730Interest and Dividend Income (419) 37
8,559,633 390,738Allowance for Other Funds Used During Construction (419.1) 38
335,926,416 325,970,243Miscellaneous Nonoperating Income (421) 39
3,896 4,374Gain on Disposition of Property (421.1) 40
495,309,284 467,431,293TOTAL Other Income (Enter Total of lines 31 thru 40) 41
Other Income Deductions 42
4,888 58,596Loss on Disposition of Property (421.2) 43
909,379Miscellaneous Amortization (425) 44
1,994,754 816,917 Donations (426.1) 45
-360,973 Life Insurance (426.2) 46
44,395 Penalties (426.3) 47
363,978 601,575 Exp. for Certain Civic, Political & Related Activities (426.4) 48
346,947,918 319,173,600 Other Deductions (426.5) 49
348,950,565 321,604,462TOTAL Other Income Deductions (Total of lines 43 thru 49) 50
Taxes Applic. to Other Income and Deductions 51
262-263Taxes Other Than Income Taxes (408.2) 52
951,008 4,435,656262-263Income Taxes-Federal (409.2) 53
204,518 953,904262-263Income Taxes-Other (409.2) 54
2,924,218 2,071,592234, 272-277Provision for Deferred Inc. Taxes (410.2) 55
658,202 692,731234, 272-277(Less) Provision for Deferred Income Taxes-Cr. (411.2) 56
Investment Tax Credit Adj.-Net (411.5) 57
(Less) Investment Tax Credits (420) 58
3,421,542 6,768,421TOTAL Taxes on Other Income and Deductions (Total of lines 52-58) 59
142,937,177 139,058,410Net Other Income and Deductions (Total of lines 41, 50, 59) 60
Interest Charges 61
97,316,679 101,751,759Interest on Long-Term Debt (427) 62
3,593,542 3,677,779Amort. of Debt Disc. and Expense (428) 63
6,099,945 4,251,665Amortization of Loss on Reaquired Debt (428.1) 64
(Less) Amort. of Premium on Debt-Credit (429) 65
(Less) Amortization of Gain on Reaquired Debt-Credit (429.1) 66
Interest on Debt to Assoc. Companies (430) 67
3,925,426 3,941,665Other Interest Expense (431) 68
7,300,228 892,154(Less) Allowance for Borrowed Funds Used During Construction-Cr. (432) 69
103,635,364 112,730,714Net Interest Charges (Total of lines 62 thru 69) 70
346,576,799 291,928,775Income Before Extraordinary Items (Total of lines 27, 60 and 70) 71
Extraordinary Items 72
Extraordinary Income (434) 73
(Less) Extraordinary Deductions (435) 74
Net Extraordinary Items (Total of line 73 less line 74) 75
262-263Income Taxes-Federal and Other (409.3) 76
Extraordinary Items After Taxes (line 75 less line 76) 77
346,576,799 291,928,775Net Income (Total of line 71 and 77) 78
FERC FORM NO. 1 (ED. 12-96) Page 117
20170505-8016 FERC PDF (Unofficial) 04/07/2017
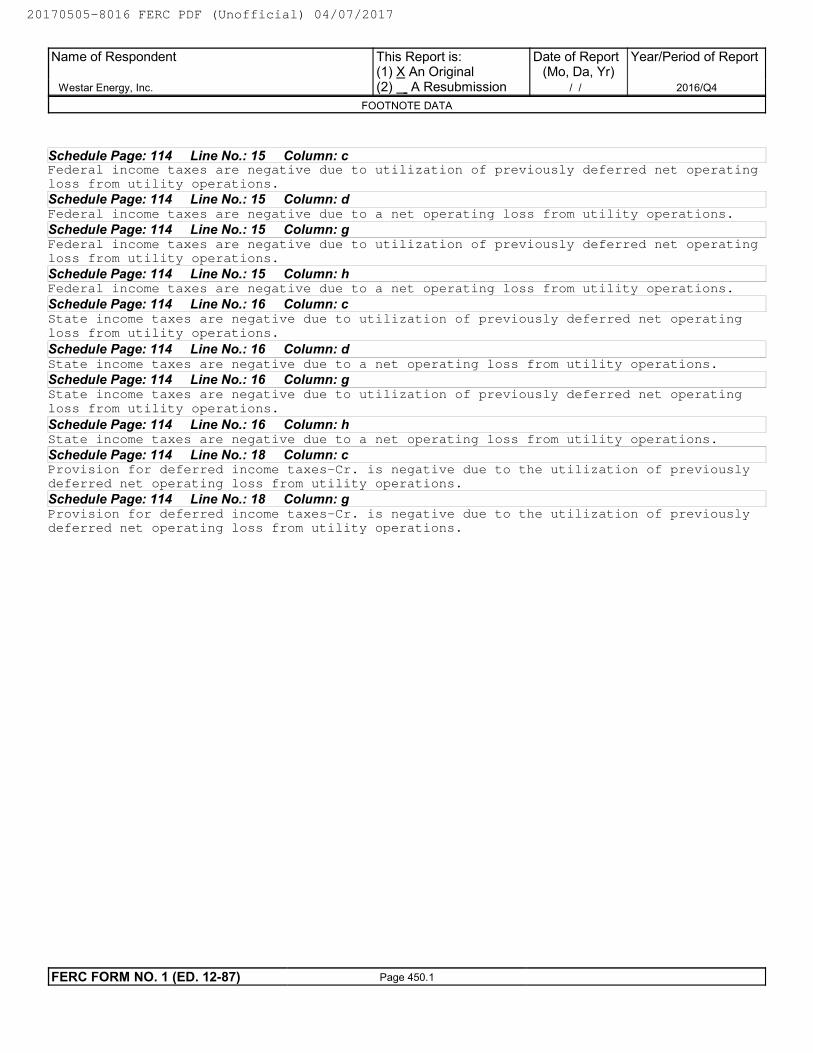
Schedule Page: 114 Line No.: 15 Column: cFederal income taxes are negative due to utilization of previously deferred net operating
loss from utility operations.
Schedule Page: 114 Line No.: 15 Column: dFederal income taxes are negative due to a net operating loss from utility operations.
Schedule Page: 114 Line No.: 15 Column: gFederal income taxes are negative due to utilization of previously deferred net operating
loss from utility operations.
Schedule Page: 114 Line No.: 15 Column: hFederal income taxes are negative due to a net operating loss from utility operations.
Schedule Page: 114 Line No.: 16 Column: cState income taxes are negative due to utilization of previously deferred net operating
loss from utility operations.
Schedule Page: 114 Line No.: 16 Column: dState income taxes are negative due to a net operating loss from utility operations.
Schedule Page: 114 Line No.: 16 Column: gState income taxes are negative due to utilization of previously deferred net operating
loss from utility operations.
Schedule Page: 114 Line No.: 16 Column: hState income taxes are negative due to a net operating loss from utility operations.
Schedule Page: 114 Line No.: 18 Column: cProvision for deferred income taxes-Cr. is negative due to the utilization of previously
deferred net operating loss from utility operations.
Schedule Page: 114 Line No.: 18 Column: gProvision for deferred income taxes-Cr. is negative due to the utilization of previously
deferred net operating loss from utility operations.
Name of Respondent
Westar Energy, Inc.
This Report is:(1) X An Original(2) A Resubmission
Date of Report(Mo, Da, Yr)
/ /
Year/Period of Report
2016/Q4
FOOTNOTE DATA
FERC FORM NO. 1 (ED. 12-87) Page 450.1
20170505-8016 FERC PDF (Unofficial) 04/07/2017
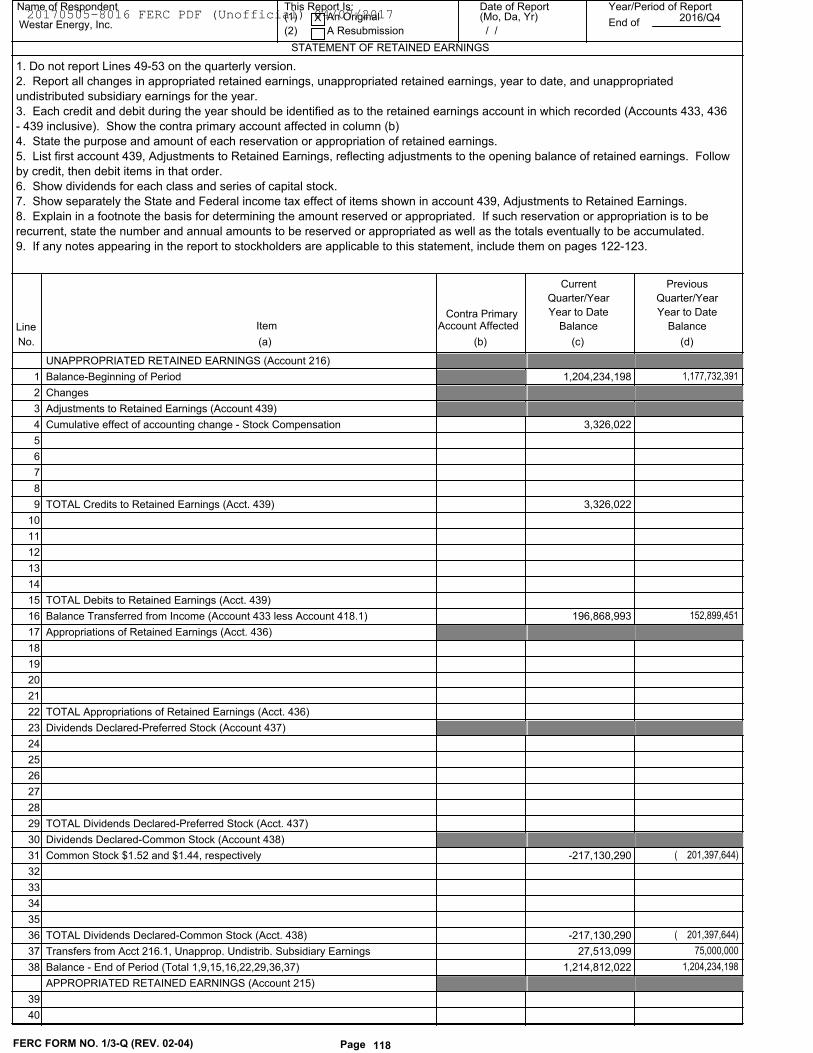
Name of Respondent This Report Is:(1) An Original
(2) A Resubmission
Date of Report(Mo, Da, Yr)
Year/Period of Report
End of
STATEMENT OF RETAINED EARNINGS
Westar Energy, Inc.X
/ /2016/Q4
Line
Current
Quarter/Year
Year to Date
Balance
(c)(b)(a)
ItemContra Primary
No.
Account Affected
1. Do not report Lines 49-53 on the quarterly version.
2. Report all changes in appropriated retained earnings, unappropriated retained earnings, year to date, and unappropriated
undistributed subsidiary earnings for the year.
3. Each credit and debit during the year should be identified as to the retained earnings account in which recorded (Accounts 433, 436
- 439 inclusive). Show the contra primary account affected in column (b)
4. State the purpose and amount of each reservation or appropriation of retained earnings.
5. List first account 439, Adjustments to Retained Earnings, reflecting adjustments to the opening balance of retained earnings. Follow
by credit, then debit items in that order.
6. Show dividends for each class and series of capital stock.
7. Show separately the State and Federal income tax effect of items shown in account 439, Adjustments to Retained Earnings.
8. Explain in a footnote the basis for determining the amount reserved or appropriated. If such reservation or appropriation is to be
recurrent, state the number and annual amounts to be reserved or appropriated as well as the totals eventually to be accumulated.
9. If any notes appearing in the report to stockholders are applicable to this statement, include them on pages 122-123.
Previous
Quarter/Year
Year to Date
Balance
(d)
UNAPPROPRIATED RETAINED EARNINGS (Account 216)
1,177,732,391 1,204,234,198 1 Balance-Beginning of Period
2 Changes
3 Adjustments to Retained Earnings (Account 439)
3,326,022 4 Cumulative effect of accounting change - Stock Compensation
5
6
7
8
3,326,022 9 TOTAL Credits to Retained Earnings (Acct. 439)
10
11
12
13
14
15 TOTAL Debits to Retained Earnings (Acct. 439)
152,899,451 196,868,993 16 Balance Transferred from Income (Account 433 less Account 418.1)
17 Appropriations of Retained Earnings (Acct. 436)
18
19
20
21
22 TOTAL Appropriations of Retained Earnings (Acct. 436)
23 Dividends Declared-Preferred Stock (Account 437)
24
25
26
27
28
29 TOTAL Dividends Declared-Preferred Stock (Acct. 437)
30 Dividends Declared-Common Stock (Account 438)
( 201,397,644) -217,130,290 31 Common Stock $1.52 and $1.44, respectively
32
33
34
35
( 201,397,644) -217,130,290 36 TOTAL Dividends Declared-Common Stock (Acct. 438)
75,000,000 27,513,099 37 Transfers from Acct 216.1, Unapprop. Undistrib. Subsidiary Earnings
1,204,234,198 1,214,812,022 38 Balance - End of Period (Total 1,9,15,16,22,29,36,37)
APPROPRIATED RETAINED EARNINGS (Account 215)
39
40
FERC FORM NO. 1/3-Q (REV. 02-04) Page 118
20170505-8016 FERC PDF (Unofficial) 04/07/2017
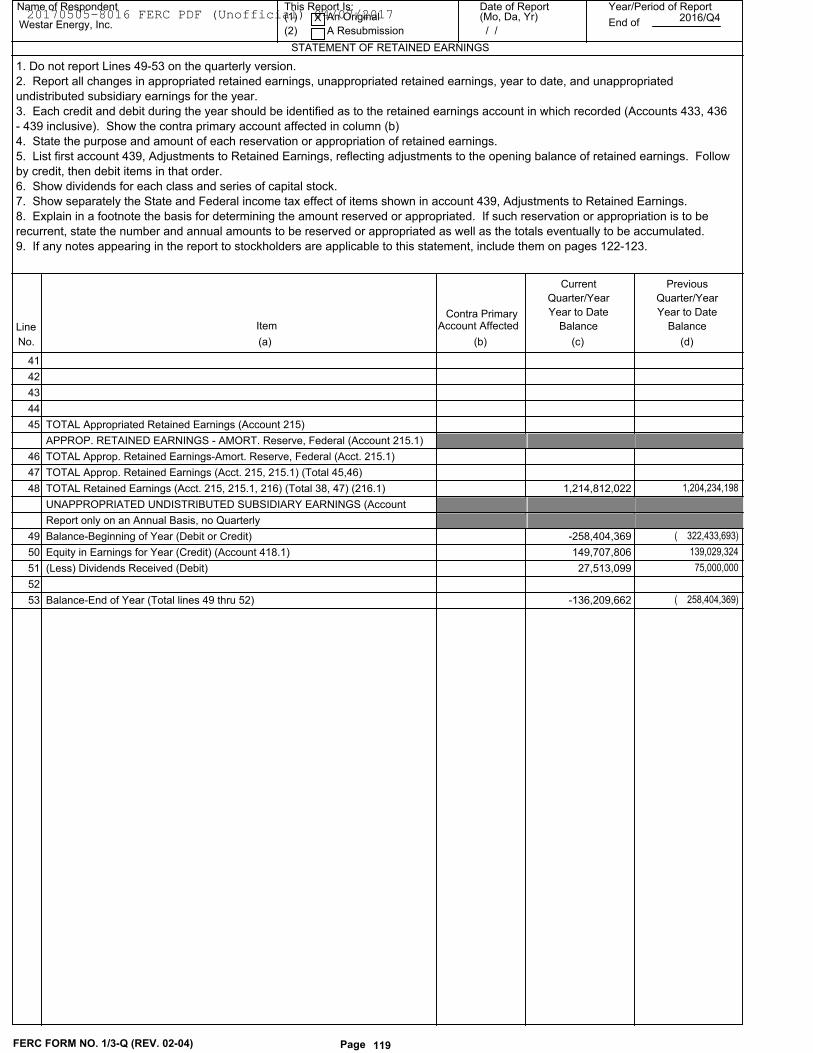
Name of Respondent This Report Is:(1) An Original
(2) A Resubmission
Date of Report(Mo, Da, Yr)
Year/Period of Report
End of
STATEMENT OF RETAINED EARNINGS
Westar Energy, Inc.X
/ /2016/Q4
Line
Current
Quarter/Year
Year to Date
Balance
(c)(b)(a)
ItemContra Primary
No.
Account Affected
1. Do not report Lines 49-53 on the quarterly version.
2. Report all changes in appropriated retained earnings, unappropriated retained earnings, year to date, and unappropriated
undistributed subsidiary earnings for the year.
3. Each credit and debit during the year should be identified as to the retained earnings account in which recorded (Accounts 433, 436
- 439 inclusive). Show the contra primary account affected in column (b)
4. State the purpose and amount of each reservation or appropriation of retained earnings.
5. List first account 439, Adjustments to Retained Earnings, reflecting adjustments to the opening balance of retained earnings. Follow
by credit, then debit items in that order.
6. Show dividends for each class and series of capital stock.
7. Show separately the State and Federal income tax effect of items shown in account 439, Adjustments to Retained Earnings.
8. Explain in a footnote the basis for determining the amount reserved or appropriated. If such reservation or appropriation is to be
recurrent, state the number and annual amounts to be reserved or appropriated as well as the totals eventually to be accumulated.
9. If any notes appearing in the report to stockholders are applicable to this statement, include them on pages 122-123.
Previous
Quarter/Year
Year to Date
Balance
(d)
41
42
43
44
45 TOTAL Appropriated Retained Earnings (Account 215)
APPROP. RETAINED EARNINGS - AMORT. Reserve, Federal (Account 215.1)
46 TOTAL Approp. Retained Earnings-Amort. Reserve, Federal (Acct. 215.1)
47 TOTAL Approp. Retained Earnings (Acct. 215, 215.1) (Total 45,46)
1,204,234,198 1,214,812,022 48 TOTAL Retained Earnings (Acct. 215, 215.1, 216) (Total 38, 47) (216.1)
UNAPPROPRIATED UNDISTRIBUTED SUBSIDIARY EARNINGS (Account
Report only on an Annual Basis, no Quarterly
( 322,433,693) -258,404,369 49 Balance-Beginning of Year (Debit or Credit)
139,029,324 149,707,806 50 Equity in Earnings for Year (Credit) (Account 418.1)
75,000,000 27,513,099 51 (Less) Dividends Received (Debit)
52
( 258,404,369) -136,209,662 53 Balance-End of Year (Total lines 49 thru 52)
FERC FORM NO. 1/3-Q (REV. 02-04) Page 119
20170505-8016 FERC PDF (Unofficial) 04/07/2017
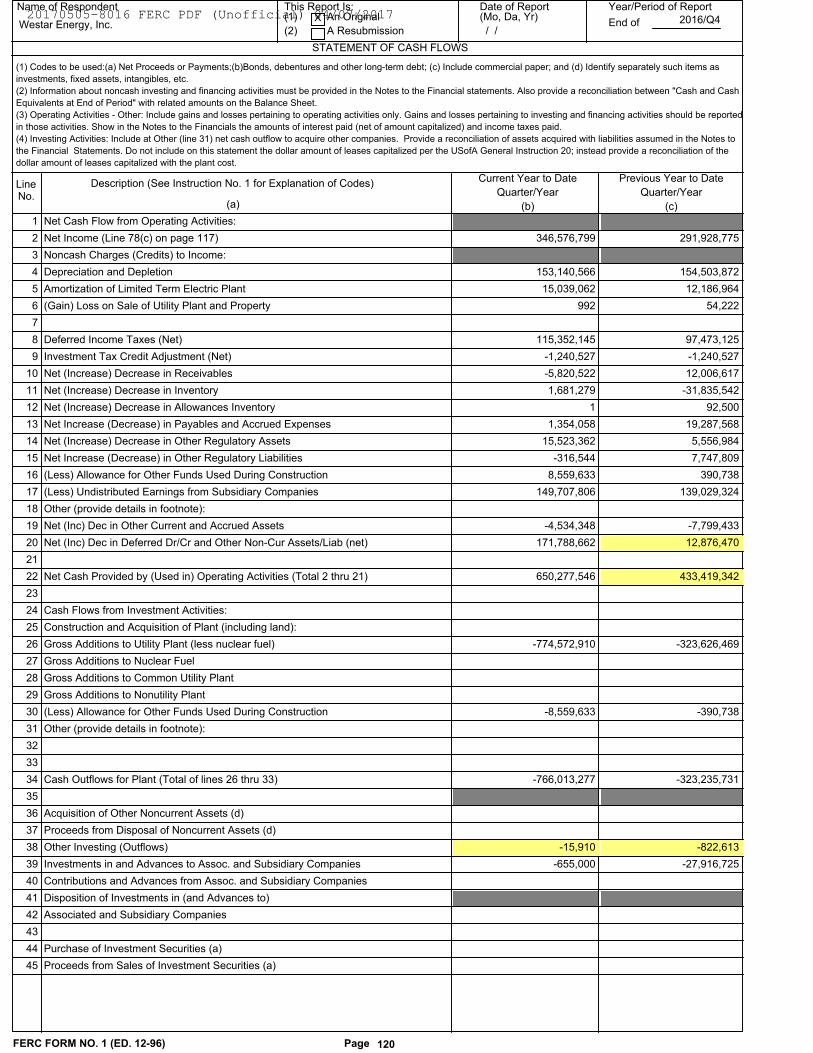
(1) Codes to be used:(a) Net Proceeds or Payments;(b)Bonds, debentures and other long-term debt; (c) Include commercial paper; and (d) Identify separately such items as
investments, fixed assets, intangibles, etc.
(2) Information about noncash investing and financing activities must be provided in the Notes to the Financial statements. Also provide a reconciliation between "Cash and Cash
Equivalents at End of Period" with related amounts on the Balance Sheet.
(3) Operating Activities - Other: Include gains and losses pertaining to operating activities only. Gains and losses pertaining to investing and financing activities should be reported
in those activities. Show in the Notes to the Financials the amounts of interest paid (net of amount capitalized) and income taxes paid.
(4) Investing Activities: Include at Other (line 31) net cash outflow to acquire other companies. Provide a reconciliation of assets acquired with liabilities assumed in the Notes to
the Financial Statements. Do not include on this statement the dollar amount of leases capitalized per the USofA General Instruction 20; instead provide a reconciliation of the
dollar amount of leases capitalized with the plant cost.
Name of Respondent This Report Is:(1) An Original
(2) A Resubmission
Date of Report(Mo, Da, Yr)
Year/Period of Report
End of
STATEMENT OF CASH FLOWS
Westar Energy, Inc.X
/ /2016/Q4
Line Description (See Instruction No. 1 for Explanation of Codes)Current Year to Date
Quarter/Year
(b)(a)No.
Previous Year to Date
Quarter/Year
(c)
1 Net Cash Flow from Operating Activities:
291,928,775 346,576,799 2 Net Income (Line 78(c) on page 117)
3 Noncash Charges (Credits) to Income:
154,503,872 153,140,566 4 Depreciation and Depletion
12,186,964 15,039,062 5 Amortization of Limited Term Electric Plant
54,222 992 6 (Gain) Loss on Sale of Utility Plant and Property
7
97,473,125 115,352,145 8 Deferred Income Taxes (Net)
-1,240,527 -1,240,527 9 Investment Tax Credit Adjustment (Net)
12,006,617 -5,820,522 10 Net (Increase) Decrease in Receivables
-31,835,542 1,681,279 11 Net (Increase) Decrease in Inventory
92,500 1 12 Net (Increase) Decrease in Allowances Inventory
19,287,568 1,354,058 13 Net Increase (Decrease) in Payables and Accrued Expenses
5,556,984 15,523,362 14 Net (Increase) Decrease in Other Regulatory Assets
7,747,809 -316,544 15 Net Increase (Decrease) in Other Regulatory Liabilities
390,738 8,559,633 16 (Less) Allowance for Other Funds Used During Construction
139,029,324 149,707,806 17 (Less) Undistributed Earnings from Subsidiary Companies
18 Other (provide details in footnote):
-7,799,433 -4,534,348 19 Net (Inc) Dec in Other Current and Accrued Assets
12,876,470 171,788,662 20 Net (Inc) Dec in Deferred Dr/Cr and Other Non-Cur Assets/Liab (net)
21
433,419,342 650,277,546 22 Net Cash Provided by (Used in) Operating Activities (Total 2 thru 21)
23
24 Cash Flows from Investment Activities:
25 Construction and Acquisition of Plant (including land):
-323,626,469 -774,572,910 26 Gross Additions to Utility Plant (less nuclear fuel)
27 Gross Additions to Nuclear Fuel
28 Gross Additions to Common Utility Plant
29 Gross Additions to Nonutility Plant
-390,738 -8,559,633 30 (Less) Allowance for Other Funds Used During Construction
31 Other (provide details in footnote):
32
33
-323,235,731 -766,013,277 34 Cash Outflows for Plant (Total of lines 26 thru 33)
35
36 Acquisition of Other Noncurrent Assets (d)
37 Proceeds from Disposal of Noncurrent Assets (d)
-822,613 -15,910 38 Other Investing (Outflows)
-27,916,725 -655,000 39 Investments in and Advances to Assoc. and Subsidiary Companies
40 Contributions and Advances from Assoc. and Subsidiary Companies
41 Disposition of Investments in (and Advances to)
42 Associated and Subsidiary Companies
43
44 Purchase of Investment Securities (a)
45 Proceeds from Sales of Investment Securities (a)
FERC FORM NO. 1 (ED. 12-96) Page 120
20170505-8016 FERC PDF (Unofficial) 04/07/2017
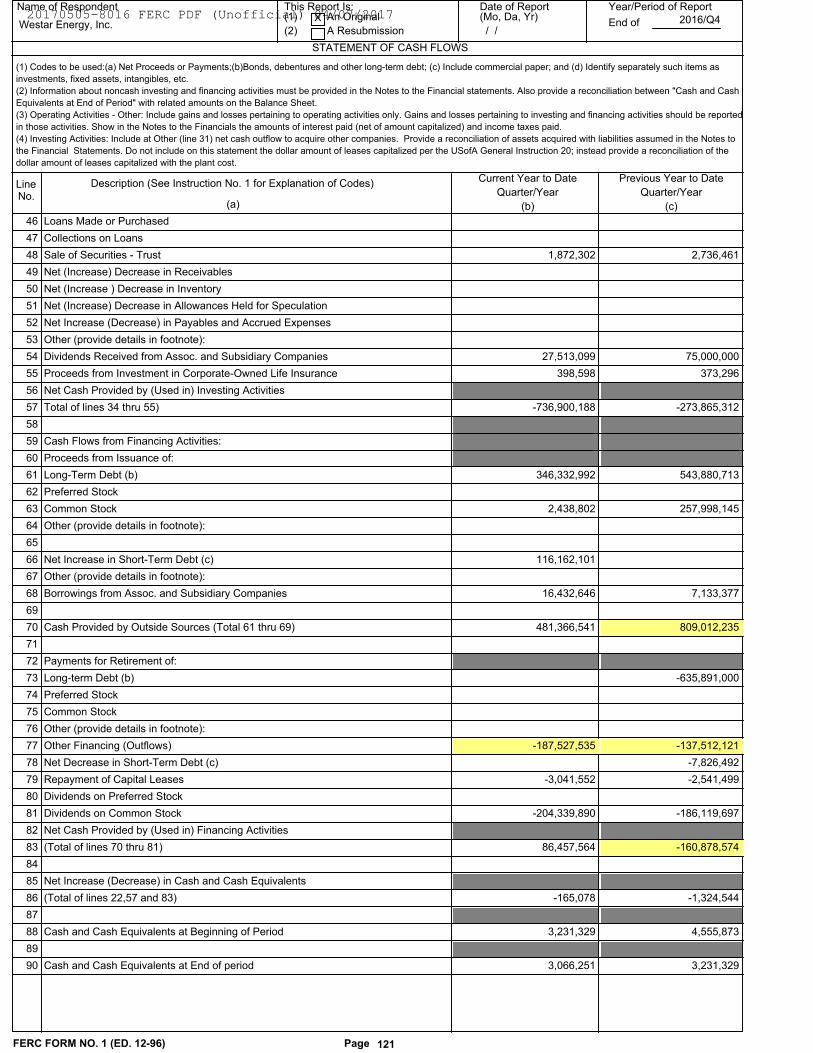
(1) Codes to be used:(a) Net Proceeds or Payments;(b)Bonds, debentures and other long-term debt; (c) Include commercial paper; and (d) Identify separately such items as
investments, fixed assets, intangibles, etc.
(2) Information about noncash investing and financing activities must be provided in the Notes to the Financial statements. Also provide a reconciliation between "Cash and Cash
Equivalents at End of Period" with related amounts on the Balance Sheet.
(3) Operating Activities - Other: Include gains and losses pertaining to operating activities only. Gains and losses pertaining to investing and financing activities should be reported
in those activities. Show in the Notes to the Financials the amounts of interest paid (net of amount capitalized) and income taxes paid.
(4) Investing Activities: Include at Other (line 31) net cash outflow to acquire other companies. Provide a reconciliation of assets acquired with liabilities assumed in the Notes to
the Financial Statements. Do not include on this statement the dollar amount of leases capitalized per the USofA General Instruction 20; instead provide a reconciliation of the
dollar amount of leases capitalized with the plant cost.
Name of Respondent This Report Is:(1) An Original
(2) A Resubmission
Date of Report(Mo, Da, Yr)
Year/Period of Report
End of
STATEMENT OF CASH FLOWS
Westar Energy, Inc.X
/ /2016/Q4
Line Description (See Instruction No. 1 for Explanation of Codes)Current Year to Date
Quarter/Year
(b)(a)No.
Previous Year to Date
Quarter/Year
(c)
46 Loans Made or Purchased
47 Collections on Loans
2,736,461 1,872,302 48 Sale of Securities - Trust
49 Net (Increase) Decrease in Receivables
50 Net (Increase ) Decrease in Inventory
51 Net (Increase) Decrease in Allowances Held for Speculation
52 Net Increase (Decrease) in Payables and Accrued Expenses
53 Other (provide details in footnote):
75,000,000 27,513,099 54 Dividends Received from Assoc. and Subsidiary Companies
373,296 398,598 55 Proceeds from Investment in Corporate-Owned Life Insurance
56 Net Cash Provided by (Used in) Investing Activities
-273,865,312 -736,900,188 57 Total of lines 34 thru 55)
58
59 Cash Flows from Financing Activities:
60 Proceeds from Issuance of:
543,880,713 346,332,992 61 Long-Term Debt (b)
62 Preferred Stock
257,998,145 2,438,802 63 Common Stock
64 Other (provide details in footnote):
65
116,162,101 66 Net Increase in Short-Term Debt (c)
67 Other (provide details in footnote):
7,133,377 16,432,646 68 Borrowings from Assoc. and Subsidiary Companies
69
809,012,235 481,366,541 70 Cash Provided by Outside Sources (Total 61 thru 69)
71
72 Payments for Retirement of:
-635,891,000 73 Long-term Debt (b)
74 Preferred Stock
75 Common Stock
76 Other (provide details in footnote):
-137,512,121 -187,527,535 77 Other Financing (Outflows)
-7,826,492 78 Net Decrease in Short-Term Debt (c)
-2,541,499 -3,041,552 79 Repayment of Capital Leases
80 Dividends on Preferred Stock
-186,119,697 -204,339,890 81 Dividends on Common Stock
82 Net Cash Provided by (Used in) Financing Activities
-160,878,574 86,457,564 83 (Total of lines 70 thru 81)
84
85 Net Increase (Decrease) in Cash and Cash Equivalents
-1,324,544 -165,078 86 (Total of lines 22,57 and 83)
87
4,555,873 3,231,329 88 Cash and Cash Equivalents at Beginning of Period
89
3,231,329 3,066,251 90 Cash and Cash Equivalents at End of period
FERC FORM NO. 1 (ED. 12-96) Page 121
20170505-8016 FERC PDF (Unofficial) 04/07/2017
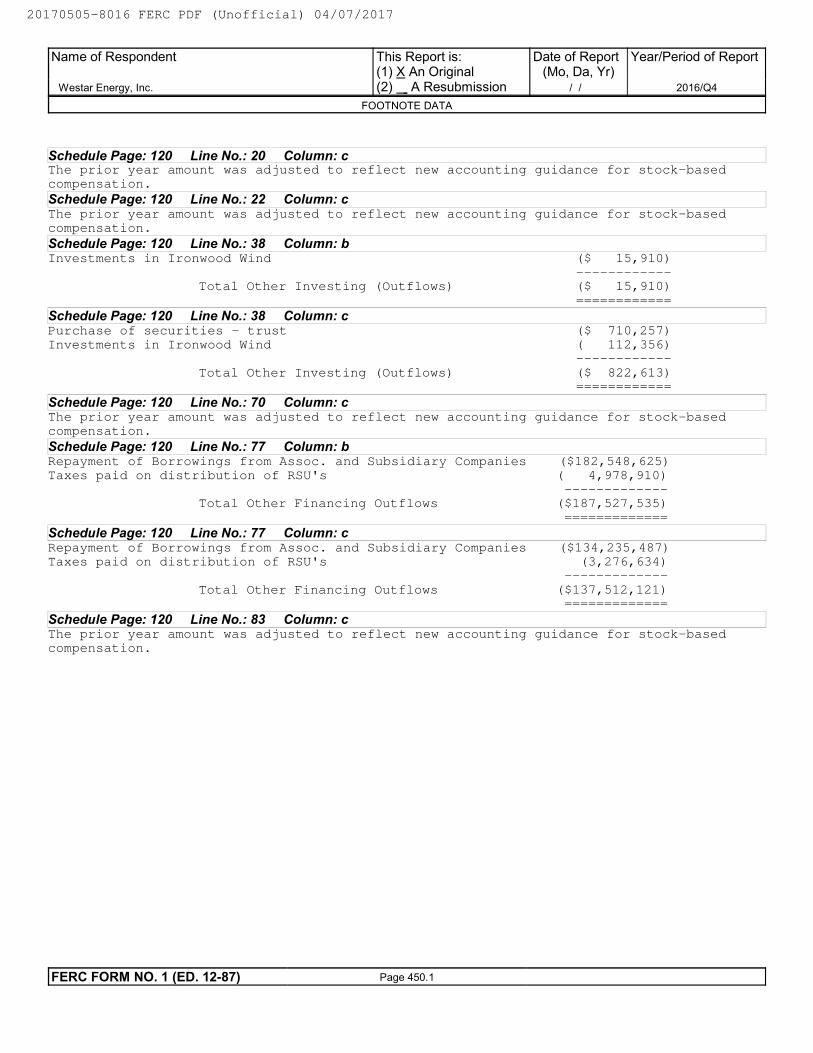
Schedule Page: 120 Line No.: 20 Column: cThe prior year amount was adjusted to reflect new accounting guidance for stock-basedcompensation.
Schedule Page: 120 Line No.: 22 Column: cThe prior year amount was adjusted to reflect new accounting guidance for stock-basedcompensation.
Schedule Page: 120 Line No.: 38 Column: bInvestments in Ironwood Wind ($ 15,910) ------------ Total Other Investing (Outflows) ($ 15,910) ============
Schedule Page: 120 Line No.: 38 Column: cPurchase of securities - trust ($ 710,257)Investments in Ironwood Wind ( 112,356) ------------ Total Other Investing (Outflows) ($ 822,613) ============
Schedule Page: 120 Line No.: 70 Column: cThe prior year amount was adjusted to reflect new accounting guidance for stock-basedcompensation.
Schedule Page: 120 Line No.: 77 Column: bRepayment of Borrowings from Assoc. and Subsidiary Companies ($182,548,625)Taxes paid on distribution of RSU's ( 4,978,910) ------------- Total Other Financing Outflows ($187,527,535) =============
Schedule Page: 120 Line No.: 77 Column: cRepayment of Borrowings from Assoc. and Subsidiary Companies ($134,235,487)Taxes paid on distribution of RSU's (3,276,634) ------------- Total Other Financing Outflows ($137,512,121) =============
Schedule Page: 120 Line No.: 83 Column: cThe prior year amount was adjusted to reflect new accounting guidance for stock-basedcompensation.
Name of Respondent
Westar Energy, Inc.
This Report is:(1) X An Original(2) A Resubmission
Date of Report(Mo, Da, Yr)
/ /
Year/Period of Report
2016/Q4
FOOTNOTE DATA
FERC FORM NO. 1 (ED. 12-87) Page 450.1
20170505-8016 FERC PDF (Unofficial) 04/07/2017
Name of Respondent This Report Is:(1) An Original
(2) A Resubmission
Date of Report Year/Period of Report
End of
NOTES TO FINANCIAL STATEMENTS
Westar Energy, Inc. X / /
2016/Q4
PAGE 122 INTENTIONALLY LEFT BLANK
SEE PAGE 123 FOR REQUIRED INFORMATION.
1. Use the space below for important notes regarding the Balance Sheet, Statement of Income for the year, Statement of Retained
Earnings for the year, and Statement of Cash Flows, or any account thereof. Classify the notes according to each basic statement,
providing a subheading for each statement except where a note is applicable to more than one statement.
2. Furnish particulars (details) as to any significant contingent assets or liabilities existing at end of year, including a brief explanation of
any action initiated by the Internal Revenue Service involving possible assessment of additional income taxes of material amount, or of
a claim for refund of income taxes of a material amount initiated by the utility. Give also a brief explanation of any dividends in arrears
on cumulative preferred stock.
3. For Account 116, Utility Plant Adjustments, explain the origin of such amount, debits and credits during the year, and plan of
disposition contemplated, giving references to Cormmission orders or other authorizations respecting classification of amounts as plant
adjustments and requirements as to disposition thereof.
4. Where Accounts 189, Unamortized Loss on Reacquired Debt, and 257, Unamortized Gain on Reacquired Debt, are not used, give
an explanation, providing the rate treatment given these items. See General Instruction 17 of the Uniform System of Accounts.
5. Give a concise explanation of any retained earnings restrictions and state the amount of retained earnings affected by such
restrictions.
6. If the notes to financial statements relating to the respondent company appearing in the annual report to the stockholders are
applicable and furnish the data required by instructions above and on pages 114-121, such notes may be included herein.
7. For the 3Q disclosures, respondent must provide in the notes sufficient disclosures so as to make the interim information not
misleading. Disclosures which would substantially duplicate the disclosures contained in the most recent FERC Annual Report may be
omitted.
8. For the 3Q disclosures, the disclosures shall be provided where events subsequent to the end of the most recent year have occurred
which have a material effect on the respondent. Respondent must include in the notes significant changes since the most recently
completed year in such items as: accounting principles and practices; estimates inherent in the preparation of the financial statements;
status of long-term contracts; capitalization including significant new borrowings or modifications of existing financing agreements; and
changes resulting from business combinations or dispositions. However were material contingencies exist, the disclosure of such
matters shall be provided even though a significant change since year end may not have occurred.
9. Finally, if the notes to the financial statements relating to the respondent appearing in the annual report to the stockholders are
applicable and furnish the data required by the above instructions, such notes may be included herein.
FERC FORM NO. 1 (ED. 12-96) Page 122
20170505-8016 FERC PDF (Unofficial) 04/07/2017
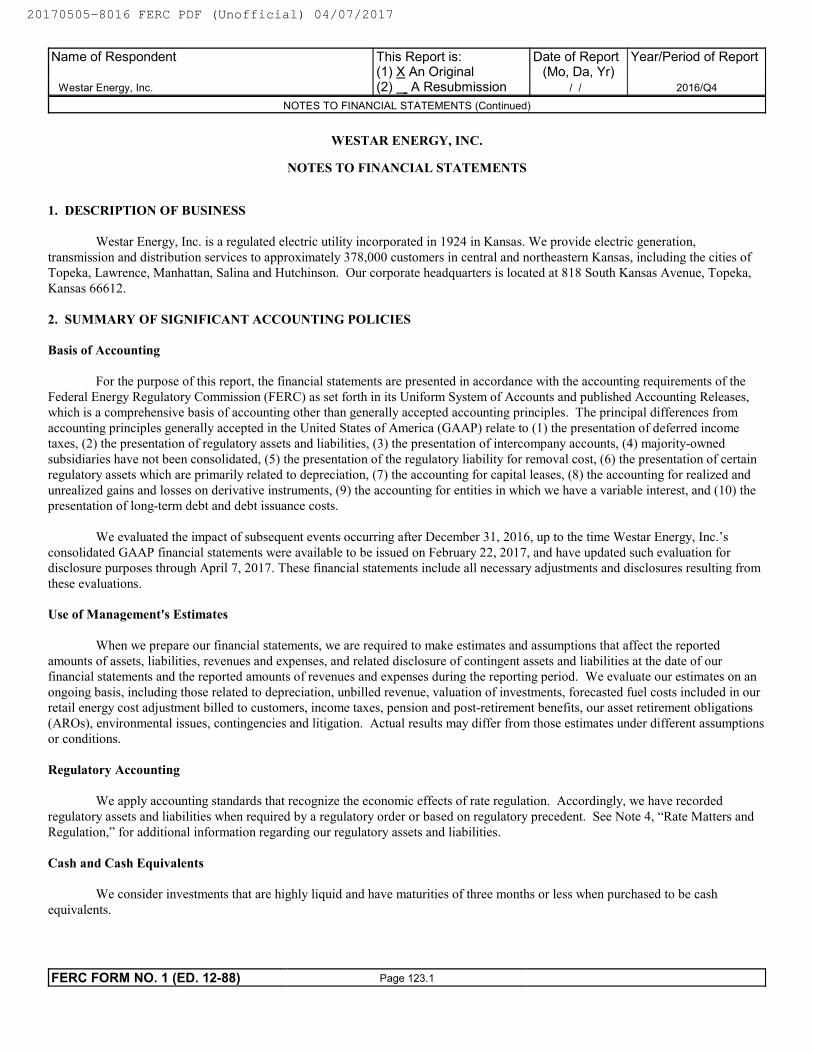
WESTAR ENERGY, INC.
NOTES TO FINANCIAL STATEMENTS
1. DESCRIPTION OF BUSINESS
Westar Energy, Inc. is a regulated electric utility incorporated in 1924 in Kansas. We provide electric generation,
transmission and distribution services to approximately 378,000 customers in central and northeastern Kansas, including the cities ofTopeka, Lawrence, Manhattan, Salina and Hutchinson. Our corporate headquarters is located at 818 South Kansas Avenue, Topeka,
Kansas 66612.
2. SUMMARY OF SIGNIFICANT ACCOUNTING POLICIES
Basis of Accounting
For the purpose of this report, the financial statements are presented in accordance with the accounting requirements of the
Federal Energy Regulatory Commission (FERC) as set forth in its Uniform System of Accounts and published Accounting Releases,which is a comprehensive basis of accounting other than generally accepted accounting principles. The principal differences from
accounting principles generally accepted in the United States of America (GAAP) relate to (1) the presentation of deferred incometaxes, (2) the presentation of regulatory assets and liabilities, (3) the presentation of intercompany accounts, (4) majority-owned
subsidiaries have not been consolidated, (5) the presentation of the regulatory liability for removal cost, (6) the presentation of certainregulatory assets which are primarily related to depreciation, (7) the accounting for capital leases, (8) the accounting for realized and
unrealized gains and losses on derivative instruments, (9) the accounting for entities in which we have a variable interest, and (10) thepresentation of long-term debt and debt issuance costs.
We evaluated the impact of subsequent events occurring after December 31, 2016, up to the time Westar Energy, Inc.’s
consolidated GAAP financial statements were available to be issued on February 22, 2017, and have updated such evaluation fordisclosure purposes through April 7, 2017. These financial statements include all necessary adjustments and disclosures resulting from
these evaluations.
Use of Management's Estimates
When we prepare our financial statements, we are required to make estimates and assumptions that affect the reported
amounts of assets, liabilities, revenues and expenses, and related disclosure of contingent assets and liabilities at the date of ourfinancial statements and the reported amounts of revenues and expenses during the reporting period. We evaluate our estimates on an
ongoing basis, including those related to depreciation, unbilled revenue, valuation of investments, forecasted fuel costs included in ourretail energy cost adjustment billed to customers, income taxes, pension and post-retirement benefits, our asset retirement obligations
(AROs), environmental issues, contingencies and litigation. Actual results may differ from those estimates under different assumptionsor conditions.
Regulatory Accounting
We apply accounting standards that recognize the economic effects of rate regulation. Accordingly, we have recorded
regulatory assets and liabilities when required by a regulatory order or based on regulatory precedent. See Note 4, “Rate Matters and
Regulation,” for additional information regarding our regulatory assets and liabilities.
Cash and Cash Equivalents
We consider investments that are highly liquid and have maturities of three months or less when purchased to be cash
equivalents.
Name of Respondent
Westar Energy, Inc.
This Report is:(1) X An Original(2) A Resubmission
Date of Report(Mo, Da, Yr)
/ /
Year/Period of Report
2016/Q4
NOTES TO FINANCIAL STATEMENTS (Continued)
FERC FORM NO. 1 (ED. 12-88) Page 123.1
20170505-8016 FERC PDF (Unofficial) 04/07/2017
Fuel Inventory and Supplies
We state fuel inventory and supplies at average cost.
Property, Plant and Equipment
We record the value of property, plant and equipment at cost. For plant, cost includes contracted services, direct labor and
materials, indirect charges for engineering and supervision and an allowance for funds used during construction (AFUDC). AFUDCrepresents the allowed cost of capital used to finance utility construction activity. We compute AFUDC by applying a composite rate
to qualified construction work in progress. We credit other income (for equity funds) and net interest charges (for borrowed funds) forthe amount of AFUDC capitalized as construction cost on the accompanying statements of income as follows:
Year Ended
December 31,
2016 2015
(Dollars in Thousands)
Borrowed funds.................... $ 7,300 $ 892
Equity funds......................... 8,560 391
Total…………………… $ 15,860 $ 1,283
Average AFUDC Rates........ 4.2 % 1.9 %
We charge maintenance costs and replacements of minor items of property to expense as incurred. When a unit ofdepreciable property is retired, we charge to accumulated depreciation the original cost less salvage value.
Depreciation
We depreciate utility plant using a straight-line method. The depreciation rates are based on an average annual compositebasis using group rates that approximated 2.7% in 2016 and 2.8% in 2015.
Revenue Recognition
We record revenue at the time we deliver electricity to customers. We determine the amounts delivered to individual
customers through systematic monthly readings of customer meters. At the end of each month, we estimate how much electricity wehave delivered since the prior meter reading and record the corresponding unbilled revenue.
Our unbilled revenue estimate is affected by factors including fluctuations in energy demand, weather, line losses and changes
in the composition of customer classes. We recorded estimated unbilled revenue of $38.5 million as of December 31, 2016, and $34.0million as of December 31, 2015.
Allowance for Doubtful Accounts
We determine our allowance for doubtful accounts based on the age of our receivables. We charge receivables off when theyare deemed uncollectible, which is based on a number of factors including specific facts surrounding an account and management’s
judgment.
Name of Respondent
Westar Energy, Inc.
This Report is:(1) X An Original(2) A Resubmission
Date of Report(Mo, Da, Yr)
/ /
Year/Period of Report
2016/Q4
NOTES TO FINANCIAL STATEMENTS (Continued)
FERC FORM NO. 1 (ED. 12-88) Page 123.2
20170505-8016 FERC PDF (Unofficial) 04/07/2017
Income Taxes
We use the asset and liability method of accounting for income taxes. Under this method, we recognize deferred tax assetsand liabilities for the future tax consequences attributable to temporary differences between the financial statement carrying amounts
and the tax basis of existing assets and liabilities. We recognize the future tax benefits to the extent that realization of such benefits ismore likely than not. We amortize deferred investment tax credits over the lives of the related properties as required by tax laws and
regulatory practices. We recognize production tax credits in the year that electricity is generated to the extent that realization of suchbenefits is more likely than not.
We record deferred tax assets to the extent capital losses, operating losses or tax credits will be carried forward to future
periods. However, when we believe based on available evidence that we do not, or will not, have sufficient future capital gains ortaxable income in the appropriate taxing jurisdiction to realize the entire benefit during the applicable carryforward period, we record a
valuation allowance against the deferred tax asset.
The application of income tax law is complex. Laws and regulations in this area are voluminous and often ambiguous. Accordingly, we must make judgments regarding income tax exposure. Interpretations of and guidance surrounding income tax laws
and regulations change over time. As a result, changes in our judgments can materially affect amounts we recognize in our financialstatements. See Note 9, “Taxes,” for additional detail on our accounting for income taxes.
Sales Tax
We account for the collection and remittance of sales tax on a net basis. As a result, we do not reflect sales tax in our
statements of income.
Supplemental Cash Flow Information
Year Ended December 31,
2016 2015
(In Thousands)
CASH PAID FOR (RECEIVED FROM):
Interest on financing activities, net of amount capitalized........................................................ $ 87,517 $ 109,260
Income taxes, net of refunds..................................................................................................... 13,144 (410)
NON-CASH INVESTING TRANSACTIONS:
Property, plant and equipment additions.................................................................................. 82,146 57,068
NON-CASH FINANCING TRANSACTIONS:
Issuance of stock for compensation and reinvested dividends.................................................. 9,685 10,453
Assets acquired through capital leases...................................................................................... 2,744 3,130
New Accounting Pronouncements
We prepare our financial statements in accordance with the accounting requirements of FERC which can be impacted bychanges in GAAP. To address current issues in accounting, the Financial Accounting Standards Board (FASB) issued the following
new accounting pronouncements which may affect our accounting and/or disclosure.
Name of Respondent
Westar Energy, Inc.
This Report is:(1) X An Original(2) A Resubmission
Date of Report(Mo, Da, Yr)
/ /
Year/Period of Report
2016/Q4
NOTES TO FINANCIAL STATEMENTS (Continued)
FERC FORM NO. 1 (ED. 12-88) Page 123.3
20170505-8016 FERC PDF (Unofficial) 04/07/2017
Statement of Cash Flows
In August 2016, the FASB issued Accounting Standard Update (ASU) No. 2016-15, which clarifies how certain cash receipts
and cash payments are presented and classified in the statement of cash flows. Among other clarifications, the guidance requires thatcash proceeds received from the settlement of corporate-owned life insurance (COLI) policies be classified as cash inflows from
investing activities and that cash payments for premiums on COLI policies may be classified as cash outflows for investing activities,operating activities or a combination of both. The guidance is effective for fiscal years beginning after December 15, 2017, with early
adoption permitted. Retrospective application is required. We are evaluating the guidance and do not expect it to have a materialimpact on our financial statements.
Stock-based Compensation
In March 2016, the FASB issued ASU No. 2016-09 as part of its simplification initiative. The areas for simplificationinvolve several aspects of the accounting for stock-based payment transactions, including the income tax consequences, classification
of awards as either equity or liabilities, and classification on the statement of cash flows. The guidance is effective for fiscal yearsbeginning after December 15, 2016, with early adoption permitted. We have elected to adopt effective January 1, 2016.
Prior to the adoption of ASU 2016-09, if the tax deduction for a stock-based payment award exceeded the compensation cost
recorded for financial reporting, the additional tax benefit was recognized in additional paid-in capital and referred to as an excess taxbenefit. Tax deficiencies were recognized either as an offset to the accumulated excess tax benefits, if any, or as reduction of income.
The issuance of this ASU reflects the FASB’s decision that all prospective excess tax benefits and tax deficiencies should berecognized as income tax benefits or expense, respectively. Prior to the adoption of the ASU, additional paid-in-capital was not
recognized to the extent that an excess tax benefit had not be realized (e.g., due to a carryforward of a net operating loss). Under theASU, all excess tax benefits previously unrecognized because the related tax deduction had not reduced taxes payable are recognized
on a modified retrospective basis as a cumulative-effect adjustment to retained earnings as of the date of adoption. Upon initialadoption, we recorded a $3.3 million cumulative effect adjustment to retained earnings for excess tax benefits that had not previously
been recognized as well as a $3.3 million increase in deferred tax assets.
Further, the issuance of this ASU reflects the FASB’s decision that cash flows related to excess tax benefits should beclassified as cash flows from operating activities on the statements of cash flows. Upon adoption, we have retrospectively presented
cash flows from operating activities on the accompanying statements of cash flows for the years ended December 31, 2015 as $1.3million higher than as previously reported. We have retrospectively presented cash flows from financing activities as $1.3 million
lower for the year ended December 31, 2015 than as previously reported.
Leases
In February 2016, the FASB issued ASU No. 2016-02, which requires a lessee to recognize right-of-use assets and lease
liabilities, initially measured at present value of the lease payments, on its balance sheet for leases with terms longer than 12 months. Leases are to be classified as either financing or operating leases, with that classification affecting the pattern of expense recognition in
the income statement. Accounting for leases by lessors is largely unchanged. The criteria used to determine lease classification willremain substantially the same, but will be more subjective under the new guidance. The guidance is effective for fiscal years beginning
after December 15, 2018, with early adoption permitted. The guidance requires a modified retrospective approach for all leasesexisting at the earliest period presented, or entered into by the date of initial adoption, with certain practical expedients permitted. We
are unable to predict whether FERC will adopt these changes or the resulting impact to our financial statements.
Financial Instruments - Credit Losses
In June 2016, the FASB issued ASU No. 2016-13, which requires financial assets measured at amortized cost be presented at
the net amount expected to be collected. The allowance for credit losses is a valuation account that is deducted from the amortizedcost basis. The measurement of expected losses is based upon historical experience, current conditions, and reasonable and supportable
forecasts that affect the collectability of the reported amount. This guidance is effective for fiscal years beginning after December 15,2019, with early adoption permitted. We are evaluating the guidance and have not yet determined the impact on our financial
statements.
Name of Respondent
Westar Energy, Inc.
This Report is:(1) X An Original(2) A Resubmission
Date of Report(Mo, Da, Yr)
/ /
Year/Period of Report
2016/Q4
NOTES TO FINANCIAL STATEMENTS (Continued)
FERC FORM NO. 1 (ED. 12-88) Page 123.4
20170505-8016 FERC PDF (Unofficial) 04/07/2017
Financial Instruments - Net Asset Value
In May 2015, the FASB issued ASU No. 2015-07, which removes the requirement to categorize certain investments measuredat net asset value (NAV) per share within the fair value hierarchy. The guidance is effective for fiscal years beginning after December
15, 2015. We have adopted this guidance as of January 1, 2016. The guidance was adopted retrospectively. The adoption was limitedto disclosure and does not have a material impact on our financial statements. See Note 5, “Financial Instruments and Trading
Securities.”
Revenue Recognition
In May 2014, the FASB issued ASU No. 2014-09, which addresses revenue from contracts with customers. Subsequent
ASUs have been released providing modifications and clarifications to ASU No. 2014-09. The objective of the new guidance is toestablish principles to report useful information to users of financial statements about the nature, amount, timing and uncertainty of
revenue from contracts with customers. Under the new standard, an entity must identify the performance obligations in a contract,determine the transaction price and allocate the price to specific performance obligations to recognize the revenue when the obligation
is completed. This guidance is effective for fiscal years beginning after December 15, 2017. Early application of the standard ispermitted for fiscal years beginning after December 15, 2016. The standard permits the use of either the retrospective application or
cumulative effect transition method. We have not yet selected a transition method. We are unable to predict whether FERC will adoptthese changes or the resulting impact to our financial statements.
3. PENDING MERGER
On May 29, 2016, we entered into an agreement and plan of merger (merger) with Great Plains Energy Incorporated (GreatPlains Energy), a Missouri corporation, providing for the merger of a wholly-owned subsidiary of Great Plains Energy with and into
Westar Energy, with Westar Energy surviving as a wholly-owned subsidiary of Great Plains Energy. At the closing of the merger, ourshareholders will receive cash and shares of Great Plains Energy. Each issued and outstanding share of our common stock, other than
certain restricted shares, will be canceled and automatically converted into $51.00 in cash, without interest, and a number of shares ofGreat Plains Energy common stock equal to an exchange ratio that may vary between 0.2709 and 0.3148, based upon the
volume-weighted average share price of Great Plains Energy common stock on the New York Stock Exchange for the 20 consecutivefull trading days ending on (and including) the third trading day immediately prior to the closing date of the transaction. Based on the
closing price per share of Great Plains Energy common stock on the trading day prior to announcement of the merger, our shareholderswould receive an implied $60.00 for each share of Westar Energy common stock.
The merger agreement includes certain restrictions and limitations on our ability to declare dividend payments. The merger
agreement, without prior approval of Great Plains Energy, limits our quarterly dividends declared in 2017 to $0.40 per share, whichrepresents an annualized increase of $0.08 per share, consistent with last year’s dividend increase.
The closing of the merger is subject to customary conditions including, among others, receipt of required regulatoryapprovals. On June 28, 2016, we and Great Plains Energy filed a joint application with the Kansas Corporation Commission (KCC)
requesting approval of the merger. Unless otherwise agreed to by the applicants, Kansas law imposes a 300-day time limit on theKCC’s review of the joint application. On September 27, 2016, the KCC issued an order setting a procedural schedule for the
application, with a KCC order date of April 24, 2017. On December 16, 2016, KCC staff and its representatives filed testimony that,among other things, objected to the proposed merger, stated that no changes could be made to the joint application filed by us and
Great Plains Energy that would satisfy the KCC staff and recommended that the KCC reject the merger. A number of interveningparties also filed testimony against approval of the merger. On January 9, 2017, we and Great Plains Energy filed rebuttal testimony in
response to the KCC staff and the other intervenors explaining why we and Great Plains Energy believe the joint application meets theKCC’s merger standards and why the merger is in the public interest. An evidentiary hearing was held at the KCC from January 30,
2017 to February 7, 2017.
In addition, there are two open dockets in Missouri related to the merger. In the first docket, Great Plains Energy soughtapproval from the Public Service Commission of the State of Missouri (MPSC) to waive certain affiliate transaction rules following the
closing of the merger. In this docket, on October 12, 2016, and on October 26, 2016, the MPSC staff and the Office of Public Counsel(OPC), respectively, announced that each had entered into a Stipulation and Agreement with Great Plains Energy that, among other
Name of Respondent
Westar Energy, Inc.
This Report is:(1) X An Original(2) A Resubmission
Date of Report(Mo, Da, Yr)
/ /
Year/Period of Report
2016/Q4
NOTES TO FINANCIAL STATEMENTS (Continued)
FERC FORM NO. 1 (ED. 12-88) Page 123.5
20170505-8016 FERC PDF (Unofficial) 04/07/2017
things, provided that MPSC staff and the OPC would not file a complaint, or support another complaint, to assert that the MPSC hasjurisdiction over the merger. The Stipulation and Agreements are subject to approval by the MPSC. Regarding the second docket, on
October 11, 2016, a consumer group filed complaints against us and Great Plains Energy with the MPSC seeking to have the MPSCassert jurisdiction over the merger, and various parties have intervened in these complaints. On February 22, 2017, the MPSC issued
an order directing Great Plains Energy to file an application for approval of the merger within ten days of the date of the order.Evidentiary hearings were conducted April 5, 2017 through April 7, 2017. While there is not a statutory deadline for an MPSC ruling
on the merger application, the MPSC has indicated it intends to work towards a ruling on an expedited schedule, but it may not beconsistent with the KCC schedule outlined above.
On July 11, 2016, we and Great Plains Energy filed a joint application with the FERC requesting approval of the merger.
Approval of the merger application requires action by the FERC commissioners because it is a contested application. The Federal
Power Act requires a quorum of three or more commissioners to act on a contested application. Following the resignation of the FERCChairman effective February 3, 2017, the FERC commission is comprised only of two commissioners and is therefore unable to act on
the application. A new commissioner must be appointed by the President of the United States, with the advice and consent of theUnited States Senate, before FERC will be able to act on the application. If the FERC commissioners do not issue an order on the
application within 180 days after the application was deemed complete because of the lack of a quorum, approval of the applicationmay be deemed granted by operation of law, unless an order is issued extending the time for review. The FERC staff has authority to
issue an order extending the period for review of the application. Under these circumstances, we do not believe it is likely that theFERC staff will allow approval of our application to be deemed granted. We are unable to predict when FERC will regain a quorum or
how the change in commissioners will impact the review of the application.
On July 22, 2016, Wolf Creek Nuclear Operating Corporation filed a request with the Nuclear Regulatory Commission
(NRC) to approve an indirect transfer of control of Wolf Creek’s operating license.
On September 26, 2016, we and Great Plains Energy filed the antitrust notifications required under the Hart-Scott-RodinoAntitrust Improvements Act (HSR Act) to complete the merger. We and Great Plains Energy received early termination of the
statutory waiting period under the HSR Act on October 21, 2016. Under the HSR Act, a new statutory waiting period will start oneyear from the date on which an existing waiting period expires, or October 21, 2017. Accordingly, if the merger has not closed prior to
October 21, 2017, we and Great Plains Energy will need to re-file the necessary HSR Act notifications.
Also on September 26, 2016, the proposed merger was approved by our shareholders. Concurrently, shareholders of GreatPlains Energy approved various matters necessary for Great Plains Energy to complete the merger.
The merger agreement, which contains customary representations, warranties and covenants, may be terminated by either
party if the merger has not occurred by May 31, 2017. The termination date may be extended six months in order to obtain regulatoryapprovals. If the merger agreement is terminated under these circumstances, including the failure to obtain regulatory approvals, Great
Plains Energy must pay us a termination fee of $380.0 million.
The merger agreement also provides for certain other termination rights for both us and Great Plains Energy. If (a) the
merger agreement is terminated by either party because the end date occurred, or by us because Great Plains Energy is in breach of themerger agreement and (b) prior to such termination, an alternative acquisition proposal is made to Great Plains Energy or its board of
directors or has been publicly disclosed and not withdrawn and within 12 months after termination of the merger agreement GreatPlains Energy enters into an acquisition proposal, Great Plains Energy must pay us a termination fee of $180.0 million. In addition, if
either party terminates the merger agreement because the end date occurred, or if Great Plains Energy terminates the merger agreementbecause we are in breach of the merger agreement, and (a) prior to such termination, an alternative acquisition proposal is made to us
or our board of directors or is publicly disclosed and not withdrawn, and (b) within 12 months after termination of the mergeragreement, we enter into a definitive agreement or consummate a transaction with respect to an acquisition proposal, we must pay
Great Plains Energy a termination fee of $280.0 million.
In connection with this transaction, we have incurred merger-related expenses. During 2016, we recorded approximately$14.6 million of merger-related expenses, including internal labor of $3.9 million, in account 426.5 – Other Deductions on our
statement of income.
See also Note 13, “Legal Proceedings,” for more information on litigation related to the merger.
Name of Respondent
Westar Energy, Inc.
This Report is:(1) X An Original(2) A Resubmission
Date of Report(Mo, Da, Yr)
/ /
Year/Period of Report
2016/Q4
NOTES TO FINANCIAL STATEMENTS (Continued)
FERC FORM NO. 1 (ED. 12-88) Page 123.6
20170505-8016 FERC PDF (Unofficial) 04/07/2017
4. RATE MATTERS AND REGULATION
Regulatory Assets and Regulatory Liabilities
Regulatory assets represent incurred costs that have been deferred because they are probable of future recovery in customerprices. Regulatory liabilities represent probable future reductions in revenue or refunds to customers through the price setting process.
Regulatory assets and liabilities reflected on our balance sheets are as follows.
As of December 31,
2016 2015
(In Thousands)
Regulatory Assets:
Deferred employee benefits costs......................................................... $ 313,588 $ 293,438
Amounts due from customers for future income taxes.......................... 52,320 53,273
Retail energy cost adjustment............................................................... 16,253 —
Asset retirement obligations.................................................................. 9,974 10,262
Ad valorem tax...................................................................................... 7,635 33,512
Energy efficiency program costs........................................................... 4,851 4,156
Depreciation.......................................................................................... 4,227 4,582
Other regulatory assets.......................................................................... 2,643 2,134
Total regulatory assets...................................................................... $ 411,491 $ 401,357
Regulatory Liabilities:
Pension and other post-retirement benefits costs.................................. $ 36,550 $ 32,028
Kansas tax credits................................................................................. 13,142 12,857
Jurisdictional AFUDC........................................................................... 10,970 10,158
Amounts due to customers for future taxes........................................... 9,656 10,577
Purchase power agreement.................................................................... 9,265 9,972
Retail energy cost adjustment............................................................... — 6,449
Other regulatory liabilities.................................................................... 3,425 3,349
Total regulatory liabilities................................................................ $ 83,008 $ 85,390
Below we summarize the nature and period of recovery for each of the regulatory assets listed in the table above.
• Deferred employee benefits costs: Includes $287.9 million for pension and post-retirement benefit obligations
and $25.7 million for actual pension expense in excess of the amount of such expense recognized in setting our
prices. The increase from 2015 to 2016 is attributable primarily to a decrease in the discount rates used tocalculate our pension benefit obligations. During 2017, we will amortize to expense approximately $22.9
million of the benefit obligations and approximately $5.7 million of the excess pension expense. We areamortizing the excess pension expense over a five-year period. We do not earn a return on this asset.
Name of Respondent
Westar Energy, Inc.
This Report is:(1) X An Original(2) A Resubmission
Date of Report(Mo, Da, Yr)
/ /
Year/Period of Report
2016/Q4
NOTES TO FINANCIAL STATEMENTS (Continued)
FERC FORM NO. 1 (ED. 12-88) Page 123.7
20170505-8016 FERC PDF (Unofficial) 04/07/2017
• Amounts due from customers for future income taxes: In accordance with various orders, we have reduced
our prices to reflect the income tax benefits associated with certain income tax deductions, thereby passing onthese benefits to customers at the time we receive them. We believe it is probable that the net future increases in
income taxes payable will be recovered from customers when these temporary income tax benefits reverse infuture periods. We have also recorded our obligation to customers for income taxes recovered in earlier periods
when corporate income tax rates were higher than current income tax rates. This benefit will be returned tocustomers as these temporary differences reverse in future periods. The income tax-related items are temporary
differences for which deferred income taxes have been provided. These items are measured by the expected cashflows to be received or settled in future prices. We do not earn a return on this net asset.
• Retail energy cost adjustment: We are allowed to adjust our retail prices to reflect changes in the
cost of fuel and purchased power needed to serve our customers. This item represents the actual cost
of fuel consumed in producing electricity and the cost of purchased power in excess of the amounts wehave collected from customers. We expect to recover in our prices this shortfall over a one-year
period. We do not earn a return on this asset.
• Asset retirement obligations: Represents amounts associated with our AROs as discussed in Note 12,
“Asset Retirement Obligations.” We recover these amounts over the life of the related plant. We do not earn
a return on this asset.
• Ad valorem tax: Represents actual costs incurred for property taxes in excess of amounts collected in our
prices. We expect to recover these amounts in our prices over a one-year period. We do not earn a return on
this asset.
• Energy efficiency program costs: We accumulate and defer for future recovery costs related to our various
energy efficiency programs. We will amortize such costs over a one-year period. We do not earn a return onthis asset.
• Depreciation: Represents the difference between regulatory depreciation expense and depreciation expense
we record for financial reporting purposes. We earn a return on this asset and amortize the difference over thelife of the related plant.
• Other regulatory assets: Includes various regulatory assets that individually are small in relation to the total
regulatory asset balance. Other regulatory assets have various recovery periods. We do not earn a return onany of these assets.
Below we summarize the nature and period of amortization for each of the regulatory liabilities listed in the table
above.
• Pension and other post-retirement benefits costs: Includes $6.8 million for pension and post-retirement
benefit obligations and $29.8 million for pension and post-retirement expense recognized in setting our pricesin excess of actual pension and post-retirement expense. During 2017, we will amortize to expense
$3.4 million of the excess pension and post-retirement expense recognized in setting our prices. We willamortize the excess pension and post-retirement expense over a five-year period.
• Kansas tax credits: This item represents Kansas tax credits on investments in utility plant. Amounts will be
credited to customers subsequent to their realization over the remaining lives of the utility plant giving rise tothe tax credits.
• Jurisdictional AFUDC: This item represents AFUDC that is accrued subsequent to the time the associated
construction charges are included in our rates and prior to the time the related assets are placed in service. The AFUDC is amortized to depreciation expense over the useful life of the asset that is placed in service.
Name of Respondent
Westar Energy, Inc.
This Report is:(1) X An Original(2) A Resubmission
Date of Report(Mo, Da, Yr)
/ /
Year/Period of Report
2016/Q4
NOTES TO FINANCIAL STATEMENTS (Continued)
FERC FORM NO. 1 (ED. 12-88) Page 123.8
20170505-8016 FERC PDF (Unofficial) 04/07/2017
• Amounts due to customers for future taxes: We have recorded a regulatory liability for our obligation to
reduce rates charged to customers for unamortized investment tax credits and for income taxes related tojurisdictional allowances for equity funds used during construction. These tax-related items are temporary
differences for which deferred income taxes have been provided. These items are measured by the expectedcash flows to be received or settled through future rates.
• Purchase power agreement: This item represents the amount included in retail electric rates from customers
in excess of the costs incurred by us under the purchase power agreement with Westar Generating, Inc. Weamortize the amount over a three-year period.
• Retail energy cost adjustment: We are allowed to adjust our retail prices to reflect changes in the cost of
fuel and purchased power needed to serve our customers. We bill customers based on our estimated costs. This item represents the amount we collected from customers that was in excess of our actual cost of fuel and
purchased power. We will refund to customers this excess recovery over a one-year period.
• Other regulatory liabilities: Includes various regulatory liabilities that individually are relatively small in
relation to the total regulatory liability balance. Other regulatory liabilities will be credited over various
periods.
KCC Proceedings
General and Abbreviated Rate Reviews
In October 2016, we filed an abbreviated rate review with the KCC to update our prices to include costs related to programs
to improve grid resiliency and costs associated with investments in environmental projects during 2015. If approved, we estimate thatthe new prices will increase our annual retail revenues by approximately $9.0 million. The KCC is required to issue an order on our
request within 240 days of our filing, which is in June 2017.
In September 2015, the KCC issued an order in our state general rate case allowing us to adjust our prices to include, amongother things, additional investment in our power plants including environmental upgrades. The new prices were effective late October
2015 and are expected to increase our annual retail revenues by approximately $40.7 million.
Environmental Costs
In October 2015, in connection with the state general rate review, we agreed to no longer make annual filings with the KCC to
adjust our prices to include costs associated with investments in air quality equipment made during the prior year. The existingbalance of costs associated with these investments were rolled into our base prices. In the future, we will need to seek approval from
the KCC for individual projects. In June 2015, the KCC issued orders related to such filings allowing us to increase our annual retailrevenues by approximately $5.7 million.
Transmission Costs
We make annual filings with the KCC to adjust our prices to include updated transmission costs as reflected in ourtransmission formula rate (TFR) discussed below. In the most recent two years, the KCC issued orders related to such filings allowing
us to increase our annual retail revenues by approximately:
• $3.6 million effective in April 2016;• $4.0 million effective in April 2015.
In June 2016, the KCC approved an order allowing us to adjust our retail prices to include updated transmission costs as
reflected in the TFR, along with the reduced return on equity (ROE) as described below. The updated prices were retroactivelyeffective April 2016. We have begun refunding our previously-recorded refund obligation and as of December 31, 2016, we have a
Name of Respondent
Westar Energy, Inc.
This Report is:(1) X An Original(2) A Resubmission
Date of Report(Mo, Da, Yr)
/ /
Year/Period of Report
2016/Q4
NOTES TO FINANCIAL STATEMENTS (Continued)
FERC FORM NO. 1 (ED. 12-88) Page 123.9
20170505-8016 FERC PDF (Unofficial) 04/07/2017
remaining refund obligation of $0.6 million.
Property Tax Surcharge
We make annual filings with the KCC to adjust our prices to include the cost incurred for property taxes. In October 2015, in
connection with the state general rate review, the existing balance of costs incurred for property taxes were rolled into our base prices. In the most recent two years, the KCC issued orders related to such filings allowing us to adjust our annual retail revenues by
approximately:
• $2.7 million increase effective in January 2016;• $2.6 million increase effective in January 2015.
FERC Proceedings
In October of each year, we post an updated TFR that includes projected transmission capital expenditures and operatingcosts for the following year. This rate provides the basis for our annual request with the KCC to adjust our retail prices to include
updated transmission costs as noted above. In the most recent two years, we posted our TFR, which was expected to adjust our annualtransmission revenues by approximately:
• $12.0 million increase effective in January 2016;
• $2.3 million decrease effective in January 2015.
In March 2016, the FERC approved a settlement reducing our base ROE used in determining our TFR. The settlement resultsin an ROE of 10.3%, which consists of a 9.8% base ROE plus a 0.5% incentive ROE for participation in a regional transmission
organization (RTO). The updated prices were retroactively effective January 2016. This adjustment also reflects estimated recoveryof increased transmission capital expenditures and operating costs. We have begun refunding our previously recorded refund
obligation and as of December 31, 2016, we have a remaining refund obligation of $0.6 million.
5. FINANCIAL INSTRUMENTS AND TRADING SECURITIES
Values of Financial Instruments
GAAP establishes a hierarchical framework for disclosing the transparency of the inputs utilized in measuring assets and
liabilities at fair value. Our assessment of the significance of a particular input to the fair value measurement requires judgment andmay affect the classification of assets and liabilities within the fair value hierarchy levels. In addition, we measure certain investments
that do not have a readily determinable fair value at NAV, which are not included in the fair value hierarchy. Further explanation ofthese levels and NAV is summarized below.
• Level 1 - Quoted prices are available in active markets for identical assets or liabilities. The types of assets and liabilities
included in level 1 are highly liquid and actively traded instruments with quoted prices, such as equities listed on publicexchanges.
• Level 2 - Pricing inputs are not quoted prices in active markets, but are either directly or indirectly observable. The types
of assets and liabilities included in level 2 are typically liquid investments in funds which have a readily determinable fairvalue calculated using daily NAVs, other financial instruments that are comparable to actively traded securities or
contracts, such as treasury securities with pricing interpolated from recent trades of similar securities, or other financialinstruments priced with models using highly observable inputs.
• Level 3 - Significant inputs to pricing have little or no transparency. The types of assets and liabilities included in level 3
are those with inputs requiring significant management judgment or estimation.
Name of Respondent
Westar Energy, Inc.
This Report is:(1) X An Original(2) A Resubmission
Date of Report(Mo, Da, Yr)
/ /
Year/Period of Report
2016/Q4
NOTES TO FINANCIAL STATEMENTS (Continued)
FERC FORM NO. 1 (ED. 12-88) Page 123.10
20170505-8016 FERC PDF (Unofficial) 04/07/2017
• Net Asset Value - Investments that do not have a readily determinable fair value are measured at NAV. These
investments do not consider the observability of inputs, therefore, they are not included within the fair value hierarchy. We include in this category investments in private equity, real estate and alternative investment funds that do not have a
readily determinable fair value. The underlying alternative investments include collateralized debt obligations,mezzanine debt and a variety of other investments.
We record cash and cash equivalents, short-term borrowings and variable-rate debt on our balance sheets at cost, which
approximates fair value. We measure the fair value of fixed-rate debt, a level 2 measurement, based on quoted market prices for thesame or similar issues or on the current rates offered for instruments of the same remaining maturities and redemption provisions. The
recorded amount of accounts receivable and other current financial instruments approximates fair value.
We measure fair value based on information available as of the measurement date. The following table provides the carryingvalues and measured fair values of our fixed-rate debt.
As of December 31, 2016 As of December 31, 2015
CarryingValue Fair Value
CarryingValue Fair Value
(In Thousands)
Fixed-rate debt.......................................... $ 2,505,000 $ 2,537,444 $ 2,155,000 $ 2,198,359
Recurring Fair Value Measurements
The following table provides the amounts and their corresponding level of hierarchy for our assets that are measured at fair
value.
As of December 31, 2016 Level 1 Level 2 Level 3 NAV Total
(In Thousands)
Trading Securities:
Domestic equity funds..................................................................................................... $ — $ 18,364 $ — $ — $ 18,364
International equity fund.................................................................................................. — 4,467 — — 4,467
Core bond fund................................................................................................................ — 11,504 — — 11,504
Cash equivalents.............................................................................................................. 156 — — — 156
Total Trading Securities....................................................................................... $ 156 $ 34,335 $ — $ — $ 34,491
As of December 31, 2015 Level 1 Level 2 Level 3 NAV Total
(In Thousands)
Trading Securities:
Domestic equity funds..................................................................................................... $ — $ 17,876 $ — $ — $ 17,876
International equity fund.................................................................................................. — 4,430 — — 4,430
Core bond fund................................................................................................................ — 11,423 — — 11,423
Cash equivalents.............................................................................................................. 159 — — — 159
Total Trading Securities....................................................................................... $ 159 $ 33,729 $ — $ — $ 33,888
Name of Respondent
Westar Energy, Inc.
This Report is:(1) X An Original(2) A Resubmission
Date of Report(Mo, Da, Yr)
/ /
Year/Period of Report
2016/Q4
NOTES TO FINANCIAL STATEMENTS (Continued)
FERC FORM NO. 1 (ED. 12-88) Page 123.11
20170505-8016 FERC PDF (Unofficial) 04/07/2017
Derivative Instruments
Price Risk
We use various types of fuel, including coal, natural gas, and diesel to operate our plants and also purchase power to meetcustomer demand. Our prices and financial results are exposed to market risks from commodity price changes for electricity and other
energy-related products as well as from interest rates. Volatility in these markets impacts our costs of purchased power, costs of fuelfor our generating plants and our participation in energy markets. We strive to manage our customers’ and our exposure to market
risks through regulatory, operating and financing activities and, when we deem appropriate, we economically hedge a portion of theserisks through the use of derivative financial instruments for non-trading purposes.
Interest Rate Risk
We have entered into numerous fixed and variable rate debt obligations. For details, see Note 8, “Long-Term Debt.” Wemanage our interest rate risk related to these debt obligations by limiting our exposure to variable interest rate debt, diversifying
maturity dates and entering into treasury yield hedge transactions. We may also use other financial derivative instruments such asinterest rate swaps.
Trading Securities
We hold equity and debt investments that we classify as trading securities in a trust used to fund certain retirement benefit
obligations. These obligations totaled $26.8 million and $27.4 million as of December 31, 2016 and 2015, respectively. For additionalinformation on our benefit obligations, see Note 10, “Employee Benefit Plans.”
As of December 31, 2016 and 2015, we measured the fair value of trust assets at $34.5 million and $33.9 million,
respectively. We include unrealized gains or losses on these securities in miscellaneous nonoperating income on our statements ofincome. For the years ended December 31, 2016 and 2015, we recorded unrealized gains of $2.5 million and $0.4 million,
respectively, on assets still held.
6. JOINT OWNERSHIP OF UTILITY PLANT
Under joint ownership agreements with other utilities, we have undivided ownership interests in an electric generating station.
Energy generated and operating expenses are divided on the same basis as ownership with each owner reflecting its respective costs inits statements of income and each owner responsible for its own financing. Information relative to our ownership interests in this
facility as of December 31, 2016, is shown in the table below.
PlantIn-Service
Dates InvestmentAccumulated
Depreciation
Construction
Work in Progress
Net
MW
Ownership
Percentage
(Dollars in Thousands)
JEC unit 1 (a)............... July 1978 $ 636,259 $ 154,704 $ 5,667 524 72
JEC unit 2 (a)............... May 1980 439,928 152,290 3,284 528 72
JEC unit 3 (a)............... May 1983 570,550 245,883 3,205 516 72
Total...................... $ 1,646,737 $ 552,877 $ 12,156 1,568
_______________
(a) Jointly owned with Kansas Gas and Electric Company (KGE) and Kansas City Power & Light Company. Our 8% leasehold
interest in Jeffrey Energy Center (JEC) that is recorded as a capital lease is reflected in the net megawatts (MW) andownership percentage provided above, but not in the other amounts in the table.
We include in operating expenses on our statements of income our share of operating expenses of the above plant. Our share
Name of Respondent
Westar Energy, Inc.
This Report is:(1) X An Original(2) A Resubmission
Date of Report(Mo, Da, Yr)
/ /
Year/Period of Report
2016/Q4
NOTES TO FINANCIAL STATEMENTS (Continued)
FERC FORM NO. 1 (ED. 12-88) Page 123.12
20170505-8016 FERC PDF (Unofficial) 04/07/2017
of fuel expense for the above plant is generally based on the amount of power we take from the plant. Our share of other transactionsassociated with the plant is included in the appropriate classification on our financial statements.
7. SHORT-TERM DEBT
In December 2016, we extended the term of our $270.0 million revolving credit facility to terminate in February 2018. Solong as there is no default under the facility, we may extend the facility up to an additional year and may increase the aggregate amount
of borrowings under the facility to $400.0 million, subject to lender participation. All borrowings under the facility are secured byKGE first mortgage bonds. As of December 31, 2016 and 2015, we had no borrowed amounts or letters of credit outstanding under
this revolving credit facility.
In September 2015, we extended the term of our $730.0 million revolving credit facility to terminate in September 2019,$20.7 million of which will expire in September 2017. As long as there is no default under the facility, we may extend the facility up
to an additional year and may increase the aggregate amount of borrowings under the facility to $1.0 billion, both subject to lenderparticipation. All borrowings under the facility are secured by KGE first mortgage bonds. As of December 31, 2016, no amounts had
been borrowed and $12.3 million of letters of credit had been issued under this revolving credit facility. As of December 31, 2015, noamounts had been borrowed and $19.2 million of letters of credit had been issued under this revolving credit facility.
We maintain a commercial paper program pursuant to which it may issue commercial paper up to a maximum aggregate
amount outstanding at any one time of $1.0 billion. This program is supported by our revolving credit facilities. Maturities ofcommercial paper issuances may not exceed 365 days from the date of issuance and proceeds from such issuances will be used to
temporarily fund capital expenditures, to redeem debt on an interim basis, for working capital and/or for other general corporatepurposes. We had $366.7 million and $250.3 million of commercial paper issued and outstanding as of December 31, 2016 and 2015,
respectively.
In addition, total combined borrowings under our commercial paper program and revolving credit facilities may not exceed$1.0 billion at any given time. The weighted average interest rate on short-term borrowings outstanding as of December 31, 2016 and
2015, was 0.96% and 0.77%, respectively. Additional information regarding our short-term debt is as follows.
Year Ended
December 31,
2016 2015
(Dollars in Thousands)
Weighted average short-term debt outstanding............................................. $ 284,700 $ 350,380
Weighted daily average interest rates, excluding fees................................... 0.78 % 0.48 %
Our interest charges on short-term debt were $3.6 million in 2016 and $3.0 million in 2015.
Name of Respondent
Westar Energy, Inc.
This Report is:(1) X An Original(2) A Resubmission
Date of Report(Mo, Da, Yr)
/ /
Year/Period of Report
2016/Q4
NOTES TO FINANCIAL STATEMENTS (Continued)
FERC FORM NO. 1 (ED. 12-88) Page 123.13
20170505-8016 FERC PDF (Unofficial) 04/07/2017
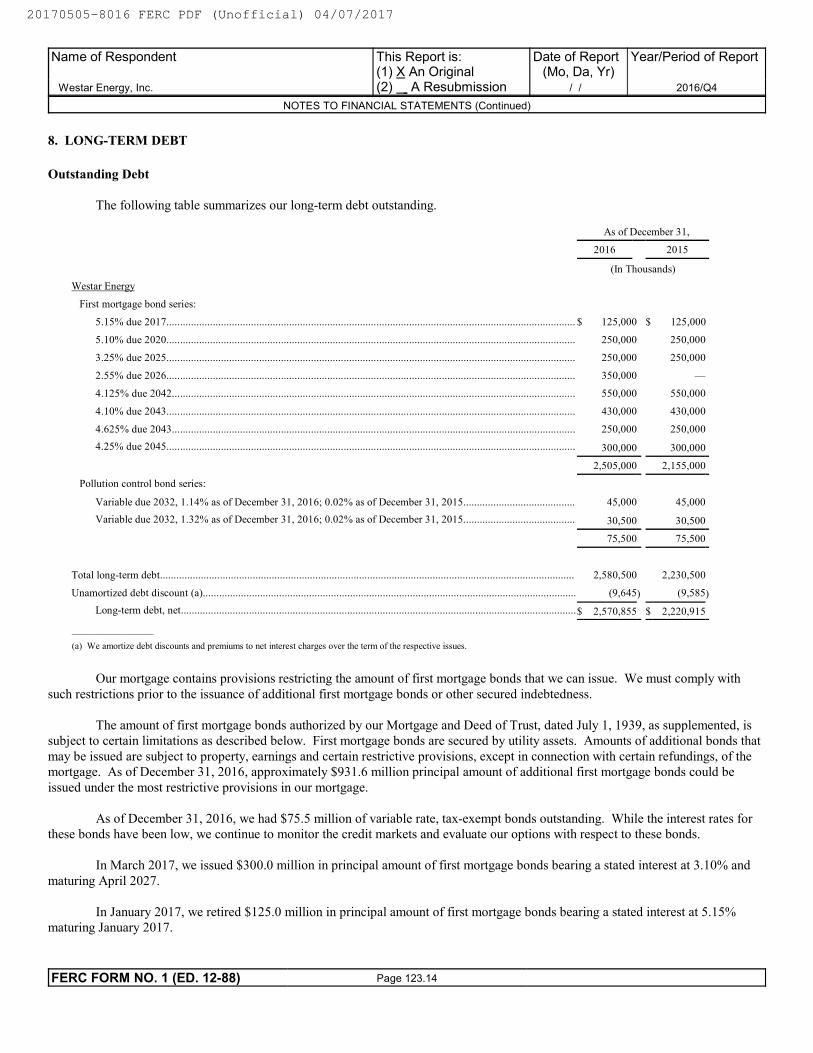
8. LONG-TERM DEBT
Outstanding Debt
The following table summarizes our long-term debt outstanding.
As of December 31,
2016 2015
(In Thousands)
Westar Energy
First mortgage bond series:
5.15% due 2017...................................................................................................................................................... $ 125,000 $ 125,000
5.10% due 2020...................................................................................................................................................... 250,000 250,000
3.25% due 2025...................................................................................................................................................... 250,000 250,000
2.55% due 2026...................................................................................................................................................... 350,000 —
4.125% due 2042.................................................................................................................................................... 550,000 550,000
4.10% due 2043...................................................................................................................................................... 430,000 430,000
4.625% due 2043.................................................................................................................................................... 250,000 250,000
4.25% due 2045...................................................................................................................................................... 300,000 300,000
2,505,000 2,155,000
Pollution control bond series:
Variable due 2032, 1.14% as of December 31, 2016; 0.02% as of December 31, 2015......................................... 45,000 45,000
Variable due 2032, 1.32% as of December 31, 2016; 0.02% as of December 31, 2015......................................... 30,500 30,500
75,500 75,500
Total long-term debt........................................................................................................................................................ 2,580,500 2,230,500
Unamortized debt discount (a)......................................................................................................................................... (9,645) (9,585)
Long-term debt, net.................................................................................................................................................$ 2,570,855 $ 2,220,915
_______________
(a) We amortize debt discounts and premiums to net interest charges over the term of the respective issues.
Our mortgage contains provisions restricting the amount of first mortgage bonds that we can issue. We must comply with
such restrictions prior to the issuance of additional first mortgage bonds or other secured indebtedness.
The amount of first mortgage bonds authorized by our Mortgage and Deed of Trust, dated July 1, 1939, as supplemented, issubject to certain limitations as described below. First mortgage bonds are secured by utility assets. Amounts of additional bonds that
may be issued are subject to property, earnings and certain restrictive provisions, except in connection with certain refundings, of themortgage. As of December 31, 2016, approximately $931.6 million principal amount of additional first mortgage bonds could be
issued under the most restrictive provisions in our mortgage.
As of December 31, 2016, we had $75.5 million of variable rate, tax-exempt bonds outstanding. While the interest rates forthese bonds have been low, we continue to monitor the credit markets and evaluate our options with respect to these bonds.
In March 2017, we issued $300.0 million in principal amount of first mortgage bonds bearing a stated interest at 3.10% and
maturing April 2027.
In January 2017, we retired $125.0 million in principal amount of first mortgage bonds bearing a stated interest at 5.15%maturing January 2017.
Name of Respondent
Westar Energy, Inc.
This Report is:(1) X An Original(2) A Resubmission
Date of Report(Mo, Da, Yr)
/ /
Year/Period of Report
2016/Q4
NOTES TO FINANCIAL STATEMENTS (Continued)
FERC FORM NO. 1 (ED. 12-88) Page 123.14
20170505-8016 FERC PDF (Unofficial) 04/07/2017
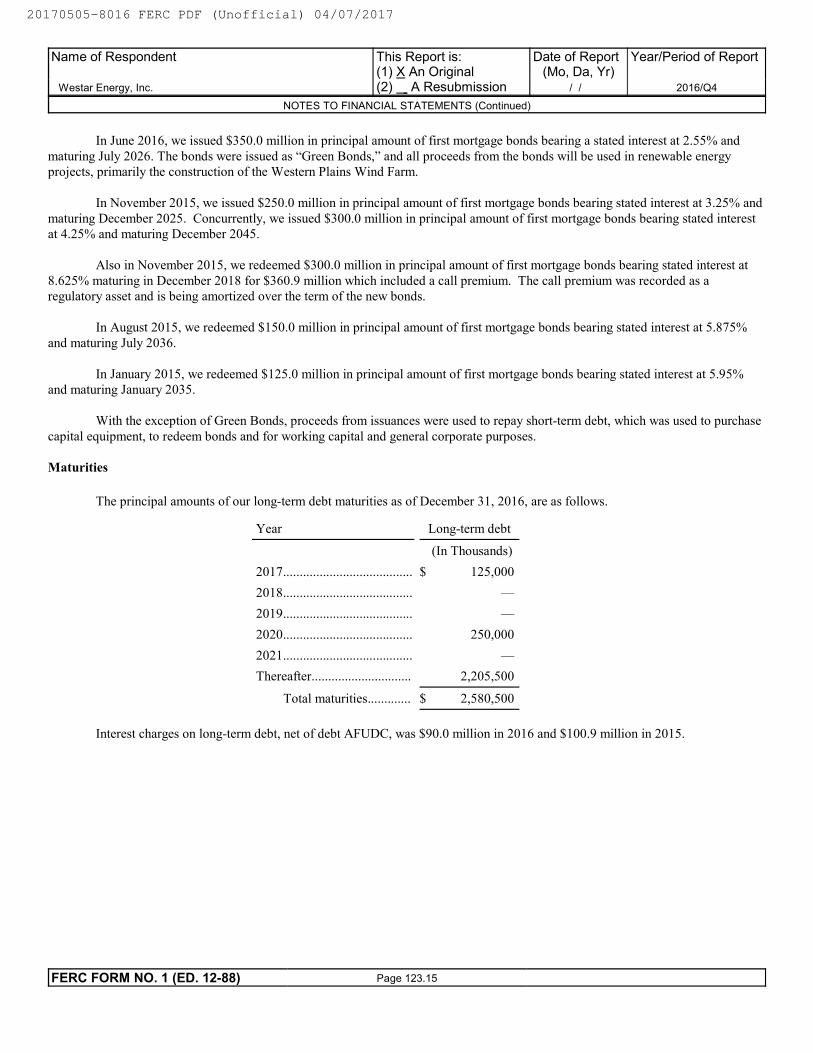
In June 2016, we issued $350.0 million in principal amount of first mortgage bonds bearing a stated interest at 2.55% and
maturing July 2026. The bonds were issued as “Green Bonds,” and all proceeds from the bonds will be used in renewable energyprojects, primarily the construction of the Western Plains Wind Farm.
In November 2015, we issued $250.0 million in principal amount of first mortgage bonds bearing stated interest at 3.25% and
maturing December 2025. Concurrently, we issued $300.0 million in principal amount of first mortgage bonds bearing stated interestat 4.25% and maturing December 2045.
Also in November 2015, we redeemed $300.0 million in principal amount of first mortgage bonds bearing stated interest at
8.625% maturing in December 2018 for $360.9 million which included a call premium. The call premium was recorded as aregulatory asset and is being amortized over the term of the new bonds.
In August 2015, we redeemed $150.0 million in principal amount of first mortgage bonds bearing stated interest at 5.875%
and maturing July 2036.
In January 2015, we redeemed $125.0 million in principal amount of first mortgage bonds bearing stated interest at 5.95%and maturing January 2035.
With the exception of Green Bonds, proceeds from issuances were used to repay short-term debt, which was used to purchase
capital equipment, to redeem bonds and for working capital and general corporate purposes.
Maturities
The principal amounts of our long-term debt maturities as of December 31, 2016, are as follows.
Year Long-term debt
(In Thousands)
2017....................................... $ 125,000
2018....................................... —
2019....................................... —
2020....................................... 250,000
2021....................................... —
Thereafter.............................. 2,205,500
Total maturities............. $ 2,580,500
Interest charges on long-term debt, net of debt AFUDC, was $90.0 million in 2016 and $100.9 million in 2015.
Name of Respondent
Westar Energy, Inc.
This Report is:(1) X An Original(2) A Resubmission
Date of Report(Mo, Da, Yr)
/ /
Year/Period of Report
2016/Q4
NOTES TO FINANCIAL STATEMENTS (Continued)
FERC FORM NO. 1 (ED. 12-88) Page 123.15
20170505-8016 FERC PDF (Unofficial) 04/07/2017
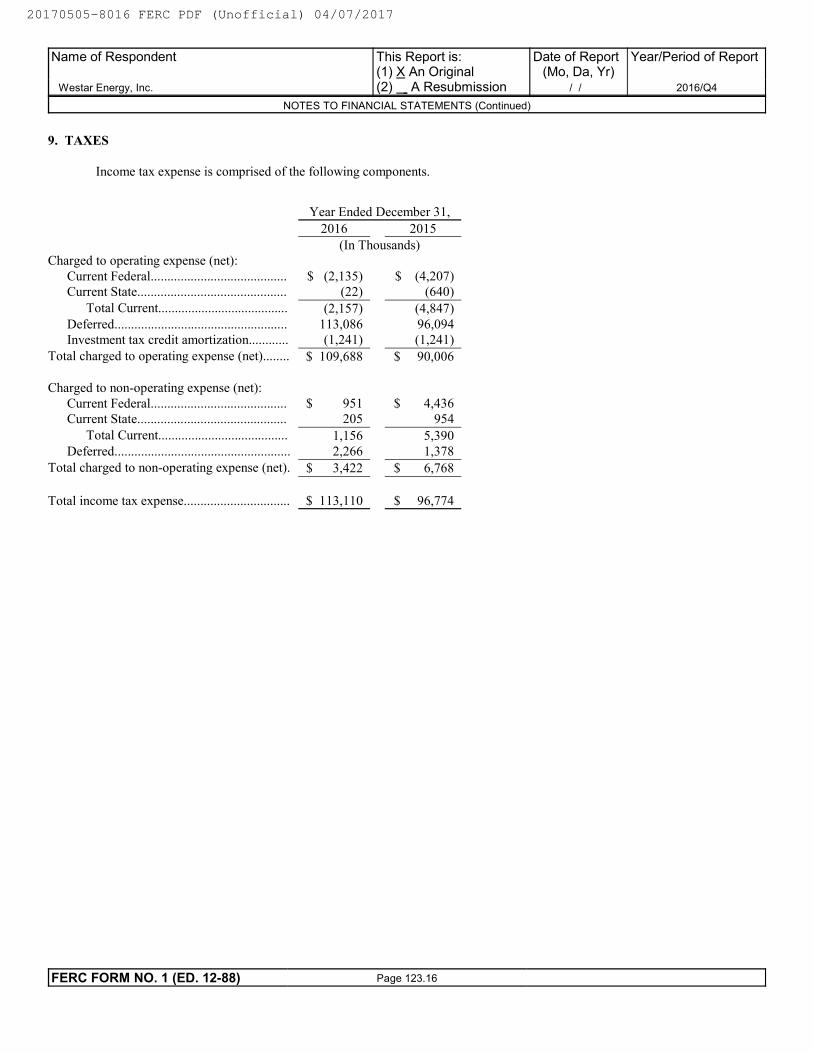
9. TAXES
Income tax expense is comprised of the following components.
Year Ended December 31,
2016 2015
(In Thousands)Charged to operating expense (net):
Current Federal......................................... $ (2,135) $ (4,207)Current State............................................. (22) (640)
Total Current....................................... (2,157) (4,847)
Deferred.................................................... 113,086 96,094Investment tax credit amortization............ (1,241) (1,241)
Total charged to operating expense (net)........ $ 109,688 $ 90,006
Charged to non-operating expense (net):
Current Federal......................................... $ 951 $ 4,436Current State............................................. 205 954
Total Current....................................... 1,156 5,390
Deferred..................................................... 2,266 1,378
Total charged to non-operating expense (net). $ 3,422 $ 6,768
Total income tax expense................................ $ 113,110 $ 96,774
Name of Respondent
Westar Energy, Inc.
This Report is:(1) X An Original(2) A Resubmission
Date of Report(Mo, Da, Yr)
/ /
Year/Period of Report
2016/Q4
NOTES TO FINANCIAL STATEMENTS (Continued)
FERC FORM NO. 1 (ED. 12-88) Page 123.16
20170505-8016 FERC PDF (Unofficial) 04/07/2017
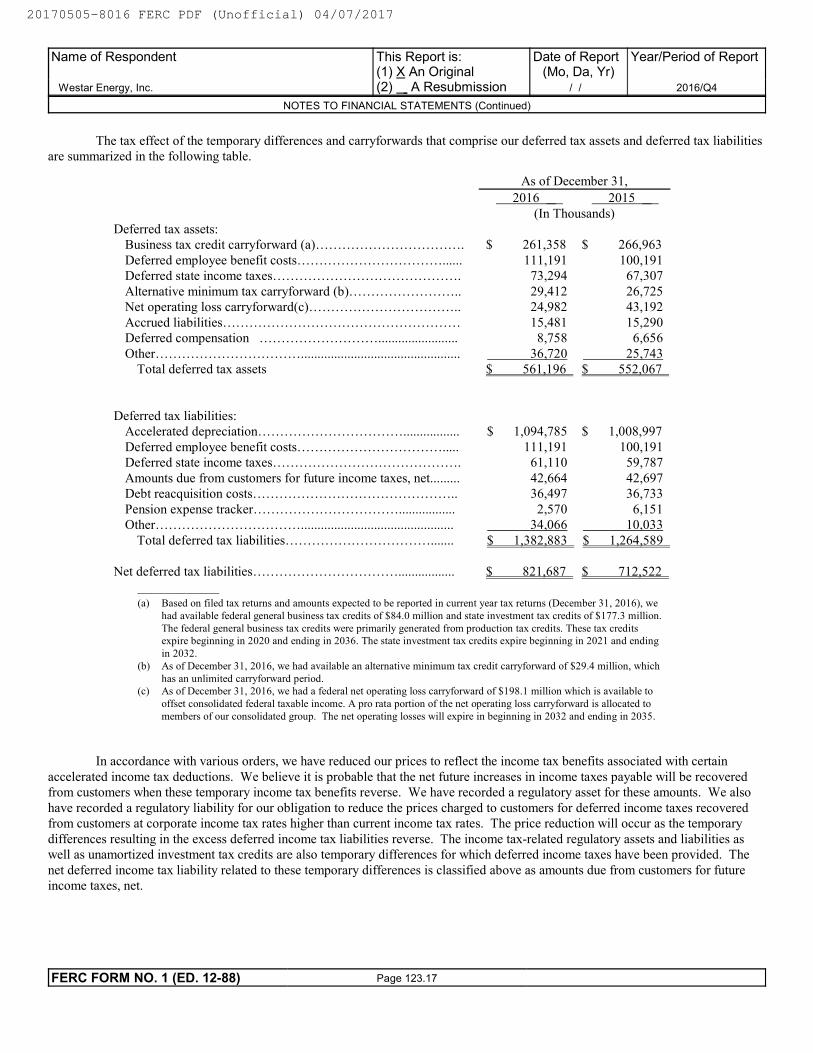
The tax effect of the temporary differences and carryforwards that comprise our deferred tax assets and deferred tax liabilitiesare summarized in the following table.
As of December 31,
2016 2015
(In Thousands)
Deferred tax assets:Business tax credit carryforward (a)……………………………. $ 261,358 $ 266,963
Deferred employee benefit costs……………………………...... 111,191 100,191Deferred state income taxes……………………………………. 73,294 67,307
Alternative minimum tax carryforward (b)…………………….. 29,412 26,725Net operating loss carryforward(c)…………………………….. 24,982 43,192
Accrued liabilities……………………………………………… 15,481 15,290Deferred compensation ………………………........................ 8,758 6,656
Other……………………………................................................ 36,720 25,743Total deferred tax assets $ 561,196 $ 552,067
Deferred tax liabilities:Accelerated depreciation……………………………................. $ 1,094,785 $ 1,008,997
Deferred employee benefit costs……………………………..... 111,191 100,191Deferred state income taxes……………………………………. 61,110 59,787
Amounts due from customers for future income taxes, net......... 42,664 42,697Debt reacquisition costs……………………………………….. 36,497 36,733
Pension expense tracker……………………………................. 2,570 6,151Other…………………………….............................................. 34,066 10,033
Total deferred tax liabilities……………………………....... $ 1,382,883 $ 1,264,589
Net deferred tax liabilities……………………………................. $ 821,687 $ 712,522
_______________
(a) Based on filed tax returns and amounts expected to be reported in current year tax returns (December 31, 2016), we
had available federal general business tax credits of $84.0 million and state investment tax credits of $177.3 million.
The federal general business tax credits were primarily generated from production tax credits. These tax credits
expire beginning in 2020 and ending in 2036. The state investment tax credits expire beginning in 2021 and ending
in 2032.
(b) As of December 31, 2016, we had available an alternative minimum tax credit carryforward of $29.4 million, which
has an unlimited carryforward period.
(c) As of December 31, 2016, we had a federal net operating loss carryforward of $198.1 million which is available to
offset consolidated federal taxable income. A pro rata portion of the net operating loss carryforward is allocated to
members of our consolidated group. The net operating losses will expire in beginning in 2032 and ending in 2035.
In accordance with various orders, we have reduced our prices to reflect the income tax benefits associated with certain
accelerated income tax deductions. We believe it is probable that the net future increases in income taxes payable will be recoveredfrom customers when these temporary income tax benefits reverse. We have recorded a regulatory asset for these amounts. We also
have recorded a regulatory liability for our obligation to reduce the prices charged to customers for deferred income taxes recoveredfrom customers at corporate income tax rates higher than current income tax rates. The price reduction will occur as the temporary
differences resulting in the excess deferred income tax liabilities reverse. The income tax-related regulatory assets and liabilities aswell as unamortized investment tax credits are also temporary differences for which deferred income taxes have been provided. The
net deferred income tax liability related to these temporary differences is classified above as amounts due from customers for futureincome taxes, net.
Name of Respondent
Westar Energy, Inc.
This Report is:(1) X An Original(2) A Resubmission
Date of Report(Mo, Da, Yr)
/ /
Year/Period of Report
2016/Q4
NOTES TO FINANCIAL STATEMENTS (Continued)
FERC FORM NO. 1 (ED. 12-88) Page 123.17
20170505-8016 FERC PDF (Unofficial) 04/07/2017
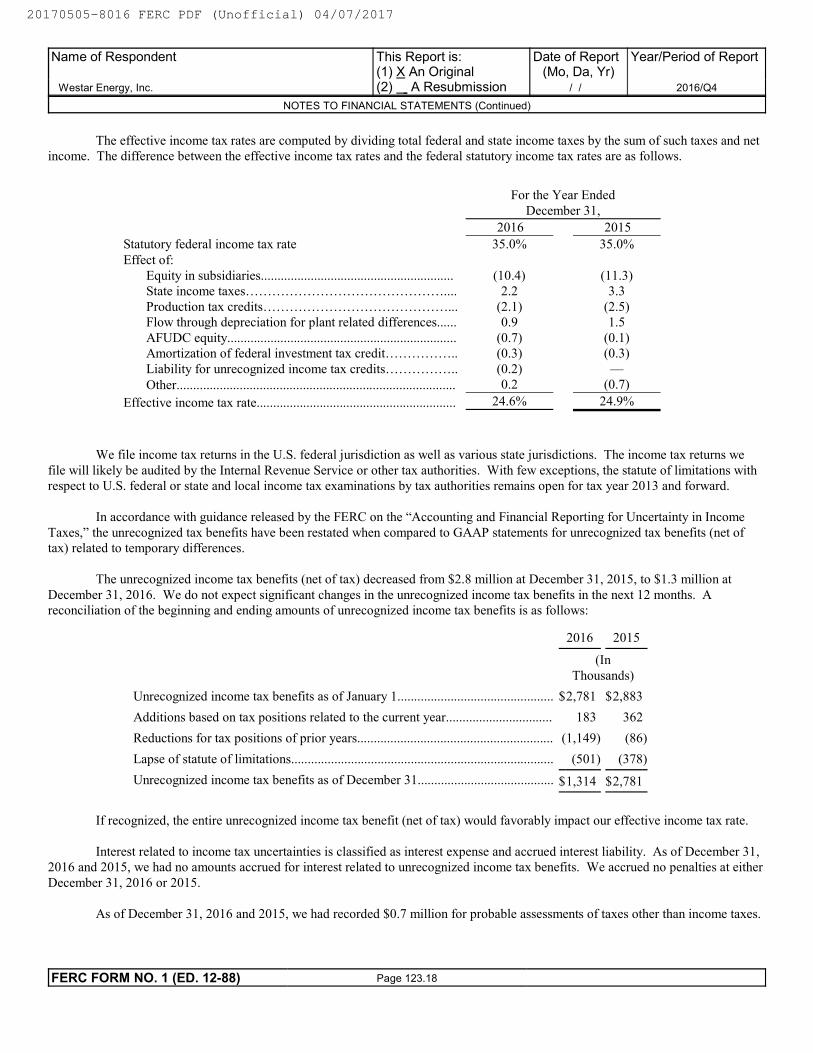
The effective income tax rates are computed by dividing total federal and state income taxes by the sum of such taxes and netincome. The difference between the effective income tax rates and the federal statutory income tax rates are as follows.
For the Year Ended
December 31,
2016 2015
Statutory federal income tax rate 35.0% 35.0%
Effect of:
Equity in subsidiaries.......................................................... (10.4) (11.3)State income taxes……………………………………….... 2.2 3.3
Production tax credits……………………………………... (2.1) (2.5)Flow through depreciation for plant related differences...... 0.9 1.5
AFUDC equity..................................................................... (0.7) (0.1)Amortization of federal investment tax credit…………….. (0.3) (0.3)
Liability for unrecognized income tax credits…………….. (0.2) —
Other.................................................................................... 0.2 (0.7)
Effective income tax rate............................................................ 24.6% 24.9%
We file income tax returns in the U.S. federal jurisdiction as well as various state jurisdictions. The income tax returns we
file will likely be audited by the Internal Revenue Service or other tax authorities. With few exceptions, the statute of limitations withrespect to U.S. federal or state and local income tax examinations by tax authorities remains open for tax year 2013 and forward.
In accordance with guidance released by the FERC on the “Accounting and Financial Reporting for Uncertainty in Income
Taxes,” the unrecognized tax benefits have been restated when compared to GAAP statements for unrecognized tax benefits (net oftax) related to temporary differences.
The unrecognized income tax benefits (net of tax) decreased from $2.8 million at December 31, 2015, to $1.3 million at
December 31, 2016. We do not expect significant changes in the unrecognized income tax benefits in the next 12 months. Areconciliation of the beginning and ending amounts of unrecognized income tax benefits is as follows:
2016 2015
(In
Thousands)
Unrecognized income tax benefits as of January 1............................................... $2,781 $2,883
Additions based on tax positions related to the current year................................ 183 362
Reductions for tax positions of prior years........................................................... (1,149) (86)
Lapse of statute of limitations............................................................................... (501) (378)
Unrecognized income tax benefits as of December 31......................................... $1,314 $2,781
If recognized, the entire unrecognized income tax benefit (net of tax) would favorably impact our effective income tax rate.
Interest related to income tax uncertainties is classified as interest expense and accrued interest liability. As of December 31,2016 and 2015, we had no amounts accrued for interest related to unrecognized income tax benefits. We accrued no penalties at either
December 31, 2016 or 2015.
As of December 31, 2016 and 2015, we had recorded $0.7 million for probable assessments of taxes other than income taxes.
Name of Respondent
Westar Energy, Inc.
This Report is:(1) X An Original(2) A Resubmission
Date of Report(Mo, Da, Yr)
/ /
Year/Period of Report
2016/Q4
NOTES TO FINANCIAL STATEMENTS (Continued)
FERC FORM NO. 1 (ED. 12-88) Page 123.18
20170505-8016 FERC PDF (Unofficial) 04/07/2017
10. EMPLOYEE BENEFIT PLANS
Pension and Post-Retirement Benefit Plans
We maintain a qualified non-contributory defined benefit pension plan covering substantially all of our employees. For themajority of our employees, pension benefits are based on years of service and an employee’s compensation during the 60 highest paid
consecutive months out of 120 before retirement. Non-union employees hired after December 31, 2001, and union employees hiredafter December 31, 2011, are covered by the same defined benefit pension plan; however, their benefits are derived from a cash
balance account formula. We also maintain a non-qualified Executive Salary Continuation Plan for the benefit of certain retiredexecutive officers. We have discontinued accruing any future benefits under this non-qualified plan.
The amount we contribute to our pension plan for future periods is not yet known, however, we expect to fund our pension
plan each year at least to a level equal to current year pension expense. We must also meet minimum funding requirements under theEmployee Retirement Income Security Act, as amended by the Pension Protection Act. We may contribute additional amounts from
time to time as deemed appropriate.
In addition to providing pension benefits, we provide certain post-retirement health care and life insurance benefits forsubstantially all retired employees. We accrue and recover in our prices the costs of post-retirement benefits during an employee’s
years of service. In 2014 and prior years, our retirees were covered under a health insurance policy. In January 2015, we began givingour retirees a fixed annual allowance, which provides them the flexibility to obtain health coverage in the marketplace that is tailored to
their needs.
Name of Respondent
Westar Energy, Inc.
This Report is:(1) X An Original(2) A Resubmission
Date of Report(Mo, Da, Yr)
/ /
Year/Period of Report
2016/Q4
NOTES TO FINANCIAL STATEMENTS (Continued)
FERC FORM NO. 1 (ED. 12-88) Page 123.19
20170505-8016 FERC PDF (Unofficial) 04/07/2017
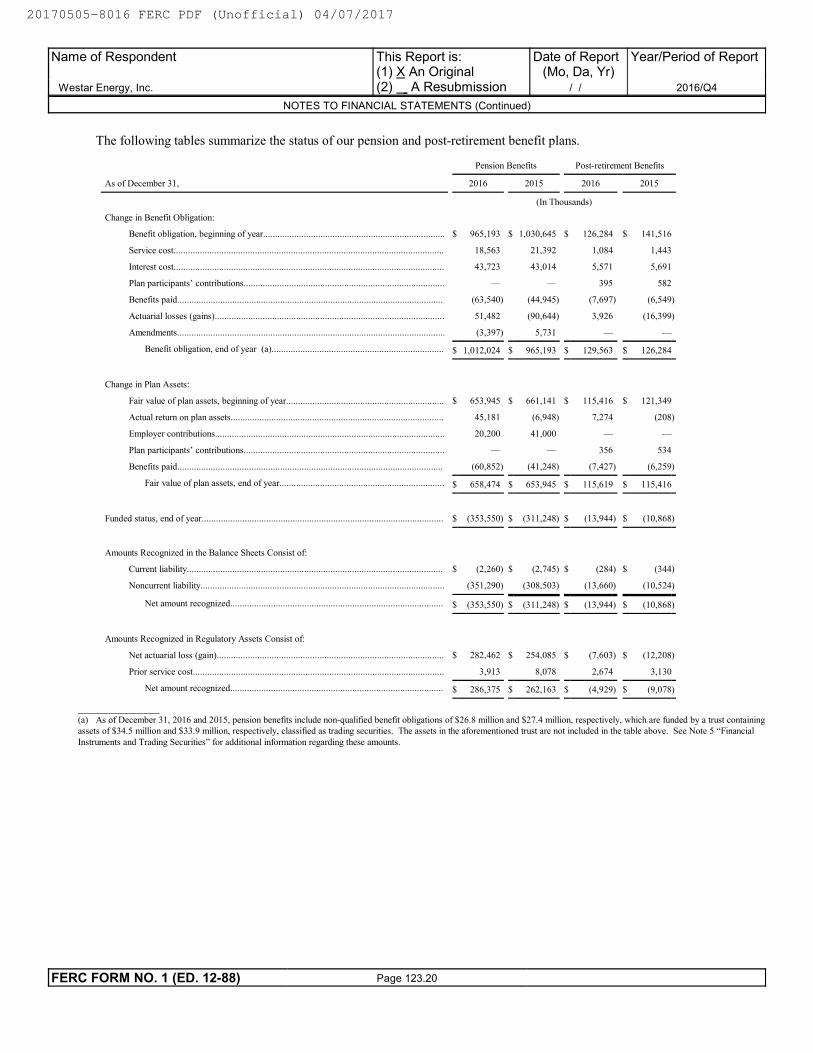
The following tables summarize the status of our pension and post-retirement benefit plans.
Pension Benefits Post-retirement Benefits
As of December 31, 2016 2015 2016 2015
(In Thousands)
Change in Benefit Obligation:
Benefit obligation, beginning of year............................................................................ $ 965,193 $ 1,030,645 $ 126,284 $ 141,516
Service cost................................................................................................................. 18,563 21,392 1,084 1,443
Interest cost................................................................................................................. 43,723 43,014 5,571 5,691
Plan participants’ contributions.................................................................................... — — 395 582
Benefits paid............................................................................................................... (63,540) (44,945) (7,697) (6,549)
Actuarial losses (gains)................................................................................................ 51,482 (90,644) 3,926 (16,399)
Amendments................................................................................................................ (3,397) 5,731 — —
Benefit obligation, end of year (a)........................................................................ $ 1,012,024 $ 965,193 $ 129,563 $ 126,284
Change in Plan Assets:
Fair value of plan assets, beginning of year.................................................................. $ 653,945 $ 661,141 $ 115,416 $ 121,349
Actual return on plan assets......................................................................................... 45,181 (6,948) 7,274 (208)
Employer contributions................................................................................................ 20,200 41,000 — —
Plan participants’ contributions.................................................................................... — — 356 534
Benefits paid............................................................................................................... (60,852) (41,248) (7,427) (6,259)
Fair value of plan assets, end of year..................................................................... $ 658,474 $ 653,945 $ 115,619 $ 115,416
Funded status, end of year..................................................................................................... $ (353,550) $ (311,248) $ (13,944) $ (10,868)
Amounts Recognized in the Balance Sheets Consist of:
Current liability........................................................................................................... $ (2,260) $ (2,745) $ (284) $ (344)
Noncurrent liability...................................................................................................... (351,290) (308,503) (13,660) (10,524)
Net amount recognized......................................................................................... $ (353,550) $ (311,248) $ (13,944) $ (10,868)
Amounts Recognized in Regulatory Assets Consist of:
Net actuarial loss (gain)............................................................................................... $ 282,462 $ 254,085 $ (7,603) $ (12,208)
Prior service cost......................................................................................................... 3,913 8,078 2,674 3,130
Net amount recognized......................................................................................... $ 286,375 $ 262,163 $ (4,929) $ (9,078)
_______________(a) As of December 31, 2016 and 2015, pension benefits include non-qualified benefit obligations of $26.8 million and $27.4 million, respectively, which are funded by a trust containing
assets of $34.5 million and $33.9 million, respectively, classified as trading securities. The assets in the aforementioned trust are not included in the table above. See Note 5 “Financial
Instruments and Trading Securities” for additional information regarding these amounts.
Name of Respondent
Westar Energy, Inc.
This Report is:(1) X An Original(2) A Resubmission
Date of Report(Mo, Da, Yr)
/ /
Year/Period of Report
2016/Q4
NOTES TO FINANCIAL STATEMENTS (Continued)
FERC FORM NO. 1 (ED. 12-88) Page 123.20
20170505-8016 FERC PDF (Unofficial) 04/07/2017
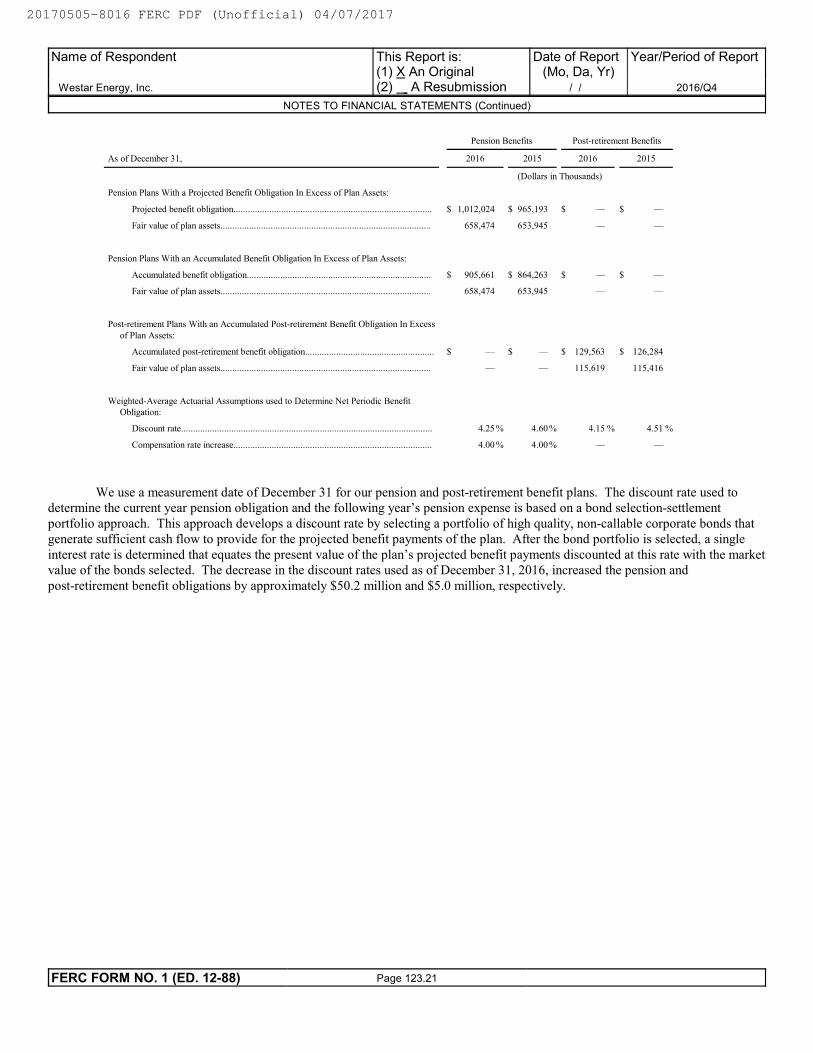
Pension Benefits Post-retirement Benefits
As of December 31, 2016 2015 2016 2015
(Dollars in Thousands)
Pension Plans With a Projected Benefit Obligation In Excess of Plan Assets:
Projected benefit obligation................................................................................... $ 1,012,024 $ 965,193 $ — $ —
Fair value of plan assets........................................................................................ 658,474 653,945 — —
Pension Plans With an Accumulated Benefit Obligation In Excess of Plan Assets:
Accumulated benefit obligation............................................................................. $ 905,661 $ 864,263 $ — $ —
Fair value of plan assets........................................................................................ 658,474 653,945 — —
Post-retirement Plans With an Accumulated Post-retirement Benefit Obligation In Excess
of Plan Assets:
Accumulated post-retirement benefit obligation...................................................... $ — $ — $ 129,563 $ 126,284
Fair value of plan assets........................................................................................ — — 115,619 115,416
Weighted-Average Actuarial Assumptions used to Determine Net Periodic Benefit
Obligation:
Discount rate......................................................................................................... 4.25 % 4.60% 4.15 % 4.51 %
Compensation rate increase................................................................................... 4.00 % 4.00% — —
We use a measurement date of December 31 for our pension and post-retirement benefit plans. The discount rate used todetermine the current year pension obligation and the following year’s pension expense is based on a bond selection-settlement
portfolio approach. This approach develops a discount rate by selecting a portfolio of high quality, non-callable corporate bonds thatgenerate sufficient cash flow to provide for the projected benefit payments of the plan. After the bond portfolio is selected, a single
interest rate is determined that equates the present value of the plan’s projected benefit payments discounted at this rate with the marketvalue of the bonds selected. The decrease in the discount rates used as of December 31, 2016, increased the pension and
post-retirement benefit obligations by approximately $50.2 million and $5.0 million, respectively.
Name of Respondent
Westar Energy, Inc.
This Report is:(1) X An Original(2) A Resubmission
Date of Report(Mo, Da, Yr)
/ /
Year/Period of Report
2016/Q4
NOTES TO FINANCIAL STATEMENTS (Continued)
FERC FORM NO. 1 (ED. 12-88) Page 123.21
20170505-8016 FERC PDF (Unofficial) 04/07/2017
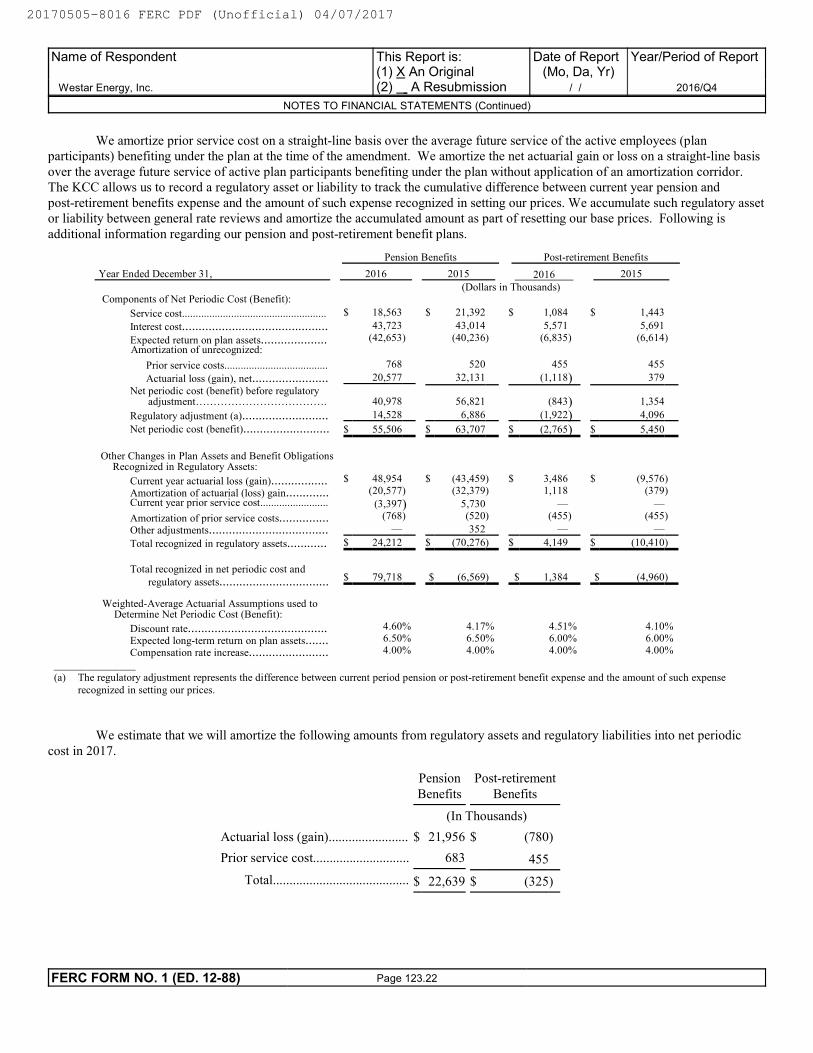
We amortize prior service cost on a straight-line basis over the average future service of the active employees (planparticipants) benefiting under the plan at the time of the amendment. We amortize the net actuarial gain or loss on a straight-line basis
over the average future service of active plan participants benefiting under the plan without application of an amortization corridor. The KCC allows us to record a regulatory asset or liability to track the cumulative difference between current year pension and
post-retirement benefits expense and the amount of such expense recognized in setting our prices. We accumulate such regulatory assetor liability between general rate reviews and amortize the accumulated amount as part of resetting our base prices. Following is
additional information regarding our pension and post-retirement benefit plans.
Pension Benefits Post-retirement Benefits
Year Ended December 31, 2016 2015 2016 2015
(Dollars in Thousands)Components of Net Periodic Cost (Benefit):
Service cost..................................................... $ 18,563 $ 21,392 $ 1,084 $ 1,443
Interest cost............................................ 43,723 43,014 5,571 5,691
Expected return on plan assets.................... (42,653) (40,236) (6,835) (6,614)Amortization of unrecognized:
Prior service costs...................................... 768 520 455 455
Actuarial loss (gain), net....................... 20,577 32,131 (1,118) 379
Net periodic cost (benefit) before regulatoryadjustment………………………………. 40,978 56,821 (843) 1,354
Regulatory adjustment (a).......................... 14,528 6,886 (1,922) 4,096
Net periodic cost (benefit).......................... $ 55,506 $ 63,707 $ (2,765) $ 5,450
Other Changes in Plan Assets and Benefit ObligationsRecognized in Regulatory Assets:
Current year actuarial loss (gain)................. $ 48,954 $ (43,459) $ 3,486 $ (9,576)
Amortization of actuarial (loss) gain............. (20,577) (32,379) 1,118 (379)Current year prior service cost......................... (3,397) 5,730 — —
Amortization of prior service costs............... (768) (520) (455) (455)
Other adjustments.................................... — 352 — —
Total recognized in regulatory assets............ $ 24,212 $ (70,276) $ 4,149 $ (10,410)
Total recognized in net periodic cost and
regulatory assets................................. $ 79,718 $ (6,569) $ 1,384 $ (4,960)
Weighted-Average Actuarial Assumptions used toDetermine Net Periodic Cost (Benefit):
Discount rate.......................................... 4.60% 4.17% 4.51% 4.10%
Expected long-term return on plan assets....... 6.50% 6.50% 6.00% 6.00%
Compensation rate increase........................ 4.00% 4.00% 4.00% 4.00%
_______________
(a) The regulatory adjustment represents the difference between current period pension or post-retirement benefit expense and the amount of such expense
recognized in setting our prices.
We estimate that we will amortize the following amounts from regulatory assets and regulatory liabilities into net periodic
cost in 2017.
Pension
Benefits
Post-retirement
Benefits
(In Thousands)
Actuarial loss (gain)........................ $ 21,956 $ (780)
Prior service cost............................. 683 455
Total......................................... $ 22,639 $ (325)
Name of Respondent
Westar Energy, Inc.
This Report is:(1) X An Original(2) A Resubmission
Date of Report(Mo, Da, Yr)
/ /
Year/Period of Report
2016/Q4
NOTES TO FINANCIAL STATEMENTS (Continued)
FERC FORM NO. 1 (ED. 12-88) Page 123.22
20170505-8016 FERC PDF (Unofficial) 04/07/2017
We base the expected long-term rate of return on plan assets on historical and projected rates of return for current and
planned asset classes in the plans’ investment portfolios. We select assumed projected rates of return for each asset class afteranalyzing long-term historical experience and future expectations of the volatility of the various asset classes. Based on target asset
allocations for each asset class, we develop an overall expected rate of return for the portfolios, adjusted for historical and expectedexperience of active portfolio management results compared to benchmark returns and for the effect of expenses paid from plan assets.
Plan Assets
We believe we manage pension and post-retirement benefit plan assets in a prudent manner with regard to preservingprincipal while providing reasonable returns. We have adopted a long-term investment horizon such that the chances and duration of
investment losses are weighed against the long-term potential for appreciation of assets. Part of our strategy includes managinginterest rate sensitivity of plan assets relative to the associated liabilities. The primary objective of the pension plan is to provide a
source of retirement income for its participants and beneficiaries, and the primary financial objective of the plan is to improve itsfunded status. The primary objective of the post-retirement benefit plan is growth in assets and preservation of principal, while
minimizing interim volatility, to meet anticipated claims of plan participants. We delegate the management of our pension andpost-retirement benefit plan assets to independent investment advisors who hire and dismiss investment managers based upon various
factors. The investment advisors are instructed to diversify investments across asset classes, sectors and manager styles to minimizethe risk of large losses, based upon objectives and risk tolerance specified by management, which include allowable and/or prohibited
investment types. We measure and monitor investment risk on an ongoing basis through quarterly investment portfolio reviews andannual liability measurements.
We have established certain prohibited investments for our pension and post-retirement benefit plans. Such prohibited
investments include loans to the company or its officers and directors as well as investments in the company’s debt or equity securities,except as may occur indirectly through investments in diversified mutual funds. In addition, to reduce concentration of risk, the
pension plan will not invest in any fund that holds more than 25% of its total assets to be invested in the securities of one or moreissuers conducting their principal business activities in the same industry. This restriction does not apply to investments in securities
issued or guaranteed by the U.S. government or its agencies.
Target allocations for our pension plan assets are approximately 39% to debt securities, 39% to equity securities, 12% toalternative investments such as real estate securities, hedge funds and private equity investments, and the remaining 10% to a fund
which provides tactical portfolio overlay by investing in futures related to debt, equity and foreign currency. Our investments in equityinclude investment funds with underlying investments in domestic and foreign large-, mid- and small-cap companies, derivatives
related to such holdings, private equity investments including late-stage venture investments and other investments. Our investments indebt include core and high-yield bonds. Core bonds are comprised of investment funds with underlying investments in investment
grade debt securities of corporate entities, obligations of U.S. and foreign governments and their agencies and other debt securities. High-yield bonds include investment funds with underlying investments in non-investment grade debt securities of corporate entities,
obligations of foreign governments and their agencies, private debt securities and other debt securities. Real estate securities consistprimarily of funds invested in core real estate throughout the U.S. while alternative funds invest in wide ranging investments including
equity and debt securities of domestic and foreign corporations, debt securities issued by U.S. and foreign governments and theiragencies, structured debt, warrants, exchange-traded funds, derivative instruments, private investment funds and other investments.
Target allocations for our post-retirement benefit plan assets are 65% to equity securities and 35% to debt securities. Our
investments in equity securities include investment funds with underlying investments primarily in domestic and foreign large-, mid-and small-cap companies. Our investments in debt securities include a core bond fund with underlying investments in investment
grade debt securities of domestic and foreign corporate entities, obligations of U.S. and foreign governments and their agencies,private placement securities and other investments.
Name of Respondent
Westar Energy, Inc.
This Report is:(1) X An Original(2) A Resubmission
Date of Report(Mo, Da, Yr)
/ /
Year/Period of Report
2016/Q4
NOTES TO FINANCIAL STATEMENTS (Continued)
FERC FORM NO. 1 (ED. 12-88) Page 123.23
20170505-8016 FERC PDF (Unofficial) 04/07/2017
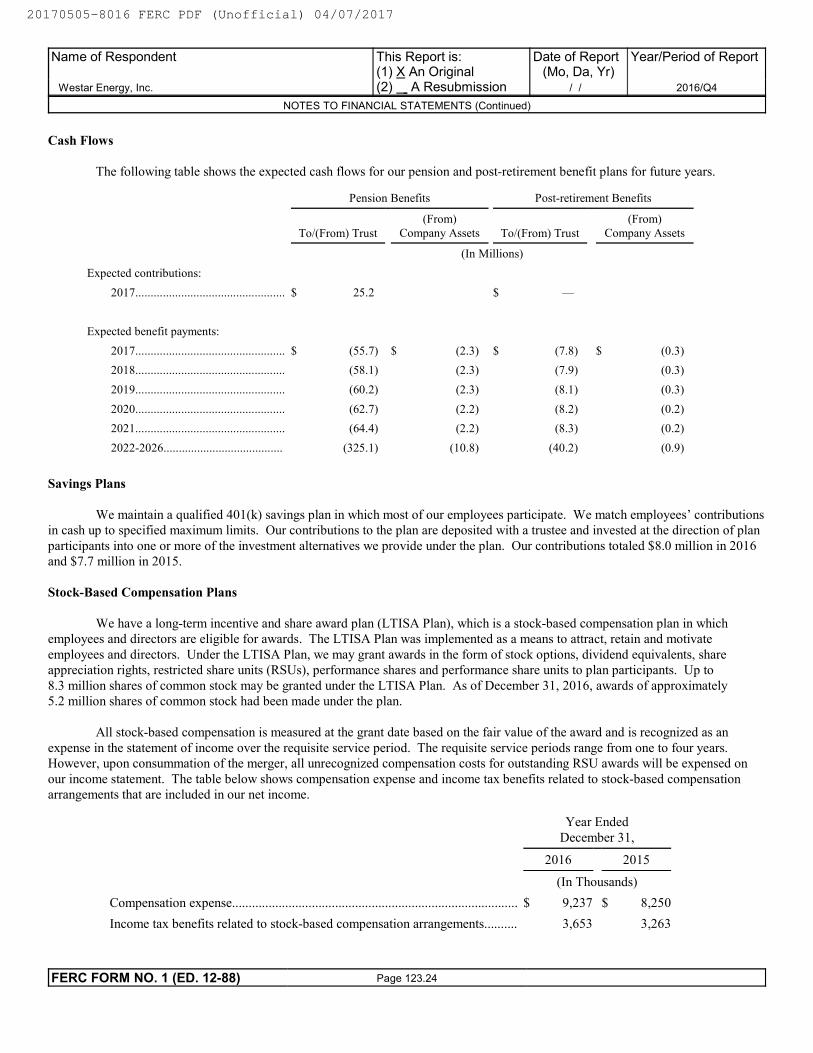
Cash Flows
The following table shows the expected cash flows for our pension and post-retirement benefit plans for future years.
Pension Benefits Post-retirement Benefits
To/(From) Trust
(From)
Company Assets To/(From) Trust
(From)
Company Assets
(In Millions)
Expected contributions:
2017................................................. $ 25.2 $ —
Expected benefit payments:
2017................................................. $ (55.7) $ (2.3) $ (7.8) $ (0.3)
2018................................................. (58.1) (2.3) (7.9) (0.3)
2019................................................. (60.2) (2.3) (8.1) (0.3)
2020................................................. (62.7) (2.2) (8.2) (0.2)
2021................................................. (64.4) (2.2) (8.3) (0.2)
2022-2026....................................... (325.1) (10.8) (40.2) (0.9)
Savings Plans
We maintain a qualified 401(k) savings plan in which most of our employees participate. We match employees’ contributionsin cash up to specified maximum limits. Our contributions to the plan are deposited with a trustee and invested at the direction of plan
participants into one or more of the investment alternatives we provide under the plan. Our contributions totaled $8.0 million in 2016and $7.7 million in 2015.
Stock-Based Compensation Plans
We have a long-term incentive and share award plan (LTISA Plan), which is a stock-based compensation plan in whichemployees and directors are eligible for awards. The LTISA Plan was implemented as a means to attract, retain and motivate
employees and directors. Under the LTISA Plan, we may grant awards in the form of stock options, dividend equivalents, shareappreciation rights, restricted share units (RSUs), performance shares and performance share units to plan participants. Up to
8.3 million shares of common stock may be granted under the LTISA Plan. As of December 31, 2016, awards of approximately5.2 million shares of common stock had been made under the plan.
All stock-based compensation is measured at the grant date based on the fair value of the award and is recognized as an
expense in the statement of income over the requisite service period. The requisite service periods range from one to four years. However, upon consummation of the merger, all unrecognized compensation costs for outstanding RSU awards will be expensed on
our income statement. The table below shows compensation expense and income tax benefits related to stock-based compensationarrangements that are included in our net income.
Year Ended
December 31,
2016 2015
(In Thousands)
Compensation expense...................................................................................... $ 9,237 $ 8,250
Income tax benefits related to stock-based compensation arrangements.......... 3,653 3,263
Name of Respondent
Westar Energy, Inc.
This Report is:(1) X An Original(2) A Resubmission
Date of Report(Mo, Da, Yr)
/ /
Year/Period of Report
2016/Q4
NOTES TO FINANCIAL STATEMENTS (Continued)
FERC FORM NO. 1 (ED. 12-88) Page 123.24
20170505-8016 FERC PDF (Unofficial) 04/07/2017
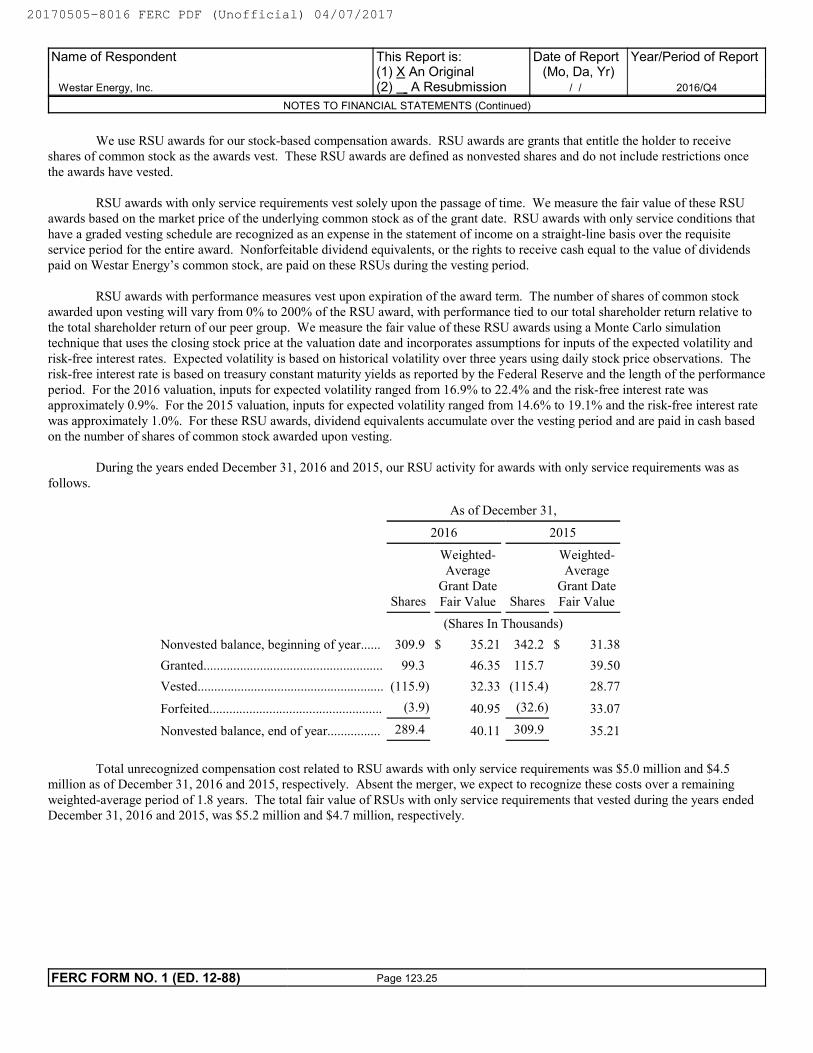
We use RSU awards for our stock-based compensation awards. RSU awards are grants that entitle the holder to receiveshares of common stock as the awards vest. These RSU awards are defined as nonvested shares and do not include restrictions once
the awards have vested.
RSU awards with only service requirements vest solely upon the passage of time. We measure the fair value of these RSUawards based on the market price of the underlying common stock as of the grant date. RSU awards with only service conditions that
have a graded vesting schedule are recognized as an expense in the statement of income on a straight-line basis over the requisiteservice period for the entire award. Nonforfeitable dividend equivalents, or the rights to receive cash equal to the value of dividends
paid on Westar Energy’s common stock, are paid on these RSUs during the vesting period.
RSU awards with performance measures vest upon expiration of the award term. The number of shares of common stockawarded upon vesting will vary from 0% to 200% of the RSU award, with performance tied to our total shareholder return relative to
the total shareholder return of our peer group. We measure the fair value of these RSU awards using a Monte Carlo simulationtechnique that uses the closing stock price at the valuation date and incorporates assumptions for inputs of the expected volatility and
risk-free interest rates. Expected volatility is based on historical volatility over three years using daily stock price observations. Therisk-free interest rate is based on treasury constant maturity yields as reported by the Federal Reserve and the length of the performance
period. For the 2016 valuation, inputs for expected volatility ranged from 16.9% to 22.4% and the risk-free interest rate wasapproximately 0.9%. For the 2015 valuation, inputs for expected volatility ranged from 14.6% to 19.1% and the risk-free interest rate
was approximately 1.0%. For these RSU awards, dividend equivalents accumulate over the vesting period and are paid in cash basedon the number of shares of common stock awarded upon vesting.
During the years ended December 31, 2016 and 2015, our RSU activity for awards with only service requirements was as
follows.
As of December 31,
2016 2015
Shares
Weighted-
AverageGrant Date
Fair Value Shares
Weighted-
AverageGrant Date
Fair Value
(Shares In Thousands)
Nonvested balance, beginning of year...... 309.9 $ 35.21 342.2 $ 31.38
Granted...................................................... 99.3 46.35 115.7 39.50
Vested........................................................ (115.9) 32.33 (115.4) 28.77
Forfeited.................................................... (3.9) 40.95 (32.6) 33.07
Nonvested balance, end of year................ 289.4 40.11 309.9 35.21
Total unrecognized compensation cost related to RSU awards with only service requirements was $5.0 million and $4.5million as of December 31, 2016 and 2015, respectively. Absent the merger, we expect to recognize these costs over a remaining
weighted-average period of 1.8 years. The total fair value of RSUs with only service requirements that vested during the years endedDecember 31, 2016 and 2015, was $5.2 million and $4.7 million, respectively.
Name of Respondent
Westar Energy, Inc.
This Report is:(1) X An Original(2) A Resubmission
Date of Report(Mo, Da, Yr)
/ /
Year/Period of Report
2016/Q4
NOTES TO FINANCIAL STATEMENTS (Continued)
FERC FORM NO. 1 (ED. 12-88) Page 123.25
20170505-8016 FERC PDF (Unofficial) 04/07/2017
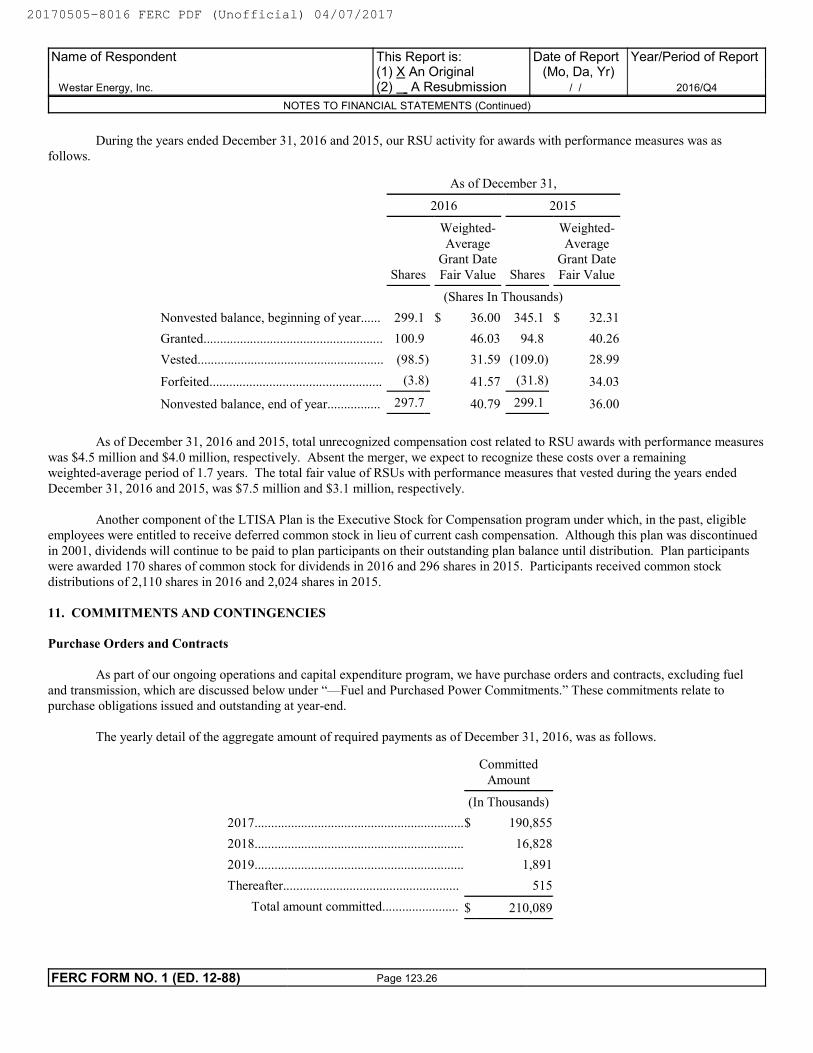
During the years ended December 31, 2016 and 2015, our RSU activity for awards with performance measures was asfollows.
As of December 31,
2016 2015
Shares
Weighted-
AverageGrant Date
Fair Value Shares
Weighted-
AverageGrant Date
Fair Value
(Shares In Thousands)
Nonvested balance, beginning of year...... 299.1 $ 36.00 345.1 $ 32.31
Granted...................................................... 100.9 46.03 94.8 40.26
Vested........................................................ (98.5) 31.59 (109.0) 28.99
Forfeited.................................................... (3.8) 41.57 (31.8) 34.03
Nonvested balance, end of year................ 297.7 40.79 299.1 36.00
As of December 31, 2016 and 2015, total unrecognized compensation cost related to RSU awards with performance measures
was $4.5 million and $4.0 million, respectively. Absent the merger, we expect to recognize these costs over a remainingweighted-average period of 1.7 years. The total fair value of RSUs with performance measures that vested during the years ended
December 31, 2016 and 2015, was $7.5 million and $3.1 million, respectively.
Another component of the LTISA Plan is the Executive Stock for Compensation program under which, in the past, eligibleemployees were entitled to receive deferred common stock in lieu of current cash compensation. Although this plan was discontinued
in 2001, dividends will continue to be paid to plan participants on their outstanding plan balance until distribution. Plan participantswere awarded 170 shares of common stock for dividends in 2016 and 296 shares in 2015. Participants received common stock
distributions of 2,110 shares in 2016 and 2,024 shares in 2015.
11. COMMITMENTS AND CONTINGENCIES
Purchase Orders and Contracts
As part of our ongoing operations and capital expenditure program, we have purchase orders and contracts, excluding fuel
and transmission, which are discussed below under “—Fuel and Purchased Power Commitments.” These commitments relate topurchase obligations issued and outstanding at year-end.
The yearly detail of the aggregate amount of required payments as of December 31, 2016, was as follows.
Committed
Amount
(In Thousands)
2017...............................................................$ 190,855
2018............................................................... 16,828
2019............................................................... 1,891
Thereafter..................................................... 515
Total amount committed....................... $ 210,089
Name of Respondent
Westar Energy, Inc.
This Report is:(1) X An Original(2) A Resubmission
Date of Report(Mo, Da, Yr)
/ /
Year/Period of Report
2016/Q4
NOTES TO FINANCIAL STATEMENTS (Continued)
FERC FORM NO. 1 (ED. 12-88) Page 123.26
20170505-8016 FERC PDF (Unofficial) 04/07/2017
Environmental Matters
Set forth below are descriptions of contingencies related to environmental matters that may impact us or our financial results. Our assessment of these contingencies, which are based on federal and state statutes and regulations, and regulatory agency and
judicial interpretations and actions, has evolved over time. Since his inauguration in January 2017, reports and other information thathave been released suggest that President Trump may alter federal environmental policy, including through executive orders and
influencing changes to statutes, regulations and agency priorities. Due in part to the preliminary nature of information that is availableto us, as well as the complex nature of environmental regulation, we are unable to assess the impact of potential changes that may
develop with respect to the environmental contingencies described below.
Federal Clean Air Act
We must comply with the federal Clean Air Act (CAA), state laws and implementing federal and state regulations thatimpose, among other things, limitations on emissions generated from our operations, including sulfur dioxide (SO2), particulate matter
(PM), nitrogen oxides (NOx), carbon monoxide (CO), mercury and acid gases.
Emissions from our generating facilities, including PM, SO2 and NOx, have been determined by regulation to reduce
visibility by causing or contributing to regional haze. Under federal laws, such as the Clean Air Visibility Rule, and pursuant to anagreement with the Kansas Department of Health and Environment (KDHE) and the Environmental Protection Agency (EPA), we are
required to install, operate and maintain controls to reduce emissions found to cause or contribute to regional haze.
Sulfur Dioxide and Nitrogen Oxide
Through the combustion of fossil fuels at our generating facilities, we emit SO2 and NOx. Federal and state laws and
regulations, including those noted above, and permits issued to us limit the amount of these substances we can emit. If we exceed theselimits, we could be subject to fines and penalties. In order to meet SO2 and NOx regulations applicable to our generating facilities, we
use low-sulfur coal and natural gas and have equipped the majority of our fossil fuel generating facilities with equipment to controlsuch emissions.
We are subject to the SO2 allowance and trading program under the federal Clean Air Act Acid Rain Program. Under this
program, each unit must have enough allowances to cover its SO2 emissions for that year. In 2016, we had adequate SO2 allowances
to meet generation and we expect to have enough to cover emissions under this program in 2017.
Cross-State Air Pollution Update Rule
In September 2016, the EPA finalized the Cross-State Air Pollution Update Rule. The final rule addresses interstate transportof NOx emissions in 22 states including Kansas, Missouri and Oklahoma during the ozone season and the impact from the formation of
ozone on downwind states with respect to the 2008 ozone National Ambient Air Quality Standards (NAAQS). Starting with the 2017ozone season, the final rule will revise the existing ozone season allowance budgets for Missouri and Oklahoma and will establish an
ozone season budget for Kansas. We do not believe this rule will have a material impact on our operations and financial results.
National Ambient Air Quality Standards
Under the federal CAA, the EPA sets NAAQS for certain emissions known as the “criteria pollutants” considered harmful to
public health and the environment, including two classes of PM, ozone, NOx (a precursor to ozone), CO and SO2, which result from
fossil fuel combustion. Areas meeting the NAAQS are designated attainment areas while those that do not meet the NAAQS are
considered nonattainment areas. Each state must develop a plan to bring nonattainment areas into compliance with the NAAQS. NAAQS must be reviewed by the EPA at five-year intervals.
In October 2015, the EPA strengthened the ozone NAAQS by lowering the standards from 75 parts per billion (ppb) to 70
ppb. In September 2016, the KDHE recommended to the EPA that they designate the state of Kansas as in attainment or inattainment/unclassifiable with the standard. The EPA is required to make attainment/nonattainment designations for the revised
Name of Respondent
Westar Energy, Inc.
This Report is:(1) X An Original(2) A Resubmission
Date of Report(Mo, Da, Yr)
/ /
Year/Period of Report
2016/Q4
NOTES TO FINANCIAL STATEMENTS (Continued)
FERC FORM NO. 1 (ED. 12-88) Page 123.27
20170505-8016 FERC PDF (Unofficial) 04/07/2017
standards by October 2017. If the EPA agrees with an attainment or attainment/unclassifiable designation for the state of Kansas, we
do not believe this will have a material impact on our financial results.
In December 2012, the EPA strengthened an existing NAAQS for one class of PM. In December 2014, the EPA designatedthe entire state of Kansas as unclassifiable/in attainment with the standard. We do not believe this will have a material impact on our
operations or financial results.
In 2010, the EPA revised the NAAQS for SO2. In March 2015, a federal court approved a consent decree between the EPA
and environmental groups. The decree includes specific SO2 emissions criteria for certain electric generating plants that, if met,
required the EPA to promulgate attainment/nonattainment designations for areas surrounding these plants. Tecumseh Energy Center is
our only generating station that meets these criteria. In June 2016, the EPA accepted the State of Kansas recommendation to designatethe areas surrounding the facility as unclassifiable, completing the second round of the designation process. In addition, in January
2017, KDHE formally recommended to the EPA a 2,000 ton per year limit for Tecumseh Energy Center Unit 7 in order to satisfy therequirements of the 1-hour SO2 Data Requirements Rule which governs the next round of the designations. By agreeing to the ton per
year limitation, no further characterization of the area surrounding the plant is required. We continue to communicate with ourregulatory agencies regarding these standards and evaluate what impact the revised NAAQS could have on our operations and
financial results. If areas surrounding our facilities are designated in the future as nonattainment and/or we are required to installadditional equipment to control emissions at our facilities, it could have a material impact on our operations and financial results.
Greenhouse Gases
Burning coal and other fossil fuels releases carbon dioxide (CO2) and other gases referred to as greenhouse gases (GHG).
Various regulations under the federal CAA limit CO2 and other GHG emissions, and other measures are being imposed or offered by
individual states, municipalities and regional agreements with the goal of reducing GHG emissions.
In October 2015, the EPA published a rule establishing new source performance standards that limit CO2 emissions for new,
modified and reconstructed coal and natural gas fueled electric generating units to various levels per Megawatt hour depending on
various characteristics of the units. Also in October 2015, the EPA published a rule establishing guidelines for states to regulate CO2
emissions from existing power plants. The standards for existing plants are known as the Clean Power Plan (CPP). Under the CPP,interim emissions performance rates must be achieved beginning in 2022 and final emissions performance rates must be achieved by
2030. Legal challenges to the CPP were filed by groups of states and industry members, including our Company, in the U.S. Court ofAppeals for the D.C. Circuit beginning in October 2015. In February 2016, after the U.S. Court of Appeals for the D.C. Circuit denied
requests to stay the CPP, the U.S. Supreme Court issued an order granting a stay of the rule pending resolution of the legal challenges. In September 2016, oral arguments were heard before the U.S. Court of Appeals for the D.C. Circuit to review the CPP and to conduct
the review en banc. Despite the stay, the EPA issued a proposed rule formalizing the details of the CPP’s Clean Energy IncentiveProgram. In January 2017, the EPA denied our Petition for Reconsideration and Administrative Stay of the CPP. Due to the future
uncertainty of the CPP, we cannot at this time determine the impact on our operations or financial results, but we believe the cost tocomply with the CPP could be material.
Water
We discharge some of the water used in our operations. This water may contain substances deemed to be pollutants. Revised
rules governing such discharges from coal-fired power plants were issued in November 2015. The final rule establishes limitations orforces the elimination of wastewater associated with coal combustion residual (CCR) handling. Implementation timelines for these
requirements will vary from 2019 to 2023. We are evaluating the final rule at this time and cannot predict the resulting impact on ouroperations or financial results, but believe costs to comply could be material.
Name of Respondent
Westar Energy, Inc.
This Report is:(1) X An Original(2) A Resubmission
Date of Report(Mo, Da, Yr)
/ /
Year/Period of Report
2016/Q4
NOTES TO FINANCIAL STATEMENTS (Continued)
FERC FORM NO. 1 (ED. 12-88) Page 123.28
20170505-8016 FERC PDF (Unofficial) 04/07/2017
In October 2014, the EPA’s final standards for cooling intake structures at power plants to protect aquatic life took effect. The standards, based on Section 316(b) of the federal Clean Water Act (CWA), require subject facilities to choose among seven best
available technology options to reduce fish impingement. In addition, some facilities must conduct studies to assist permittingauthorities to determine whether and what site-specific controls, if any, would be required to reduce entrainment of aquatic organisms.
Our current analysis indicates this rule will not have a significant impact on our coal plants that employ cooling towers. We arecurrently finalizing our evaluation of the rule and cannot predict the resulting impact on our operations or financial results, but we do
not expect it to be material.
In June 2015, the EPA along with the U.S. Army Corps of Engineers issued a final rule, effective August 2015, defining theWaters of the United States for purposes of the CWA. This rulemaking has the potential to impact all programs under the CWA.
Expansion of regulated waterways is possible under the rule depending on regulating authority interpretation, which could impactseveral permitting programs. Various states have filed lawsuits challenging the rule and, in October 2015, the U.S. Court of Appeals
for the Sixth Circuit issued an order that temporarily stays implementation of the rule nationwide pending the outcome of the variouslegal challenges. It is believed the stay will last into 2017. We are currently evaluating the final rule. We do not believe the rule will
have a material impact on our operations or financial results.
Regulation of Coal Combustion Residuals
In the course of operating our coal generation plants, we produce CCRs, including fly ash, gypsum and bottom ash. We
recycle some of our ash production, principally by selling to the aggregate industry. The EPA published a rule to regulate CCRs inApril 2015, which we believe will require additional CCR handling, processing and storage equipment and closure of certain ash
disposal ponds. Impacts to operations will be dependent on the development of groundwater monitoring of CCR units beingcompleted in 2017. We have recorded an ARO for our current estimate for closure of ash disposal ponds but may be required to
record additional AROs in the future due to changes in existing CRR regulations, changes in interpretation of existing CCR regulationsor changes in the timing or cost to close ash disposal ponds. If additional AROs are necessary, we believe the impact on our
operations or financial results could be material. See Note 12, “Asset Retirement Obligations,” for additional information.
SPP Revenue Crediting
We are a member of the Southwest Power Pool, Inc. (SPP) RTO, which coordinates the operation of a multi-state
interconnected transmission system. The SPP has recently completed the process of allocating revenue credits under its Open AccessTransmission Tariff to sponsors of certain transmission system upgrades. Qualifying upgrades are those that are not financed through
general rates paid by all customers and that result in additional revenue to the SPP. The SPP has determined sponsors are entitled torevenue credits for previously completed upgrades, and members are obligated to pay for revenue credits attributable to these historical
upgrades. As a result, we paid the SPP in November 2016 $7.6 million related to revenue credits attributable to historical upgradesfrom March 2008 to August 2016. Most of the related charges will be recovered from our customers in future prices.
Fuel and Purchased Power Commitments
To supply a portion of the fuel requirements for our power plants, we have entered into various contracts to obtain coal and
natural gas. Some of these contracts contain provisions for price escalation and minimum purchase commitments.
As of December 31, 2016, our coal and coal transportation contract commitments under the remaining terms of the contractswere approximately $555.4 million. The contracts are for plants that we operate and expire at various times through 2020.
As of December 31, 2016, our natural gas transportation contract commitments under the remaining terms of the contracts
were approximately $88.9 million. The natural gas transportation contracts provide firm service to several of our natural gas burningfacilities and expire at various times through 2030.
We have power purchase agreements with the owners of nine separate wind generation facilities with installed design
capabilities of approximately 1,328 MW expiring in 2028 through 2036. Each of the agreements provide for our receipt and purchaseof energy produced at a fixed price per unit of output. We estimate that our annual cost of energy purchased from these wind
generation facilities will be approximately $140.1 million.
Name of Respondent
Westar Energy, Inc.
This Report is:(1) X An Original(2) A Resubmission
Date of Report(Mo, Da, Yr)
/ /
Year/Period of Report
2016/Q4
NOTES TO FINANCIAL STATEMENTS (Continued)
FERC FORM NO. 1 (ED. 12-88) Page 123.29
20170505-8016 FERC PDF (Unofficial) 04/07/2017
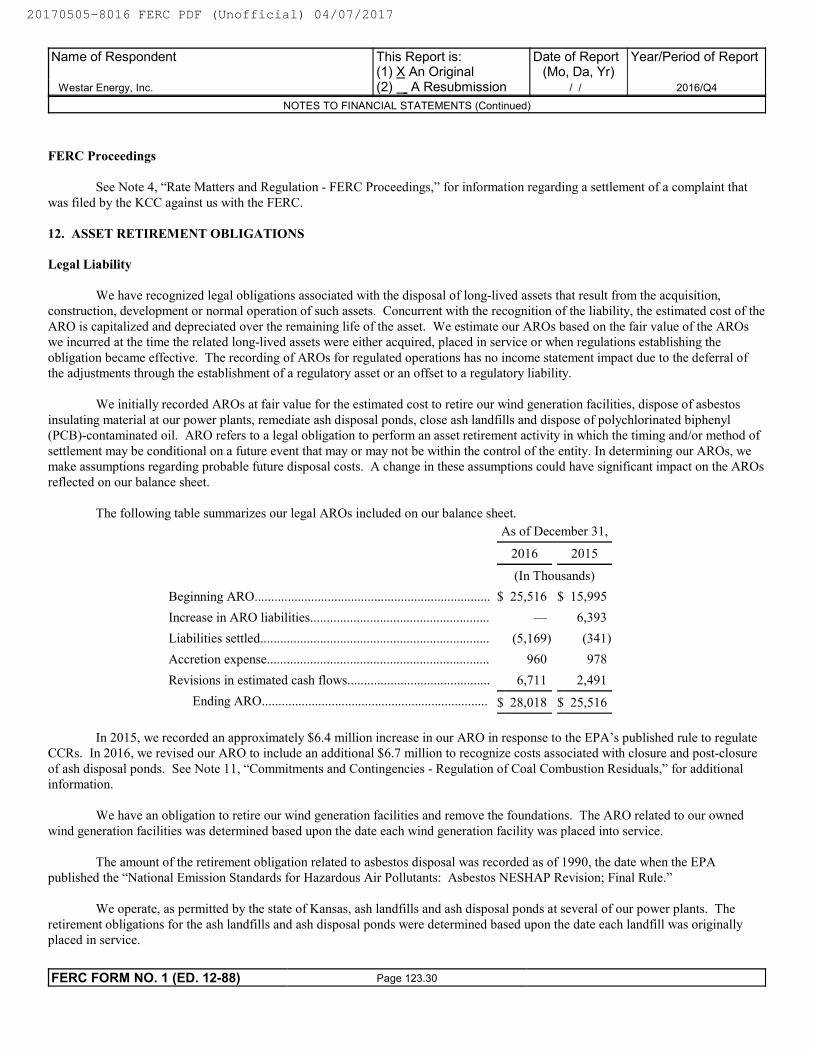
FERC Proceedings
See Note 4, “Rate Matters and Regulation - FERC Proceedings,” for information regarding a settlement of a complaint that
was filed by the KCC against us with the FERC.
12. ASSET RETIREMENT OBLIGATIONS
Legal Liability
We have recognized legal obligations associated with the disposal of long-lived assets that result from the acquisition,construction, development or normal operation of such assets. Concurrent with the recognition of the liability, the estimated cost of the
ARO is capitalized and depreciated over the remaining life of the asset. We estimate our AROs based on the fair value of the AROswe incurred at the time the related long-lived assets were either acquired, placed in service or when regulations establishing the
obligation became effective. The recording of AROs for regulated operations has no income statement impact due to the deferral ofthe adjustments through the establishment of a regulatory asset or an offset to a regulatory liability.
We initially recorded AROs at fair value for the estimated cost to retire our wind generation facilities, dispose of asbestos
insulating material at our power plants, remediate ash disposal ponds, close ash landfills and dispose of polychlorinated biphenyl(PCB)-contaminated oil. ARO refers to a legal obligation to perform an asset retirement activity in which the timing and/or method of
settlement may be conditional on a future event that may or may not be within the control of the entity. In determining our AROs, wemake assumptions regarding probable future disposal costs. A change in these assumptions could have significant impact on the AROs
reflected on our balance sheet.
The following table summarizes our legal AROs included on our balance sheet.
As of December 31,
2016 2015
(In Thousands)
Beginning ARO....................................................................... $ 25,516 $ 15,995
Increase in ARO liabilities...................................................... — 6,393
Liabilities settled..................................................................... (5,169) (341)
Accretion expense................................................................... 960 978
Revisions in estimated cash flows........................................... 6,711 2,491
Ending ARO.................................................................... $ 28,018 $ 25,516
In 2015, we recorded an approximately $6.4 million increase in our ARO in response to the EPA’s published rule to regulateCCRs. In 2016, we revised our ARO to include an additional $6.7 million to recognize costs associated with closure and post-closure
of ash disposal ponds. See Note 11, “Commitments and Contingencies - Regulation of Coal Combustion Residuals,” for additionalinformation.
We have an obligation to retire our wind generation facilities and remove the foundations. The ARO related to our owned
wind generation facilities was determined based upon the date each wind generation facility was placed into service.
The amount of the retirement obligation related to asbestos disposal was recorded as of 1990, the date when the EPApublished the “National Emission Standards for Hazardous Air Pollutants: Asbestos NESHAP Revision; Final Rule.”
We operate, as permitted by the state of Kansas, ash landfills and ash disposal ponds at several of our power plants. The
retirement obligations for the ash landfills and ash disposal ponds were determined based upon the date each landfill was originallyplaced in service.
Name of Respondent
Westar Energy, Inc.
This Report is:(1) X An Original(2) A Resubmission
Date of Report(Mo, Da, Yr)
/ /
Year/Period of Report
2016/Q4
NOTES TO FINANCIAL STATEMENTS (Continued)
FERC FORM NO. 1 (ED. 12-88) Page 123.30
20170505-8016 FERC PDF (Unofficial) 04/07/2017
PCB-contaminated oil is contained within company electrical equipment, primarily transformers. The PCB retirement
obligation was determined based upon the PCB regulations that originally became effective in 1978.
13. LEGAL PROCEEDINGS
We are involved in various legal, environmental and regulatory proceedings. We believe that adequate provisions have been
made and accordingly believe that the ultimate disposition of such matters will not have a material effect on our financial results. SeeNotes 4 and 11, “Rate Matters and Regulation” and “Commitments and Contingencies,” for additional information.
Pending Merger
Following the announcement of the merger agreement, two putative class action complaints (which were consolidated and
superseded by a consolidated complaint) and one putative derivative complaint challenging the merger were filed in the District Courtof Shawnee County, Kansas.
The consolidated putative class action complaint, filed on July 25, 2016, is captioned In re Westar Energy, Inc. Stockholder
Litigation, Case No. 2016-CV-000457. This complaint names as defendants Westar Energy, the members of our board of directors andGreat Plains Energy. The complaint asserts that the members of our board of directors breached their fiduciary duties to our
shareholders in connection with the proposed merger. It also asserts that Westar Energy and Great Plains Energy aided and abettedsuch breaches of fiduciary duties. The complaint alleges, among other things, that (i) the merger consideration deprives our
shareholders of fair consideration for their shares, (ii) the merger agreement contains deal protection provisions that unfairly favorGreat Plains Energy and discourage third parties from submitting potentially superior proposals, (iii) the disclosures are misleading
and/or omit material information necessary for our shareholders to make an informed decision whether to vote in favor of the proposedtransaction and (iv) if the proposed transaction is consummated, certain of our directors and officers stand to receive significant
benefits. The complaint seeks, among other remedies, (i) injunctive relief enjoining the merger, (ii) rescission of the merger agreementor rescissory damages, (iii) a directive to members of our board of directors to account for all damages caused by them as a result of
their breaches of their fiduciary duties and (iv) an award for costs and disbursements, including attorneys’ fees and experts’ fees.
The putative derivative complaint, filed on July 5, 2016, and as amended on August 25, 2016, is captioned Braunstein v.Chandler et al., Case No. 2016-CV-000502. This putative derivative action names as defendants the members of our board of
directors, Great Plains Energy and a subsidiary of Great Plains Energy, with Westar Energy named as a nominal defendant. Thecomplaint asserts that the members of our board of directors breached their fiduciary duties to our shareholders in connection with the
proposed merger. It also asserts that Great Plains Energy and a subsidiary of Great Plains Energy aided and abetted such breaches offiduciary duties. The complaint alleges, among other things, that the members of our board of directors failed to obtain the best
possible price for our shareholders because of a flawed process that discouraged third parties from submitting potentially superiorproposals, and that the disclosures are false or misleading due to the omission of certain information. The complaint seeks, among
other remedies, (i) a direction that the director defendants exercise their fiduciary duties to obtain a transaction which is in the bestinterests of us and our shareholders, (ii) a declaration that the proposed transaction was entered into in breach of the fiduciary duties of
the defendants and is therefore unlawful and unenforceable, (iii) rescission of the merger agreement, (iv) the imposition of aconstructive trust in favor of the plaintiff, on behalf of us, upon any benefits improperly received by the named defendants as a result
of their wrongful conduct, (v) award for costs, including attorneys’ fees and experts’ fees, and (vi) the imposition of an injunctionagainst the defendants and others from consummating the merger on the terms proposed.
On September 21, 2016, the parties in the consolidated putative class action and the putative derivative complaint
independently agreed to withdraw requests for injunctive relief and otherwise agreed in principle to dismissing the actions withprejudice and to providing releases. In exchange, the parties in the putative derivative complaint agreed that we would make
supplemental disclosures to the shareholders, which disclosures were made in a Form 8-K filed on September 21, 2016, and the partiesin the consolidated putative class action agreed that we would (i) make the disclosures in the Form 8-K filed on September 21, 2016,
and (ii) grant waivers of the prohibition on requesting a waiver of the standstill provisions in the confidentiality and standstillagreements executed by the bidders that participated in the our sale process. These agreements do not constitute any admission by any
of the defendants as to the merits of any claims. In the future the parties will prepare and present to the court for approval Stipulationsof Settlement that will, if accepted by the court, settle the actions in their entirety.
Name of Respondent
Westar Energy, Inc.
This Report is:(1) X An Original(2) A Resubmission
Date of Report(Mo, Da, Yr)
/ /
Year/Period of Report
2016/Q4
NOTES TO FINANCIAL STATEMENTS (Continued)
FERC FORM NO. 1 (ED. 12-88) Page 123.31
20170505-8016 FERC PDF (Unofficial) 04/07/2017
14. COMMON STOCK
General
Our Restated Articles of Incorporation, as amended, provide for 275.0 million authorized shares of common stock. As ofDecember 31, 2016 and 2015, we had issued 141.8 million shares and 141.4 million shares, respectively.
We have a direct stock purchase plan (DSPP). Shares of common stock sold pursuant to the DSPP may be either original
issue shares or shares purchased in the open market. During 2016 and 2015, we issued 0.4 million shares and 0.5 million shares,respectively, through the DSPP and other stock-based plans operated under the long-term incentive and share award plan. As of
December 31, 2016 and 2015, a total of 1.0 million shares and 1.2 million shares, respectively, were available under the DSPPregistration statement.
Issuances
In September 2013, we entered into two forward sale agreements with two banks. Under the terms of the agreements, the
banks, as forward sellers, borrowed 8.0 million shares of our common stock from third parties and sold them to a group of underwritersfor $31.15 per share. Pursuant to over-allotment options granted to the underwriters, the underwriters purchased in October 2013 an
additional 0.9 million shares from the banks as forward sellers, increasing the total number of shares under the forward sale agreementsto approximately 8.9 million. The underwriters received a commission equal to 3.5% of the sales price of all shares sold under each
agreement.
In March 2013, we entered into a three-year sales agency financing agreement and master forward sale agreement with abank. Both agreements expired in March 2016. The maximum amount that we could have offered and sold under the master
agreement was the lesser of an aggregate of $500.0 million or approximately 25.0 million shares, subject to adjustment for share splits,share combinations and share dividends. Under the terms of the sales agency financing agreement, we could have offered and sold
shares of our common stock from time to time. The agent received a commission equal to 1% of the sales price of all shares soldunder the agreements.
There was no common stock sale activity under these agreements in 2016. There were 9,160,500 shares that could be and
were settled in 2015. These were settled with a physical settlement amount of approximately $254.6 million.
The forward sale transactions were entered into at market prices; therefore, the forward sale agreements had no initial fairvalue. We did not receive any proceeds from the sale of common stock under the forward sale agreements until transactions were
settled. We settled the forward sale transactions through physical share settlement and recorded the forward sale agreements withinequity. The shares under the forward sale agreements were initially priced when the transactions were entered into and were subject to
certain fixed pricing adjustments during the term of the agreements. The net proceeds from the forward sale transactions represent theprices established by the forward sale agreements applicable to the time periods in which physical settlement occurred.
We used the proceeds from the transactions described above to repay short-term borrowings, with such borrowed amounts
principally used for investments in capital equipment, as well as for working capital and general corporate purposes.
Name of Respondent
Westar Energy, Inc.
This Report is:(1) X An Original(2) A Resubmission
Date of Report(Mo, Da, Yr)
/ /
Year/Period of Report
2016/Q4
NOTES TO FINANCIAL STATEMENTS (Continued)
FERC FORM NO. 1 (ED. 12-88) Page 123.32
20170505-8016 FERC PDF (Unofficial) 04/07/2017
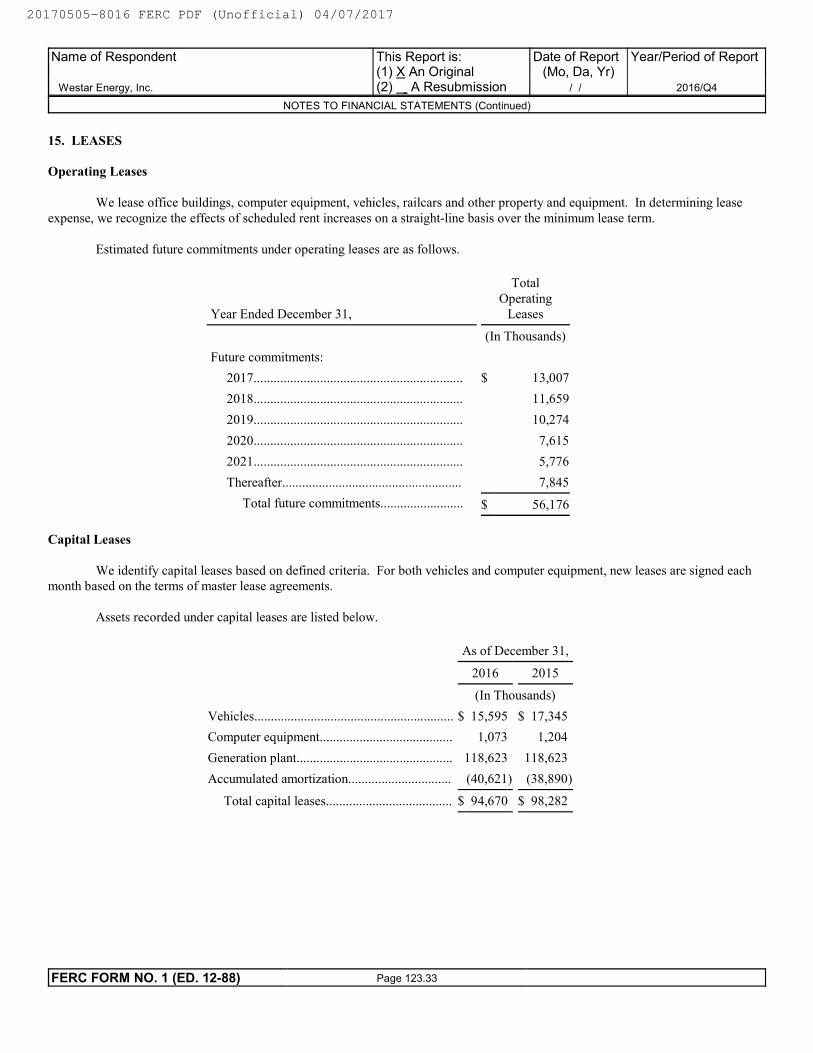
15. LEASES
Operating Leases
We lease office buildings, computer equipment, vehicles, railcars and other property and equipment. In determining lease
expense, we recognize the effects of scheduled rent increases on a straight-line basis over the minimum lease term.
Estimated future commitments under operating leases are as follows.
Year Ended December 31,
Total
OperatingLeases
(In Thousands)
Future commitments:
2017............................................................... $ 13,007
2018............................................................... 11,659
2019............................................................... 10,274
2020............................................................... 7,615
2021............................................................... 5,776
Thereafter...................................................... 7,845
Total future commitments......................... $ 56,176
Capital Leases
We identify capital leases based on defined criteria. For both vehicles and computer equipment, new leases are signed eachmonth based on the terms of master lease agreements.
Assets recorded under capital leases are listed below.
As of December 31,
2016 2015
(In Thousands)
Vehicles............................................................ $ 15,595 $ 17,345
Computer equipment........................................ 1,073 1,204
Generation plant............................................... 118,623 118,623
Accumulated amortization............................... (40,621) (38,890)
Total capital leases...................................... $ 94,670 $ 98,282
Name of Respondent
Westar Energy, Inc.
This Report is:(1) X An Original(2) A Resubmission
Date of Report(Mo, Da, Yr)
/ /
Year/Period of Report
2016/Q4
NOTES TO FINANCIAL STATEMENTS (Continued)
FERC FORM NO. 1 (ED. 12-88) Page 123.33
20170505-8016 FERC PDF (Unofficial) 04/07/2017
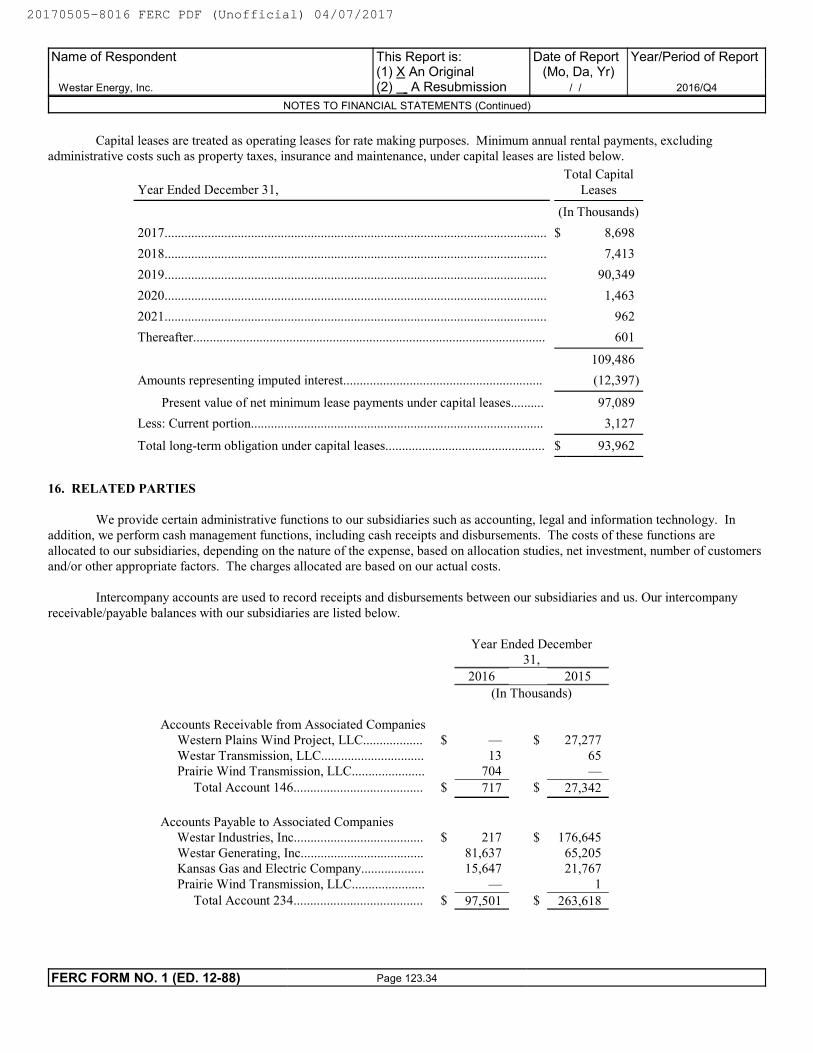
Capital leases are treated as operating leases for rate making purposes. Minimum annual rental payments, excludingadministrative costs such as property taxes, insurance and maintenance, under capital leases are listed below.
Year Ended December 31,Total Capital
Leases
(In Thousands)
2017................................................................................................................... $ 8,698
2018................................................................................................................... 7,413
2019................................................................................................................... 90,349
2020................................................................................................................... 1,463
2021................................................................................................................... 962
Thereafter.......................................................................................................... 601
109,486
Amounts representing imputed interest............................................................ (12,397)
Present value of net minimum lease payments under capital leases.......... 97,089
Less: Current portion........................................................................................ 3,127
Total long-term obligation under capital leases................................................ $ 93,962
16. RELATED PARTIES
We provide certain administrative functions to our subsidiaries such as accounting, legal and information technology. Inaddition, we perform cash management functions, including cash receipts and disbursements. The costs of these functions are
allocated to our subsidiaries, depending on the nature of the expense, based on allocation studies, net investment, number of customersand/or other appropriate factors. The charges allocated are based on our actual costs.
Intercompany accounts are used to record receipts and disbursements between our subsidiaries and us. Our intercompany
receivable/payable balances with our subsidiaries are listed below.
Year Ended December31,
2016 2015
(In Thousands)
Accounts Receivable from Associated CompaniesWestern Plains Wind Project, LLC.................. $ — $ 27,277
Westar Transmission, LLC............................... 13 65Prairie Wind Transmission, LLC...................... 704 —
Total Account 146....................................... $ 717 $ 27,342
Accounts Payable to Associated Companies Westar Industries, Inc....................................... $ 217 $ 176,645
Westar Generating, Inc..................................... 81,637 65,205Kansas Gas and Electric Company................... 15,647 21,767
Prairie Wind Transmission, LLC...................... — 1
Total Account 234....................................... $ 97,501 $ 263,618
Name of Respondent
Westar Energy, Inc.
This Report is:(1) X An Original(2) A Resubmission
Date of Report(Mo, Da, Yr)
/ /
Year/Period of Report
2016/Q4
NOTES TO FINANCIAL STATEMENTS (Continued)
FERC FORM NO. 1 (ED. 12-88) Page 123.34
20170505-8016 FERC PDF (Unofficial) 04/07/2017
Name of Respondent This Report Is:(1) An Original
(2) A Resubmission
Date of Report(Mo, Da, Yr)
Year/Period of Report
End of
STATEMENTS OF ACCUMULATED COMPREHENSIVE INCOME, COMPREHENSIVE INCOME, AND HEDGING ACTIVITIES
Westar Energy, Inc.X
/ /2016/Q4
Line
No.
1. Report in columns (b),(c),(d) and (e) the amounts of accumulated other comprehensive income items, on a net-of-tax basis, where appropriate.
2. Report in columns (f) and (g) the amounts of other categories of other cash flow hedges.
3. For each category of hedges that have been accounted for as "fair value hedges", report the accounts affected and the related amounts in a footnote.
4. Report data on a year-to-date basis.
Other
Adjustments
(e)
Foreign Currency
Hedges
(d)
Minimum Pension
Liability adjustment
(net amount)
(c)
Unrealized Gains and
Losses on Available-
for-Sale Securities
(b)
Item
(a)
Balance of Account 219 at Beginning of
Preceding Year
1
Preceding Qtr/Yr to Date Reclassifications
from Acct 219 to Net Income
2
Preceding Quarter/Year to Date Changes in
Fair Value
3
Total (lines 2 and 3) 4
Balance of Account 219 at End of
Preceding Quarter/Year
5
Balance of Account 219 at Beginning of
Current Year
6
Current Qtr/Yr to Date Reclassifications
from Acct 219 to Net Income
7
Current Quarter/Year to Date Changes in
Fair Value
8
Total (lines 7 and 8) 9
Balance of Account 219 at End of Current
Quarter/Year
10
FERC FORM NO. 1 (NEW 06-02) Page 122a
20170505-8016 FERC PDF (Unofficial) 04/07/2017
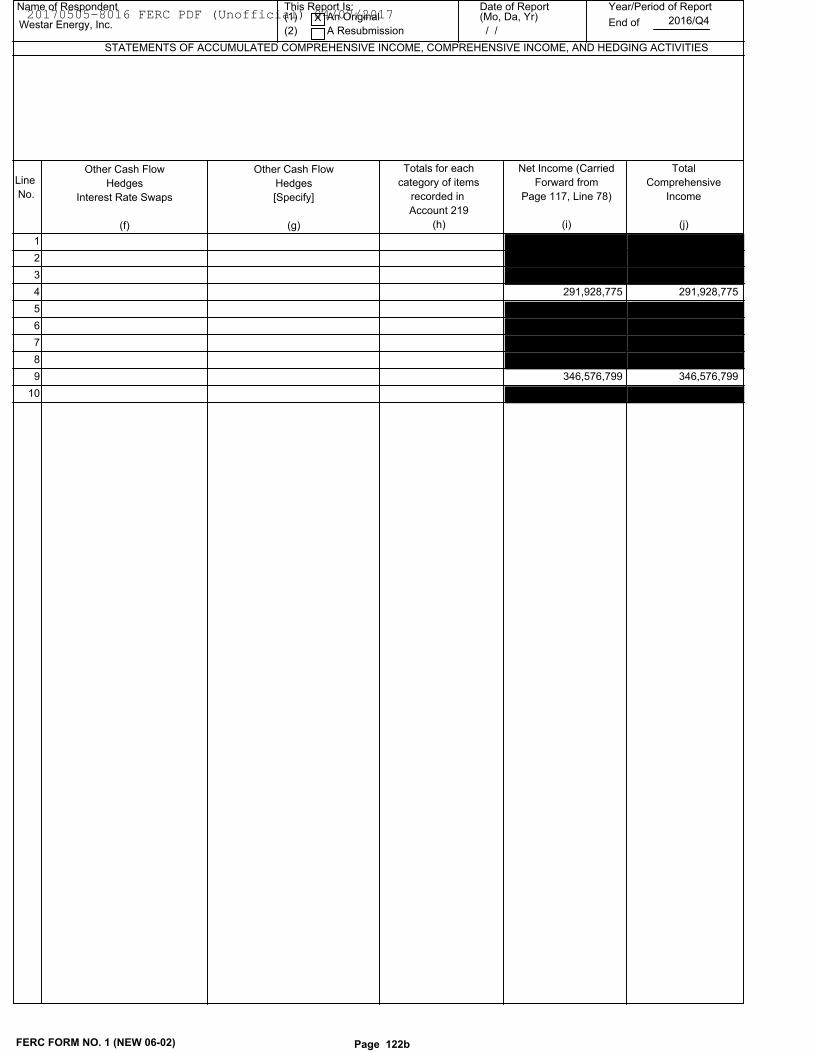
Other Cash Flow
Hedges
[Specify]
(g)
Other Cash Flow
Hedges
Interest Rate Swaps
(f)
Name of Respondent This Report Is:(1) An Original
(2) A Resubmission
Date of Report(Mo, Da, Yr)
Year/Period of Report
End of
STATEMENTS OF ACCUMULATED COMPREHENSIVE INCOME, COMPREHENSIVE INCOME, AND HEDGING ACTIVITIES
Westar Energy, Inc.X
/ /2016/Q4
Line
No.
Total
Comprehensive
Income
(j)
Net Income (Carried
Forward from
Page 117, Line 78)
(i)
Totals for each
category of items
recorded in
Account 219
(h)
1
2
3
291,928,775 291,928,775 4
5
6
7
8
346,576,799 346,576,799 9
10
FERC FORM NO. 1 (NEW 06-02) Page 122b
20170505-8016 FERC PDF (Unofficial) 04/07/2017
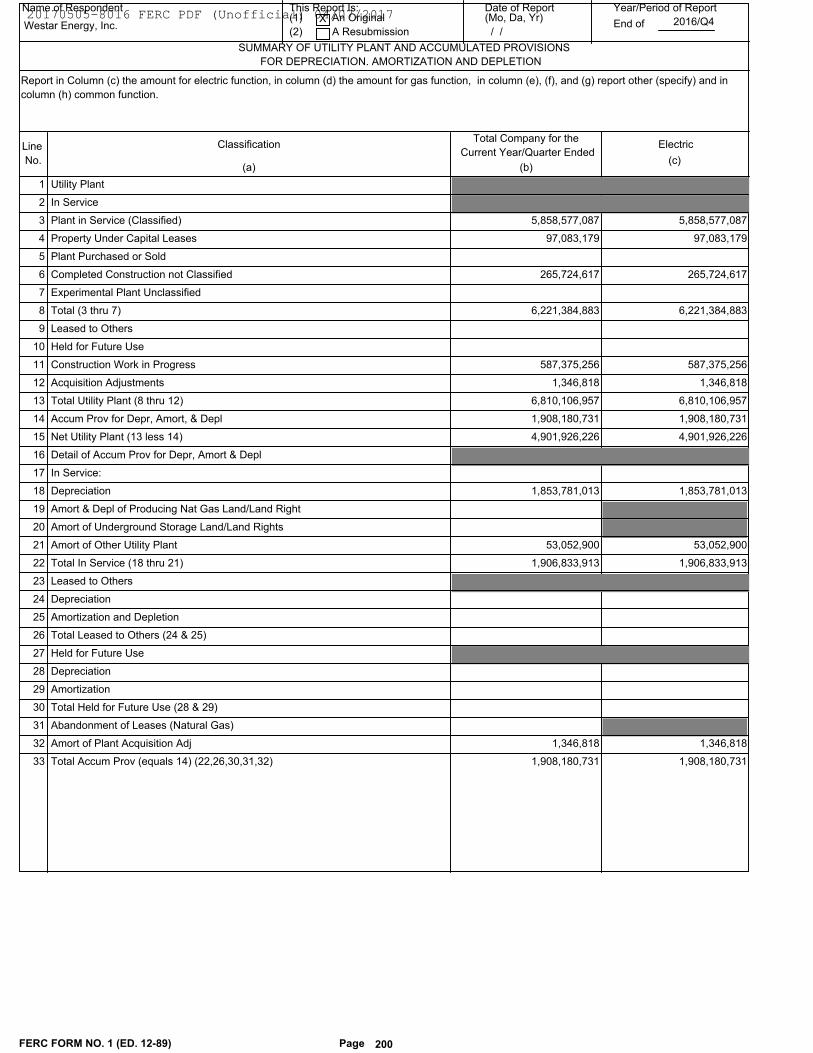
Name of Respondent This Report Is:(1) An Original
(2) A Resubmission
Date of Report(Mo, Da, Yr)
Year/Period of Report
End of
SUMMARY OF UTILITY PLANT AND ACCUMULATED PROVISIONS
Westar Energy, Inc.X
/ /2016/Q4
Line
No.(b)(a)
Classification Electric
(c)
FOR DEPRECIATION. AMORTIZATION AND DEPLETION
Total Company for the
Current Year/Quarter Ended
Report in Column (c) the amount for electric function, in column (d) the amount for gas function, in column (e), (f), and (g) report other (specify) and in
column (h) common function.
Utility Plant 1
In Service 2
5,858,577,087 5,858,577,087Plant in Service (Classified) 3
97,083,179 97,083,179Property Under Capital Leases 4
Plant Purchased or Sold 5
265,724,617 265,724,617Completed Construction not Classified 6
Experimental Plant Unclassified 7
6,221,384,883 6,221,384,883Total (3 thru 7) 8
Leased to Others 9
Held for Future Use 10
587,375,256 587,375,256Construction Work in Progress 11
1,346,818 1,346,818Acquisition Adjustments 12
6,810,106,957 6,810,106,957Total Utility Plant (8 thru 12) 13
1,908,180,731 1,908,180,731Accum Prov for Depr, Amort, & Depl 14
4,901,926,226 4,901,926,226Net Utility Plant (13 less 14) 15
Detail of Accum Prov for Depr, Amort & Depl 16
In Service: 17
1,853,781,013 1,853,781,013Depreciation 18
Amort & Depl of Producing Nat Gas Land/Land Right 19
Amort of Underground Storage Land/Land Rights 20
53,052,900 53,052,900Amort of Other Utility Plant 21
1,906,833,913 1,906,833,913Total In Service (18 thru 21) 22
Leased to Others 23
Depreciation 24
Amortization and Depletion 25
Total Leased to Others (24 & 25) 26
Held for Future Use 27
Depreciation 28
Amortization 29
Total Held for Future Use (28 & 29) 30
Abandonment of Leases (Natural Gas) 31
1,346,818 1,346,818Amort of Plant Acquisition Adj 32
1,908,180,731 1,908,180,731Total Accum Prov (equals 14) (22,26,30,31,32) 33
FERC FORM NO. 1 (ED. 12-89) Page 200
20170505-8016 FERC PDF (Unofficial) 04/07/2017
(g)
Common
(h)
Name of Respondent This Report Is:(1) An Original
(2) A Resubmission
Date of Report(Mo, Da, Yr)
Year/Period of Report
End of
SUMMARY OF UTILITY PLANT AND ACCUMULATED PROVISIONS
Westar Energy, Inc.X
/ /2016/Q4
Line
No.
FOR DEPRECIATION. AMORTIZATION AND DEPLETION
Gas Other (Specify)
(d) (e) (f)
Other (Specify)Other (Specify)
1
2
3
4
5
6
7
8
9
10
11
12
13
14
15
16
17
18
19
20
21
22
23
24
25
26
27
28
29
30
31
32
33
FERC FORM NO. 1 (ED. 12-89) Page 201
20170505-8016 FERC PDF (Unofficial) 04/07/2017
Name of Respondent This Report Is:(1) An Original
(2) A Resubmission
Date of Report(Mo, Da, Yr)
Year/Period of Report
End of
NUCLEAR FUEL MATERIALS (Account 120.1 through 120.6 and 157)
Westar Energy, Inc.X
/ /2016/Q4
Line
No.
Description of item Balance
(c)(b)(a)
Changes during YearBeginning of Year Additions
1. Report below the costs incurred for nuclear fuel materials in process of fabrication, on hand, in reactor, and in cooling; owned by the
respondent.
2. If the nuclear fuel stock is obtained under leasing arrangements, attach a statement showing the amount of nuclear fuel leased, the
quantity used and quantity on hand, and the costs incurred under such leasing arrangements.
Nuclear Fuel in process of Refinement, Conv, Enrichment & Fab (120.1) 1
Fabrication 2
Nuclear Materials 3
Allowance for Funds Used during Construction 4
(Other Overhead Construction Costs, provide details in footnote) 5
SUBTOTAL (Total 2 thru 5) 6
Nuclear Fuel Materials and Assemblies 7
In Stock (120.2) 8
In Reactor (120.3) 9
SUBTOTAL (Total 8 & 9) 10
Spent Nuclear Fuel (120.4) 11
Nuclear Fuel Under Capital Leases (120.6) 12
(Less) Accum Prov for Amortization of Nuclear Fuel Assem (120.5) 13
TOTAL Nuclear Fuel Stock (Total 6, 10, 11, 12, less 13) 14
Estimated net Salvage Value of Nuclear Materials in line 9 15
Estimated net Salvage Value of Nuclear Materials in line 11 16
Est Net Salvage Value of Nuclear Materials in Chemical Processing 17
Nuclear Materials held for Sale (157) 18
Uranium 19
Plutonium 20
Other (provide details in footnote): 21
TOTAL Nuclear Materials held for Sale (Total 19, 20, and 21) 22
FERC FORM NO. 1 (ED. 12-89) Page 202
20170505-8016 FERC PDF (Unofficial) 04/07/2017
Name of Respondent This Report Is:(1) An Original
(2) A Resubmission
Date of Report(Mo, Da, Yr)
Year/Period of Report
End of
NUCLEAR FUEL MATERIALS (Account 120.1 through 120.6 and 157)
Westar Energy, Inc.X
/ /2016/Q4
Line
No.
Balance
(f)(e)(d)
Changes during YearEnd of YearAmortization Other Reductions (Explain in a footnote)
1
2
3
4
5
6
7
8
9
10
11
12
13
14
15
16
17
18
19
20
21
22
FERC FORM NO. 1 (ED. 12-89) Page 203
20170505-8016 FERC PDF (Unofficial) 04/07/2017
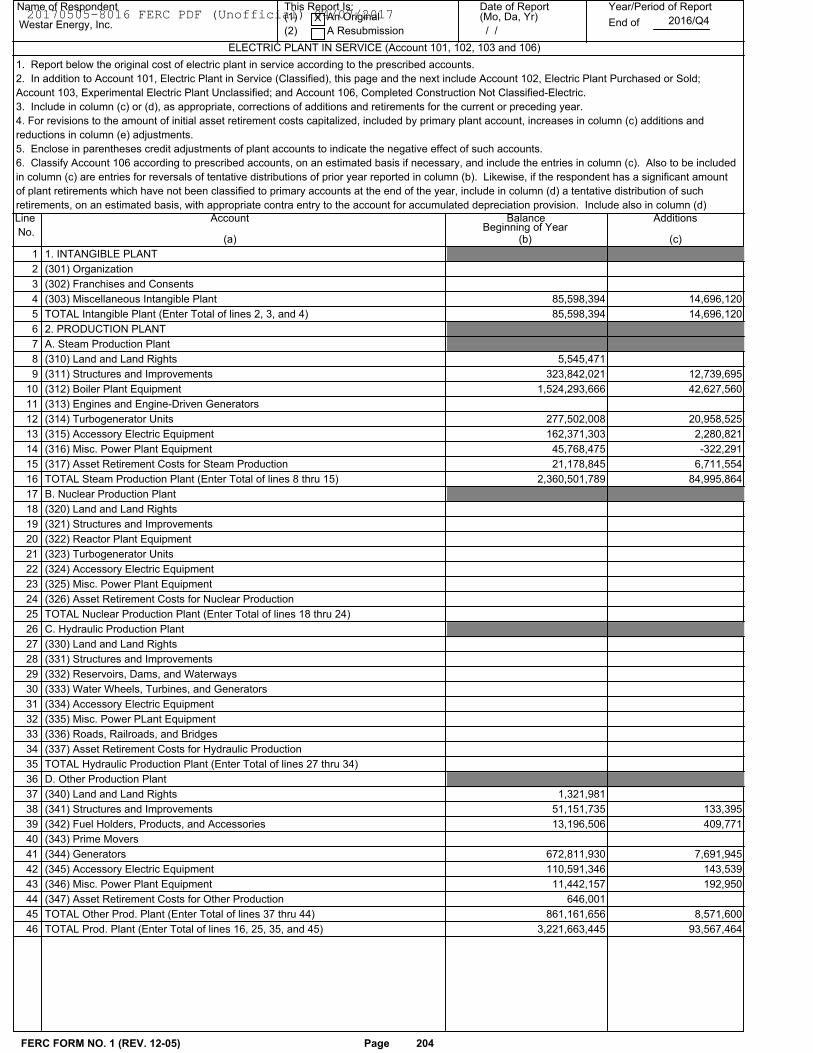
Name of Respondent This Report Is:(1) An Original
(2) A Resubmission
Date of Report(Mo, Da, Yr)
Year/Period of Report
End of
ELECTRIC PLANT IN SERVICE (Account 101, 102, 103 and 106)
Westar Energy, Inc.X
/ /2016/Q4
Line
No.
Account Balance Additions
(c)(b)(a)Beginning of Year
1. Report below the original cost of electric plant in service according to the prescribed accounts.
2. In addition to Account 101, Electric Plant in Service (Classified), this page and the next include Account 102, Electric Plant Purchased or Sold;
Account 103, Experimental Electric Plant Unclassified; and Account 106, Completed Construction Not Classified-Electric.
3. Include in column (c) or (d), as appropriate, corrections of additions and retirements for the current or preceding year.
4. For revisions to the amount of initial asset retirement costs capitalized, included by primary plant account, increases in column (c) additions and
reductions in column (e) adjustments.
5. Enclose in parentheses credit adjustments of plant accounts to indicate the negative effect of such accounts.
6. Classify Account 106 according to prescribed accounts, on an estimated basis if necessary, and include the entries in column (c). Also to be included
in column (c) are entries for reversals of tentative distributions of prior year reported in column (b). Likewise, if the respondent has a significant amount
of plant retirements which have not been classified to primary accounts at the end of the year, include in column (d) a tentative distribution of such
retirements, on an estimated basis, with appropriate contra entry to the account for accumulated depreciation provision. Include also in column (d)
1. INTANGIBLE PLANT 1
(301) Organization 2
(302) Franchises and Consents 3
(303) Miscellaneous Intangible Plant 85,598,394 14,696,120 4
TOTAL Intangible Plant (Enter Total of lines 2, 3, and 4) 85,598,394 14,696,120 5
2. PRODUCTION PLANT 6
A. Steam Production Plant 7
(310) Land and Land Rights 5,545,471 8
(311) Structures and Improvements 323,842,021 12,739,695 9
(312) Boiler Plant Equipment 1,524,293,666 42,627,560 10
(313) Engines and Engine-Driven Generators 11
(314) Turbogenerator Units 277,502,008 20,958,525 12
(315) Accessory Electric Equipment 162,371,303 2,280,821 13
(316) Misc. Power Plant Equipment 45,768,475 -322,291 14
(317) Asset Retirement Costs for Steam Production 21,178,845 6,711,554 15
TOTAL Steam Production Plant (Enter Total of lines 8 thru 15) 2,360,501,789 84,995,864 16
B. Nuclear Production Plant 17
(320) Land and Land Rights 18
(321) Structures and Improvements 19
(322) Reactor Plant Equipment 20
(323) Turbogenerator Units 21
(324) Accessory Electric Equipment 22
(325) Misc. Power Plant Equipment 23
(326) Asset Retirement Costs for Nuclear Production 24
TOTAL Nuclear Production Plant (Enter Total of lines 18 thru 24) 25
C. Hydraulic Production Plant 26
(330) Land and Land Rights 27
(331) Structures and Improvements 28
(332) Reservoirs, Dams, and Waterways 29
(333) Water Wheels, Turbines, and Generators 30
(334) Accessory Electric Equipment 31
(335) Misc. Power PLant Equipment 32
(336) Roads, Railroads, and Bridges 33
(337) Asset Retirement Costs for Hydraulic Production 34
TOTAL Hydraulic Production Plant (Enter Total of lines 27 thru 34) 35
D. Other Production Plant 36
(340) Land and Land Rights 1,321,981 37
(341) Structures and Improvements 51,151,735 133,395 38
(342) Fuel Holders, Products, and Accessories 13,196,506 409,771 39
(343) Prime Movers 40
(344) Generators 672,811,930 7,691,945 41
(345) Accessory Electric Equipment 110,591,346 143,539 42
(346) Misc. Power Plant Equipment 11,442,157 192,950 43
(347) Asset Retirement Costs for Other Production 646,001 44
TOTAL Other Prod. Plant (Enter Total of lines 37 thru 44) 861,161,656 8,571,600 45
TOTAL Prod. Plant (Enter Total of lines 16, 25, 35, and 45) 3,221,663,445 93,567,464 46
Page 204FERC FORM NO. 1 (REV. 12-05)
20170505-8016 FERC PDF (Unofficial) 04/07/2017
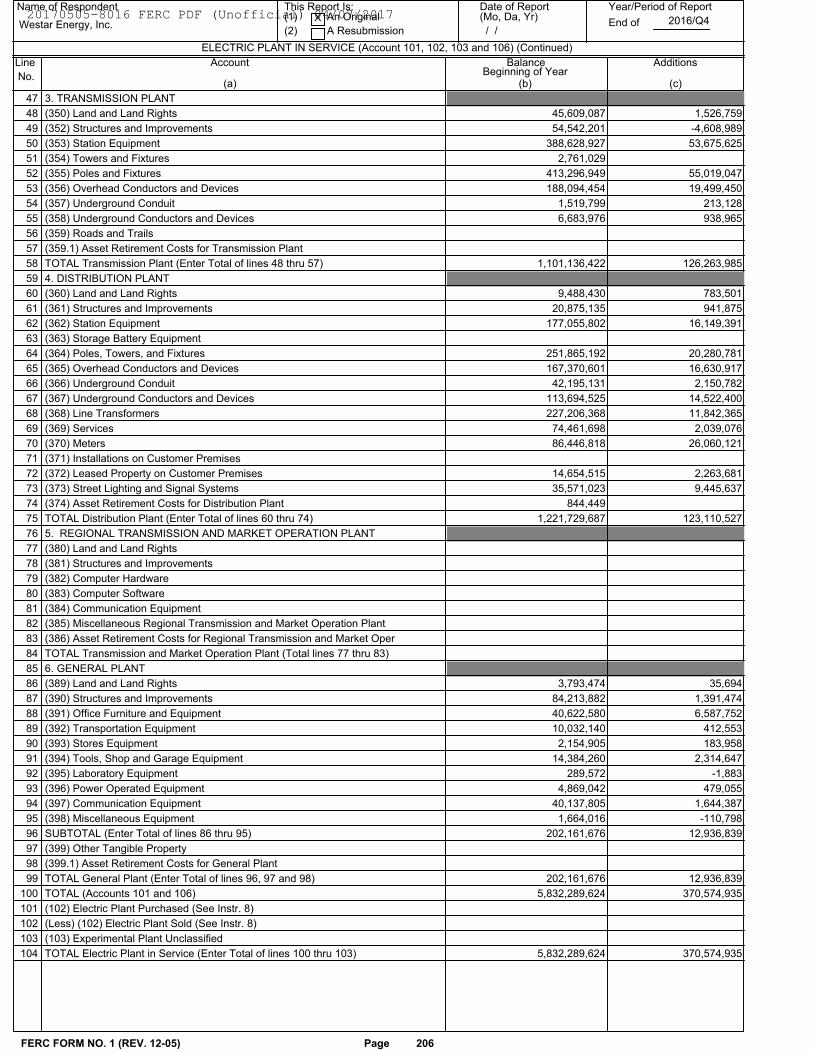
ELECTRIC PLANT IN SERVICE (Account 101, 102, 103 and 106) (Continued)
Name of Respondent This Report Is:(1) An Original
(2) A Resubmission
Date of Report(Mo, Da, Yr)
Year/Period of Report
End ofWestar Energy, Inc.X
/ /2016/Q4
Line
No.
Account Balance Additions
(c)(b)(a)Beginning of Year
3. TRANSMISSION PLANT 47
(350) Land and Land Rights 45,609,087 1,526,759 48
(352) Structures and Improvements 54,542,201 -4,608,989 49
(353) Station Equipment 388,628,927 53,675,625 50
(354) Towers and Fixtures 2,761,029 51
(355) Poles and Fixtures 413,296,949 55,019,047 52
(356) Overhead Conductors and Devices 188,094,454 19,499,450 53
(357) Underground Conduit 1,519,799 213,128 54
(358) Underground Conductors and Devices 6,683,976 938,965 55
(359) Roads and Trails 56
(359.1) Asset Retirement Costs for Transmission Plant 57
TOTAL Transmission Plant (Enter Total of lines 48 thru 57) 1,101,136,422 126,263,985 58
4. DISTRIBUTION PLANT 59
(360) Land and Land Rights 9,488,430 783,501 60
(361) Structures and Improvements 20,875,135 941,875 61
(362) Station Equipment 177,055,802 16,149,391 62
(363) Storage Battery Equipment 63
(364) Poles, Towers, and Fixtures 251,865,192 20,280,781 64
(365) Overhead Conductors and Devices 167,370,601 16,630,917 65
(366) Underground Conduit 42,195,131 2,150,782 66
(367) Underground Conductors and Devices 113,694,525 14,522,400 67
(368) Line Transformers 227,206,368 11,842,365 68
(369) Services 74,461,698 2,039,076 69
(370) Meters 86,446,818 26,060,121 70
(371) Installations on Customer Premises 71
(372) Leased Property on Customer Premises 14,654,515 2,263,681 72
(373) Street Lighting and Signal Systems 35,571,023 9,445,637 73
(374) Asset Retirement Costs for Distribution Plant 844,449 74
TOTAL Distribution Plant (Enter Total of lines 60 thru 74) 1,221,729,687 123,110,527 75
5. REGIONAL TRANSMISSION AND MARKET OPERATION PLANT 76
(380) Land and Land Rights 77
(381) Structures and Improvements 78
(382) Computer Hardware 79
(383) Computer Software 80
(384) Communication Equipment 81
(385) Miscellaneous Regional Transmission and Market Operation Plant 82
(386) Asset Retirement Costs for Regional Transmission and Market Oper 83
TOTAL Transmission and Market Operation Plant (Total lines 77 thru 83) 84
6. GENERAL PLANT 85
(389) Land and Land Rights 3,793,474 35,694 86
(390) Structures and Improvements 84,213,882 1,391,474 87
(391) Office Furniture and Equipment 40,622,580 6,587,752 88
(392) Transportation Equipment 10,032,140 412,553 89
(393) Stores Equipment 2,154,905 183,958 90
(394) Tools, Shop and Garage Equipment 14,384,260 2,314,647 91
(395) Laboratory Equipment 289,572 -1,883 92
(396) Power Operated Equipment 4,869,042 479,055 93
(397) Communication Equipment 40,137,805 1,644,387 94
(398) Miscellaneous Equipment 1,664,016 -110,798 95
SUBTOTAL (Enter Total of lines 86 thru 95) 202,161,676 12,936,839 96
(399) Other Tangible Property 97
(399.1) Asset Retirement Costs for General Plant 98
TOTAL General Plant (Enter Total of lines 96, 97 and 98) 202,161,676 12,936,839 99
TOTAL (Accounts 101 and 106) 5,832,289,624 370,574,935 100
(102) Electric Plant Purchased (See Instr. 8) 101
(Less) (102) Electric Plant Sold (See Instr. 8) 102
(103) Experimental Plant Unclassified 103
TOTAL Electric Plant in Service (Enter Total of lines 100 thru 103) 5,832,289,624 370,574,935 104
Page 206FERC FORM NO. 1 (REV. 12-05)
20170505-8016 FERC PDF (Unofficial) 04/07/2017
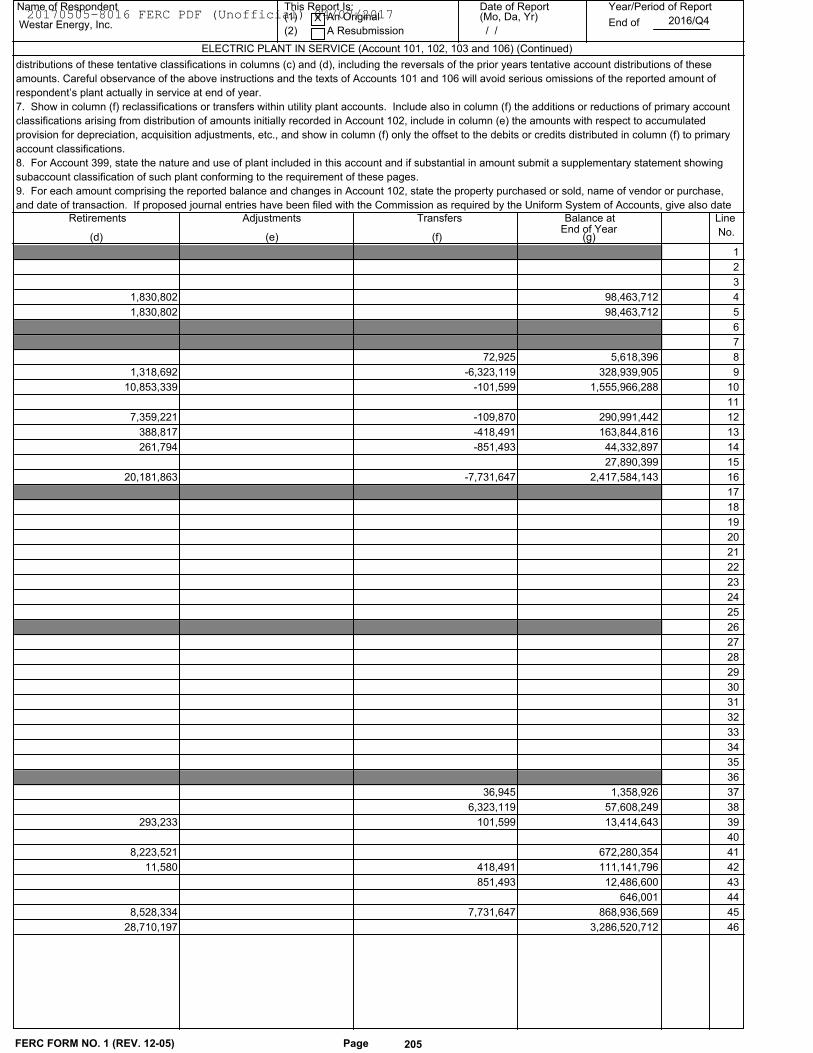
(f)
Transfers Balance atEnd of Year
Name of Respondent This Report Is:(1) An Original
(2) A Resubmission
Date of Report(Mo, Da, Yr)
Year/Period of Report
End ofWestar Energy, Inc.X
/ /2016/Q4
Line
No.(g)
Adjustments
(e)
Retirements
(d)
ELECTRIC PLANT IN SERVICE (Account 101, 102, 103 and 106) (Continued)
distributions of these tentative classifications in columns (c) and (d), including the reversals of the prior years tentative account distributions of these
amounts. Careful observance of the above instructions and the texts of Accounts 101 and 106 will avoid serious omissions of the reported amount of
respondent’s plant actually in service at end of year.
7. Show in column (f) reclassifications or transfers within utility plant accounts. Include also in column (f) the additions or reductions of primary account
classifications arising from distribution of amounts initially recorded in Account 102, include in column (e) the amounts with respect to accumulated
provision for depreciation, acquisition adjustments, etc., and show in column (f) only the offset to the debits or credits distributed in column (f) to primary
account classifications.
8. For Account 399, state the nature and use of plant included in this account and if substantial in amount submit a supplementary statement showing
subaccount classification of such plant conforming to the requirement of these pages.
9. For each amount comprising the reported balance and changes in Account 102, state the property purchased or sold, name of vendor or purchase,
and date of transaction. If proposed journal entries have been filed with the Commission as required by the Uniform System of Accounts, give also date
1
2
3
98,463,712 1,830,802 4
98,463,712 1,830,802 5
6
7
5,618,396 72,925 8
328,939,905 -6,323,119 1,318,692 9
1,555,966,288 -101,599 10,853,339 10
11
290,991,442 -109,870 7,359,221 12
163,844,816 -418,491 388,817 13
44,332,897 -851,493 261,794 14
27,890,399 15
2,417,584,143 -7,731,647 20,181,863 16
17
18
19
20
21
22
23
24
25
26
27
28
29
30
31
32
33
34
35
36
1,358,926 36,945 37
57,608,249 6,323,119 38
13,414,643 101,599 293,233 39
40
672,280,354 8,223,521 41
111,141,796 418,491 11,580 42
12,486,600 851,493 43
646,001 44
868,936,569 7,731,647 8,528,334 45
3,286,520,712 28,710,197 46
Page 205FERC FORM NO. 1 (REV. 12-05)
20170505-8016 FERC PDF (Unofficial) 04/07/2017
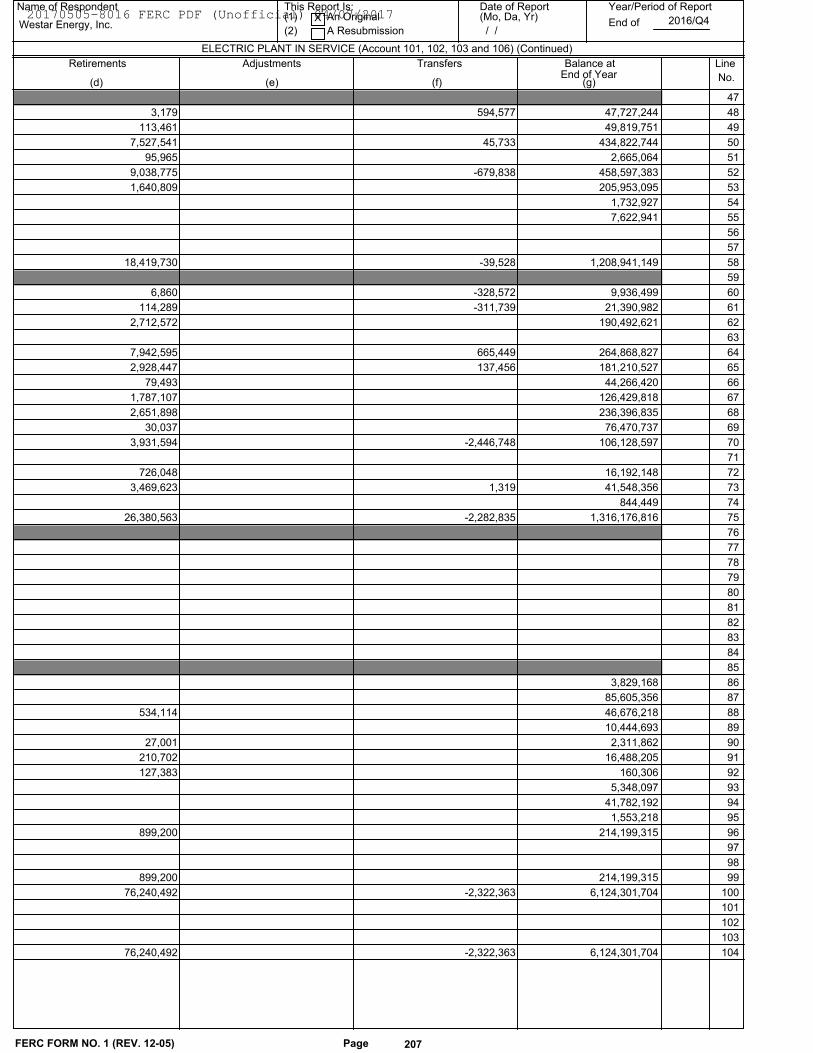
(f)
Transfers Balance atEnd of Year
Name of Respondent This Report Is:(1) An Original
(2) A Resubmission
Date of Report(Mo, Da, Yr)
Year/Period of Report
End ofWestar Energy, Inc.X
/ /2016/Q4
Line
No.(g)
Adjustments
(e)
Retirements
(d)
ELECTRIC PLANT IN SERVICE (Account 101, 102, 103 and 106) (Continued)
47
47,727,244 594,577 3,179 48
49,819,751 113,461 49
434,822,744 45,733 7,527,541 50
2,665,064 95,965 51
458,597,383 -679,838 9,038,775 52
205,953,095 1,640,809 53
1,732,927 54
7,622,941 55
56
57
1,208,941,149 -39,528 18,419,730 58
59
9,936,499 -328,572 6,860 60
21,390,982 -311,739 114,289 61
190,492,621 2,712,572 62
63
264,868,827 665,449 7,942,595 64
181,210,527 137,456 2,928,447 65
44,266,420 79,493 66
126,429,818 1,787,107 67
236,396,835 2,651,898 68
76,470,737 30,037 69
106,128,597 -2,446,748 3,931,594 70
71
16,192,148 726,048 72
41,548,356 1,319 3,469,623 73
844,449 74
1,316,176,816 -2,282,835 26,380,563 75
76
77
78
79
80
81
82
83
84
85
3,829,168 86
85,605,356 87
46,676,218 534,114 88
10,444,693 89
2,311,862 27,001 90
16,488,205 210,702 91
160,306 127,383 92
5,348,097 93
41,782,192 94
1,553,218 95
214,199,315 899,200 96
97
98
214,199,315 899,200 99
6,124,301,704 -2,322,363 76,240,492 100
101
102
103
6,124,301,704 -2,322,363 76,240,492 104
Page 207FERC FORM NO. 1 (REV. 12-05)
20170505-8016 FERC PDF (Unofficial) 04/07/2017
Name of Respondent This Report Is:(1) An Original
(2) A Resubmission
Date of Report(Mo, Da, Yr)
Year/Period of Report
End of
ELECTRIC PLANT LEASED TO OTHERS (Account 104)
Westar Energy, Inc.X
/ /2016/Q4
Line
No.
Name of LesseeDescription of
(b)(a)
(Designate associated companieswith a double asterisk) Property Leased
CommissionAuthorization
(c)
ExpirationDate ofLease
(d)
Balance atEnd of Year
(e)
1
2
3
4
5
6
7
8
9
10
11
12
13
14
15
16
17
18
19
20
21
22
23
24
25
26
27
28
29
30
31
32
33
34
35
36
37
38
39
40
41
42
43
44
45
46
FERC FORM NO. 1 (ED. 12-95) Page 213
47 TOTAL
20170505-8016 FERC PDF (Unofficial) 04/07/2017
Name of Respondent This Report Is:(1) An Original
(2) A Resubmission
Date of Report(Mo, Da, Yr)
Year/Period of Report
End of
ELECTRIC PLANT HELD FOR FUTURE USE (Account 105)
Westar Energy, Inc.X
/ /2016/Q4
Line Description and Location Date Originally Included Balance atEnd of Year
(c)(b)(a)Of Property in This Account
Date Expected to be usedin Utility Service
(d)No.
1. Report separately each property held for future use at end of the year having an original cost of $250,000 or more. Group other items of property held
for future use.
2. For property having an original cost of $250,000 or more previously used in utility operations, now held for future use, give in column (a), in addition to
other required information, the date that utility use of such property was discontinued, and the date the original cost was transferred to Account 105.
Land and Rights: 1
2
3
4
5
6
7
8
9
10
11
12
13
14
15
16
17
18
19
20
Other Property: 21
22
23
24
25
26
27
28
29
30
31
32
33
34
35
36
37
38
39
40
41
42
43
44
45
46
FERC FORM NO. 1 (ED. 12-96) Page 214
47 Total 0
20170505-8016 FERC PDF (Unofficial) 04/07/2017
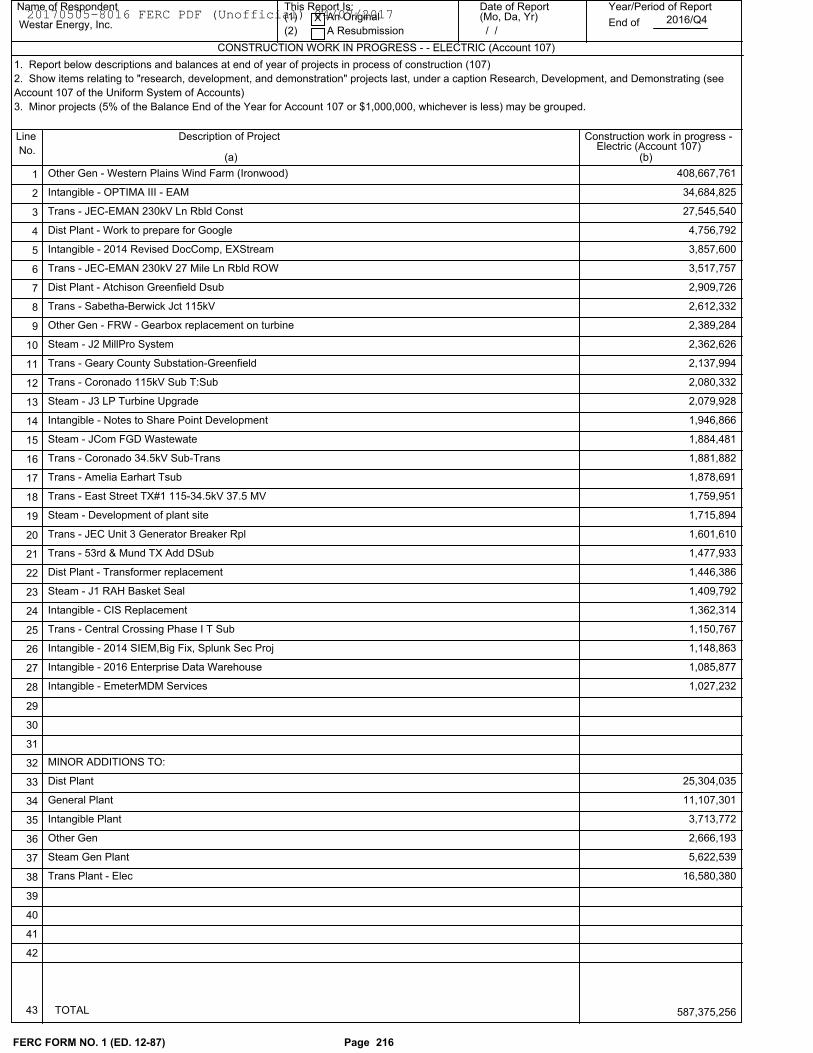
Name of Respondent This Report Is:(1) An Original
(2) A Resubmission
Date of Report(Mo, Da, Yr)
Year/Period of Report
End of
CONSTRUCTION WORK IN PROGRESS - - ELECTRIC (Account 107)
Westar Energy, Inc.X
/ /2016/Q4
Line
No.
Description of Project Construction work in progress -
(b)(a)Electric (Account 107)
1. Report below descriptions and balances at end of year of projects in process of construction (107)
2. Show items relating to "research, development, and demonstration" projects last, under a caption Research, Development, and Demonstrating (see
Account 107 of the Uniform System of Accounts)
3. Minor projects (5% of the Balance End of the Year for Account 107 or $1,000,000, whichever is less) may be grouped.
408,667,761Other Gen - Western Plains Wind Farm (Ironwood) 1
34,684,825Intangible - OPTIMA III - EAM 2
27,545,540Trans - JEC-EMAN 230kV Ln Rbld Const 3
4,756,792Dist Plant - Work to prepare for Google 4
3,857,600Intangible - 2014 Revised DocComp, EXStream 5
3,517,757Trans - JEC-EMAN 230kV 27 Mile Ln Rbld ROW 6
2,909,726Dist Plant - Atchison Greenfield Dsub 7
2,612,332Trans - Sabetha-Berwick Jct 115kV 8
2,389,284Other Gen - FRW - Gearbox replacement on turbine 9
2,362,626Steam - J2 MillPro System 10
2,137,994Trans - Geary County Substation-Greenfield 11
2,080,332Trans - Coronado 115kV Sub T:Sub 12
2,079,928Steam - J3 LP Turbine Upgrade 13
1,946,866Intangible - Notes to Share Point Development 14
1,884,481Steam - JCom FGD Wastewate 15
1,881,882Trans - Coronado 34.5kV Sub-Trans 16
1,878,691Trans - Amelia Earhart Tsub 17
1,759,951Trans - East Street TX#1 115-34.5kV 37.5 MV 18
1,715,894Steam - Development of plant site 19
1,601,610Trans - JEC Unit 3 Generator Breaker Rpl 20
1,477,933Trans - 53rd & Mund TX Add DSub 21
1,446,386Dist Plant - Transformer replacement 22
1,409,792Steam - J1 RAH Basket Seal 23
1,362,314Intangible - CIS Replacement 24
1,150,767Trans - Central Crossing Phase I T Sub 25
1,148,863Intangible - 2014 SIEM,Big Fix, Splunk Sec Proj 26
1,085,877Intangible - 2016 Enterprise Data Warehouse 27
1,027,232Intangible - EmeterMDM Services 28
29
30
31
MINOR ADDITIONS TO: 32
25,304,035Dist Plant 33
11,107,301General Plant 34
3,713,772Intangible Plant 35
2,666,193Other Gen 36
5,622,539Steam Gen Plant 37
16,580,380Trans Plant - Elec 38
39
40
41
42
FERC FORM NO. 1 (ED. 12-87) Page 216
43 TOTAL 587,375,256
20170505-8016 FERC PDF (Unofficial) 04/07/2017
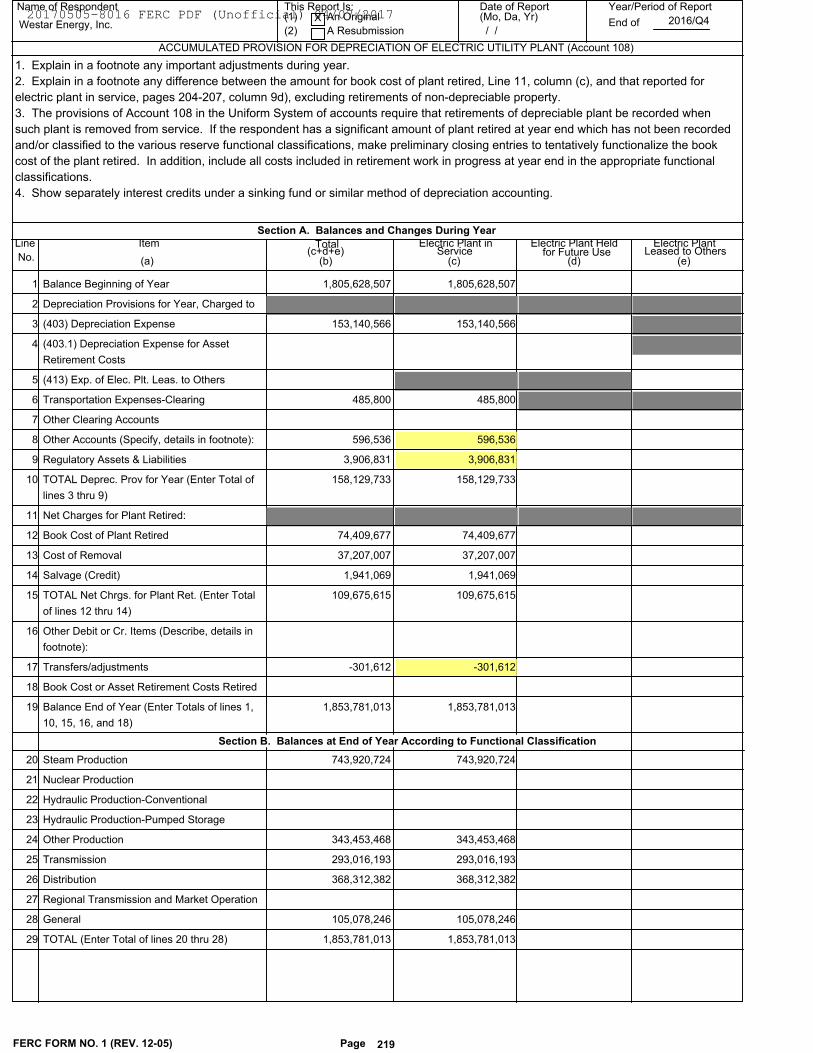
Name of Respondent This Report Is:(1) An Original
(2) A Resubmission
Date of Report(Mo, Da, Yr)
Year/Period of Report
End of
ACCUMULATED PROVISION FOR DEPRECIATION OF ELECTRIC UTILITY PLANT (Account 108)
Westar Energy, Inc.X
/ /2016/Q4
Line
No.
Item Total
(c)(b)(a) (d)
Section A. Balances and Changes During Year
(c+d+e)Electric Plant in
ServiceElectric Plant Held
for Future UseElectric Plant
Leased to Others(e)
1. Explain in a footnote any important adjustments during year.
2. Explain in a footnote any difference between the amount for book cost of plant retired, Line 11, column (c), and that reported for
electric plant in service, pages 204-207, column 9d), excluding retirements of non-depreciable property.
3. The provisions of Account 108 in the Uniform System of accounts require that retirements of depreciable plant be recorded when
such plant is removed from service. If the respondent has a significant amount of plant retired at year end which has not been recorded
and/or classified to the various reserve functional classifications, make preliminary closing entries to tentatively functionalize the book
cost of the plant retired. In addition, include all costs included in retirement work in progress at year end in the appropriate functional
classifications.
4. Show separately interest credits under a sinking fund or similar method of depreciation accounting.
Balance Beginning of Year 1 1,805,628,507 1,805,628,507
Depreciation Provisions for Year, Charged to 2
(403) Depreciation Expense 3 153,140,566 153,140,566
(403.1) Depreciation Expense for Asset
Retirement Costs
4
(413) Exp. of Elec. Plt. Leas. to Others 5
Transportation Expenses-Clearing 6 485,800 485,800
Other Clearing Accounts 7
Other Accounts (Specify, details in footnote): 8 596,536 596,536
Regulatory Assets & Liabilities 9 3,906,831 3,906,831
TOTAL Deprec. Prov for Year (Enter Total of
lines 3 thru 9)
10 158,129,733 158,129,733
Net Charges for Plant Retired: 11
Book Cost of Plant Retired 12 74,409,677 74,409,677
Cost of Removal 13 37,207,007 37,207,007
Salvage (Credit) 14 1,941,069 1,941,069
TOTAL Net Chrgs. for Plant Ret. (Enter Total
of lines 12 thru 14)
15 109,675,615 109,675,615
Other Debit or Cr. Items (Describe, details in
footnote):
16
Transfers/adjustments 17 -301,612 -301,612
Book Cost or Asset Retirement Costs Retired 18
Balance End of Year (Enter Totals of lines 1,
10, 15, 16, and 18)
19 1,853,781,013 1,853,781,013
Steam Production 20
Section B. Balances at End of Year According to Functional Classification
743,920,724 743,920,724
Nuclear Production 21
Hydraulic Production-Conventional 22
Hydraulic Production-Pumped Storage 23
Other Production 24 343,453,468 343,453,468
Transmission 25 293,016,193 293,016,193
Distribution 26 368,312,382 368,312,382
Regional Transmission and Market Operation 27
General 28 105,078,246 105,078,246
TOTAL (Enter Total of lines 20 thru 28) 29 1,853,781,013 1,853,781,013
Page 219FERC FORM NO. 1 (REV. 12-05)
20170505-8016 FERC PDF (Unofficial) 04/07/2017
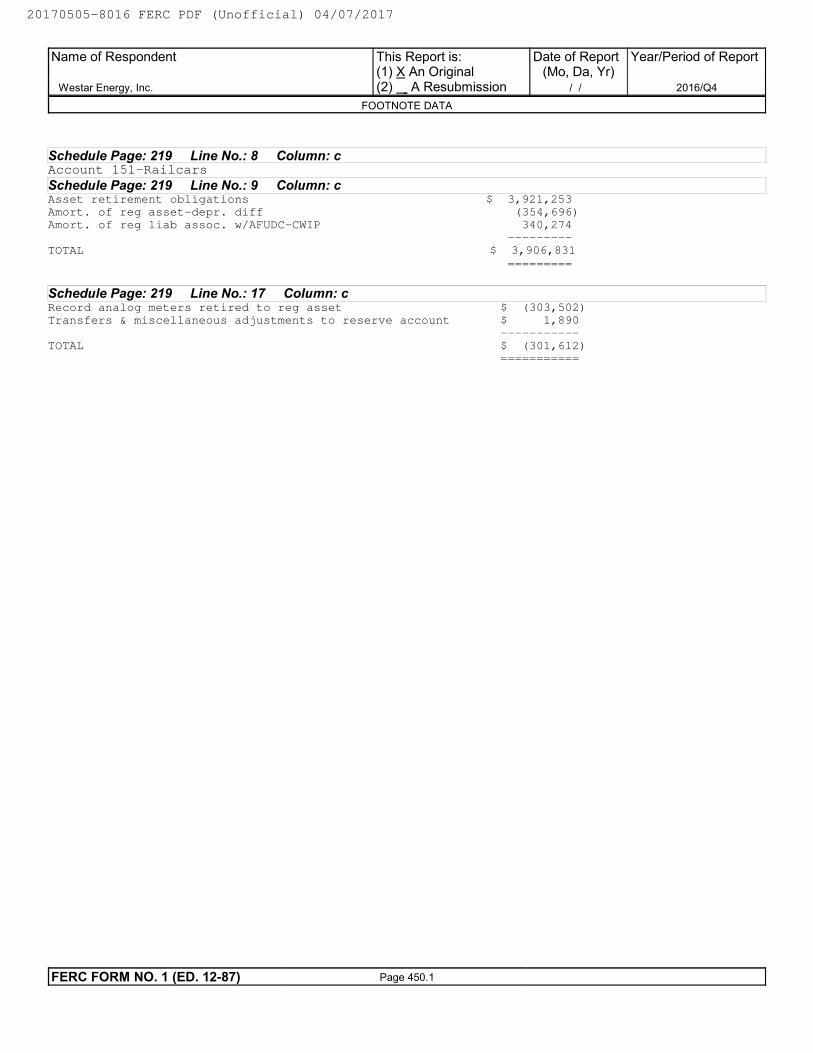
Schedule Page: 219 Line No.: 8 Column: cAccount 151-Railcars
Schedule Page: 219 Line No.: 9 Column: cAsset retirement obligations $ 3,921,253Amort. of reg asset-depr. diff (354,696) Amort. of reg liab assoc. w/AFUDC-CWIP 340,274 ---------TOTAL $ 3,906,831
=========
Schedule Page: 219 Line No.: 17 Column: cRecord analog meters retired to reg asset $ (303,502)Transfers & miscellaneous adjustments to reserve account $ 1,890 -----------TOTAL $ (301,612) ===========
Name of Respondent
Westar Energy, Inc.
This Report is:(1) X An Original(2) A Resubmission
Date of Report(Mo, Da, Yr)
/ /
Year/Period of Report
2016/Q4
FOOTNOTE DATA
FERC FORM NO. 1 (ED. 12-87) Page 450.1
20170505-8016 FERC PDF (Unofficial) 04/07/2017
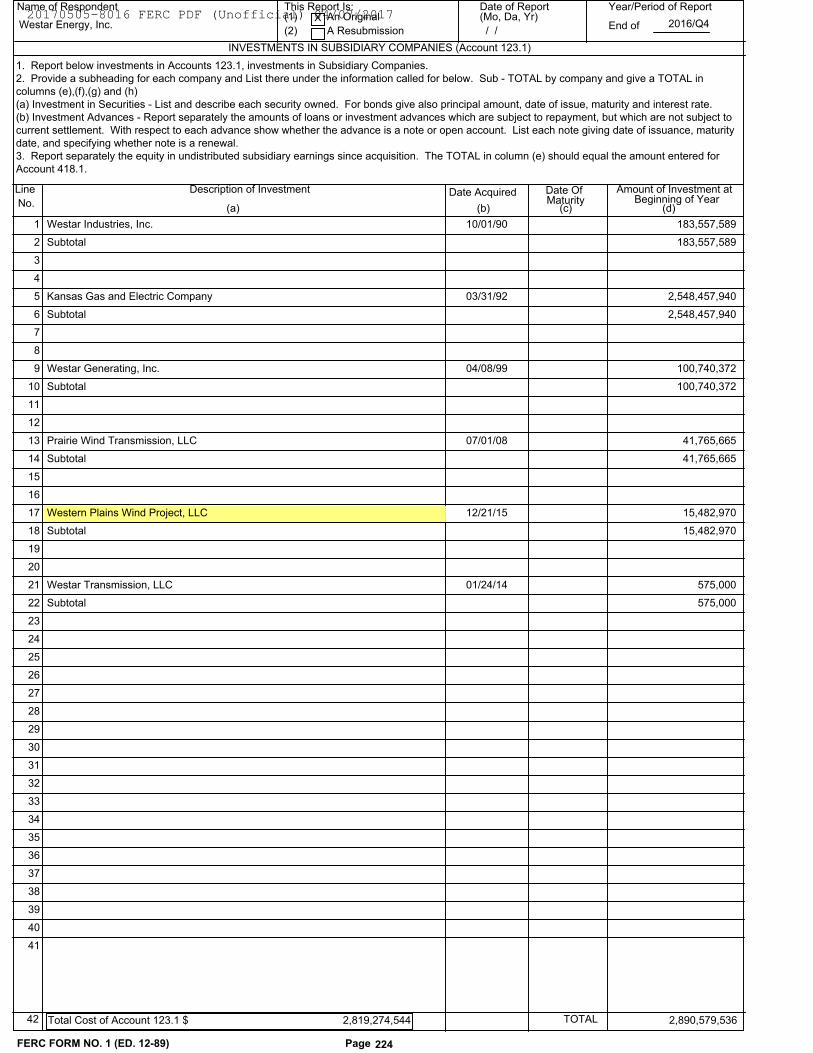
Name of Respondent This Report Is:(1) An Original
(2) A Resubmission
Date of Report(Mo, Da, Yr)
Year/Period of Report
End of
INVESTMENTS IN SUBSIDIARY COMPANIES (Account 123.1)
Westar Energy, Inc.X
/ /2016/Q4
Line
No.
Description of Investment Date Acquired
(c)(b)(a)
Amount of Investment atBeginning of Year
Date Of Maturity
(d)
1. Report below investments in Accounts 123.1, investments in Subsidiary Companies.2. Provide a subheading for each company and List there under the information called for below. Sub - TOTAL by company and give a TOTAL incolumns (e),(f),(g) and (h)(a) Investment in Securities - List and describe each security owned. For bonds give also principal amount, date of issue, maturity and interest rate.(b) Investment Advances - Report separately the amounts of loans or investment advances which are subject to repayment, but which are not subject tocurrent settlement. With respect to each advance show whether the advance is a note or open account. List each note giving date of issuance, maturitydate, and specifying whether note is a renewal.3. Report separately the equity in undistributed subsidiary earnings since acquisition. The TOTAL in column (e) should equal the amount entered forAccount 418.1.
183,557,58910/01/90Westar Industries, Inc. 1
183,557,589Subtotal 2
3
4
2,548,457,94003/31/92Kansas Gas and Electric Company 5
2,548,457,940Subtotal 6
7
8
100,740,37204/08/99Westar Generating, Inc. 9
100,740,372Subtotal 10
11
12
41,765,66507/01/08Prairie Wind Transmission, LLC 13
41,765,665Subtotal 14
15
16
15,482,97012/21/15Western Plains Wind Project, LLC 17
15,482,970Subtotal 18
19
20
575,00001/24/14Westar Transmission, LLC 21
575,000Subtotal 22
23
24
25
26
27
28
29
30
31
32
33
34
35
36
37
38
39
40
41
FERC FORM NO. 1 (ED. 12-89) Page 224
42 Total Cost of Account 123.1 $ TOTAL 2,890,579,536 2,819,274,544
20170505-8016 FERC PDF (Unofficial) 04/07/2017
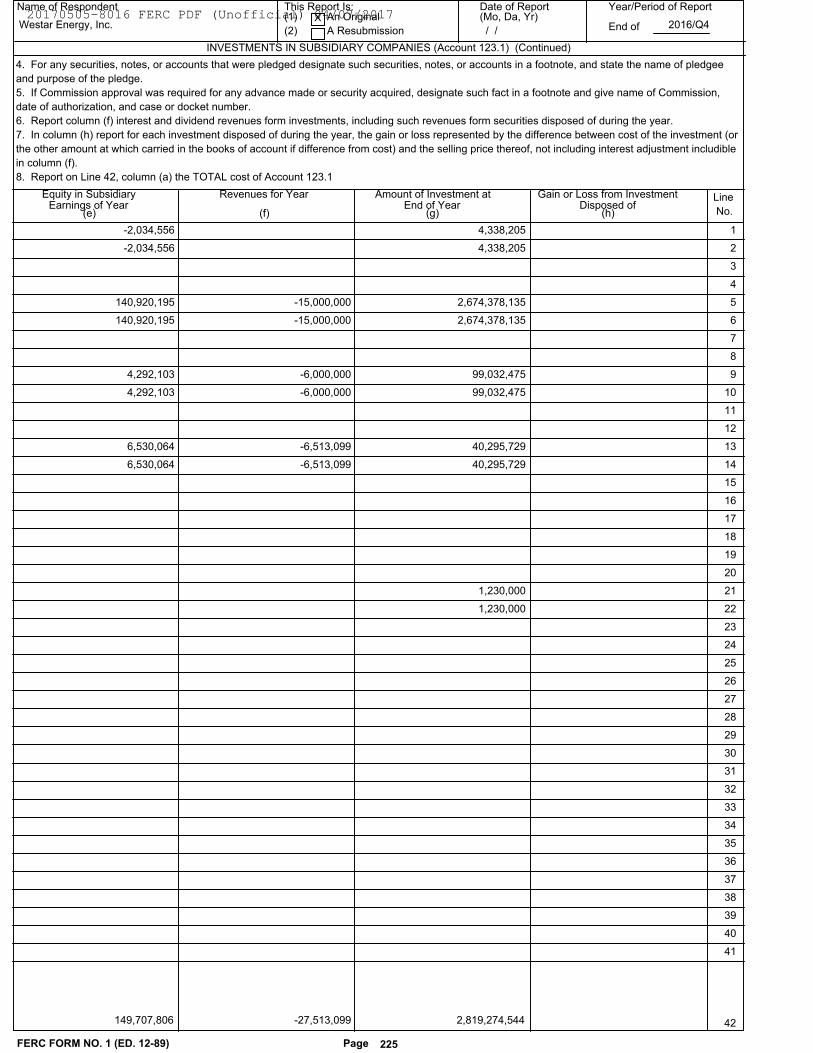
Name of Respondent This Report Is:(1) An Original
(2) A Resubmission
Date of Report(Mo, Da, Yr)
Year/Period of Report
End of
INVESTMENTS IN SUBSIDIARY COMPANIES (Account 123.1) (Continued)
Westar Energy, Inc.X
/ /2016/Q4
Line
No.
Equity in Subsidiary Earnings of Year
Revenues for Year Amount of Investment atEnd of Year
Gain or Loss from InvestmentDisposed of
(e) (f) (g) (h)
4. For any securities, notes, or accounts that were pledged designate such securities, notes, or accounts in a footnote, and state the name of pledgee
and purpose of the pledge.
5. If Commission approval was required for any advance made or security acquired, designate such fact in a footnote and give name of Commission,
date of authorization, and case or docket number.
6. Report column (f) interest and dividend revenues form investments, including such revenues form securities disposed of during the year.
7. In column (h) report for each investment disposed of during the year, the gain or loss represented by the difference between cost of the investment (or
the other amount at which carried in the books of account if difference from cost) and the selling price thereof, not including interest adjustment includible
in column (f).
8. Report on Line 42, column (a) the TOTAL cost of Account 123.1
4,338,205 -2,034,556 1
4,338,205 -2,034,556 2
3
4
2,674,378,135 -15,000,000 140,920,195 5
2,674,378,135 -15,000,000 140,920,195 6
7
8
99,032,475 -6,000,000 4,292,103 9
99,032,475 -6,000,000 4,292,103 10
11
12
40,295,729 -6,513,099 6,530,064 13
40,295,729 -6,513,099 6,530,064 14
15
16
17
18
19
20
1,230,000 21
1,230,000 22
23
24
25
26
27
28
29
30
31
32
33
34
35
36
37
38
39
40
41
FERC FORM NO. 1 (ED. 12-89) Page 225
42 149,707,806 -27,513,099 2,819,274,544
20170505-8016 FERC PDF (Unofficial) 04/07/2017

Schedule Page: 224 Line No.: 17 Column: aWe dissolved this subsidiary in January 2016 and our investment was rolled into property,
plant and equipment for the Western Plains Wind Farm.
Name of Respondent
Westar Energy, Inc.
This Report is:(1) X An Original(2) A Resubmission
Date of Report(Mo, Da, Yr)
/ /
Year/Period of Report
2016/Q4
FOOTNOTE DATA
FERC FORM NO. 1 (ED. 12-87) Page 450.1
20170505-8016 FERC PDF (Unofficial) 04/07/2017
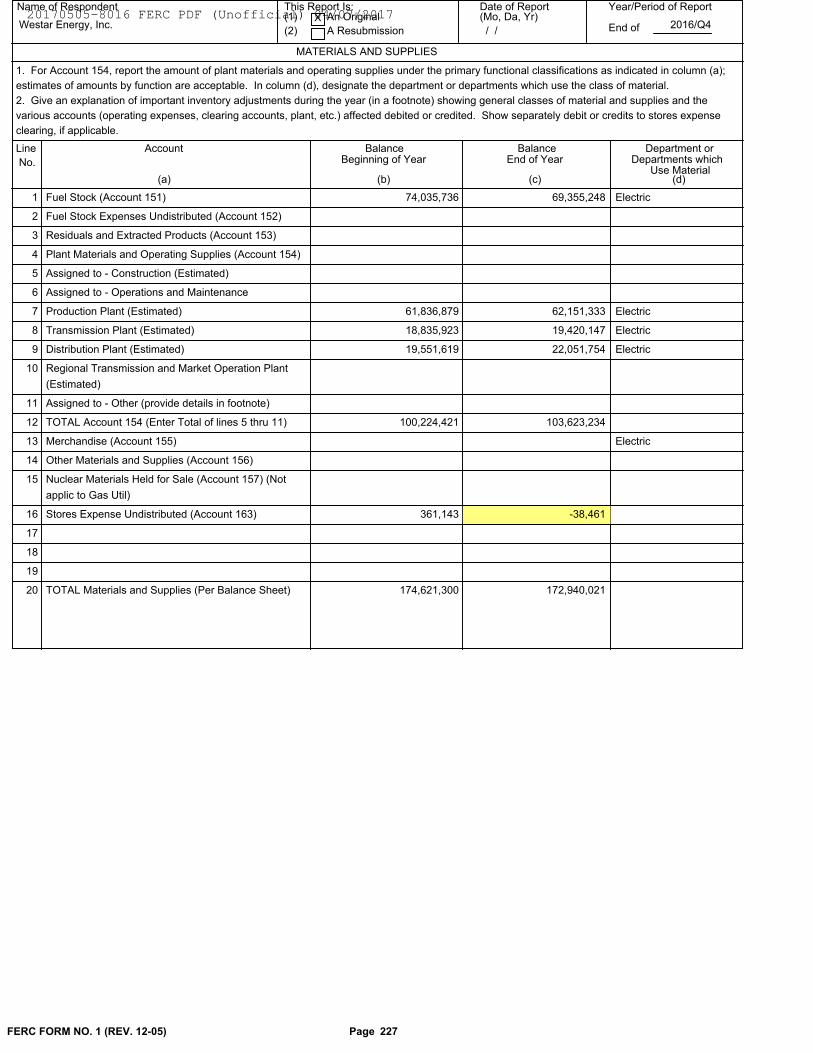
Name of Respondent This Report Is:(1) An Original
(2) A Resubmission
Date of Report(Mo, Da, Yr)
Year/Period of Report
End of
MATERIALS AND SUPPLIES
Westar Energy, Inc.X
/ /2016/Q4
Line
No.
Account Balance Balance
(c)(b)(a)
Department orDepartments which
(d)
Beginning of Year End of YearUse Material
1. For Account 154, report the amount of plant materials and operating supplies under the primary functional classifications as indicated in column (a);
estimates of amounts by function are acceptable. In column (d), designate the department or departments which use the class of material.
2. Give an explanation of important inventory adjustments during the year (in a footnote) showing general classes of material and supplies and the
various accounts (operating expenses, clearing accounts, plant, etc.) affected debited or credited. Show separately debit or credits to stores expense
clearing, if applicable.
74,035,736 Electric 69,355,248 1 Fuel Stock (Account 151)
2 Fuel Stock Expenses Undistributed (Account 152)
3 Residuals and Extracted Products (Account 153)
4 Plant Materials and Operating Supplies (Account 154)
5 Assigned to - Construction (Estimated)
6 Assigned to - Operations and Maintenance
61,836,879 Electric 62,151,333 7 Production Plant (Estimated)
18,835,923 Electric 19,420,147 8 Transmission Plant (Estimated)
19,551,619 Electric 22,051,754 9 Distribution Plant (Estimated)
10 Regional Transmission and Market Operation Plant
(Estimated)
11 Assigned to - Other (provide details in footnote)
100,224,421 103,623,234 12 TOTAL Account 154 (Enter Total of lines 5 thru 11)
Electric 13 Merchandise (Account 155)
14 Other Materials and Supplies (Account 156)
15 Nuclear Materials Held for Sale (Account 157) (Not
applic to Gas Util)
361,143 -38,461 16 Stores Expense Undistributed (Account 163)
17
18
19
174,621,300 172,940,021 20 TOTAL Materials and Supplies (Per Balance Sheet)
Page 227FERC FORM NO. 1 (REV. 12-05)
20170505-8016 FERC PDF (Unofficial) 04/07/2017

Schedule Page: 227 Line No.: 16 Column: cStores expense undistributed has a negative balance due to amounts allocated in excess of
charges.
Name of Respondent
Westar Energy, Inc.
This Report is:(1) X An Original(2) A Resubmission
Date of Report(Mo, Da, Yr)
/ /
Year/Period of Report
2016/Q4
FOOTNOTE DATA
FERC FORM NO. 1 (ED. 12-87) Page 450.1
20170505-8016 FERC PDF (Unofficial) 04/07/2017
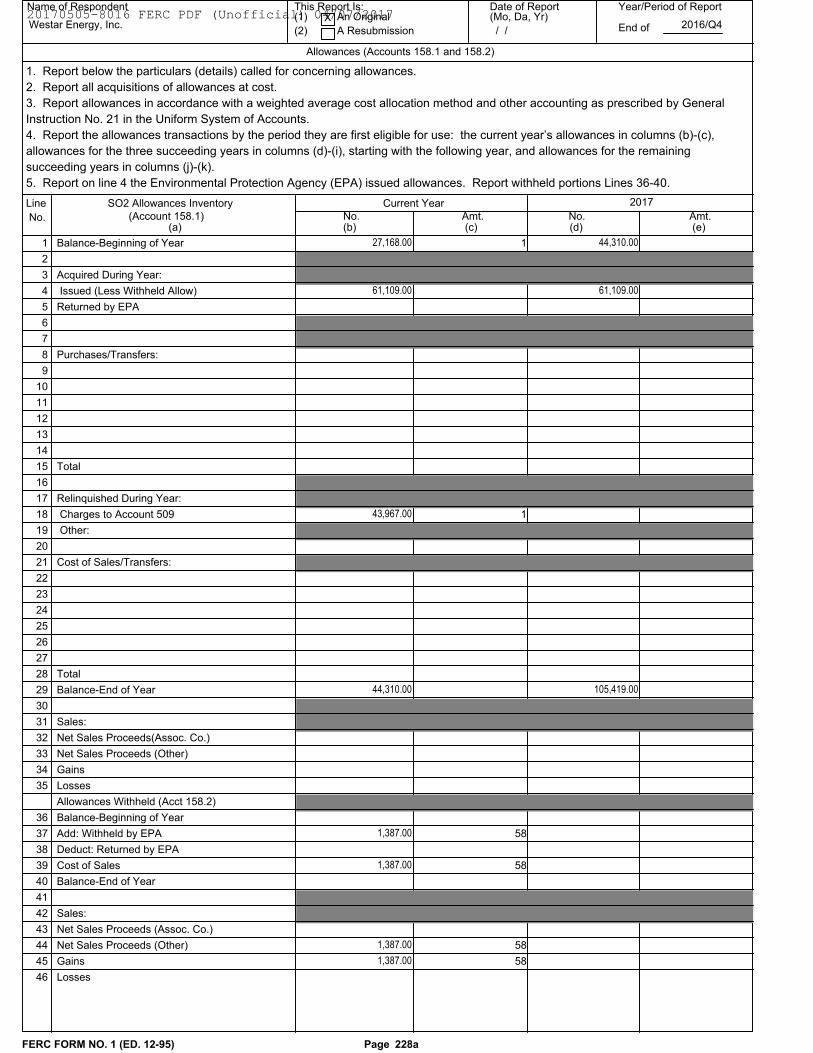
Name of Respondent This Report Is:(1) An Original
(2) A Resubmission
Date of Report(Mo, Da, Yr)
Year/Period of Report
End of
Allowances (Accounts 158.1 and 158.2)
Westar Energy, Inc.X
/ /2016/Q4
Line
No.
SO2 Allowances Inventory Current Year
(b)(a)(Account 158.1) No. Amt.
(c)No.(d)
Amt.(e)
1. Report below the particulars (details) called for concerning allowances.
2. Report all acquisitions of allowances at cost.
3. Report allowances in accordance with a weighted average cost allocation method and other accounting as prescribed by General
Instruction No. 21 in the Uniform System of Accounts.
4. Report the allowances transactions by the period they are first eligible for use: the current year’s allowances in columns (b)-(c),
allowances for the three succeeding years in columns (d)-(i), starting with the following year, and allowances for the remaining
succeeding years in columns (j)-(k).
5. Report on line 4 the Environmental Protection Agency (EPA) issued allowances. Report withheld portions Lines 36-40.
2017
27,168.00 1 44,310.00Balance-Beginning of Year 1
2
Acquired During Year: 3
61,109.00 61,109.00 Issued (Less Withheld Allow) 4
Returned by EPA 5
6
7
Purchases/Transfers: 8
9
10
11
12
13
14
Total 15
16
Relinquished During Year: 17
43,967.00 1 Charges to Account 509 18
Other: 19
20
Cost of Sales/Transfers: 21
22
23
24
25
26
27
Total 28
44,310.00 105,419.00Balance-End of Year 29
30
Sales: 31
Net Sales Proceeds(Assoc. Co.) 32
Net Sales Proceeds (Other) 33
Gains 34
Losses 35
Allowances Withheld (Acct 158.2)
Balance-Beginning of Year 36
1,387.00 58Add: Withheld by EPA 37
Deduct: Returned by EPA 38
1,387.00 58Cost of Sales 39
Balance-End of Year 40
41
Sales: 42
Net Sales Proceeds (Assoc. Co.) 43
1,387.00 58Net Sales Proceeds (Other) 44
1,387.00 58Gains 45
Losses 46
FERC FORM NO. 1 (ED. 12-95) Page 228a
20170505-8016 FERC PDF (Unofficial) 04/07/2017
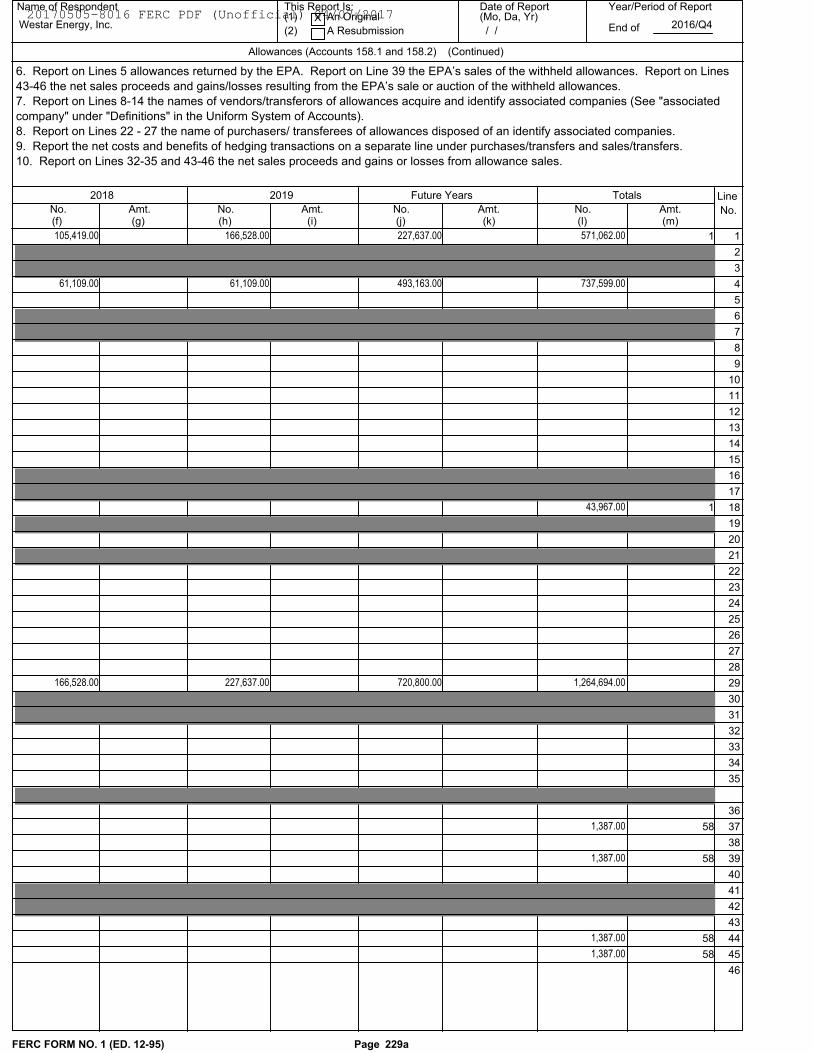
Name of Respondent This Report Is:(1) An Original
(2) A Resubmission
Date of Report(Mo, Da, Yr)
Year/Period of Report
End of
Allowances (Accounts 158.1 and 158.2)
Westar Energy, Inc.X
/ /2016/Q4
Line
No.(f) (j)No. Amt.
(g)No.(h)
Amt.(i)
No. Amt. No. Amt.(k) (l) (m)
Future Years Totals
(Continued)
6. Report on Lines 5 allowances returned by the EPA. Report on Line 39 the EPA’s sales of the withheld allowances. Report on Lines
43-46 the net sales proceeds and gains/losses resulting from the EPA’s sale or auction of the withheld allowances.
7. Report on Lines 8-14 the names of vendors/transferors of allowances acquire and identify associated companies (See "associated
company" under "Definitions" in the Uniform System of Accounts).
8. Report on Lines 22 - 27 the name of purchasers/ transferees of allowances disposed of an identify associated companies.
9. Report the net costs and benefits of hedging transactions on a separate line under purchases/transfers and sales/transfers.
10. Report on Lines 32-35 and 43-46 the net sales proceeds and gains or losses from allowance sales.
2018 2019
1 1 227,637.00 166,528.00 105,419.00 571,062.00
2
3
4 493,163.00 61,109.00 61,109.00 737,599.00
5
6
7
8
9
10
11
12
13
14
15
16
17
1 18 43,967.00
19
20
21
22
23
24
25
26
27
28
29 720,800.00 227,637.00 166,528.00 1,264,694.00
30
31
32
33
34
35
36
58 37 1,387.00
38
58 39 1,387.00
40
41
42
43
58 44 1,387.00
58 45 1,387.00
46
FERC FORM NO. 1 (ED. 12-95) Page 229a
20170505-8016 FERC PDF (Unofficial) 04/07/2017

Name of Respondent This Report Is:(1) An Original
(2) A Resubmission
Date of Report(Mo, Da, Yr)
Year/Period of Report
End of
Allowances (Accounts 158.1 and 158.2)
Westar Energy, Inc.X
/ /2016/Q4
Line
No.
NOx Allowances Inventory Current Year
(b)(a)(Account 158.1) No. Amt.
(c)No.(d)
Amt.(e)
1. Report below the particulars (details) called for concerning allowances.
2. Report all acquisitions of allowances at cost.
3. Report allowances in accordance with a weighted average cost allocation method and other accounting as prescribed by General
Instruction No. 21 in the Uniform System of Accounts.
4. Report the allowances transactions by the period they are first eligible for use: the current year’s allowances in columns (b)-(c),
allowances for the three succeeding years in columns (d)-(i), starting with the following year, and allowances for the remaining
succeeding years in columns (j)-(k).
5. Report on line 4 the Environmental Protection Agency (EPA) issued allowances. Report withheld portions Lines 36-40.
2017
7,415.00 10,710.00Balance-Beginning of Year 1
2
Acquired During Year: 3
12,131.00 12,131.00 Issued (Less Withheld Allow) 4
Returned by EPA 5
6
7
Purchases/Transfers: 8
9
10
11
12
13
14
Total 15
16
Relinquished During Year: 17
8,836.00 Charges to Account 509 18
Other: 19
20
Cost of Sales/Transfers: 21
22
23
24
25
26
27
Total 28
10,710.00 22,841.00Balance-End of Year 29
30
Sales: 31
Net Sales Proceeds(Assoc. Co.) 32
Net Sales Proceeds (Other) 33
Gains 34
Losses 35
Allowances Withheld (Acct 158.2)
Balance-Beginning of Year 36
Add: Withheld by EPA 37
Deduct: Returned by EPA 38
Cost of Sales 39
Balance-End of Year 40
41
Sales: 42
Net Sales Proceeds (Assoc. Co.) 43
Net Sales Proceeds (Other) 44
Gains 45
Losses 46
FERC FORM NO. 1 (ED. 12-95) Page 228b
20170505-8016 FERC PDF (Unofficial) 04/07/2017
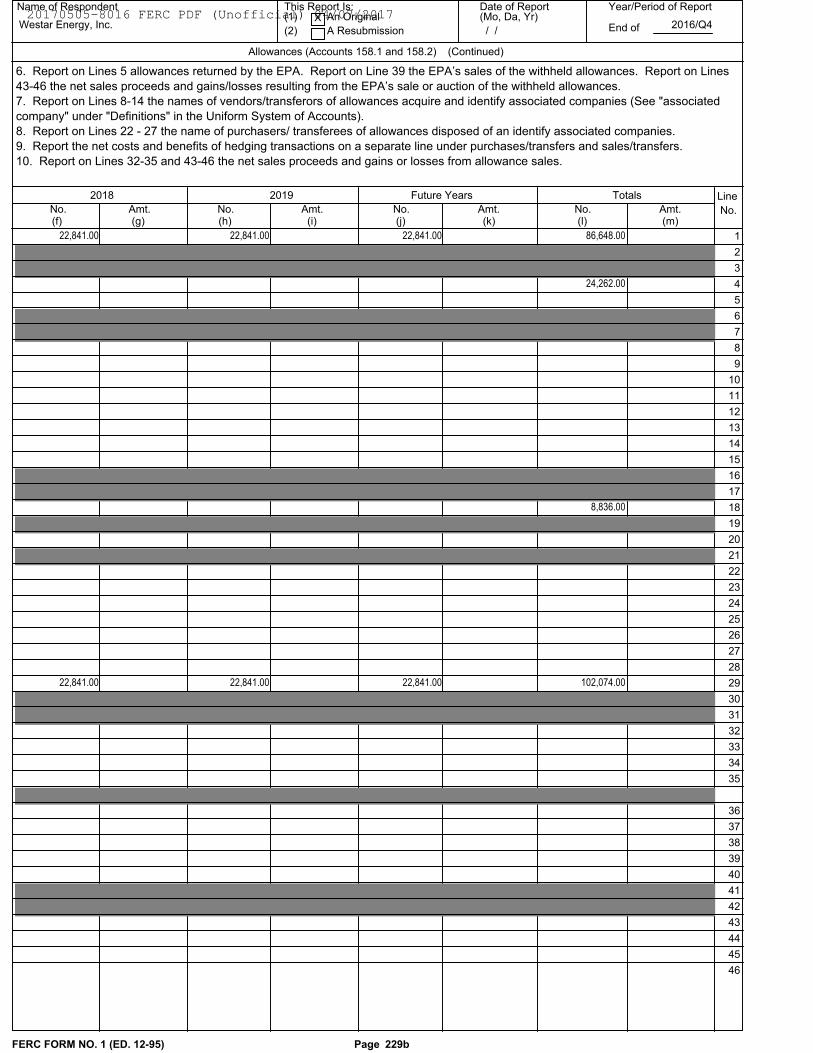
Name of Respondent This Report Is:(1) An Original
(2) A Resubmission
Date of Report(Mo, Da, Yr)
Year/Period of Report
End of
Allowances (Accounts 158.1 and 158.2)
Westar Energy, Inc.X
/ /2016/Q4
Line
No.(f) (j)No. Amt.
(g)No.(h)
Amt.(i)
No. Amt. No. Amt.(k) (l) (m)
Future Years Totals
(Continued)
6. Report on Lines 5 allowances returned by the EPA. Report on Line 39 the EPA’s sales of the withheld allowances. Report on Lines
43-46 the net sales proceeds and gains/losses resulting from the EPA’s sale or auction of the withheld allowances.
7. Report on Lines 8-14 the names of vendors/transferors of allowances acquire and identify associated companies (See "associated
company" under "Definitions" in the Uniform System of Accounts).
8. Report on Lines 22 - 27 the name of purchasers/ transferees of allowances disposed of an identify associated companies.
9. Report the net costs and benefits of hedging transactions on a separate line under purchases/transfers and sales/transfers.
10. Report on Lines 32-35 and 43-46 the net sales proceeds and gains or losses from allowance sales.
2018 2019
1 22,841.00 22,841.00 22,841.00 86,648.00
2
3
4 24,262.00
5
6
7
8
9
10
11
12
13
14
15
16
17
18 8,836.00
19
20
21
22
23
24
25
26
27
28
29 22,841.00 22,841.00 22,841.00 102,074.00
30
31
32
33
34
35
36
37
38
39
40
41
42
43
44
45
46
FERC FORM NO. 1 (ED. 12-95) Page 229b
20170505-8016 FERC PDF (Unofficial) 04/07/2017
Name of Respondent This Report Is:(1) An Original
(2) A Resubmission
Date of Report(Mo, Da, Yr)
Year/Period of Report
End of
EXTRAORDINARY PROPERTY LOSSES (Account 182.1)
Westar Energy, Inc.X
/ /2016/Q4
Line
No.
(c)(b)(a) (d)
Description of Extraordinary Loss[Include in the description the date of
Commission Authorization to use Acc 182.1and period of amortization (mo, yr to mo, yr).]
Total Amount of Loss
LossesRecognisedDuring Year
WRITTEN OFF DURING YEAR
AccountCharged Amount
Balance at
End of Year
(f)(e)
1
2
3
4
5
6
7
8
9
10
11
12
13
14
15
16
17
18
19
FERC FORM NO. 1 (ED. 12-88) Page 230a
20 TOTAL
20170505-8016 FERC PDF (Unofficial) 04/07/2017
Name of Respondent This Report Is:(1) An Original
(2) A Resubmission
Date of Report(Mo, Da, Yr)
Year/Period of Report
End of
UNRECOVERED PLANT AND REGULATORY STUDY COSTS (182.2)
Westar Energy, Inc.X
/ /2016/Q4
Line
No.
(c)(b)(a) (d)
Description of Unrecovered Plant Total Amount
of Charges
CostsRecognisedDuring Year
WRITTEN OFF DURING YEAR
AccountCharged Amount
Balance at
End of Year
(f)(e)
and Regulatory Study Costs [Includein the description of costs, the date of
Commission Authorization to use Acc 182.2and period of amortization (mo, yr to mo, yr)]
21
22
23
24
25
26
27
28
29
30
31
32
33
34
35
36
37
38
39
40
41
42
43
44
45
46
47
48
FERC FORM NO. 1 (ED. 12-88) Page 230b
49 TOTAL
20170505-8016 FERC PDF (Unofficial) 04/07/2017
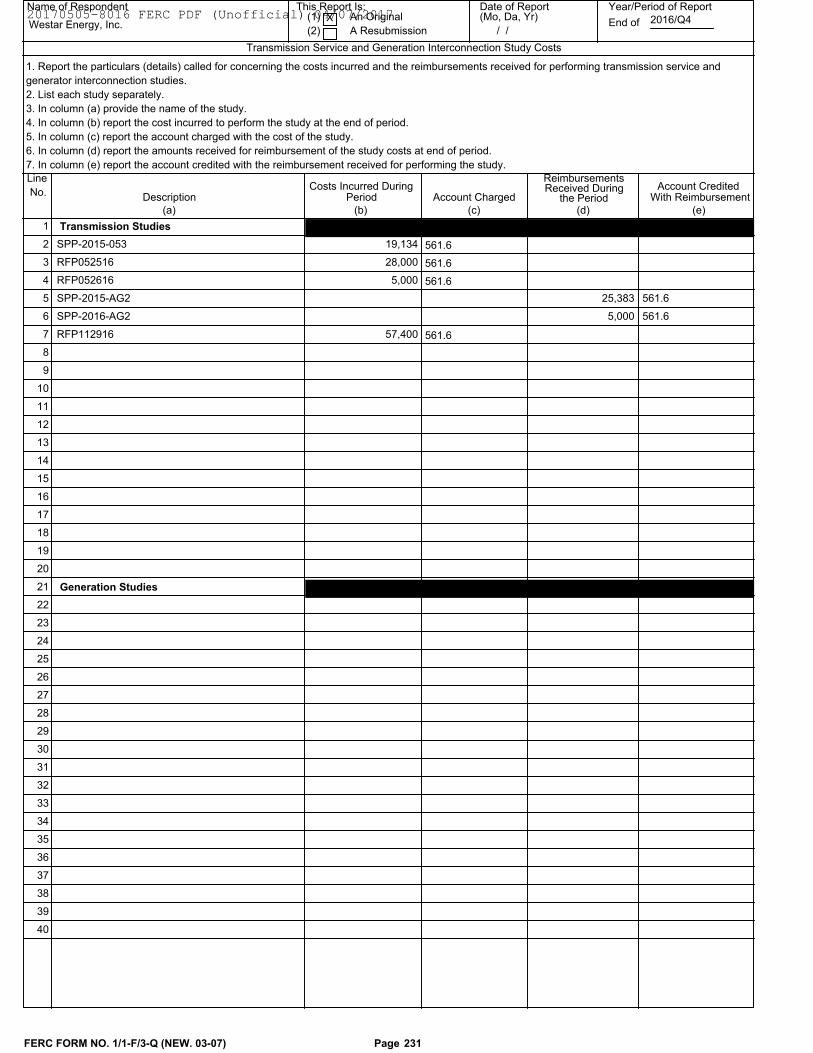
Name of Respondent This Report Is:(1) An Original
(2) A Resubmission
Date of Report(Mo, Da, Yr)
Year/Period of Report
End of
Transmission Service and Generation Interconnection Study Costs
Westar Energy, Inc.X
/ /2016/Q4
Line
No. DescriptionCosts Incurred During
(b)(a)
Period Account Charged
(c)
ReimbursementsReceived During
(d)
Account CreditedWith Reimbursement
(e)
1. Report the particulars (details) called for concerning the costs incurred and the reimbursements received for performing transmission service and
generator interconnection studies.
2. List each study separately.
3. In column (a) provide the name of the study.
4. In column (b) report the cost incurred to perform the study at the end of period.
5. In column (c) report the account charged with the cost of the study.
6. In column (d) report the amounts received for reimbursement of the study costs at end of period.
7. In column (e) report the account credited with the reimbursement received for performing the study.
the Period
Transmission Studies 1
19,134SPP-2015-053 561.6 2
28,000RFP052516 561.6 3
5,000RFP052616 561.6 4
SPP-2015-AG2 25,383 561.6 5
SPP-2016-AG2 5,000 561.6 6
57,400RFP112916 561.6 7
8
9
10
11
12
13
14
15
16
17
18
19
20
Generation Studies 21
22
23
24
25
26
27
28
29
30
31
32
33
34
35
36
37
38
39
40
FERC FORM NO. 1/1-F/3-Q (NEW. 03-07) Page 231
20170505-8016 FERC PDF (Unofficial) 04/07/2017
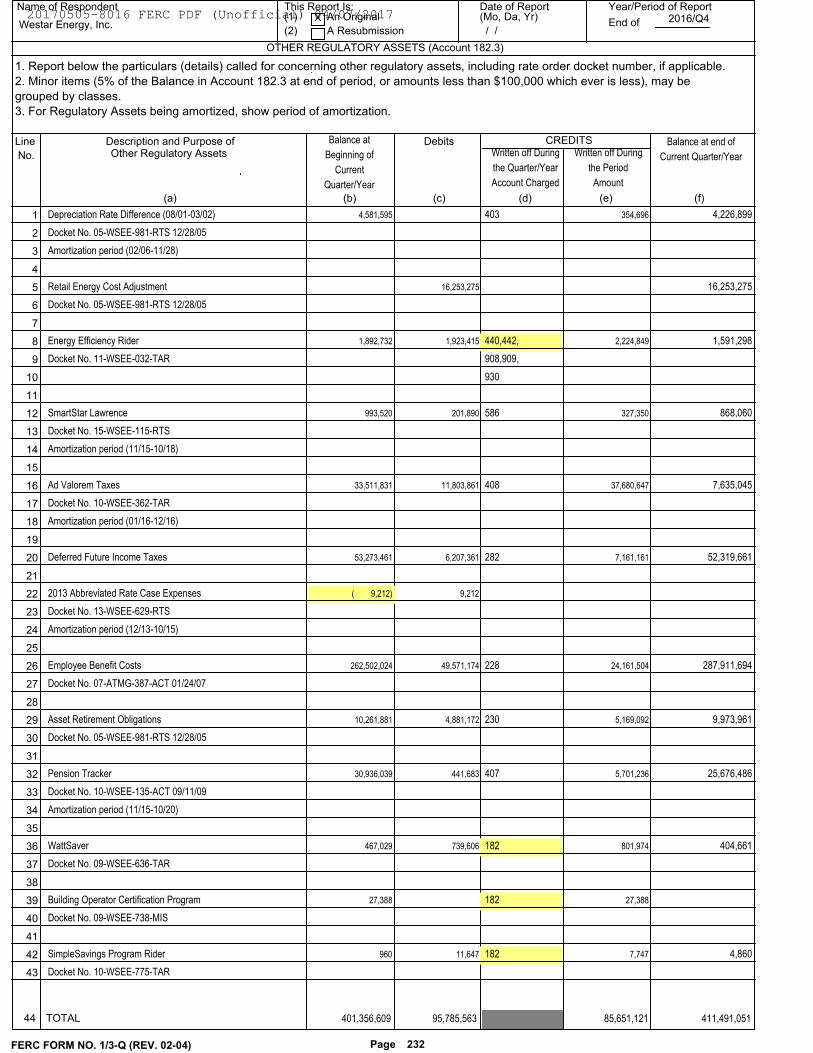
Name of Respondent This Report Is:(1) An Original
(2) A Resubmission
Date of Report(Mo, Da, Yr)
Year/Period of Report
End of
OTHER REGULATORY ASSETS (Account 182.3)
Westar Energy, Inc.X
/ /2016/Q4
Line
No.
Description and Purpose of Debits CREDITSWritten off During
the Quarter/Year
Account Charged
(d)(c)(a)
Balance at end of
Current Quarter/Year
(e)
Other Regulatory Assets Written off During
the Period
Amount
(f)
1. Report below the particulars (details) called for concerning other regulatory assets, including rate order docket number, if applicable.
2. Minor items (5% of the Balance in Account 182.3 at end of period, or amounts less than $100,000 which ever is less), may be
grouped by classes.
3. For Regulatory Assets being amortized, show period of amortization.
Balance at
Beginning of
Current
Quarter/Year
(b)
4,581,595 4,226,899354,696403Depreciation Rate Difference (08/01-03/02) 1
Docket No. 05-WSEE-981-RTS 12/28/05 2
Amortization period (02/06-11/28) 3
4
16,253,27516,253,275Retail Energy Cost Adjustment 5
Docket No. 05-WSEE-981-RTS 12/28/05 6
7
1,892,732 1,591,2982,224,849440,442,1,923,415Energy Efficiency Rider 8
908,909,Docket No. 11-WSEE-032-TAR 9
930 10
11
993,520 868,060327,350586201,890SmartStar Lawrence 12
Docket No. 15-WSEE-115-RTS 13
Amortization period (11/15-10/18) 14
15
33,511,831 7,635,04537,680,64740811,803,861Ad Valorem Taxes 16
Docket No. 10-WSEE-362-TAR 17
Amortization period (01/16-12/16) 18
19
53,273,461 52,319,6617,161,1612826,207,361Deferred Future Income Taxes 20
21
( 9,212) 9,2122013 Abbreviated Rate Case Expenses 22
Docket No. 13-WSEE-629-RTS 23
Amortization period (12/13-10/15) 24
25
262,502,024 287,911,69424,161,50422849,571,174Employee Benefit Costs 26
Docket No. 07-ATMG-387-ACT 01/24/07 27
28
10,261,881 9,973,9615,169,0922304,881,172Asset Retirement Obligations 29
Docket No. 05-WSEE-981-RTS 12/28/05 30
31
30,936,039 25,676,4865,701,236407441,683Pension Tracker 32
Docket No. 10-WSEE-135-ACT 09/11/09 33
Amortization period (11/15-10/20) 34
35
467,029 404,661801,974182739,606WattSaver 36
Docket No. 09-WSEE-636-TAR 37
38
27,388 27,388182Building Operator Certification Program 39
Docket No. 09-WSEE-738-MIS 40
41
960 4,8607,74718211,647SimpleSavings Program Rider 42
Docket No. 10-WSEE-775-TAR 43
FERC FORM NO. 1/3-Q (REV. 02-04) Page 232
44 TOTAL 401,356,609 85,651,121 411,491,051 95,785,563
20170505-8016 FERC PDF (Unofficial) 04/07/2017
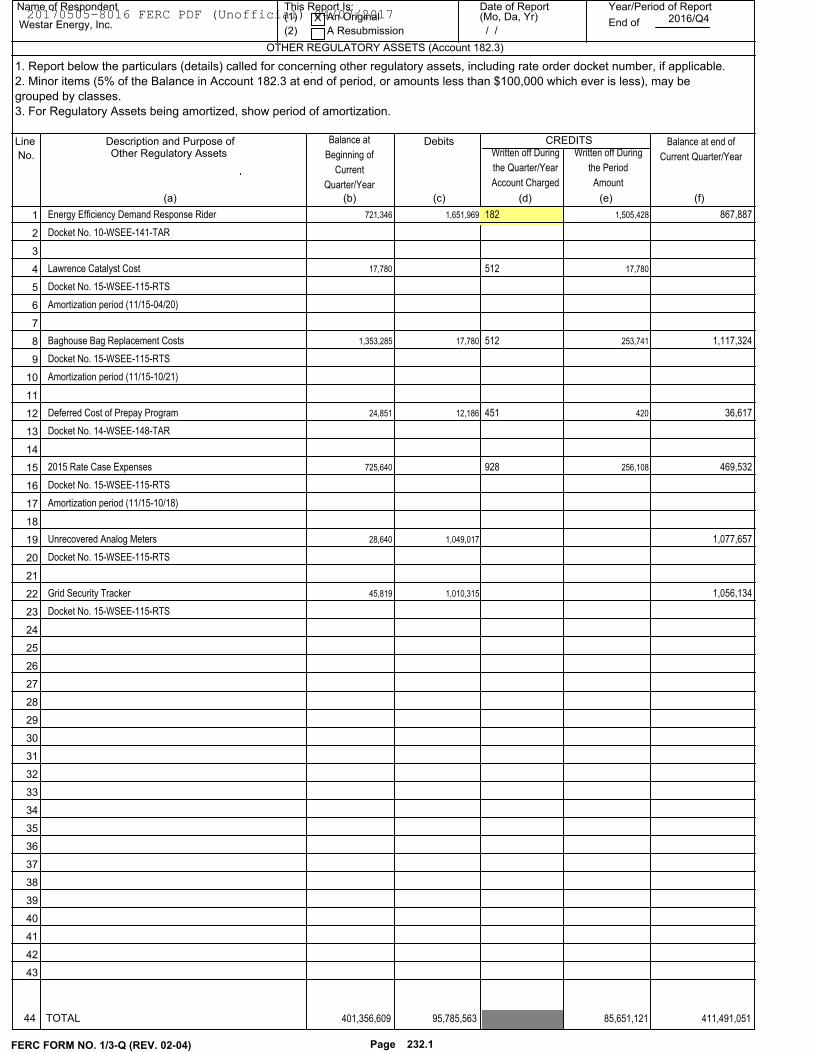
Name of Respondent This Report Is:(1) An Original
(2) A Resubmission
Date of Report(Mo, Da, Yr)
Year/Period of Report
End of
OTHER REGULATORY ASSETS (Account 182.3)
Westar Energy, Inc.X
/ /2016/Q4
Line
No.
Description and Purpose of Debits CREDITSWritten off During
the Quarter/Year
Account Charged
(d)(c)(a)
Balance at end of
Current Quarter/Year
(e)
Other Regulatory Assets Written off During
the Period
Amount
(f)
1. Report below the particulars (details) called for concerning other regulatory assets, including rate order docket number, if applicable.
2. Minor items (5% of the Balance in Account 182.3 at end of period, or amounts less than $100,000 which ever is less), may be
grouped by classes.
3. For Regulatory Assets being amortized, show period of amortization.
Balance at
Beginning of
Current
Quarter/Year
(b)
721,346 867,8871,505,4281821,651,969Energy Efficiency Demand Response Rider 1
Docket No. 10-WSEE-141-TAR 2
3
17,780 17,780512Lawrence Catalyst Cost 4
Docket No. 15-WSEE-115-RTS 5
Amortization period (11/15-04/20) 6
7
1,353,285 1,117,324253,74151217,780Baghouse Bag Replacement Costs 8
Docket No. 15-WSEE-115-RTS 9
Amortization period (11/15-10/21) 10
11
24,851 36,61742045112,186Deferred Cost of Prepay Program 12
Docket No. 14-WSEE-148-TAR 13
14
725,640 469,532256,1089282015 Rate Case Expenses 15
Docket No. 15-WSEE-115-RTS 16
Amortization period (11/15-10/18) 17
18
28,640 1,077,6571,049,017Unrecovered Analog Meters 19
Docket No. 15-WSEE-115-RTS 20
21
45,819 1,056,1341,010,315Grid Security Tracker 22
Docket No. 15-WSEE-115-RTS 23
24
25
26
27
28
29
30
31
32
33
34
35
36
37
38
39
40
41
42
43
FERC FORM NO. 1/3-Q (REV. 02-04) Page 232.1
44 TOTAL 401,356,609 85,651,121 411,491,051 95,785,563
20170505-8016 FERC PDF (Unofficial) 04/07/2017
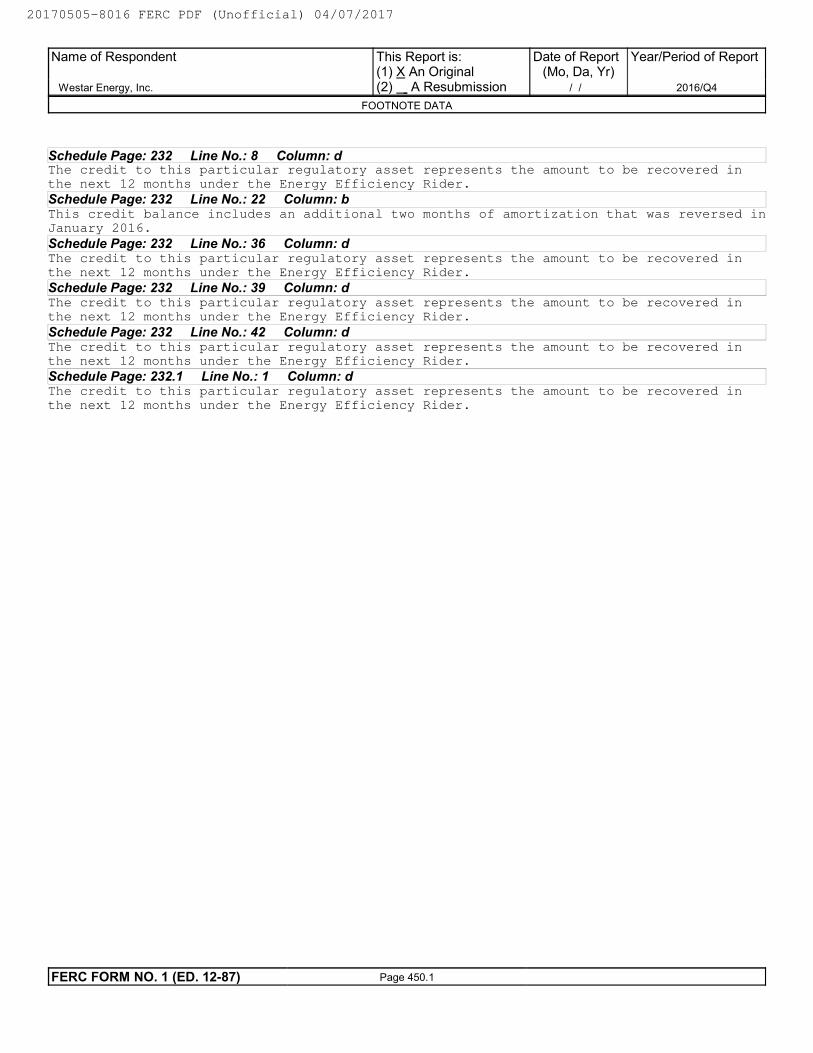
Schedule Page: 232 Line No.: 8 Column: dThe credit to this particular regulatory asset represents the amount to be recovered in
the next 12 months under the Energy Efficiency Rider.
Schedule Page: 232 Line No.: 22 Column: bThis credit balance includes an additional two months of amortization that was reversed in
January 2016.
Schedule Page: 232 Line No.: 36 Column: dThe credit to this particular regulatory asset represents the amount to be recovered in
the next 12 months under the Energy Efficiency Rider.
Schedule Page: 232 Line No.: 39 Column: dThe credit to this particular regulatory asset represents the amount to be recovered in
the next 12 months under the Energy Efficiency Rider.
Schedule Page: 232 Line No.: 42 Column: dThe credit to this particular regulatory asset represents the amount to be recovered in
the next 12 months under the Energy Efficiency Rider.
Schedule Page: 232.1 Line No.: 1 Column: dThe credit to this particular regulatory asset represents the amount to be recovered in
the next 12 months under the Energy Efficiency Rider.
Name of Respondent
Westar Energy, Inc.
This Report is:(1) X An Original(2) A Resubmission
Date of Report(Mo, Da, Yr)
/ /
Year/Period of Report
2016/Q4
FOOTNOTE DATA
FERC FORM NO. 1 (ED. 12-87) Page 450.1
20170505-8016 FERC PDF (Unofficial) 04/07/2017
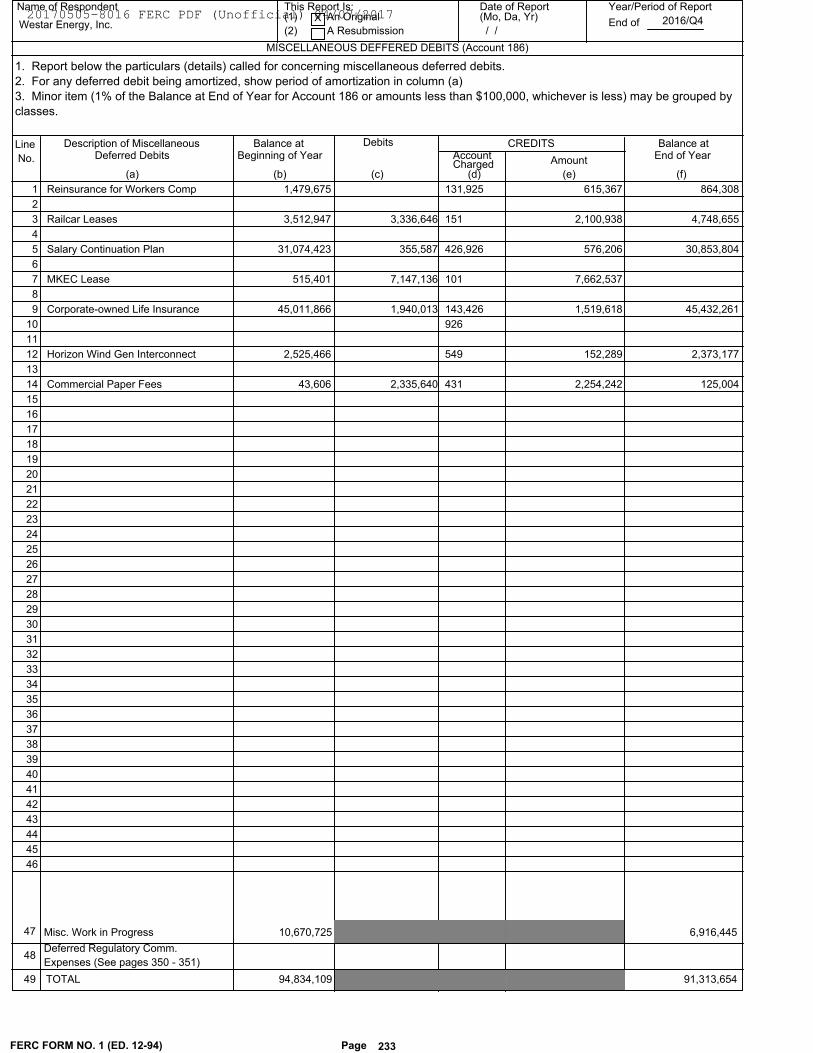
Name of Respondent This Report Is:(1) An Original
(2) A Resubmission
Date of Report(Mo, Da, Yr)
Year/Period of Report
End of
MISCELLANEOUS DEFFERED DEBITS (Account 186)
Westar Energy, Inc.X
/ /2016/Q4
Line
No.
Description of Miscellaneous Debits CREDITSAccount
(c)(b)(a)
Balance atEnd of Year
(d)
Deferred Debits Amount
(e)
Balance at Beginning of Year
(f)Charged
1. Report below the particulars (details) called for concerning miscellaneous deferred debits.
2. For any deferred debit being amortized, show period of amortization in column (a)
3. Minor item (1% of the Balance at End of Year for Account 186 or amounts less than $100,000, whichever is less) may be grouped by
classes.
1,479,675 864,308 615,367131,925Reinsurance for Workers Comp 1
2
3,512,947 4,748,655 2,100,938 3,336,646 151Railcar Leases 3
4
31,074,423 30,853,804 576,206 355,587 426,926Salary Continuation Plan 5
6
515,401 7,662,537 7,147,136 101MKEC Lease 7
8
45,011,866 45,432,261 1,519,618 1,940,013 143,426Corporate-owned Life Insurance 9
926 10
11
2,525,466 2,373,177 152,289549Horizon Wind Gen Interconnect 12
13
43,606 125,004 2,254,242 2,335,640 431Commercial Paper Fees 14
15
16
17
18
19
20
21
22
23
24
25
26
27
28
29
30
31
32
33
34
35
36
37
38
39
40
41
42
43
44
45
46
10,670,725 6,916,445
FERC FORM NO. 1 (ED. 12-94) Page 233
49 TOTAL
47 Misc. Work in Progress
48Deferred Regulatory Comm.
Expenses (See pages 350 - 351)
94,834,109 91,313,654
20170505-8016 FERC PDF (Unofficial) 04/07/2017
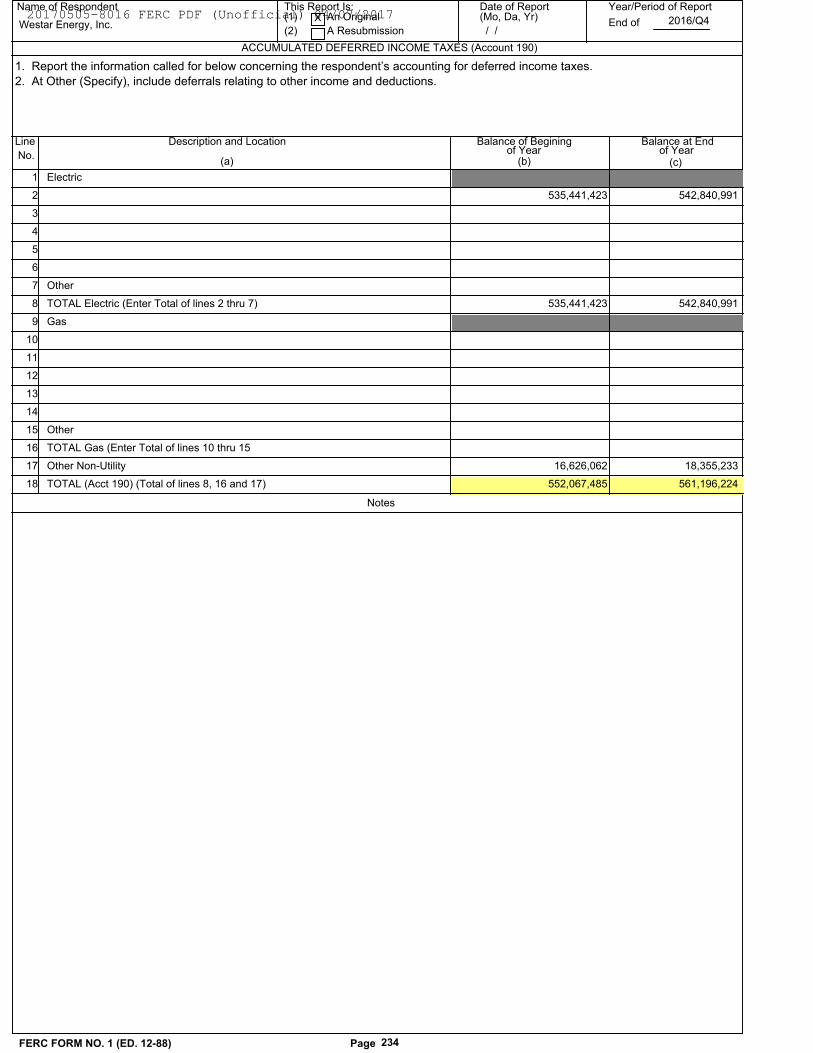
Name of Respondent This Report Is:(1) An Original
(2) A Resubmission
Date of Report(Mo, Da, Yr)
Year/Period of Report
End of
ACCUMULATED DEFERRED INCOME TAXES (Account 190)
Westar Energy, Inc.X
/ /2016/Q4
Line
No.
Description and Location Balance of Begining
(c)(b)(a)
Balance at Endof Year of Year
1. Report the information called for below concerning the respondent’s accounting for deferred income taxes.
2. At Other (Specify), include deferrals relating to other income and deductions.
Electric 1
542,840,991 535,441,423 2
3
4
5
6
Other 7
542,840,991 535,441,423TOTAL Electric (Enter Total of lines 2 thru 7) 8
Gas 9
10
11
12
13
14
Other 15
TOTAL Gas (Enter Total of lines 10 thru 15 16
18,355,233 16,626,062Other Non-Utility 17
561,196,224 552,067,485TOTAL (Acct 190) (Total of lines 8, 16 and 17) 18
Notes
FERC FORM NO. 1 (ED. 12-88) Page 234
20170505-8016 FERC PDF (Unofficial) 04/07/2017
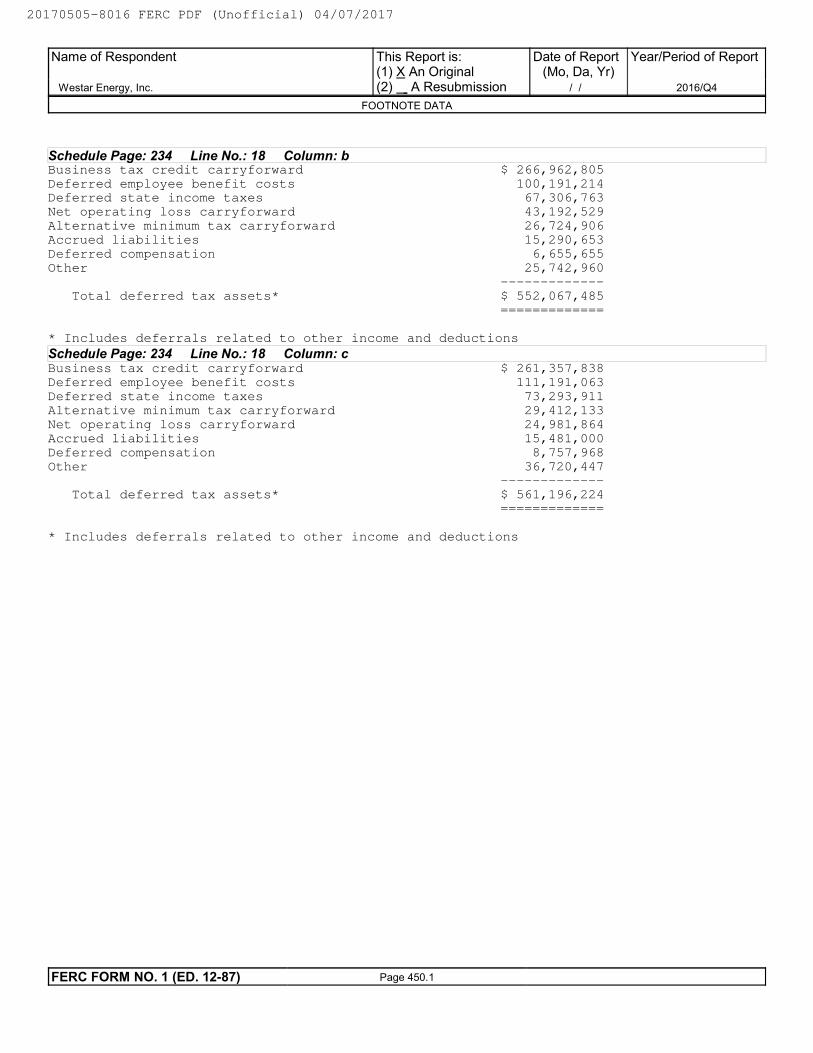
Schedule Page: 234 Line No.: 18 Column: bBusiness tax credit carryforward $ 266,962,805 Deferred employee benefit costs 100,191,214Deferred state income taxes 67,306,763Net operating loss carryforward 43,192,529Alternative minimum tax carryforward 26,724,906Accrued liabilities 15,290,653Deferred compensation 6,655,655Other 25,742,960 ------------- Total deferred tax assets* $ 552,067,485 =============
* Includes deferrals related to other income and deductions
Schedule Page: 234 Line No.: 18 Column: cBusiness tax credit carryforward $ 261,357,838 Deferred employee benefit costs 111,191,063Deferred state income taxes 73,293,911Alternative minimum tax carryforward 29,412,133Net operating loss carryforward 24,981,864Accrued liabilities 15,481,000Deferred compensation 8,757,968Other 36,720,447 ------------- Total deferred tax assets* $ 561,196,224 =============
* Includes deferrals related to other income and deductions
Name of Respondent
Westar Energy, Inc.
This Report is:(1) X An Original(2) A Resubmission
Date of Report(Mo, Da, Yr)
/ /
Year/Period of Report
2016/Q4
FOOTNOTE DATA
FERC FORM NO. 1 (ED. 12-87) Page 450.1
20170505-8016 FERC PDF (Unofficial) 04/07/2017
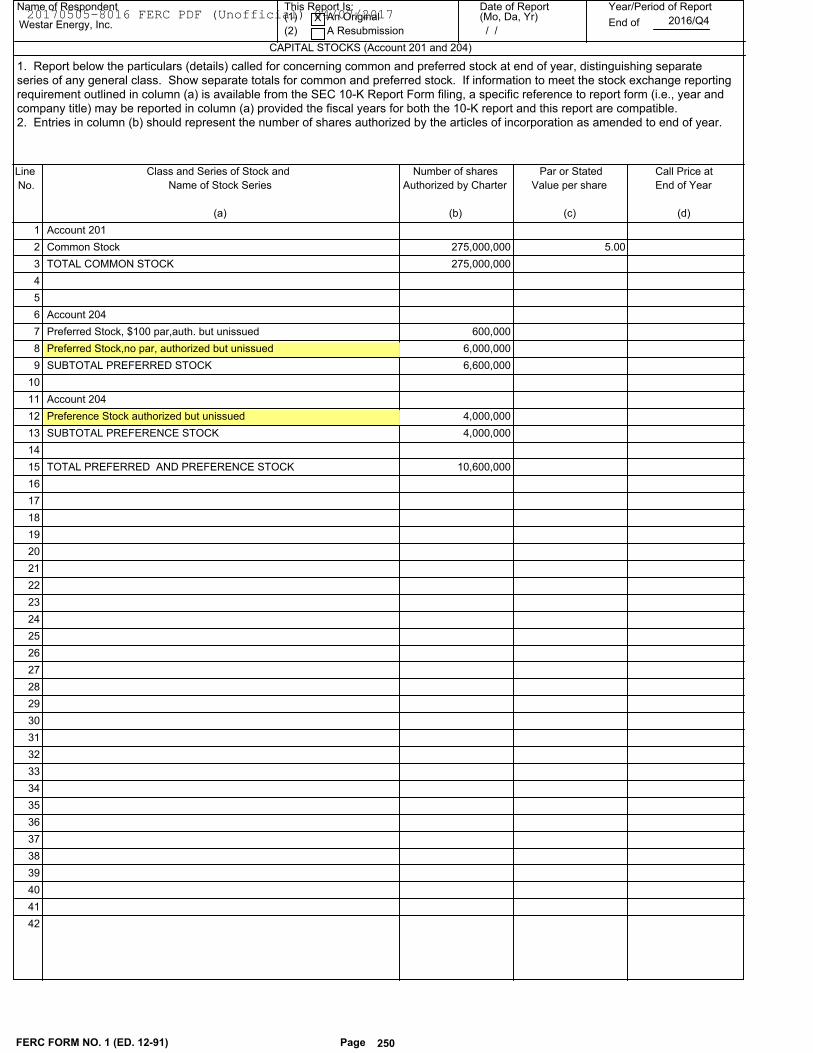
Name of Respondent This Report Is:(1) An Original
(2) A Resubmission
Date of Report(Mo, Da, Yr)
Year/Period of Report
End of
CAPITAL STOCKS (Account 201 and 204)
Westar Energy, Inc.X
/ /2016/Q4
Line
No.
Class and Series of Stock and Number of shares
(c)(b)(a)
Call Price at
End of Year
Par or Stated
Value per share
(d)
Name of Stock Series Authorized by Charter
1. Report below the particulars (details) called for concerning common and preferred stock at end of year, distinguishing separateseries of any general class. Show separate totals for common and preferred stock. If information to meet the stock exchange reportingrequirement outlined in column (a) is available from the SEC 10-K Report Form filing, a specific reference to report form (i.e., year andcompany title) may be reported in column (a) provided the fiscal years for both the 10-K report and this report are compatible.2. Entries in column (b) should represent the number of shares authorized by the articles of incorporation as amended to end of year.
Account 201 1
5.00 275,000,000Common Stock 2
275,000,000TOTAL COMMON STOCK 3
4
5
Account 204 6
600,000Preferred Stock, $100 par,auth. but unissued 7
6,000,000Preferred Stock,no par, authorized but unissued 8
6,600,000SUBTOTAL PREFERRED STOCK 9
10
Account 204 11
4,000,000Preference Stock authorized but unissued 12
4,000,000SUBTOTAL PREFERENCE STOCK 13
14
10,600,000TOTAL PREFERRED AND PREFERENCE STOCK 15
16
17
18
19
20
21
22
23
24
25
26
27
28
29
30
31
32
33
34
35
36
37
38
39
40
41
42
FERC FORM NO. 1 (ED. 12-91) Page 250
20170505-8016 FERC PDF (Unofficial) 04/07/2017
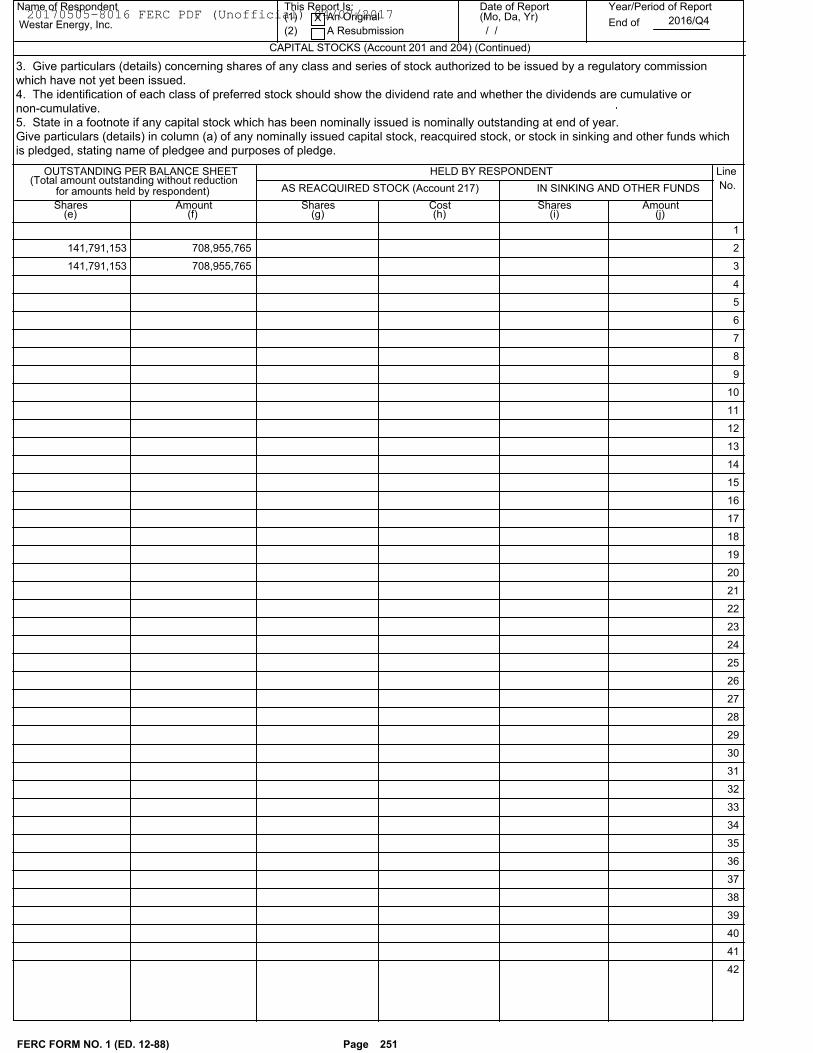
AS REACQUIRED STOCK (Account 217)
Name of Respondent This Report Is:(1) An Original
(2) A Resubmission
Date of Report(Mo, Da, Yr)
Year/Period of Report
End of
CAPITAL STOCKS (Account 201 and 204) (Continued)
Westar Energy, Inc.X
/ /2016/Q4
Line
No.
OUTSTANDING PER BALANCE SHEET HELD BY RESPONDENT
IN SINKING AND OTHER FUNDS
Shares(g)
Cost(h)
Shares SharesAmount
(Total amount outstanding without reductionfor amounts held by respondent)
Amount(e) (f) (i) (j)
3. Give particulars (details) concerning shares of any class and series of stock authorized to be issued by a regulatory commission
which have not yet been issued.
4. The identification of each class of preferred stock should show the dividend rate and whether the dividends are cumulative or
non-cumulative.
5. State in a footnote if any capital stock which has been nominally issued is nominally outstanding at end of year.
Give particulars (details) in column (a) of any nominally issued capital stock, reacquired stock, or stock in sinking and other funds which
is pledged, stating name of pledgee and purposes of pledge.
1
708,955,765 141,791,153 2
708,955,765 141,791,153 3
4
5
6
7
8
9
10
11
12
13
14
15
16
17
18
19
20
21
22
23
24
25
26
27
28
29
30
31
32
33
34
35
36
37
38
39
40
41
42
FERC FORM NO. 1 (ED. 12-88) Page 251
20170505-8016 FERC PDF (Unofficial) 04/07/2017
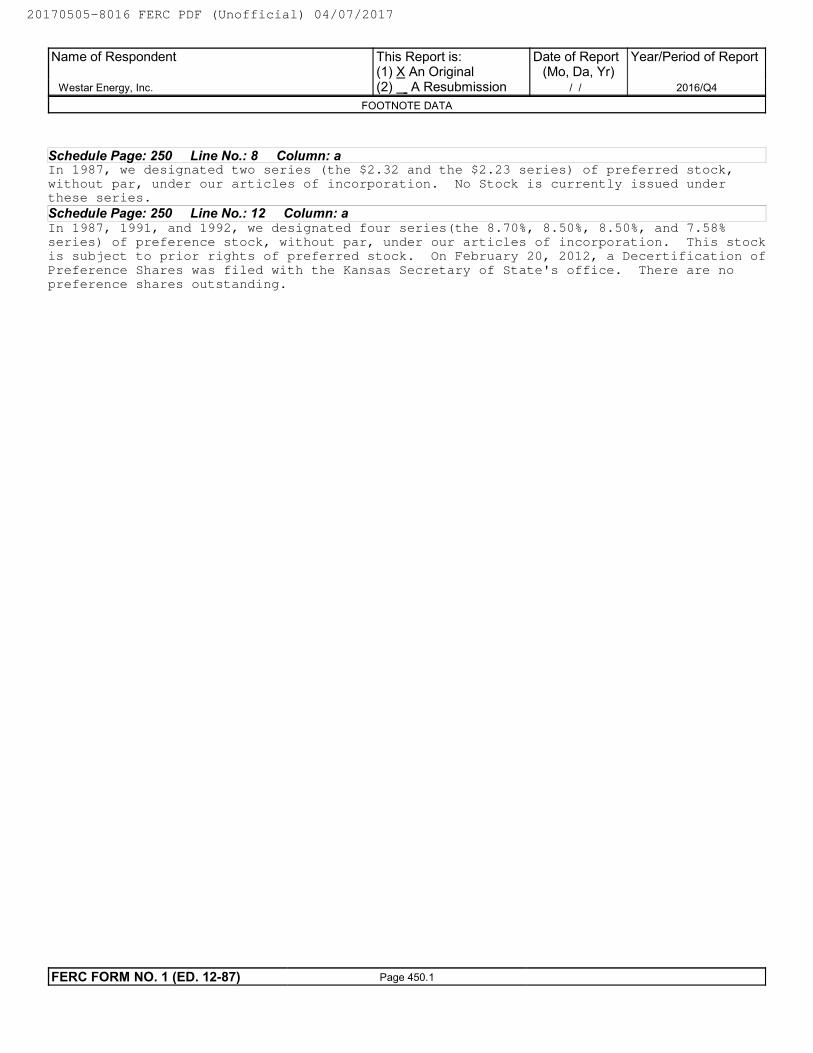
Schedule Page: 250 Line No.: 8 Column: aIn 1987, we designated two series (the $2.32 and the $2.23 series) of preferred stock,without par, under our articles of incorporation. No Stock is currently issued underthese series.
Schedule Page: 250 Line No.: 12 Column: aIn 1987, 1991, and 1992, we designated four series(the 8.70%, 8.50%, 8.50%, and 7.58%series) of preference stock, without par, under our articles of incorporation. This stockis subject to prior rights of preferred stock. On February 20, 2012, a Decertification ofPreference Shares was filed with the Kansas Secretary of State's office. There are nopreference shares outstanding.
Name of Respondent
Westar Energy, Inc.
This Report is:(1) X An Original(2) A Resubmission
Date of Report(Mo, Da, Yr)
/ /
Year/Period of Report
2016/Q4
FOOTNOTE DATA
FERC FORM NO. 1 (ED. 12-87) Page 450.1
20170505-8016 FERC PDF (Unofficial) 04/07/2017
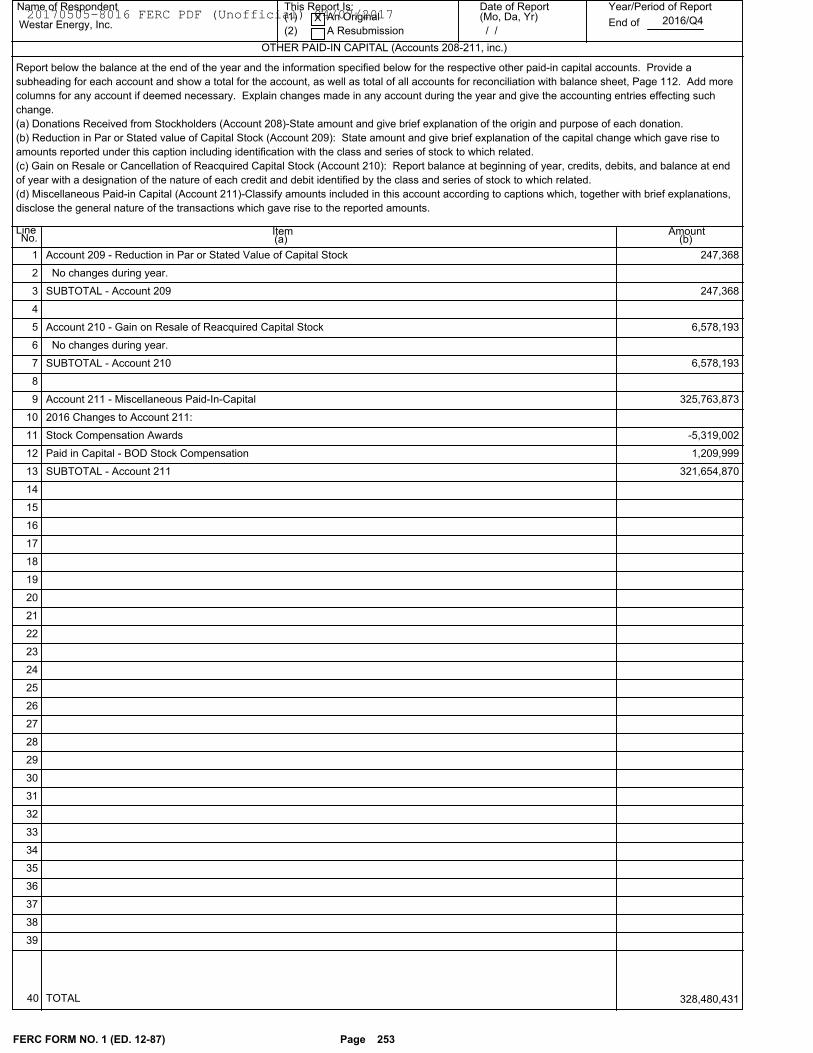
Name of Respondent This Report Is:(1) An Original
(2) A Resubmission
Date of Report(Mo, Da, Yr)
Year/Period of Report
End ofWestar Energy, Inc.X
/ /2016/Q4
Line Item Amount(b)(a)
OTHER PAID-IN CAPITAL (Accounts 208-211, inc.)
No.
Report below the balance at the end of the year and the information specified below for the respective other paid-in capital accounts. Provide a
subheading for each account and show a total for the account, as well as total of all accounts for reconciliation with balance sheet, Page 112. Add more
columns for any account if deemed necessary. Explain changes made in any account during the year and give the accounting entries effecting such
change.
(a) Donations Received from Stockholders (Account 208)-State amount and give brief explanation of the origin and purpose of each donation.
(b) Reduction in Par or Stated value of Capital Stock (Account 209): State amount and give brief explanation of the capital change which gave rise to
amounts reported under this caption including identification with the class and series of stock to which related.
(c) Gain on Resale or Cancellation of Reacquired Capital Stock (Account 210): Report balance at beginning of year, credits, debits, and balance at end
of year with a designation of the nature of each credit and debit identified by the class and series of stock to which related.
(d) Miscellaneous Paid-in Capital (Account 211)-Classify amounts included in this account according to captions which, together with brief explanations,
disclose the general nature of the transactions which gave rise to the reported amounts.
247,368Account 209 - Reduction in Par or Stated Value of Capital Stock 1
No changes during year. 2
247,368SUBTOTAL - Account 209 3
4
6,578,193Account 210 - Gain on Resale of Reacquired Capital Stock 5
No changes during year. 6
6,578,193SUBTOTAL - Account 210 7
8
325,763,873Account 211 - Miscellaneous Paid-In-Capital 9
2016 Changes to Account 211: 10
-5,319,002Stock Compensation Awards 11
1,209,999Paid in Capital - BOD Stock Compensation 12
321,654,870SUBTOTAL - Account 211 13
14
15
16
17
18
19
20
21
22
23
24
25
26
27
28
29
30
31
32
33
34
35
36
37
38
39
FERC FORM NO. 1 (ED. 12-87) Page 253
40 TOTAL 328,480,431
20170505-8016 FERC PDF (Unofficial) 04/07/2017
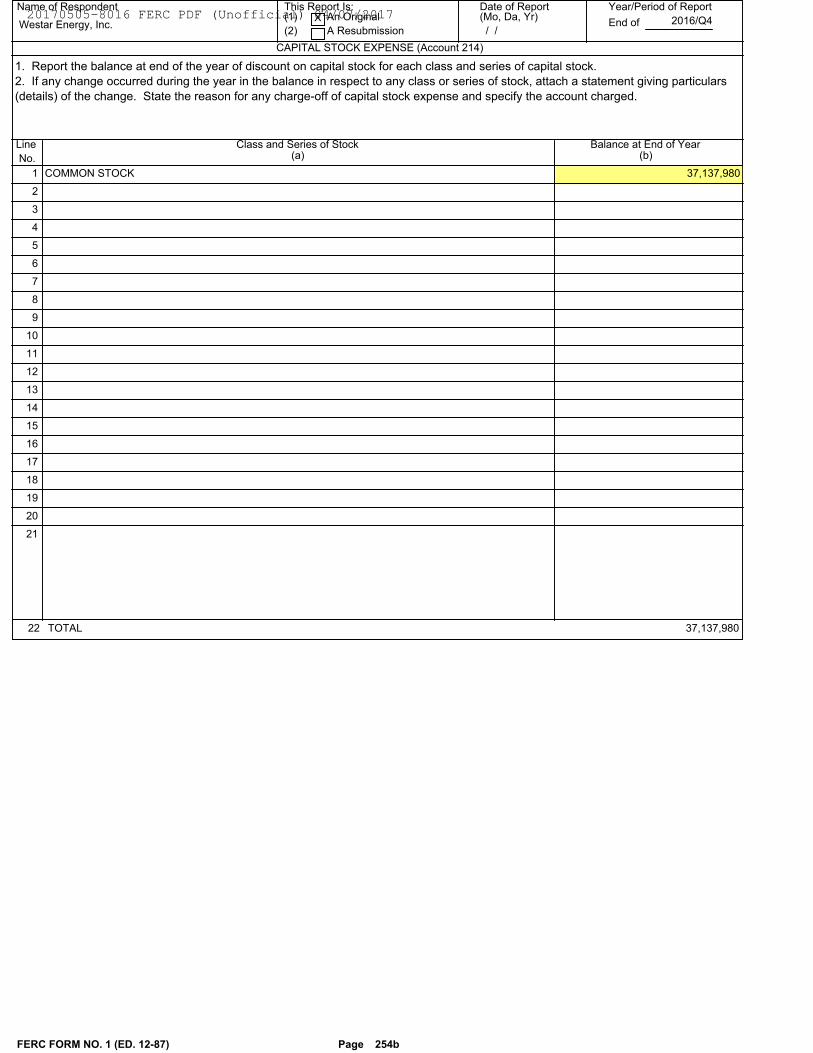
Name of Respondent This Report Is:(1) An Original
(2) A Resubmission
Date of Report(Mo, Da, Yr)
Year/Period of Report
End of
CAPITAL STOCK EXPENSE (Account 214)
Westar Energy, Inc.X
/ /2016/Q4
Line
No.
Class and Series of Stock Balance at End of Year(b)(a)
1. Report the balance at end of the year of discount on capital stock for each class and series of capital stock.
2. If any change occurred during the year in the balance in respect to any class or series of stock, attach a statement giving particulars
(details) of the change. State the reason for any charge-off of capital stock expense and specify the account charged.
37,137,980COMMON STOCK 1
2
3
4
5
6
7
8
9
10
11
12
13
14
15
16
17
18
19
20
21
FERC FORM NO. 1 (ED. 12-87) Page 254b
22 TOTAL 37,137,980
20170505-8016 FERC PDF (Unofficial) 04/07/2017
Schedule Page: 254 Line No.: 1 Column: bThe increase in capital stock expense is due to fees related to shelf registration for
potential future stock issuances.
Name of Respondent
Westar Energy, Inc.
This Report is:(1) X An Original(2) A Resubmission
Date of Report(Mo, Da, Yr)
/ /
Year/Period of Report
2016/Q4
FOOTNOTE DATA
FERC FORM NO. 1 (ED. 12-87) Page 450.1
20170505-8016 FERC PDF (Unofficial) 04/07/2017
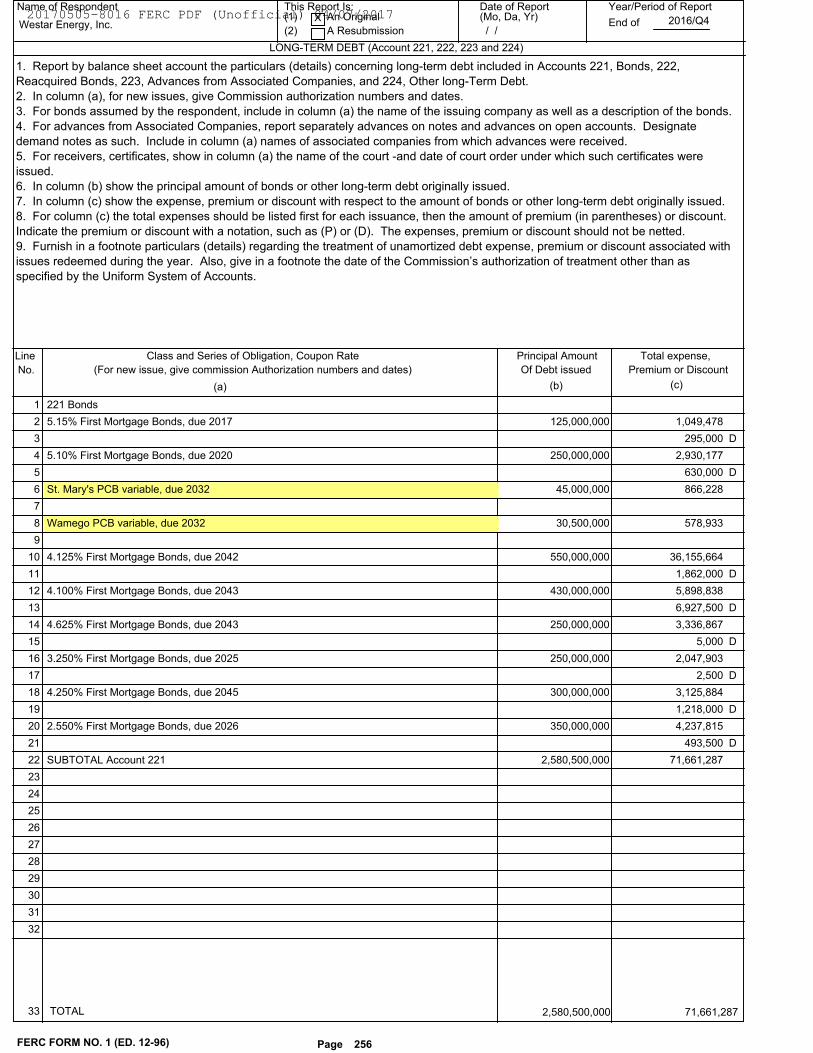
Name of Respondent This Report Is:(1) An Original
(2) A Resubmission
Date of Report(Mo, Da, Yr)
Year/Period of Report
End of
LONG-TERM DEBT (Account 221, 222, 223 and 224)
Westar Energy, Inc.X
/ /2016/Q4
Line
No.
Class and Series of Obligation, Coupon Rate
(c)(b)(a)
Total expense,
Premium or Discount
Principal Amount
Of Debt issued(For new issue, give commission Authorization numbers and dates)
1. Report by balance sheet account the particulars (details) concerning long-term debt included in Accounts 221, Bonds, 222,
Reacquired Bonds, 223, Advances from Associated Companies, and 224, Other long-Term Debt.
2. In column (a), for new issues, give Commission authorization numbers and dates.
3. For bonds assumed by the respondent, include in column (a) the name of the issuing company as well as a description of the bonds.
4. For advances from Associated Companies, report separately advances on notes and advances on open accounts. Designate
demand notes as such. Include in column (a) names of associated companies from which advances were received.
5. For receivers, certificates, show in column (a) the name of the court -and date of court order under which such certificates were
issued.
6. In column (b) show the principal amount of bonds or other long-term debt originally issued.
7. In column (c) show the expense, premium or discount with respect to the amount of bonds or other long-term debt originally issued.
8. For column (c) the total expenses should be listed first for each issuance, then the amount of premium (in parentheses) or discount.
Indicate the premium or discount with a notation, such as (P) or (D). The expenses, premium or discount should not be netted.
9. Furnish in a footnote particulars (details) regarding the treatment of unamortized debt expense, premium or discount associated with
issues redeemed during the year. Also, give in a footnote the date of the Commission’s authorization of treatment other than as
specified by the Uniform System of Accounts.
221 Bonds 1
1,049,478 125,000,0005.15% First Mortgage Bonds, due 2017 2
295,000 3 D
2,930,177 250,000,0005.10% First Mortgage Bonds, due 2020 4
630,000 5 D
866,228 45,000,000St. Mary's PCB variable, due 2032 6
7
578,933 30,500,000Wamego PCB variable, due 2032 8
9
36,155,664 550,000,0004.125% First Mortgage Bonds, due 2042 10
1,862,000 11 D
5,898,838 430,000,0004.100% First Mortgage Bonds, due 2043 12
6,927,500 13 D
3,336,867 250,000,0004.625% First Mortgage Bonds, due 2043 14
5,000 15 D
2,047,903 250,000,0003.250% First Mortgage Bonds, due 2025 16
2,500 17 D
3,125,884 300,000,0004.250% First Mortgage Bonds, due 2045 18
1,218,000 19 D
4,237,815 350,000,0002.550% First Mortgage Bonds, due 2026 20
493,500 21 D
71,661,287 2,580,500,000SUBTOTAL Account 221 22
23
24
25
26
27
28
29
30
31
32
FERC FORM NO. 1 (ED. 12-96) Page 256
33 TOTAL 2,580,500,000 71,661,287
20170505-8016 FERC PDF (Unofficial) 04/07/2017
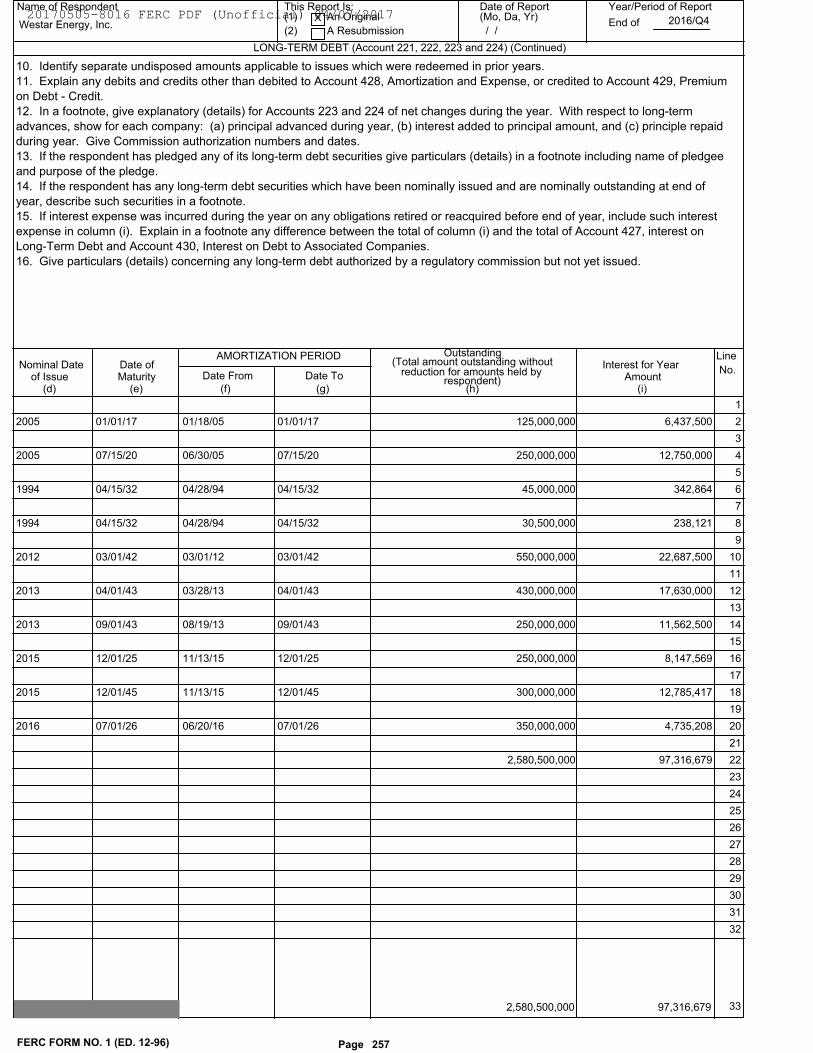
Name of Respondent This Report Is:(1) An Original
(2) A Resubmission
Date of Report(Mo, Da, Yr)
Year/Period of Report
End of
LONG-TERM DEBT (Account 221, 222, 223 and 224) (Continued)
Westar Energy, Inc.X
/ /2016/Q4
Line
No.Nominal Date
of IssueDate ofMaturity
AMORTIZATION PERIOD
Date From Date To
Outstanding(Total amount outstanding without
reduction for amounts held byrespondent)
Interest for YearAmount
(d) (e) (f) (g) (h) (i)
10. Identify separate undisposed amounts applicable to issues which were redeemed in prior years.
11. Explain any debits and credits other than debited to Account 428, Amortization and Expense, or credited to Account 429, Premium
on Debt - Credit.
12. In a footnote, give explanatory (details) for Accounts 223 and 224 of net changes during the year. With respect to long-term
advances, show for each company: (a) principal advanced during year, (b) interest added to principal amount, and (c) principle repaid
during year. Give Commission authorization numbers and dates.
13. If the respondent has pledged any of its long-term debt securities give particulars (details) in a footnote including name of pledgee
and purpose of the pledge.
14. If the respondent has any long-term debt securities which have been nominally issued and are nominally outstanding at end of
year, describe such securities in a footnote.
15. If interest expense was incurred during the year on any obligations retired or reacquired before end of year, include such interest
expense in column (i). Explain in a footnote any difference between the total of column (i) and the total of Account 427, interest on
Long-Term Debt and Account 430, Interest on Debt to Associated Companies.
16. Give particulars (details) concerning any long-term debt authorized by a regulatory commission but not yet issued.
1
125,000,000 6,437,50001/01/1701/18/0501/01/172005 2
3
250,000,000 12,750,00007/15/2006/30/0507/15/202005 4
5
45,000,000 342,86404/15/3204/28/9404/15/321994 6
7
30,500,000 238,12104/15/3204/28/9404/15/321994 8
9
550,000,000 22,687,50003/01/4203/01/1203/01/422012 10
11
430,000,000 17,630,00004/01/4303/28/1304/01/432013 12
13
250,000,000 11,562,50009/01/4308/19/1309/01/432013 14
15
250,000,000 8,147,56912/01/2511/13/1512/01/252015 16
17
300,000,000 12,785,41712/01/4511/13/1512/01/452015 18
19
350,000,000 4,735,20807/01/2606/20/1607/01/262016 20
21
2,580,500,000 97,316,679 22
23
24
25
26
27
28
29
30
31
32
FERC FORM NO. 1 (ED. 12-96) Page 257
33 2,580,500,000 97,316,679
20170505-8016 FERC PDF (Unofficial) 04/07/2017
Schedule Page: 256 Line No.: 6 Column: aMarket-Adjusted Tax Exempt Securities - Interest rate is reset via an auction process
every 35 days. At December 31, 2016 the interest rate on this bond was 1.14%.
Schedule Page: 256 Line No.: 8 Column: aMarket-Adjusted Tax Exempt Securities - Interest rate is reset via an auction process
every 35 days. At December 31, 2016 the interest rate on this bond was 1.32%.
Name of Respondent
Westar Energy, Inc.
This Report is:(1) X An Original(2) A Resubmission
Date of Report(Mo, Da, Yr)
/ /
Year/Period of Report
2016/Q4
FOOTNOTE DATA
FERC FORM NO. 1 (ED. 12-87) Page 450.1
20170505-8016 FERC PDF (Unofficial) 04/07/2017
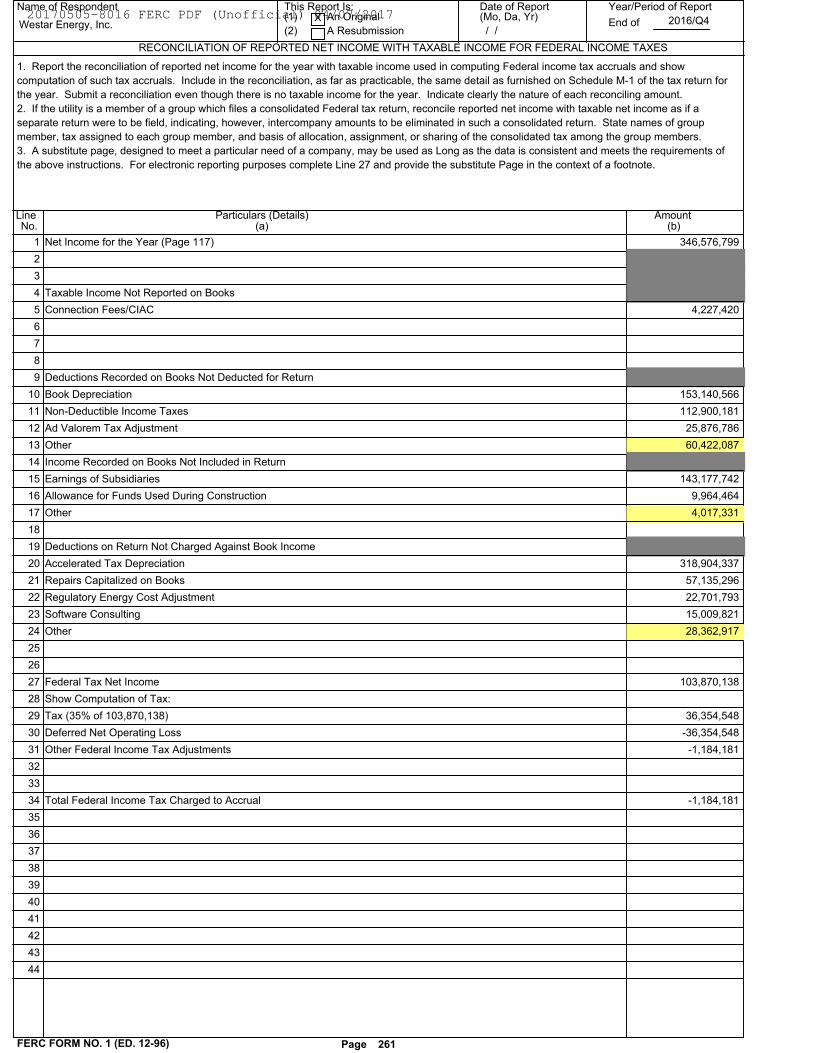
Name of Respondent This Report Is:(1) An Original
(2) A Resubmission
Date of Report(Mo, Da, Yr)
Year/Period of Report
End of
RECONCILIATION OF REPORTED NET INCOME WITH TAXABLE INCOME FOR FEDERAL INCOME TAXES
Westar Energy, Inc.X
/ /2016/Q4
Particulars (Details)(b)(a)
Amount LineNo.
1. Report the reconciliation of reported net income for the year with taxable income used in computing Federal income tax accruals and show
computation of such tax accruals. Include in the reconciliation, as far as practicable, the same detail as furnished on Schedule M-1 of the tax return for
the year. Submit a reconciliation even though there is no taxable income for the year. Indicate clearly the nature of each reconciling amount.
2. If the utility is a member of a group which files a consolidated Federal tax return, reconcile reported net income with taxable net income as if a
separate return were to be field, indicating, however, intercompany amounts to be eliminated in such a consolidated return. State names of group
member, tax assigned to each group member, and basis of allocation, assignment, or sharing of the consolidated tax among the group members.
3. A substitute page, designed to meet a particular need of a company, may be used as Long as the data is consistent and meets the requirements of
the above instructions. For electronic reporting purposes complete Line 27 and provide the substitute Page in the context of a footnote.
346,576,799Net Income for the Year (Page 117) 1
2
3
Taxable Income Not Reported on Books 4
4,227,420Connection Fees/CIAC 5
6
7
8
Deductions Recorded on Books Not Deducted for Return 9
153,140,566Book Depreciation 10
112,900,181Non-Deductible Income Taxes 11
25,876,786Ad Valorem Tax Adjustment 12
60,422,087Other 13
Income Recorded on Books Not Included in Return 14
143,177,742Earnings of Subsidiaries 15
9,964,464Allowance for Funds Used During Construction 16
4,017,331Other 17
18
Deductions on Return Not Charged Against Book Income 19
318,904,337Accelerated Tax Depreciation 20
57,135,296Repairs Capitalized on Books 21
22,701,793Regulatory Energy Cost Adjustment 22
15,009,821Software Consulting 23
28,362,917Other 24
25
26
103,870,138Federal Tax Net Income 27
Show Computation of Tax: 28
36,354,548Tax (35% of 103,870,138) 29
-36,354,548Deferred Net Operating Loss 30
-1,184,181Other Federal Income Tax Adjustments 31
32
33
-1,184,181Total Federal Income Tax Charged to Accrual 34
35
36
37
38
39
40
41
42
43
44
FERC FORM NO. 1 (ED. 12-96) Page 261
20170505-8016 FERC PDF (Unofficial) 04/07/2017
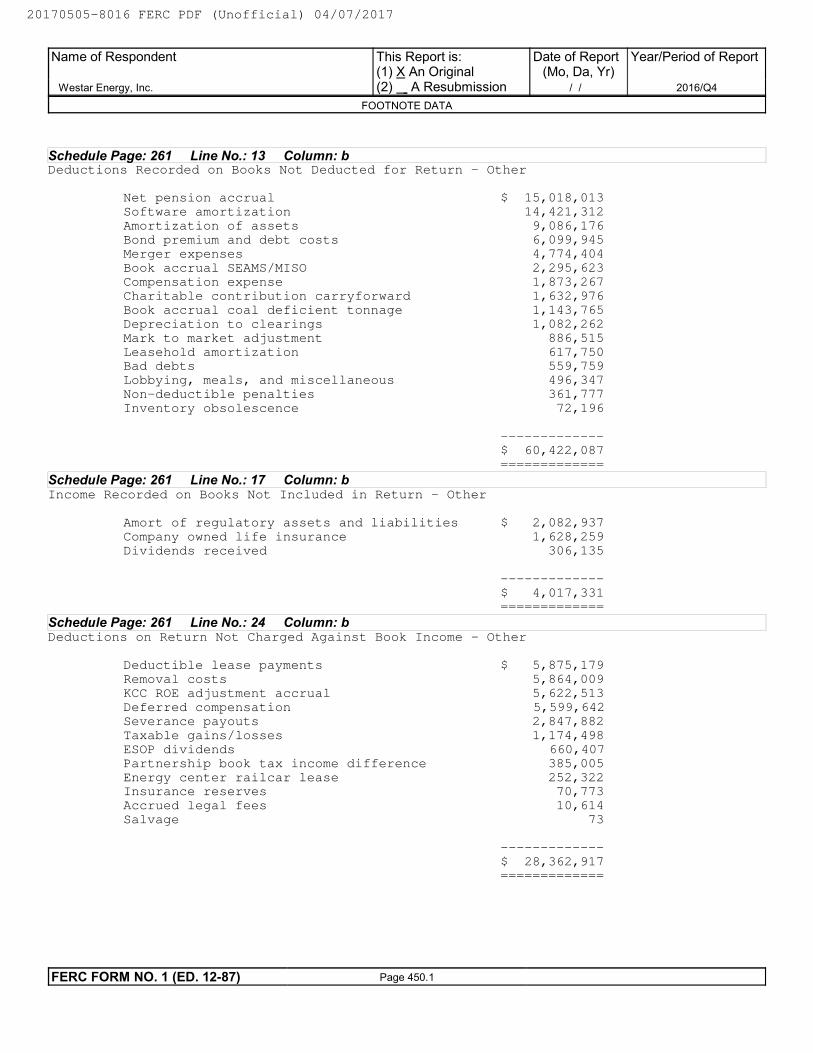
Schedule Page: 261 Line No.: 13 Column: bDeductions Recorded on Books Not Deducted for Return - Other
Net pension accrual $ 15,018,013 Software amortization 14,421,312 Amortization of assets 9,086,176 Bond premium and debt costs 6,099,945 Merger expenses 4,774,404 Book accrual SEAMS/MISO 2,295,623 Compensation expense 1,873,267 Charitable contribution carryforward 1,632,976 Book accrual coal deficient tonnage 1,143,765 Depreciation to clearings 1,082,262 Mark to market adjustment 886,515 Leasehold amortization 617,750 Bad debts 559,759 Lobbying, meals, and miscellaneous 496,347 Non-deductible penalties 361,777 Inventory obsolescence 72,196
------------- $ 60,422,087 =============
Schedule Page: 261 Line No.: 17 Column: bIncome Recorded on Books Not Included in Return - Other
Amort of regulatory assets and liabilities $ 2,082,937 Company owned life insurance 1,628,259 Dividends received 306,135 ------------- $ 4,017,331 =============
Schedule Page: 261 Line No.: 24 Column: bDeductions on Return Not Charged Against Book Income - Other
Deductible lease payments $ 5,875,179 Removal costs 5,864,009 KCC ROE adjustment accrual 5,622,513 Deferred compensation 5,599,642 Severance payouts 2,847,882 Taxable gains/losses 1,174,498 ESOP dividends 660,407 Partnership book tax income difference 385,005 Energy center railcar lease 252,322 Insurance reserves 70,773 Accrued legal fees 10,614 Salvage 73 ------------- $ 28,362,917 =============
Name of Respondent
Westar Energy, Inc.
This Report is:(1) X An Original(2) A Resubmission
Date of Report(Mo, Da, Yr)
/ /
Year/Period of Report
2016/Q4
FOOTNOTE DATA
FERC FORM NO. 1 (ED. 12-87) Page 450.1
20170505-8016 FERC PDF (Unofficial) 04/07/2017
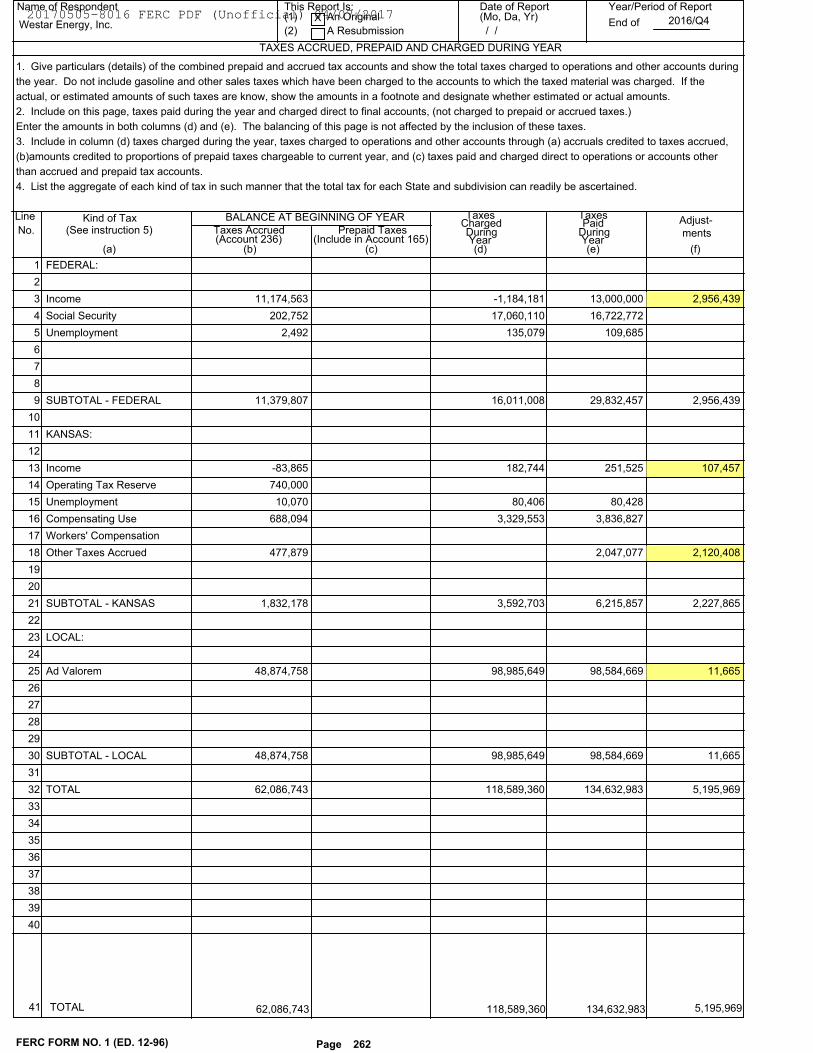
Name of Respondent This Report Is:(1) An Original
(2) A Resubmission
Date of Report(Mo, Da, Yr)
Year/Period of Report
End of
TAXES ACCRUED, PREPAID AND CHARGED DURING YEAR
Westar Energy, Inc.X
/ /2016/Q4
Line
No.Kind of Tax
(See instruction 5)
BALANCE AT BEGINNING OF YEAR
Taxes Accrued(Account 236)
Prepaid Taxes(Include in Account 165)
TaxesChargedDuringYear
TaxesPaid
DuringAdjust-
mentsYear
(a) (b) (c) (d) (e) (f)
1. Give particulars (details) of the combined prepaid and accrued tax accounts and show the total taxes charged to operations and other accounts during
the year. Do not include gasoline and other sales taxes which have been charged to the accounts to which the taxed material was charged. If the
actual, or estimated amounts of such taxes are know, show the amounts in a footnote and designate whether estimated or actual amounts.
2. Include on this page, taxes paid during the year and charged direct to final accounts, (not charged to prepaid or accrued taxes.)
Enter the amounts in both columns (d) and (e). The balancing of this page is not affected by the inclusion of these taxes.
3. Include in column (d) taxes charged during the year, taxes charged to operations and other accounts through (a) accruals credited to taxes accrued,
(b)amounts credited to proportions of prepaid taxes chargeable to current year, and (c) taxes paid and charged direct to operations or accounts other
than accrued and prepaid tax accounts.
4. List the aggregate of each kind of tax in such manner that the total tax for each State and subdivision can readily be ascertained.
FEDERAL: 1
2
13,000,000 2,956,439 -1,184,181 11,174,563Income 3
16,722,772 17,060,110 202,752Social Security 4
109,685 135,079 2,492Unemployment 5
6
7
8
29,832,457 2,956,439 16,011,008 11,379,807SUBTOTAL - FEDERAL 9
10
KANSAS: 11
12
251,525 107,457 182,744 -83,865Income 13
740,000Operating Tax Reserve 14
80,428 80,406 10,070Unemployment 15
3,836,827 3,329,553 688,094Compensating Use 16
Workers' Compensation 17
2,047,077 2,120,408 477,879Other Taxes Accrued 18
19
20
6,215,857 2,227,865 3,592,703 1,832,178SUBTOTAL - KANSAS 21
22
LOCAL: 23
24
98,584,669 11,665 98,985,649 48,874,758Ad Valorem 25
26
27
28
29
98,584,669 11,665 98,985,649 48,874,758SUBTOTAL - LOCAL 30
31
134,632,983 5,195,969 118,589,360 62,086,743TOTAL 32
33
34
35
36
37
38
39
40
FERC FORM NO. 1 (ED. 12-96) Page 262
TOTAL41 118,589,360 134,632,983 5,195,969 62,086,743
20170505-8016 FERC PDF (Unofficial) 04/07/2017
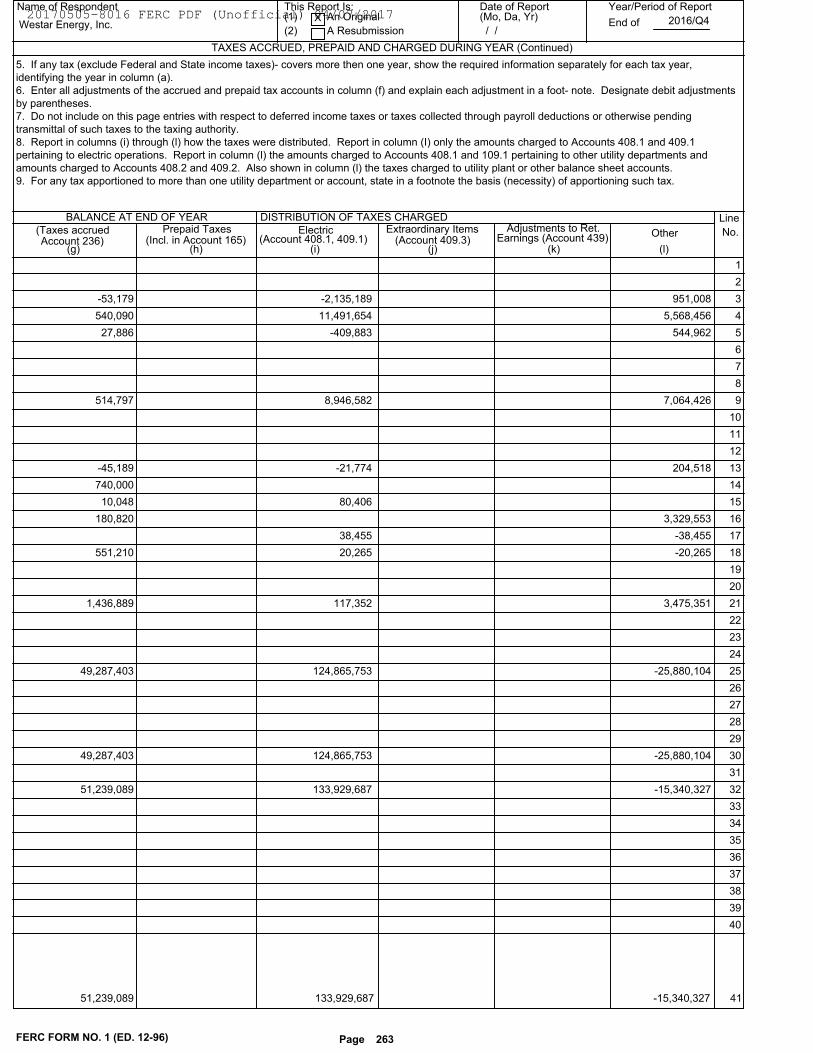
Name of Respondent This Report Is:(1) An Original
(2) A Resubmission
Date of Report(Mo, Da, Yr)
Year/Period of Report
End of
TAXES ACCRUED, PREPAID AND CHARGED DURING YEAR (Continued)
Westar Energy, Inc.X
/ /2016/Q4
Line
No.(Taxes accrued
BALANCE AT END OF YEARPrepaid Taxes Electric
(Account 408.1, 409.1)Extraordinary Items
(Account 409.3)Adjustments to Ret. OtherEarnings (Account 439)
(g) (h) (i) (j) (k) (l)Account 236) (Incl. in Account 165)
DISTRIBUTION OF TAXES CHARGED
5. If any tax (exclude Federal and State income taxes)- covers more then one year, show the required information separately for each tax year,
identifying the year in column (a).
6. Enter all adjustments of the accrued and prepaid tax accounts in column (f) and explain each adjustment in a foot- note. Designate debit adjustments
by parentheses.
7. Do not include on this page entries with respect to deferred income taxes or taxes collected through payroll deductions or otherwise pending
transmittal of such taxes to the taxing authority.
8. Report in columns (i) through (l) how the taxes were distributed. Report in column (I) only the amounts charged to Accounts 408.1 and 409.1
pertaining to electric operations. Report in column (l) the amounts charged to Accounts 408.1 and 109.1 pertaining to other utility departments and
amounts charged to Accounts 408.2 and 409.2. Also shown in column (l) the taxes charged to utility plant or other balance sheet accounts.
9. For any tax apportioned to more than one utility department or account, state in a footnote the basis (necessity) of apportioning such tax.
1
2
951,008 -2,135,189 -53,179 3
5,568,456 11,491,654 540,090 4
544,962 -409,883 27,886 5
6
7
8
7,064,426 8,946,582 514,797 9
10
11
12
204,518 -21,774 -45,189 13
740,000 14
80,406 10,048 15
3,329,553 180,820 16
-38,455 38,455 17
-20,265 20,265 551,210 18
19
20
3,475,351 117,352 1,436,889 21
22
23
24
-25,880,104 124,865,753 49,287,403 25
26
27
28
29
-25,880,104 124,865,753 49,287,403 30
31
-15,340,327 133,929,687 51,239,089 32
33
34
35
36
37
38
39
40
FERC FORM NO. 1 (ED. 12-96) Page 263
41 133,929,687 -15,340,327 51,239,089
20170505-8016 FERC PDF (Unofficial) 04/07/2017
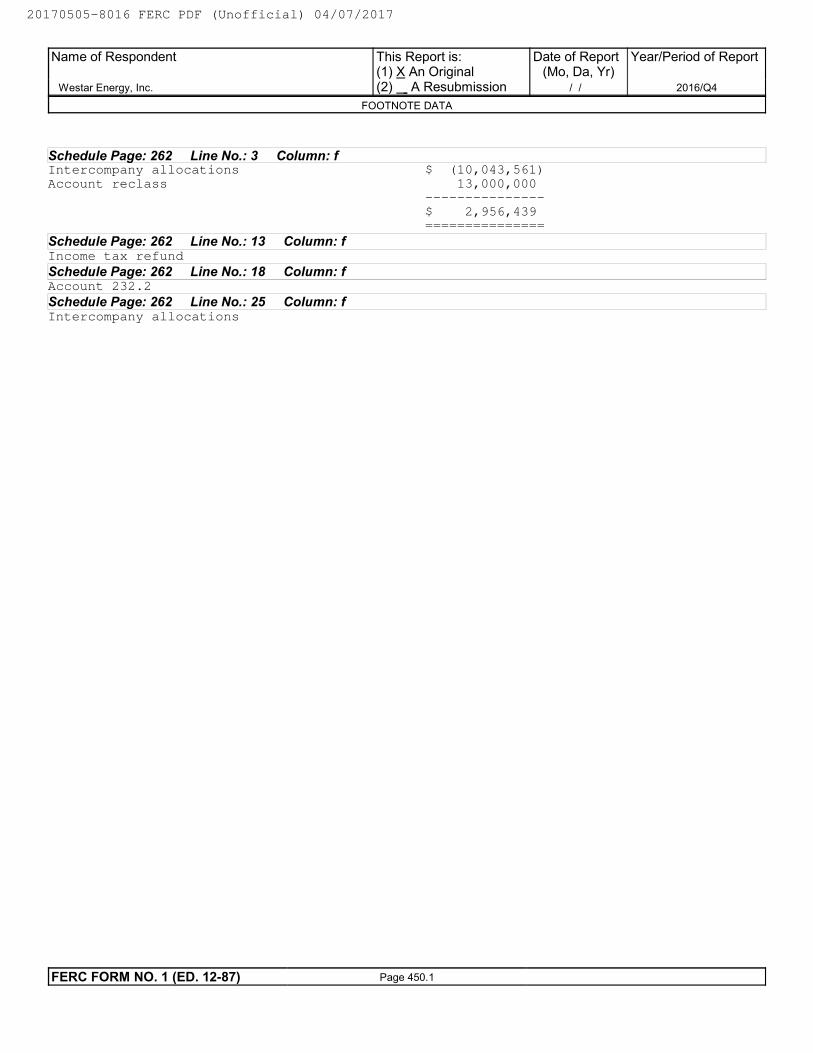
Schedule Page: 262 Line No.: 3 Column: fIntercompany allocations $ (10,043,561)
Account reclass 13,000,000 ---------------
$ 2,956,439
===============
Schedule Page: 262 Line No.: 13 Column: fIncome tax refund
Schedule Page: 262 Line No.: 18 Column: fAccount 232.2
Schedule Page: 262 Line No.: 25 Column: fIntercompany allocations
Name of Respondent
Westar Energy, Inc.
This Report is:(1) X An Original(2) A Resubmission
Date of Report(Mo, Da, Yr)
/ /
Year/Period of Report
2016/Q4
FOOTNOTE DATA
FERC FORM NO. 1 (ED. 12-87) Page 450.1
20170505-8016 FERC PDF (Unofficial) 04/07/2017
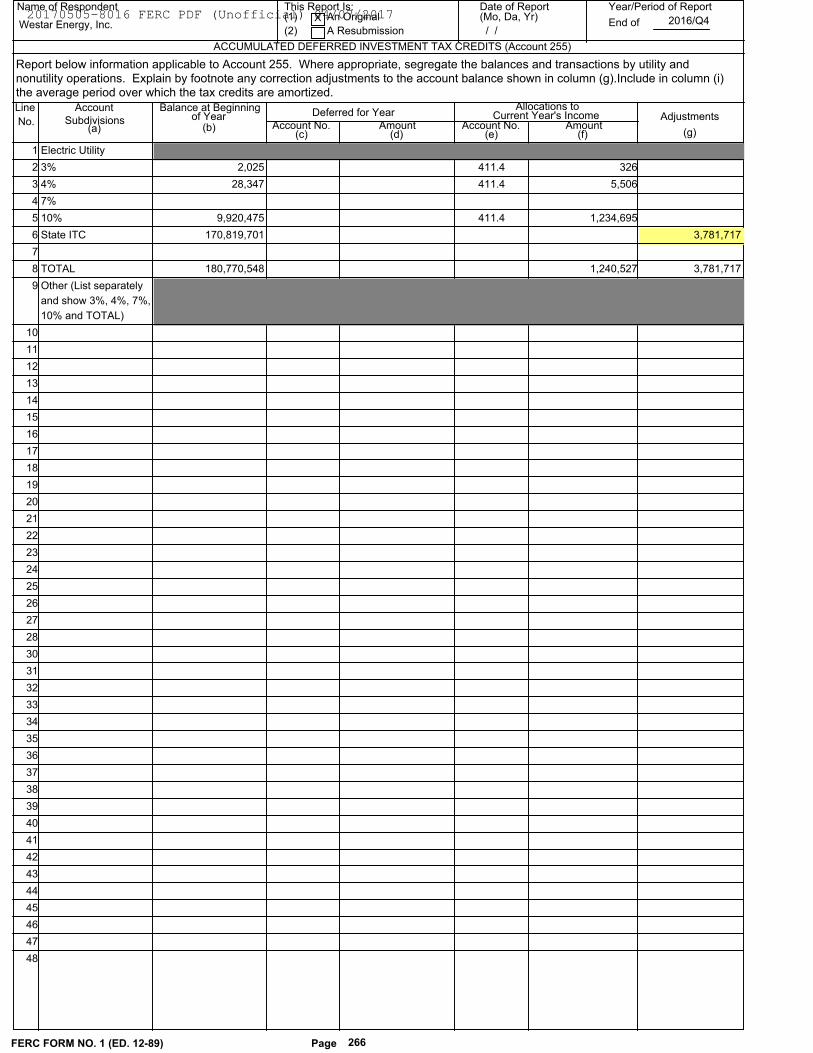
Name of Respondent This Report Is:(1) An Original
(2) A Resubmission
Date of Report(Mo, Da, Yr)
Year/Period of Report
End of
ACCUMULATED DEFERRED INVESTMENT TAX CREDITS (Account 255)
Westar Energy, Inc.X
/ /2016/Q4
Line
No.
Account Balance at Beginning
(c)(b)(a)
of YearSubdivisions AdjustmentsDeferred for YearAllocations to
Current Year's IncomeAccount No. Amount Account No. Amount
(d) (e) (f) (g)
Report below information applicable to Account 255. Where appropriate, segregate the balances and transactions by utility and
nonutility operations. Explain by footnote any correction adjustments to the account balance shown in column (g).Include in column (i)
the average period over which the tax credits are amortized.
Electric Utility 1
3% 2,025 411.4 326 2
4% 28,347 411.4 5,506 3
7% 4
10% 9,920,475 411.4 1,234,695 5
State ITC 3,781,717 170,819,701 6
7
TOTAL 3,781,717 180,770,548 1,240,527 8
Other (List separately
and show 3%, 4%, 7%,
10% and TOTAL)
9
10
11
12
13
14
15
16
17
18
19
20
21
22
23
24
25
26
27
28
30
31
32
33
34
35
36
37
38
39
40
41
42
43
44
45
46
47
48
FERC FORM NO. 1 (ED. 12-89) Page 266
20170505-8016 FERC PDF (Unofficial) 04/07/2017
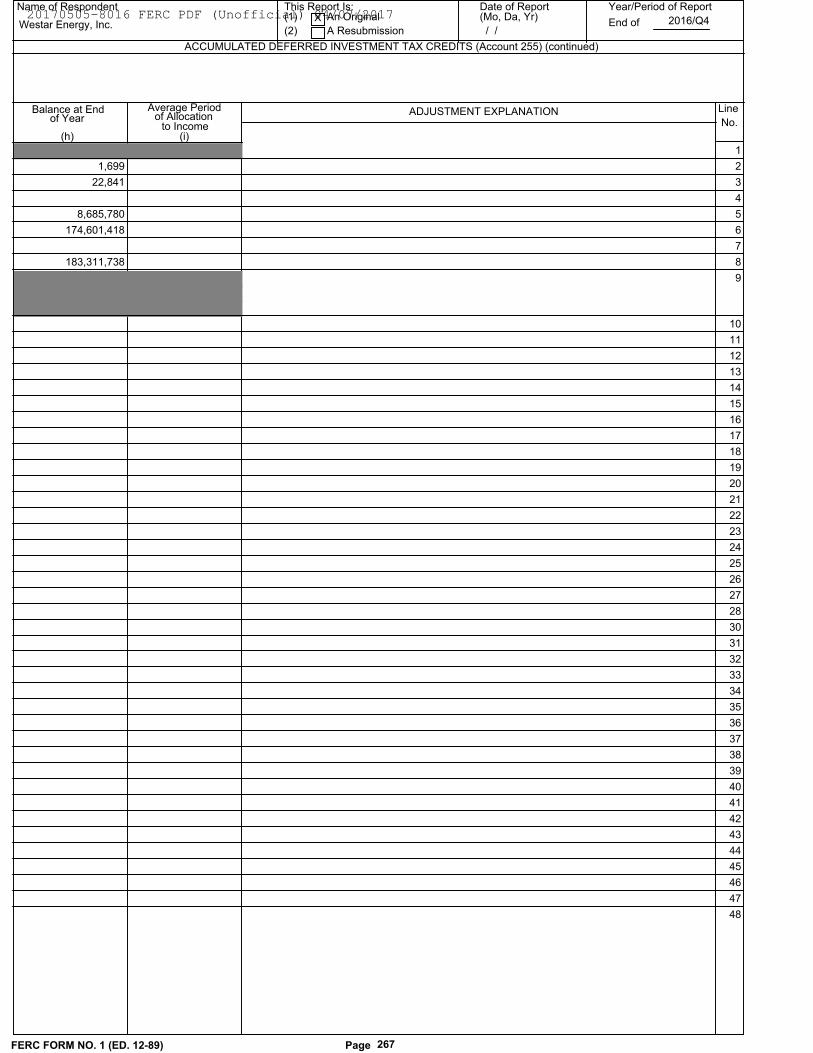
Balance at End
(i)(h)
of Year
Name of Respondent This Report Is:(1) An Original
(2) A Resubmission
Date of Report(Mo, Da, Yr)
Year/Period of Report
End of
ACCUMULATED DEFERRED INVESTMENT TAX CREDITS (Account 255) (continued)
Westar Energy, Inc.X
/ /2016/Q4
Line
No.ADJUSTMENT EXPLANATIONAverage Period
of Allocationto Income
1
1,699 2
22,841 3
4
8,685,780 5
174,601,418 6
7
183,311,738 8
9
10
11
12
13
14
15
16
17
18
19
20
21
22
23
24
25
26
27
28
30
31
32
33
34
35
36
37
38
39
40
41
42
43
44
45
46
47
48
FERC FORM NO. 1 (ED. 12-89) Page 267
20170505-8016 FERC PDF (Unofficial) 04/07/2017
Schedule Page: 266 Line No.: 6 Column: gKansas High Performance Incentive Program investment tax credits earned during the year.
Name of Respondent
Westar Energy, Inc.
This Report is:(1) X An Original(2) A Resubmission
Date of Report(Mo, Da, Yr)
/ /
Year/Period of Report
2016/Q4
FOOTNOTE DATA
FERC FORM NO. 1 (ED. 12-87) Page 450.1
20170505-8016 FERC PDF (Unofficial) 04/07/2017
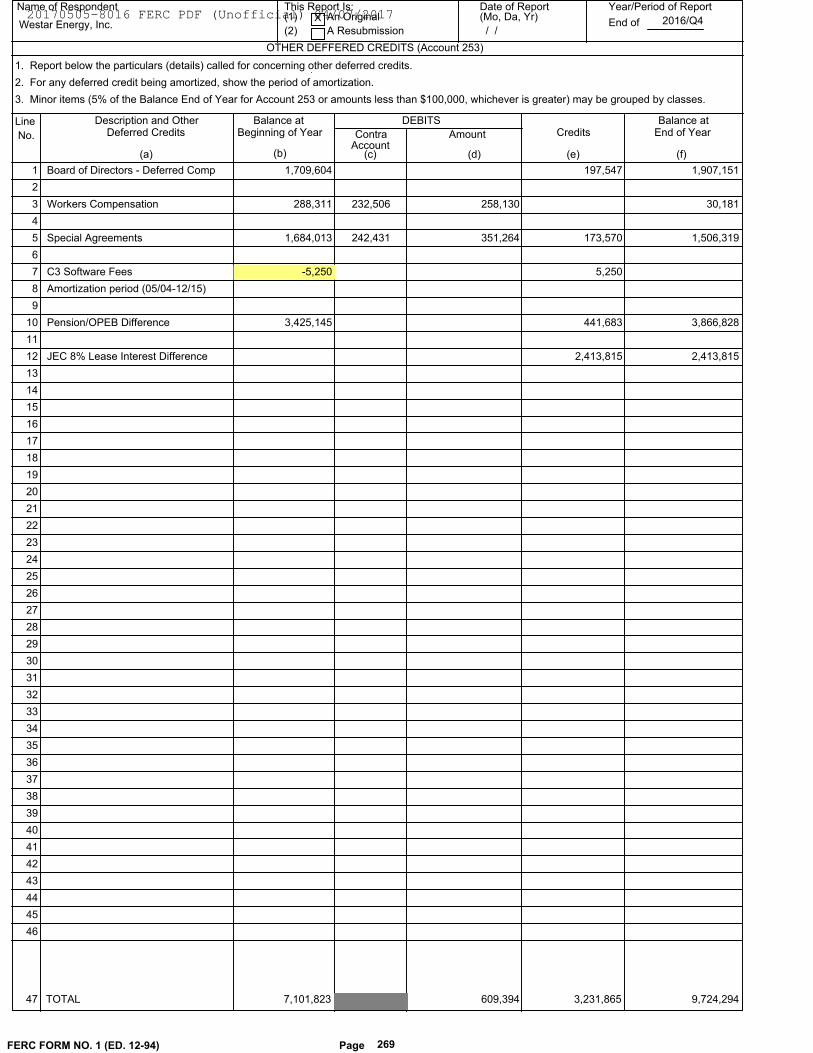
Name of Respondent This Report Is:(1) An Original
(2) A Resubmission
Date of Report(Mo, Da, Yr)
Year/Period of Report
End of
OTHER DEFFERED CREDITS (Account 253)
Westar Energy, Inc.X
/ /2016/Q4
Line
No.
Description and Other DEBITS Credits
Account(c)(b)(a)
Balance atEnd of Year
(d)
Deferred Credits Amount
(e)
Balance at Beginning of Year Contra
(f)
1. Report below the particulars (details) called for concerning other deferred credits.
2. For any deferred credit being amortized, show the period of amortization.
3. Minor items (5% of the Balance End of Year for Account 253 or amounts less than $100,000, whichever is greater) may be grouped by classes.
1,709,604Board of Directors - Deferred Comp 1,907,151 197,547 1
2
288,311Workers Compensation 30,181 258,130232,506 3
4
1,684,013Special Agreements 1,506,319 173,570 351,264242,431 5
6
-5,250C3 Software Fees 5,250 7
Amortization period (05/04-12/15) 8
9
3,425,145Pension/OPEB Difference 3,866,828 441,683 10
11
JEC 8% Lease Interest Difference 2,413,815 2,413,815 12
13
14
15
16
17
18
19
20
21
22
23
24
25
26
27
28
29
30
31
32
33
34
35
36
37
38
39
40
41
42
43
44
45
46
FERC FORM NO. 1 (ED. 12-94) Page 269
47 TOTAL 3,231,865 609,394 9,724,294 7,101,823
20170505-8016 FERC PDF (Unofficial) 04/07/2017
Schedule Page: 269 Line No.: 7 Column: bThe negative balance is due to an adjustment in the purchase price of software, which was
corrected in 2016.
Name of Respondent
Westar Energy, Inc.
This Report is:(1) X An Original(2) A Resubmission
Date of Report(Mo, Da, Yr)
/ /
Year/Period of Report
2016/Q4
FOOTNOTE DATA
FERC FORM NO. 1 (ED. 12-87) Page 450.1
20170505-8016 FERC PDF (Unofficial) 04/07/2017
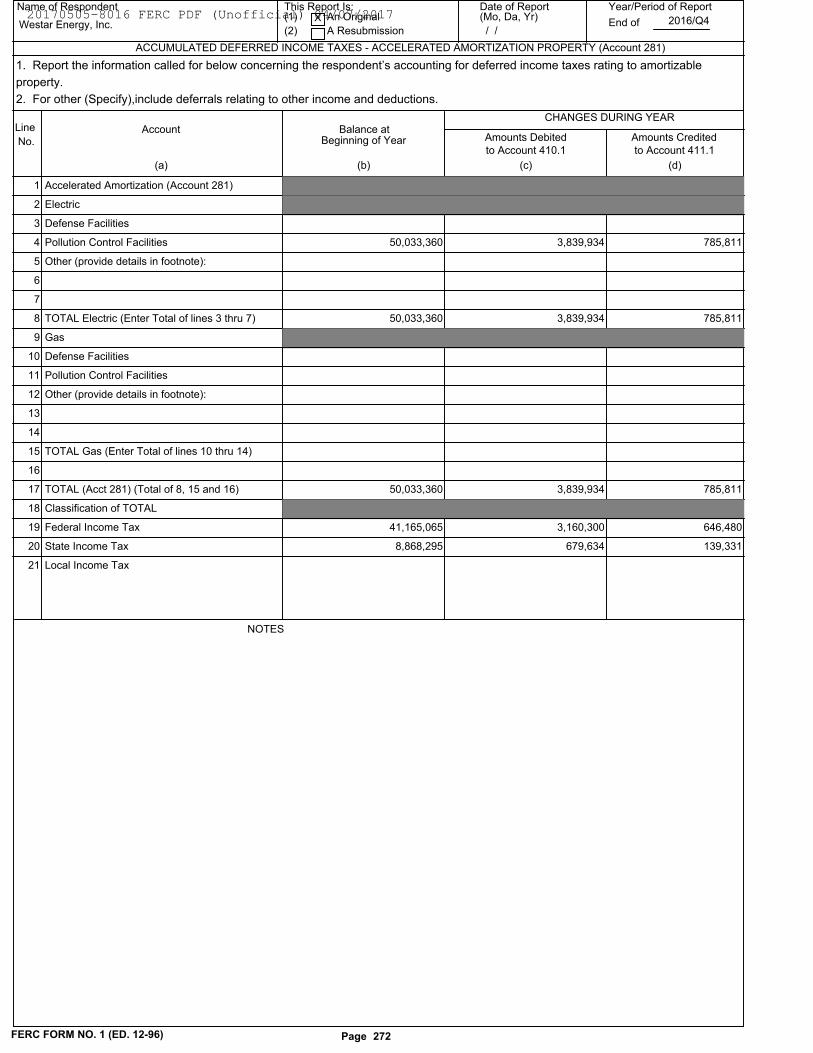
Name of Respondent This Report Is:(1) An Original
(2) A Resubmission
Date of Report(Mo, Da, Yr)
Year/Period of Report
End of
ACCUMULATED DEFERRED INCOME TAXES - ACCELERATED AMORTIZATION PROPERTY (Account 281)
Westar Energy, Inc.X
/ /2016/Q4
Line
No.Account
(a) (b) (c) (d)
Balance atBeginning of Year
CHANGES DURING YEAR
Amounts Debited Amounts Credited
to Account 410.1 to Account 411.1
1. Report the information called for below concerning the respondent’s accounting for deferred income taxes rating to amortizable
property.
2. For other (Specify),include deferrals relating to other income and deductions.
1 Accelerated Amortization (Account 281)
2 Electric
3 Defense Facilities
785,811 3,839,934 50,033,360 4 Pollution Control Facilities
5 Other (provide details in footnote):
6
7
785,811 3,839,934 50,033,360 8 TOTAL Electric (Enter Total of lines 3 thru 7)
9 Gas
10 Defense Facilities
11 Pollution Control Facilities
12 Other (provide details in footnote):
13
14
15 TOTAL Gas (Enter Total of lines 10 thru 14)
16
785,811 3,839,934 50,033,360 17 TOTAL (Acct 281) (Total of 8, 15 and 16)
18 Classification of TOTAL
646,480 3,160,300 41,165,065 19 Federal Income Tax
139,331 679,634 8,868,295 20 State Income Tax
21 Local Income Tax
FERC FORM NO. 1 (ED. 12-96) Page 272
NOTES
20170505-8016 FERC PDF (Unofficial) 04/07/2017
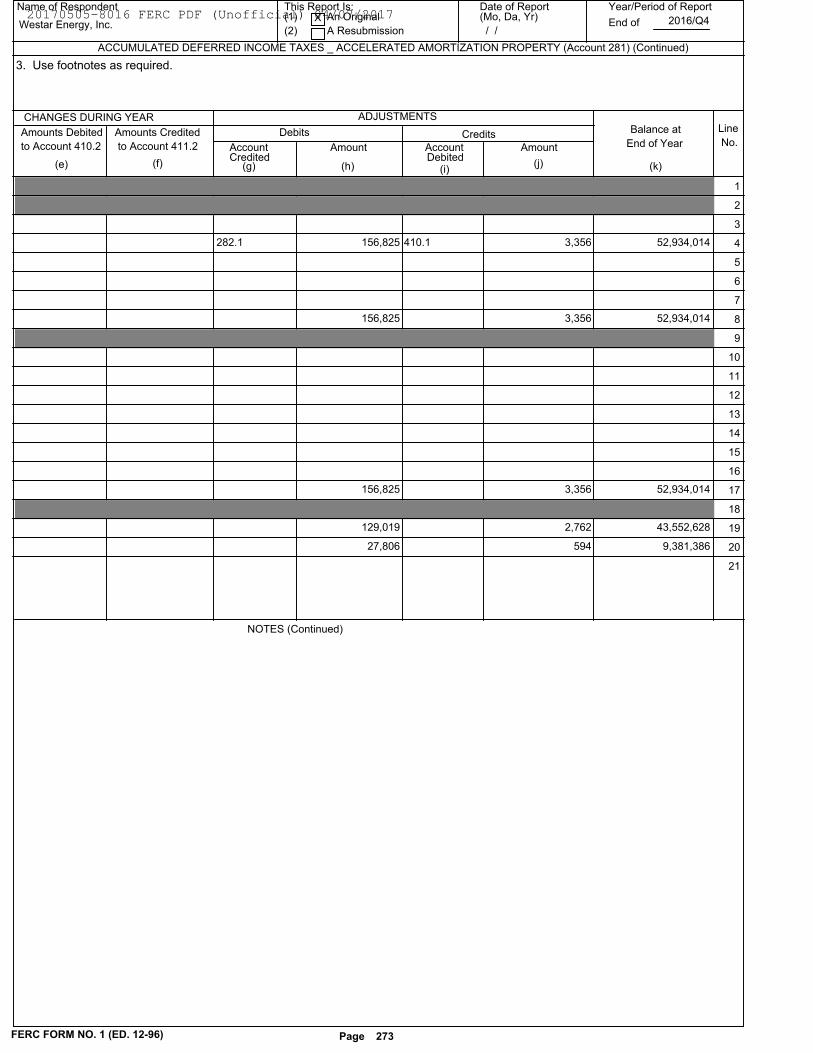
Name of Respondent This Report Is:(1) An Original
(2) A Resubmission
Date of Report(Mo, Da, Yr)
Year/Period of Report
End of
ACCUMULATED DEFERRED INCOME TAXES _ ACCELERATED AMORTIZATION PROPERTY (Account 281) (Continued)
Westar Energy, Inc.X
/ /2016/Q4
Line
No.
CHANGES DURING YEAR ADJUSTMENTS
Balance at
End of YearDebits CreditsAmounts Debited
to Account 410.2
Amounts Credited
to Account 411.2 AccountCredited
AmountDebitedAccount Amount
(e) (f) (h) (j) (k)(g) (i)
3. Use footnotes as required.
1
2
3
410.1282.1 156,825 52,934,014 3,356 4
5
6
7
156,825 52,934,014 3,356 8
9
10
11
12
13
14
15
16
156,825 52,934,014 3,356 17
18
129,019 43,552,628 2,762 19
27,806 9,381,386 594 20
21
FERC FORM NO. 1 (ED. 12-96) Page 273
NOTES (Continued)
20170505-8016 FERC PDF (Unofficial) 04/07/2017
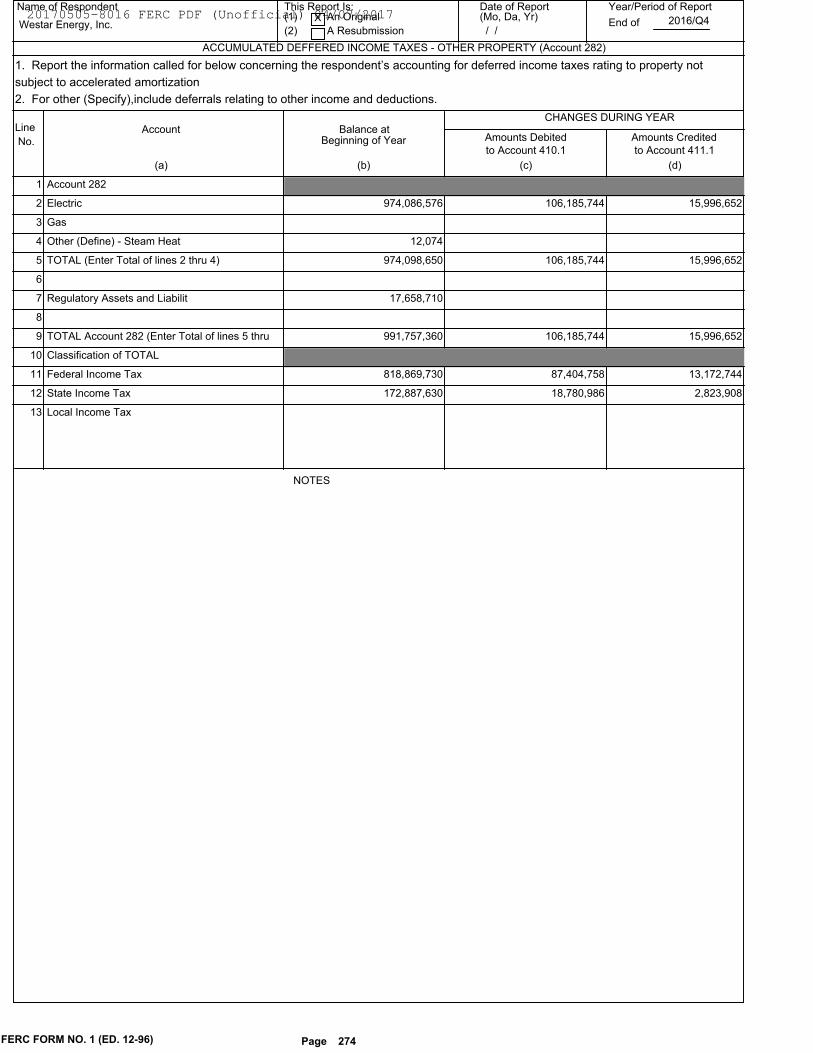
Name of Respondent This Report Is:(1) An Original
(2) A Resubmission
Date of Report(Mo, Da, Yr)
Year/Period of Report
End of
ACCUMULATED DEFFERED INCOME TAXES - OTHER PROPERTY (Account 282)
Westar Energy, Inc.X
/ /2016/Q4
Line
No.Account
(a) (b) (c) (d)
Balance atBeginning of Year
CHANGES DURING YEAR
Amounts Debited Amounts Credited
to Account 410.1 to Account 411.1
1. Report the information called for below concerning the respondent’s accounting for deferred income taxes rating to property not
subject to accelerated amortization
2. For other (Specify),include deferrals relating to other income and deductions.
Account 282 1
Electric 974,086,576 106,185,744 15,996,652 2
Gas 3
Other (Define) - Steam Heat 12,074 4
TOTAL (Enter Total of lines 2 thru 4) 974,098,650 106,185,744 15,996,652 5
6
Regulatory Assets and Liabilit 17,658,710 7
8
TOTAL Account 282 (Enter Total of lines 5 thru 991,757,360 106,185,744 15,996,652 9
Classification of TOTAL 10
Federal Income Tax 818,869,730 87,404,758 13,172,744 11
State Income Tax 172,887,630 18,780,986 2,823,908 12
Local Income Tax 13
FERC FORM NO. 1 (ED. 12-96) Page 274
NOTES
20170505-8016 FERC PDF (Unofficial) 04/07/2017
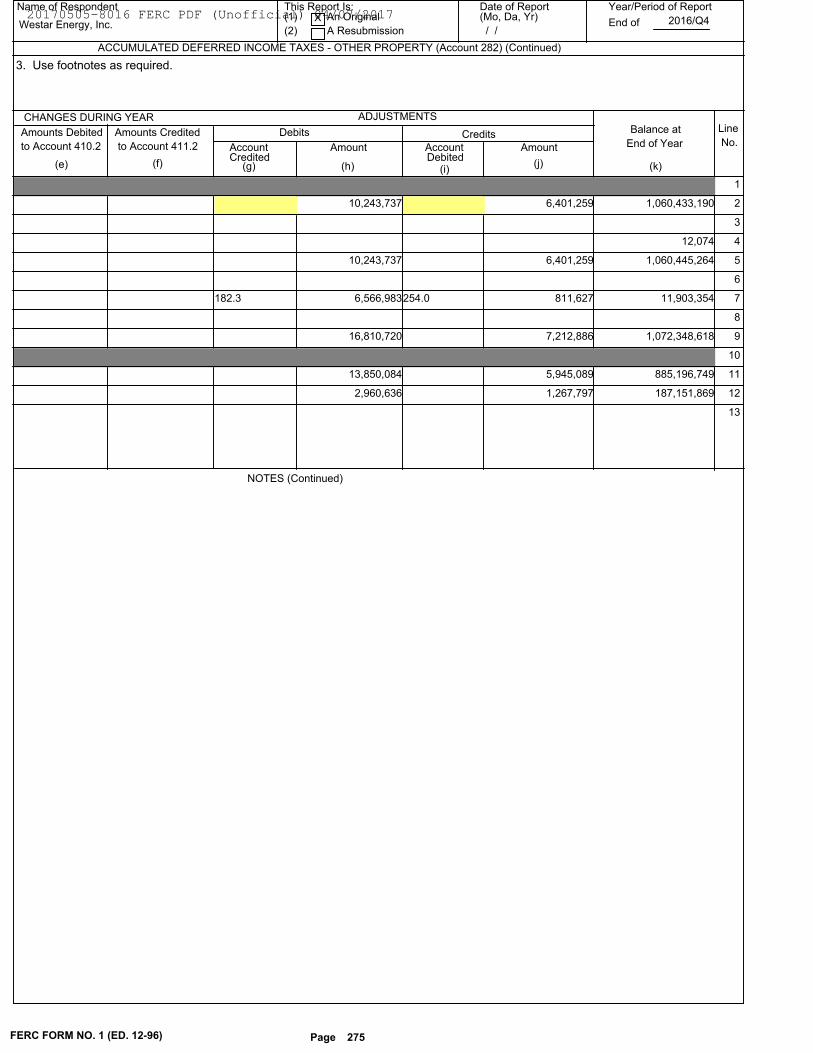
Name of Respondent This Report Is:(1) An Original
(2) A Resubmission
Date of Report(Mo, Da, Yr)
Year/Period of Report
End of
ACCUMULATED DEFERRED INCOME TAXES - OTHER PROPERTY (Account 282) (Continued)
Westar Energy, Inc.X
/ /2016/Q4
Line
No.
CHANGES DURING YEAR ADJUSTMENTS
Balance at
End of YearDebits CreditsAmounts Debited
to Account 410.2
Amounts Credited
to Account 411.2 AccountCredited
AmountDebitedAccount Amount
(e) (f) (h) (j) (k)(g) (i)
3. Use footnotes as required.
1
1,060,433,190 10,243,737 6,401,259 2
3
12,074 4
1,060,445,264 10,243,737 6,401,259 5
6
182.3 11,903,354 6,566,983254.0 811,627 7
8
1,072,348,618 16,810,720 7,212,886 9
10
885,196,749 13,850,084 5,945,089 11
187,151,869 2,960,636 1,267,797 12
13
FERC FORM NO. 1 (ED. 12-96) Page 275
NOTES (Continued)
20170505-8016 FERC PDF (Unofficial) 04/07/2017
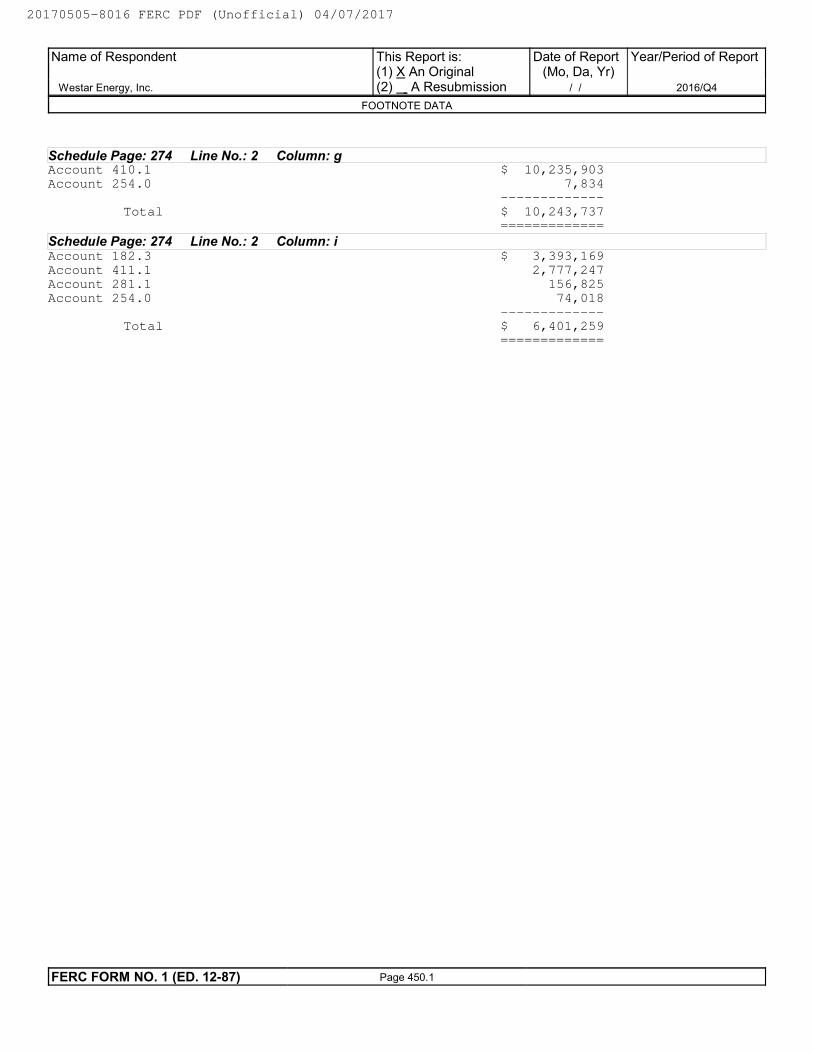
Schedule Page: 274 Line No.: 2 Column: gAccount 410.1 $ 10,235,903
Account 254.0 7,834
-------------
Total $ 10,243,737
=============
Schedule Page: 274 Line No.: 2 Column: iAccount 182.3 $ 3,393,169
Account 411.1 2,777,247
Account 281.1 156,825
Account 254.0 74,018
-------------
Total $ 6,401,259
=============
Name of Respondent
Westar Energy, Inc.
This Report is:(1) X An Original(2) A Resubmission
Date of Report(Mo, Da, Yr)
/ /
Year/Period of Report
2016/Q4
FOOTNOTE DATA
FERC FORM NO. 1 (ED. 12-87) Page 450.1
20170505-8016 FERC PDF (Unofficial) 04/07/2017
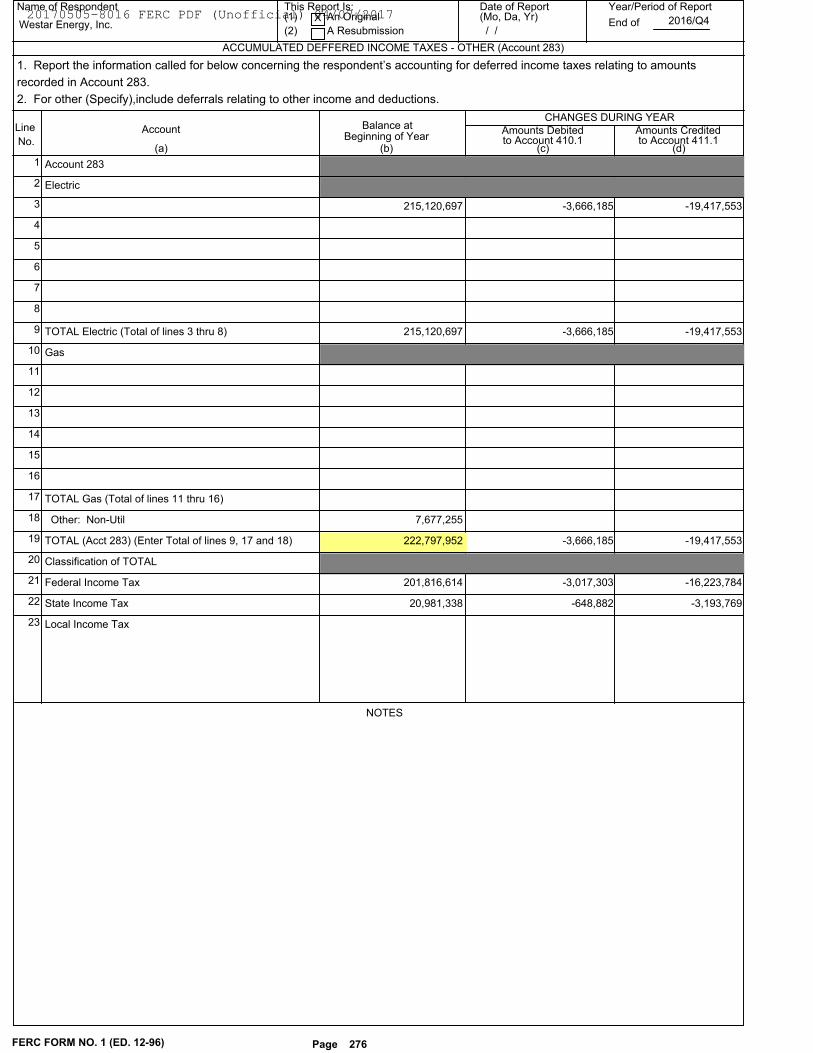
Name of Respondent This Report Is:(1) An Original
(2) A Resubmission
Date of Report(Mo, Da, Yr)
Year/Period of Report
End of
ACCUMULATED DEFFERED INCOME TAXES - OTHER (Account 283)
Westar Energy, Inc.X
/ /2016/Q4
Line
No.Account
(a) (b) (c) (d)
Balance atBeginning of Year
CHANGES DURING YEAR
Amounts Debited Amounts Credited to Account 410.1 to Account 411.1
1. Report the information called for below concerning the respondent’s accounting for deferred income taxes relating to amounts
recorded in Account 283.
2. For other (Specify),include deferrals relating to other income and deductions.
Account 283 1
Electric 2
-19,417,553 -3,666,185 215,120,697 3
4
5
6
7
8
-19,417,553 -3,666,185 215,120,697TOTAL Electric (Total of lines 3 thru 8) 9
Gas 10
11
12
13
14
15
16
TOTAL Gas (Total of lines 11 thru 16) 17
7,677,255 Other: Non-Util 18
-19,417,553 -3,666,185 222,797,952TOTAL (Acct 283) (Enter Total of lines 9, 17 and 18) 19
Classification of TOTAL 20
-16,223,784 -3,017,303 201,816,614Federal Income Tax 21
-3,193,769 -648,882 20,981,338State Income Tax 22
Local Income Tax 23
FERC FORM NO. 1 (ED. 12-96) Page 276
NOTES
20170505-8016 FERC PDF (Unofficial) 04/07/2017
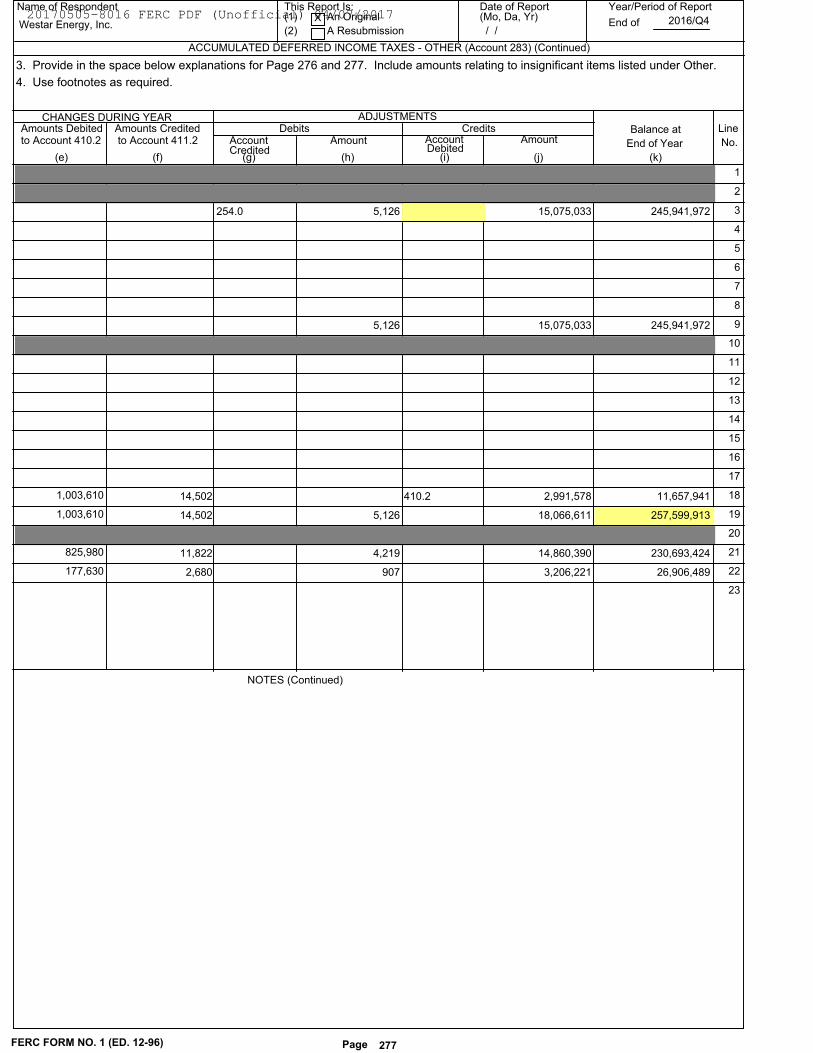
Name of Respondent This Report Is:(1) An Original
(2) A Resubmission
Date of Report(Mo, Da, Yr)
Year/Period of Report
End of
ACCUMULATED DEFERRED INCOME TAXES - OTHER (Account 283) (Continued)
Westar Energy, Inc.X
/ /2016/Q4
Line
No.
CHANGES DURING YEAR ADJUSTMENTS
Balance at
End of Year
Debits CreditsAmounts Debitedto Account 410.2
Amounts Credited to Account 411.2 Account
CreditedAmount
DebitedAccount Amount
(e) (f) (h) (j) (k)(g) (i)
3. Provide in the space below explanations for Page 276 and 277. Include amounts relating to insignificant items listed under Other.
4. Use footnotes as required.
1
2
245,941,972 15,075,033254.0 5,126 3
4
5
6
7
8
245,941,972 15,075,033 5,126 9
10
11
12
13
14
15
16
17
11,657,941 2,991,578410.2 14,502 1,003,610 18
257,599,913 18,066,611 14,502 1,003,610 5,126 19
20
230,693,424 14,860,390 11,822 825,980 4,219 21
26,906,489 3,206,221 2,680 177,630 907 22
23
FERC FORM NO. 1 (ED. 12-96) Page 277
NOTES (Continued)
20170505-8016 FERC PDF (Unofficial) 04/07/2017
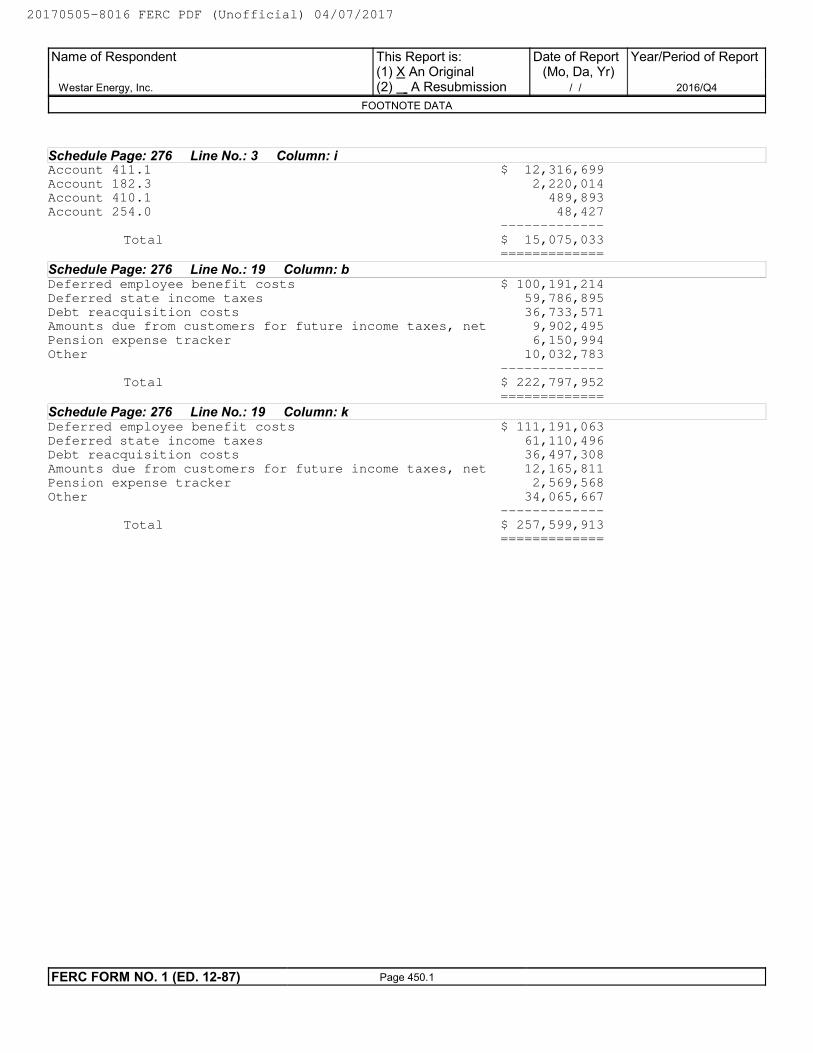
Schedule Page: 276 Line No.: 3 Column: iAccount 411.1 $ 12,316,699
Account 182.3 2,220,014Account 410.1 489,893
Account 254.0 48,427
-------------
Total $ 15,075,033
=============
Schedule Page: 276 Line No.: 19 Column: bDeferred employee benefit costs $ 100,191,214
Deferred state income taxes 59,786,895
Debt reacquisition costs 36,733,571Amounts due from customers for future income taxes, net 9,902,495
Pension expense tracker 6,150,994
Other 10,032,783
-------------
Total $ 222,797,952
=============
Schedule Page: 276 Line No.: 19 Column: kDeferred employee benefit costs $ 111,191,063
Deferred state income taxes 61,110,496Debt reacquisition costs 36,497,308
Amounts due from customers for future income taxes, net 12,165,811
Pension expense tracker 2,569,568
Other 34,065,667
-------------
Total $ 257,599,913
=============
Name of Respondent
Westar Energy, Inc.
This Report is:(1) X An Original(2) A Resubmission
Date of Report(Mo, Da, Yr)
/ /
Year/Period of Report
2016/Q4
FOOTNOTE DATA
FERC FORM NO. 1 (ED. 12-87) Page 450.1
20170505-8016 FERC PDF (Unofficial) 04/07/2017
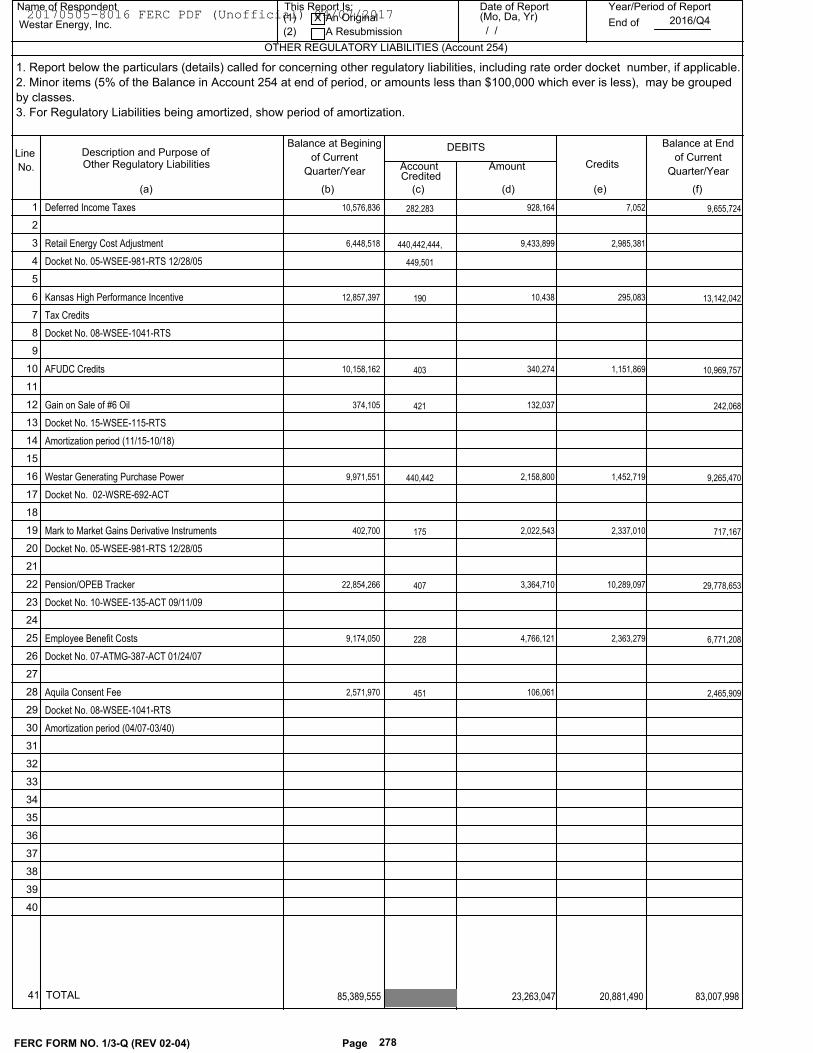
Name of Respondent This Report Is:(1) An Original
(2) A Resubmission
Date of Report(Mo, Da, Yr)
Year/Period of Report
End of
OTHER REGULATORY LIABILITIES (Account 254)
Westar Energy, Inc.X
/ /2016/Q4
Line
No.
Description and Purpose of DEBITS
CreditsAccount
(d)(c)(a)
Balance at End
of Current
Quarter/Year
(e)
Other Regulatory Liabilities Amount
(f)Credited
1. Report below the particulars (details) called for concerning other regulatory liabilities, including rate order docket number, if applicable.
2. Minor items (5% of the Balance in Account 254 at end of period, or amounts less than $100,000 which ever is less), may be grouped
by classes.
3. For Regulatory Liabilities being amortized, show period of amortization.
Balance at Begining
of Current
Quarter/Year
(b)
10,576,836 928,164 9,655,7247,052Deferred Income Taxes 282,283 1
2
6,448,518 9,433,899 2,985,381Retail Energy Cost Adjustment 440,442,444, 3
Docket No. 05-WSEE-981-RTS 12/28/05 449,501 4
5
12,857,397 10,438 13,142,042295,083Kansas High Performance Incentive 190 6
Tax Credits 7
Docket No. 08-WSEE-1041-RTS 8
9
10,158,162 340,274 10,969,7571,151,869AFUDC Credits 403 10
11
374,105 132,037 242,068Gain on Sale of #6 Oil 421 12
Docket No. 15-WSEE-115-RTS 13
Amortization period (11/15-10/18) 14
15
9,971,551 2,158,800 9,265,4701,452,719Westar Generating Purchase Power 440,442 16
Docket No. 02-WSRE-692-ACT 17
18
402,700 2,022,543 717,1672,337,010Mark to Market Gains Derivative Instruments 175 19
Docket No. 05-WSEE-981-RTS 12/28/05 20
21
22,854,266 3,364,710 29,778,65310,289,097Pension/OPEB Tracker 407 22
Docket No. 10-WSEE-135-ACT 09/11/09 23
24
9,174,050 4,766,121 6,771,2082,363,279Employee Benefit Costs 228 25
Docket No. 07-ATMG-387-ACT 01/24/07 26
27
2,571,970 106,061 2,465,909Aquila Consent Fee 451 28
Docket No. 08-WSEE-1041-RTS 29
Amortization period (04/07-03/40) 30
31
32
33
34
35
36
37
38
39
40
FERC FORM NO. 1/3-Q (REV 02-04) Page 278
41 TOTAL 20,881,490 23,263,047 83,007,998 85,389,555
20170505-8016 FERC PDF (Unofficial) 04/07/2017
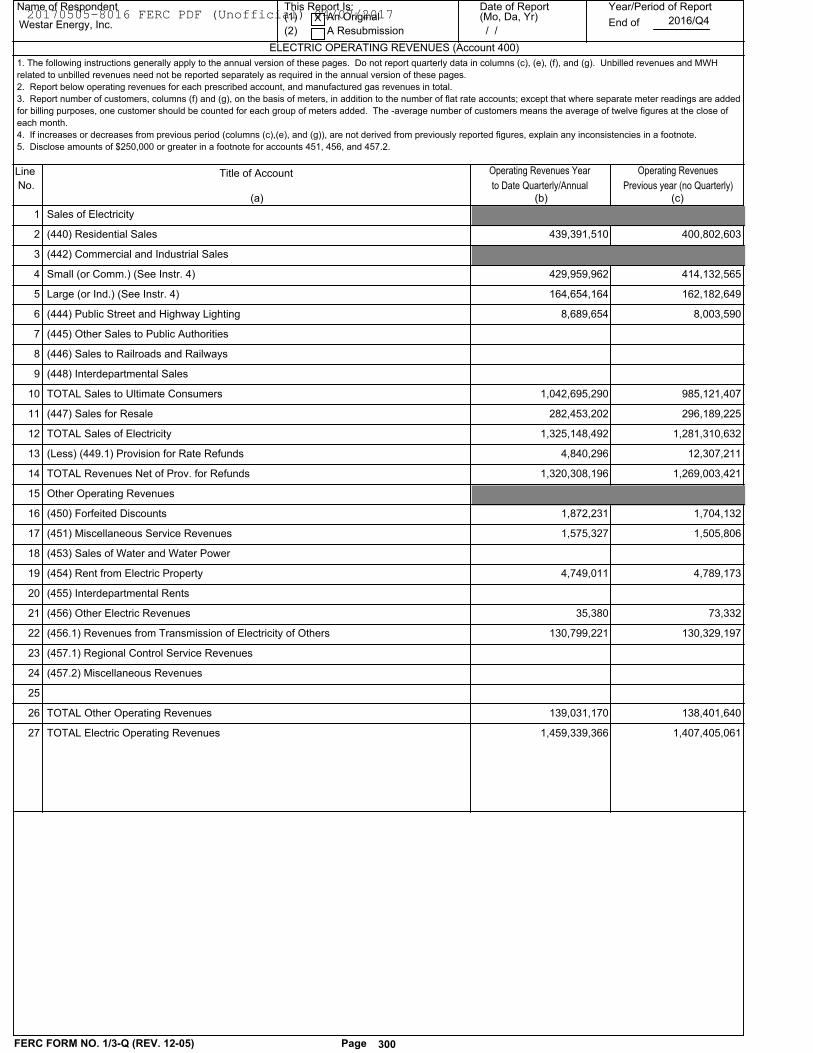
Name of Respondent This Report Is:(1) An Original
(2) A Resubmission
Date of Report(Mo, Da, Yr)
Year/Period of Report
End of
ELECTRIC OPERATING REVENUES (Account 400)
Westar Energy, Inc.X
/ /2016/Q4
Line
No.Title of Account
(c)(b)(a)
Operating Revenues Year
to Date Quarterly/Annual
1. The following instructions generally apply to the annual version of these pages. Do not report quarterly data in columns (c), (e), (f), and (g). Unbilled revenues and MWH
related to unbilled revenues need not be reported separately as required in the annual version of these pages.
2. Report below operating revenues for each prescribed account, and manufactured gas revenues in total.
3. Report number of customers, columns (f) and (g), on the basis of meters, in addition to the number of flat rate accounts; except that where separate meter readings are added
for billing purposes, one customer should be counted for each group of meters added. The -average number of customers means the average of twelve figures at the close of
each month.
4. If increases or decreases from previous period (columns (c),(e), and (g)), are not derived from previously reported figures, explain any inconsistencies in a footnote.
5. Disclose amounts of $250,000 or greater in a footnote for accounts 451, 456, and 457.2.
Operating Revenues
Previous year (no Quarterly)
Sales of Electricity 1
400,802,603(440) Residential Sales 439,391,510 2
(442) Commercial and Industrial Sales 3
414,132,565Small (or Comm.) (See Instr. 4) 429,959,962 4
162,182,649Large (or Ind.) (See Instr. 4) 164,654,164 5
8,003,590(444) Public Street and Highway Lighting 8,689,654 6
(445) Other Sales to Public Authorities 7
(446) Sales to Railroads and Railways 8
(448) Interdepartmental Sales 9
985,121,407TOTAL Sales to Ultimate Consumers 1,042,695,290 10
296,189,225(447) Sales for Resale 282,453,202 11
1,281,310,632TOTAL Sales of Electricity 1,325,148,492 12
12,307,211(Less) (449.1) Provision for Rate Refunds 4,840,296 13
1,269,003,421TOTAL Revenues Net of Prov. for Refunds 1,320,308,196 14
Other Operating Revenues 15
1,704,132(450) Forfeited Discounts 1,872,231 16
1,505,806(451) Miscellaneous Service Revenues 1,575,327 17
(453) Sales of Water and Water Power 18
4,789,173(454) Rent from Electric Property 4,749,011 19
(455) Interdepartmental Rents 20
73,332(456) Other Electric Revenues 35,380 21
130,329,197(456.1) Revenues from Transmission of Electricity of Others 130,799,221 22
(457.1) Regional Control Service Revenues 23
(457.2) Miscellaneous Revenues 24
25
138,401,640TOTAL Other Operating Revenues 139,031,170 26
1,407,405,061TOTAL Electric Operating Revenues 1,459,339,366 27
Page 300FERC FORM NO. 1/3-Q (REV. 12-05)
20170505-8016 FERC PDF (Unofficial) 04/07/2017
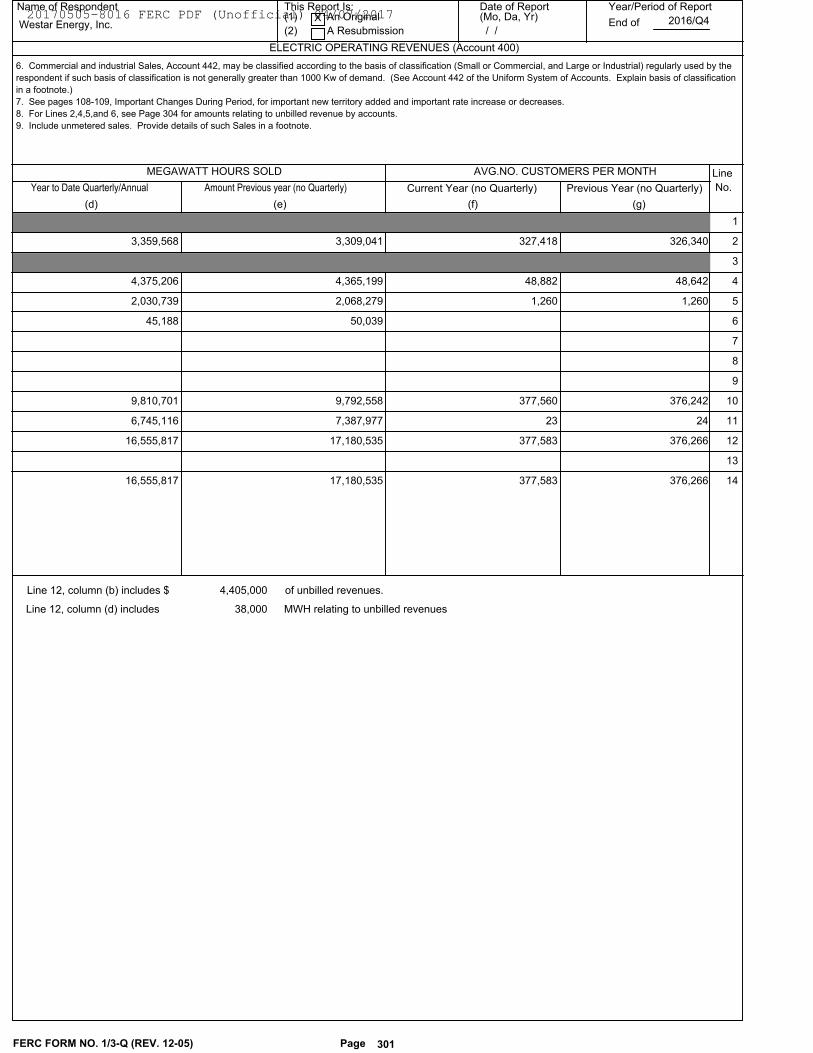
Name of Respondent This Report Is:(1) An Original
(2) A Resubmission
Date of Report(Mo, Da, Yr)
Year/Period of Report
End of
ELECTRIC OPERATING REVENUES (Account 400)
Westar Energy, Inc.X
/ /2016/Q4
Line
No.
MEGAWATT HOURS SOLD
Previous Year (no Quarterly)Current Year (no Quarterly)
AVG.NO. CUSTOMERS PER MONTH
Year to Date Quarterly/Annual Amount Previous year (no Quarterly)
(d) (e) (f) (g)
6. Commercial and industrial Sales, Account 442, may be classified according to the basis of classification (Small or Commercial, and Large or Industrial) regularly used by the
respondent if such basis of classification is not generally greater than 1000 Kw of demand. (See Account 442 of the Uniform System of Accounts. Explain basis of classification
in a footnote.)
7. See pages 108-109, Important Changes During Period, for important new territory added and important rate increase or decreases.
8. For Lines 2,4,5,and 6, see Page 304 for amounts relating to unbilled revenue by accounts.
9. Include unmetered sales. Provide details of such Sales in a footnote.
1
3,309,041 326,340 327,418 3,359,568 2
3
4,365,199 48,642 48,882 4,375,206 4
2,068,279 1,260 1,260 2,030,739 5
50,039 45,188 6
7
8
9
9,792,558 376,242 377,560 9,810,701 10
7,387,977 24 23 6,745,116 11
17,180,535 376,266 377,583 16,555,817 12
13
17,180,535 376,266 377,583 16,555,817 14
Page 301
Line 12, column (b) includes $ of unbilled revenues.
Line 12, column (d) includes MWH relating to unbilled revenues
4,405,000
38,000
FERC FORM NO. 1/3-Q (REV. 12-05)
20170505-8016 FERC PDF (Unofficial) 04/07/2017
Name of Respondent This Report Is:(1) An Original
(2) A Resubmission
Date of Report(Mo, Da, Yr)
Year/Period of Report
End ofWestar Energy, Inc.X
/ /2016/Q4
Line
No.Description of Service
(a)
REGIONAL TRANSMISSION SERVICE REVENUES (Account 457.1)
1. The respondent shall report below the revenue collected for each service (i.e., control area administration, market administration,
etc.) performed pursuant to a Commission approved tariff. All amounts separately billed must be detailed below.
Balance at End of
(c)(b)
Balance at End ofQuarter 1 Quarter 2
Balance at End ofQuarter 3
(d) (e)
Balance at End ofYear
1
2
3
4
5
6
7
8
9
10
11
12
13
14
15
16
17
18
19
20
21
22
23
24
25
26
27
28
29
30
31
32
33
34
35
36
37
38
39
40
41
42
43
44
45
FERC FORM NO. 1/3-Q (NEW. 12-05) Page 302
46 TOTAL
20170505-8016 FERC PDF (Unofficial) 04/07/2017
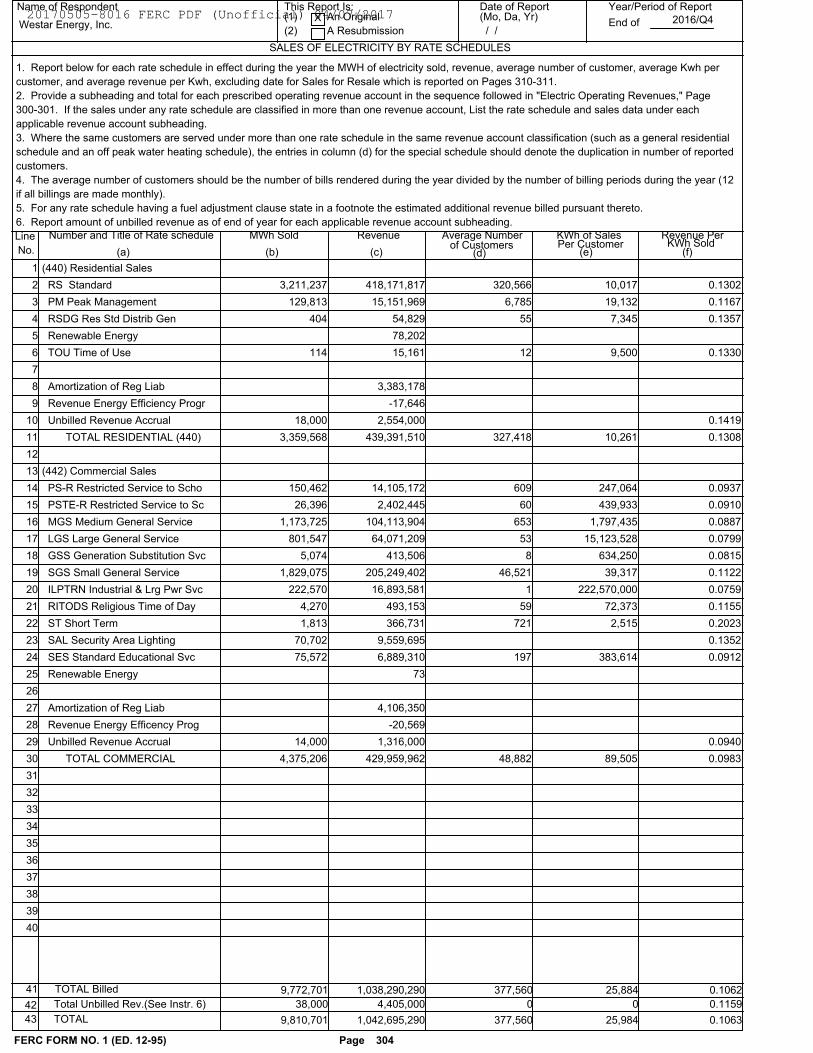
Name of Respondent This Report Is:(1) An Original
(2) A Resubmission
Date of Report(Mo, Da, Yr)
Year/Period of Report
End of
SALES OF ELECTRICITY BY RATE SCHEDULES
Westar Energy, Inc.X
/ /2016/Q4
Line
No.
Number and Title of Rate schedule MWh Sold
(b)(a)
Revenue
(c)
Average Numberof Customers
(d)
KWh of SalesPer Customer
(e)
Revenue PerKWh Sold
(f)
1. Report below for each rate schedule in effect during the year the MWH of electricity sold, revenue, average number of customer, average Kwh per
customer, and average revenue per Kwh, excluding date for Sales for Resale which is reported on Pages 310-311.
2. Provide a subheading and total for each prescribed operating revenue account in the sequence followed in "Electric Operating Revenues," Page
300-301. If the sales under any rate schedule are classified in more than one revenue account, List the rate schedule and sales data under each
applicable revenue account subheading.
3. Where the same customers are served under more than one rate schedule in the same revenue account classification (such as a general residential
schedule and an off peak water heating schedule), the entries in column (d) for the special schedule should denote the duplication in number of reported
customers.
4. The average number of customers should be the number of bills rendered during the year divided by the number of billing periods during the year (12
if all billings are made monthly).
5. For any rate schedule having a fuel adjustment clause state in a footnote the estimated additional revenue billed pursuant thereto.
6. Report amount of unbilled revenue as of end of year for each applicable revenue account subheading.
1 (440) Residential Sales
3,211,237 320,566 10,017 0.1302 418,171,817 2 RS Standard
129,813 6,785 19,132 0.1167 15,151,969 3 PM Peak Management
404 55 7,345 0.1357 54,829 4 RSDG Res Std Distrib Gen
78,202 5 Renewable Energy
114 12 9,500 0.1330 15,161 6 TOU Time of Use
7
3,383,178 8 Amortization of Reg Liab
-17,646 9 Revenue Energy Efficiency Progr
18,000 0.1419 2,554,000 10 Unbilled Revenue Accrual
3,359,568 327,418 10,261 0.1308 439,391,510 11 TOTAL RESIDENTIAL (440)
12
13 (442) Commercial Sales
150,462 609 247,064 0.0937 14,105,172 14 PS-R Restricted Service to Scho
26,396 60 439,933 0.0910 2,402,445 15 PSTE-R Restricted Service to Sc
1,173,725 653 1,797,435 0.0887 104,113,904 16 MGS Medium General Service
801,547 53 15,123,528 0.0799 64,071,209 17 LGS Large General Service
5,074 8 634,250 0.0815 413,506 18 GSS Generation Substitution Svc
1,829,075 46,521 39,317 0.1122 205,249,402 19 SGS Small General Service
222,570 1 222,570,000 0.0759 16,893,581 20 ILPTRN Industrial & Lrg Pwr Svc
4,270 59 72,373 0.1155 493,153 21 RITODS Religious Time of Day
1,813 721 2,515 0.2023 366,731 22 ST Short Term
70,702 0.1352 9,559,695 23 SAL Security Area Lighting
75,572 197 383,614 0.0912 6,889,310 24 SES Standard Educational Svc
73 25 Renewable Energy
26
4,106,350 27 Amortization of Reg Liab
-20,569 28 Revenue Energy Efficency Prog
14,000 0.0940 1,316,000 29 Unbilled Revenue Accrual
4,375,206 48,882 89,505 0.0983 429,959,962 30 TOTAL COMMERCIAL
31
32
33
34
35
36
37
38
39
40
9,810,701 1,042,695,290 377,560 25,984 0.1063
38,000 4,405,000 0 0 0.1159
9,772,701 1,038,290,290 377,560 25,884 0.1062
FERC FORM NO. 1 (ED. 12-95) Page 304
41 TOTAL Billed
42 Total Unbilled Rev.(See Instr. 6)
43 TOTAL
20170505-8016 FERC PDF (Unofficial) 04/07/2017
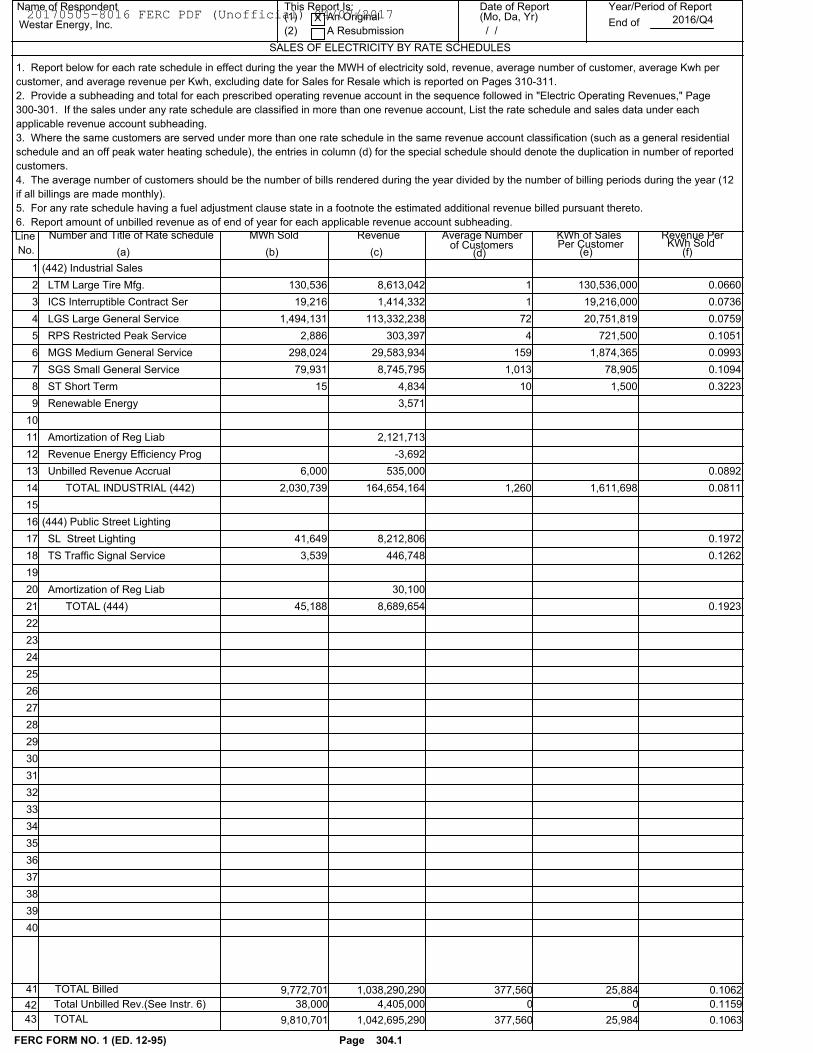
Name of Respondent This Report Is:(1) An Original
(2) A Resubmission
Date of Report(Mo, Da, Yr)
Year/Period of Report
End of
SALES OF ELECTRICITY BY RATE SCHEDULES
Westar Energy, Inc.X
/ /2016/Q4
Line
No.
Number and Title of Rate schedule MWh Sold
(b)(a)
Revenue
(c)
Average Numberof Customers
(d)
KWh of SalesPer Customer
(e)
Revenue PerKWh Sold
(f)
1. Report below for each rate schedule in effect during the year the MWH of electricity sold, revenue, average number of customer, average Kwh per
customer, and average revenue per Kwh, excluding date for Sales for Resale which is reported on Pages 310-311.
2. Provide a subheading and total for each prescribed operating revenue account in the sequence followed in "Electric Operating Revenues," Page
300-301. If the sales under any rate schedule are classified in more than one revenue account, List the rate schedule and sales data under each
applicable revenue account subheading.
3. Where the same customers are served under more than one rate schedule in the same revenue account classification (such as a general residential
schedule and an off peak water heating schedule), the entries in column (d) for the special schedule should denote the duplication in number of reported
customers.
4. The average number of customers should be the number of bills rendered during the year divided by the number of billing periods during the year (12
if all billings are made monthly).
5. For any rate schedule having a fuel adjustment clause state in a footnote the estimated additional revenue billed pursuant thereto.
6. Report amount of unbilled revenue as of end of year for each applicable revenue account subheading.
1 (442) Industrial Sales
130,536 1 130,536,000 0.0660 8,613,042 2 LTM Large Tire Mfg.
19,216 1 19,216,000 0.0736 1,414,332 3 ICS Interruptible Contract Ser
1,494,131 72 20,751,819 0.0759 113,332,238 4 LGS Large General Service
2,886 4 721,500 0.1051 303,397 5 RPS Restricted Peak Service
298,024 159 1,874,365 0.0993 29,583,934 6 MGS Medium General Service
79,931 1,013 78,905 0.1094 8,745,795 7 SGS Small General Service
15 10 1,500 0.3223 4,834 8 ST Short Term
3,571 9 Renewable Energy
10
2,121,713 11 Amortization of Reg Liab
-3,692 12 Revenue Energy Efficiency Prog
6,000 0.0892 535,000 13 Unbilled Revenue Accrual
2,030,739 1,260 1,611,698 0.0811 164,654,164 14 TOTAL INDUSTRIAL (442)
15
16 (444) Public Street Lighting
41,649 0.1972 8,212,806 17 SL Street Lighting
3,539 0.1262 446,748 18 TS Traffic Signal Service
19
30,100 20 Amortization of Reg Liab
45,188 0.1923 8,689,654 21 TOTAL (444)
22
23
24
25
26
27
28
29
30
31
32
33
34
35
36
37
38
39
40
9,810,701 1,042,695,290 377,560 25,984 0.1063
38,000 4,405,000 0 0 0.1159
9,772,701 1,038,290,290 377,560 25,884 0.1062
FERC FORM NO. 1 (ED. 12-95) Page 304.1
41 TOTAL Billed
42 Total Unbilled Rev.(See Instr. 6)
43 TOTAL
20170505-8016 FERC PDF (Unofficial) 04/07/2017
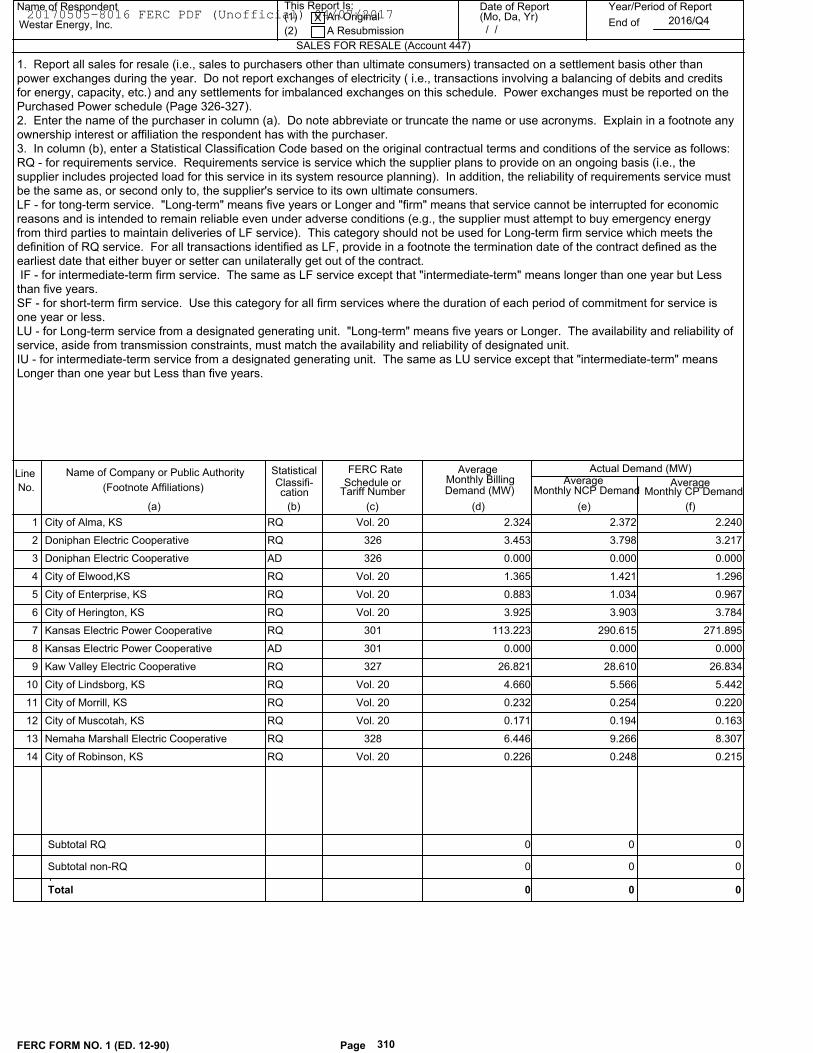
Name of Respondent This Report Is:(1) An Original
(2) A Resubmission
Date of Report(Mo, Da, Yr)
Year/Period of Report
End of
SALES FOR RESALE (Account 447)
Westar Energy, Inc.X
/ /2016/Q4
Line
No.
Name of Company or Public Authority
(c)(b)(a)
FERC RateMonthly Billing
Average
(d)
Statistical
cationClassifi- Schedule or
Tariff Number Demand (MW)
(e) (f)
(Footnote Affiliations)
Actual Demand (MW)Average Average
Monthly NCP Demand Monthly CP Demand
1. Report all sales for resale (i.e., sales to purchasers other than ultimate consumers) transacted on a settlement basis other than
power exchanges during the year. Do not report exchanges of electricity ( i.e., transactions involving a balancing of debits and credits
for energy, capacity, etc.) and any settlements for imbalanced exchanges on this schedule. Power exchanges must be reported on the
Purchased Power schedule (Page 326-327).
2. Enter the name of the purchaser in column (a). Do note abbreviate or truncate the name or use acronyms. Explain in a footnote any
ownership interest or affiliation the respondent has with the purchaser.
3. In column (b), enter a Statistical Classification Code based on the original contractual terms and conditions of the service as follows:
RQ - for requirements service. Requirements service is service which the supplier plans to provide on an ongoing basis (i.e., the
supplier includes projected load for this service in its system resource planning). In addition, the reliability of requirements service must
be the same as, or second only to, the supplier's service to its own ultimate consumers.
LF - for tong-term service. "Long-term" means five years or Longer and "firm" means that service cannot be interrupted for economic
reasons and is intended to remain reliable even under adverse conditions (e.g., the supplier must attempt to buy emergency energy
from third parties to maintain deliveries of LF service). This category should not be used for Long-term firm service which meets the
definition of RQ service. For all transactions identified as LF, provide in a footnote the termination date of the contract defined as the
earliest date that either buyer or setter can unilaterally get out of the contract.
IF - for intermediate-term firm service. The same as LF service except that "intermediate-term" means longer than one year but Less
than five years.
SF - for short-term firm service. Use this category for all firm services where the duration of each period of commitment for service is
one year or less.
LU - for Long-term service from a designated generating unit. "Long-term" means five years or Longer. The availability and reliability of
service, aside from transmission constraints, must match the availability and reliability of designated unit.
IU - for intermediate-term service from a designated generating unit. The same as LU service except that "intermediate-term" means
Longer than one year but Less than five years.
City of Alma, KS 2.2402.3722.324Vol. 20RQ 1
Doniphan Electric Cooperative 3.2173.7983.453326RQ 2
Doniphan Electric Cooperative 0.0000.0000.000326AD 3
City of Elwood,KS 1.2961.4211.365Vol. 20RQ 4
City of Enterprise, KS 0.9671.0340.883Vol. 20RQ 5
City of Herington, KS 3.7843.9033.925Vol. 20RQ 6
Kansas Electric Power Cooperative 271.895290.615113.223301RQ 7
Kansas Electric Power Cooperative 0.0000.0000.000301AD 8
Kaw Valley Electric Cooperative 26.83428.61026.821327RQ 9
City of Lindsborg, KS 5.4425.5664.660Vol. 20RQ 10
City of Morrill, KS 0.2200.2540.232Vol. 20RQ 11
City of Muscotah, KS 0.1630.1940.171Vol. 20RQ 12
Nemaha Marshall Electric Cooperative 8.3079.2666.446328RQ 13
City of Robinson, KS 0.2150.2480.226Vol. 20RQ 14
FERC FORM NO. 1 (ED. 12-90) Page 310
0
0
0
Subtotal RQ
Subtotal non-RQ
Total
0 0
0
0
0
0
20170505-8016 FERC PDF (Unofficial) 04/07/2017
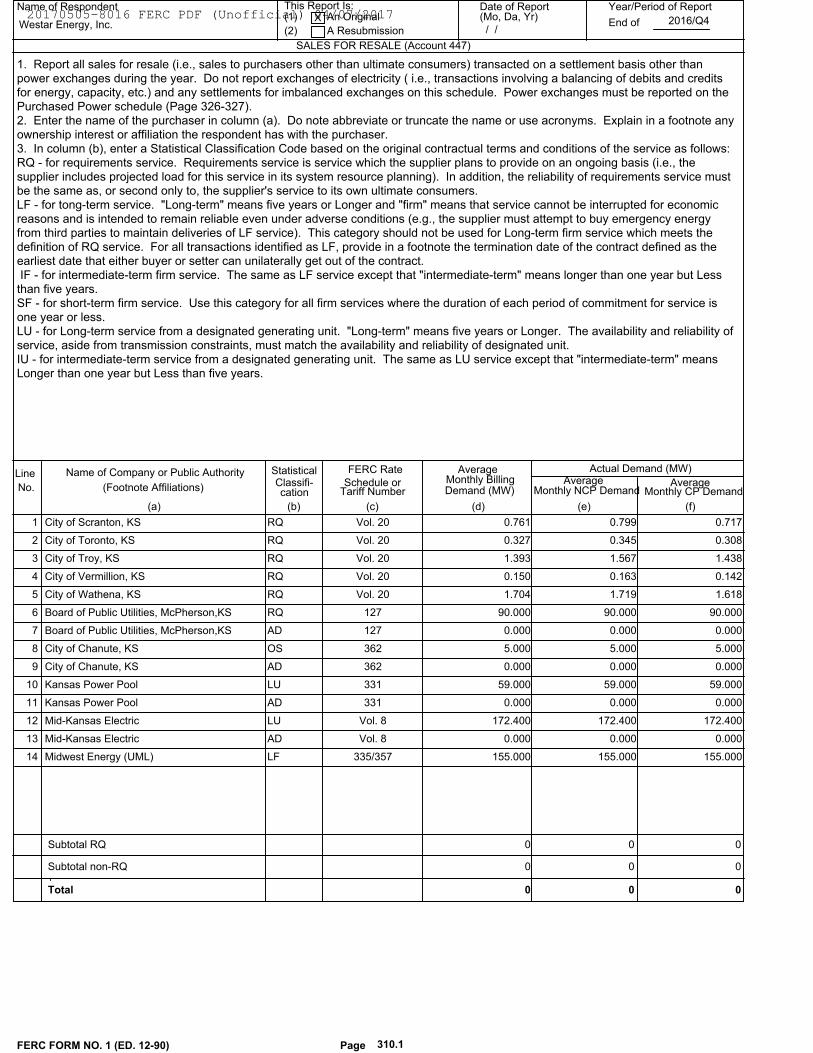
Name of Respondent This Report Is:(1) An Original
(2) A Resubmission
Date of Report(Mo, Da, Yr)
Year/Period of Report
End of
SALES FOR RESALE (Account 447)
Westar Energy, Inc.X
/ /2016/Q4
Line
No.
Name of Company or Public Authority
(c)(b)(a)
FERC RateMonthly Billing
Average
(d)
Statistical
cationClassifi- Schedule or
Tariff Number Demand (MW)
(e) (f)
(Footnote Affiliations)
Actual Demand (MW)Average Average
Monthly NCP Demand Monthly CP Demand
1. Report all sales for resale (i.e., sales to purchasers other than ultimate consumers) transacted on a settlement basis other than
power exchanges during the year. Do not report exchanges of electricity ( i.e., transactions involving a balancing of debits and credits
for energy, capacity, etc.) and any settlements for imbalanced exchanges on this schedule. Power exchanges must be reported on the
Purchased Power schedule (Page 326-327).
2. Enter the name of the purchaser in column (a). Do note abbreviate or truncate the name or use acronyms. Explain in a footnote any
ownership interest or affiliation the respondent has with the purchaser.
3. In column (b), enter a Statistical Classification Code based on the original contractual terms and conditions of the service as follows:
RQ - for requirements service. Requirements service is service which the supplier plans to provide on an ongoing basis (i.e., the
supplier includes projected load for this service in its system resource planning). In addition, the reliability of requirements service must
be the same as, or second only to, the supplier's service to its own ultimate consumers.
LF - for tong-term service. "Long-term" means five years or Longer and "firm" means that service cannot be interrupted for economic
reasons and is intended to remain reliable even under adverse conditions (e.g., the supplier must attempt to buy emergency energy
from third parties to maintain deliveries of LF service). This category should not be used for Long-term firm service which meets the
definition of RQ service. For all transactions identified as LF, provide in a footnote the termination date of the contract defined as the
earliest date that either buyer or setter can unilaterally get out of the contract.
IF - for intermediate-term firm service. The same as LF service except that "intermediate-term" means longer than one year but Less
than five years.
SF - for short-term firm service. Use this category for all firm services where the duration of each period of commitment for service is
one year or less.
LU - for Long-term service from a designated generating unit. "Long-term" means five years or Longer. The availability and reliability of
service, aside from transmission constraints, must match the availability and reliability of designated unit.
IU - for intermediate-term service from a designated generating unit. The same as LU service except that "intermediate-term" means
Longer than one year but Less than five years.
City of Scranton, KS 0.7170.7990.761Vol. 20RQ 1
City of Toronto, KS 0.3080.3450.327Vol. 20RQ 2
City of Troy, KS 1.4381.5671.393Vol. 20RQ 3
City of Vermillion, KS 0.1420.1630.150Vol. 20RQ 4
City of Wathena, KS 1.6181.7191.704Vol. 20RQ 5
Board of Public Utilities, McPherson,KS 90.00090.00090.000127RQ 6
Board of Public Utilities, McPherson,KS 0.0000.0000.000127AD 7
City of Chanute, KS 5.0005.0005.000362OS 8
City of Chanute, KS 0.0000.0000.000362AD 9
Kansas Power Pool 59.00059.00059.000331LU 10
Kansas Power Pool 0.0000.0000.000331AD 11
Mid-Kansas Electric 172.400172.400172.400Vol. 8LU 12
Mid-Kansas Electric 0.0000.0000.000Vol. 8AD 13
Midwest Energy (UML) 155.000155.000155.000335/357LF 14
FERC FORM NO. 1 (ED. 12-90) Page 310.1
0
0
0
Subtotal RQ
Subtotal non-RQ
Total
0 0
0
0
0
0
20170505-8016 FERC PDF (Unofficial) 04/07/2017
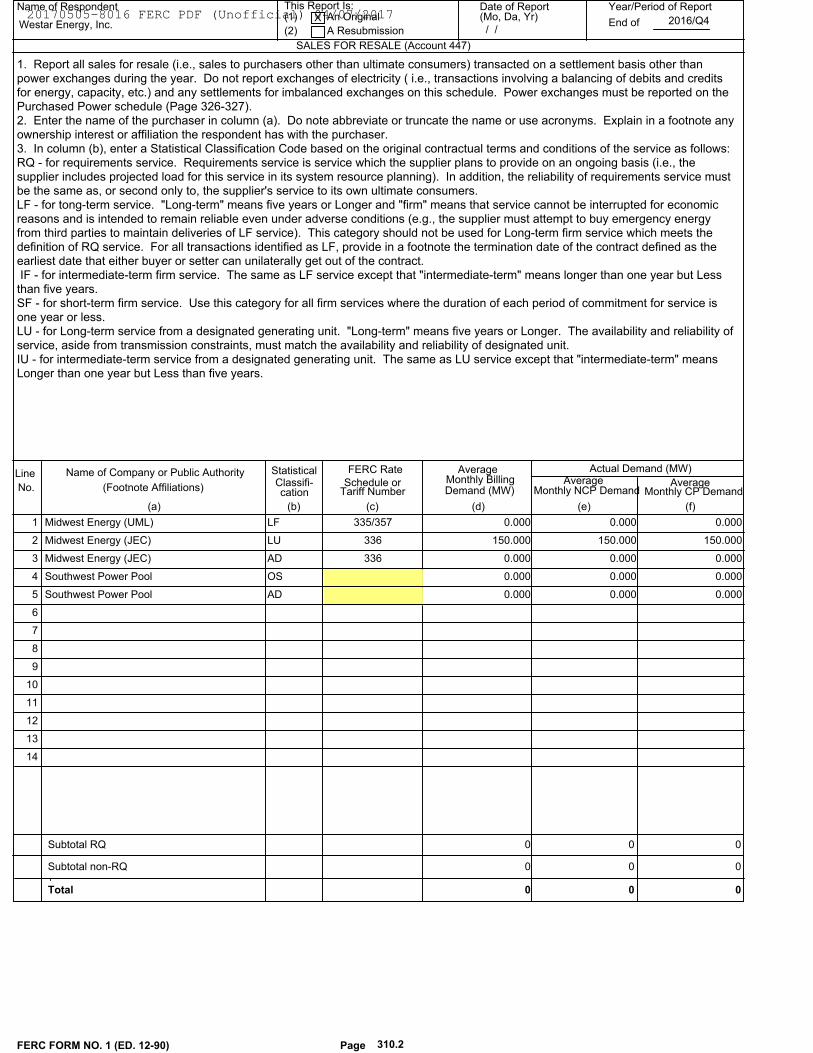
Name of Respondent This Report Is:(1) An Original
(2) A Resubmission
Date of Report(Mo, Da, Yr)
Year/Period of Report
End of
SALES FOR RESALE (Account 447)
Westar Energy, Inc.X
/ /2016/Q4
Line
No.
Name of Company or Public Authority
(c)(b)(a)
FERC RateMonthly Billing
Average
(d)
Statistical
cationClassifi- Schedule or
Tariff Number Demand (MW)
(e) (f)
(Footnote Affiliations)
Actual Demand (MW)Average Average
Monthly NCP Demand Monthly CP Demand
1. Report all sales for resale (i.e., sales to purchasers other than ultimate consumers) transacted on a settlement basis other than
power exchanges during the year. Do not report exchanges of electricity ( i.e., transactions involving a balancing of debits and credits
for energy, capacity, etc.) and any settlements for imbalanced exchanges on this schedule. Power exchanges must be reported on the
Purchased Power schedule (Page 326-327).
2. Enter the name of the purchaser in column (a). Do note abbreviate or truncate the name or use acronyms. Explain in a footnote any
ownership interest or affiliation the respondent has with the purchaser.
3. In column (b), enter a Statistical Classification Code based on the original contractual terms and conditions of the service as follows:
RQ - for requirements service. Requirements service is service which the supplier plans to provide on an ongoing basis (i.e., the
supplier includes projected load for this service in its system resource planning). In addition, the reliability of requirements service must
be the same as, or second only to, the supplier's service to its own ultimate consumers.
LF - for tong-term service. "Long-term" means five years or Longer and "firm" means that service cannot be interrupted for economic
reasons and is intended to remain reliable even under adverse conditions (e.g., the supplier must attempt to buy emergency energy
from third parties to maintain deliveries of LF service). This category should not be used for Long-term firm service which meets the
definition of RQ service. For all transactions identified as LF, provide in a footnote the termination date of the contract defined as the
earliest date that either buyer or setter can unilaterally get out of the contract.
IF - for intermediate-term firm service. The same as LF service except that "intermediate-term" means longer than one year but Less
than five years.
SF - for short-term firm service. Use this category for all firm services where the duration of each period of commitment for service is
one year or less.
LU - for Long-term service from a designated generating unit. "Long-term" means five years or Longer. The availability and reliability of
service, aside from transmission constraints, must match the availability and reliability of designated unit.
IU - for intermediate-term service from a designated generating unit. The same as LU service except that "intermediate-term" means
Longer than one year but Less than five years.
Midwest Energy (UML) 0.0000.0000.000335/357LF 1
Midwest Energy (JEC) 150.000150.000150.000336LU 2
Midwest Energy (JEC) 0.0000.0000.000336AD 3
Southwest Power Pool 0.0000.0000.000OS 4
Southwest Power Pool 0.0000.0000.000AD 5
6
7
8
9
10
11
12
13
14
FERC FORM NO. 1 (ED. 12-90) Page 310.2
0
0
0
Subtotal RQ
Subtotal non-RQ
Total
0 0
0
0
0
0
20170505-8016 FERC PDF (Unofficial) 04/07/2017
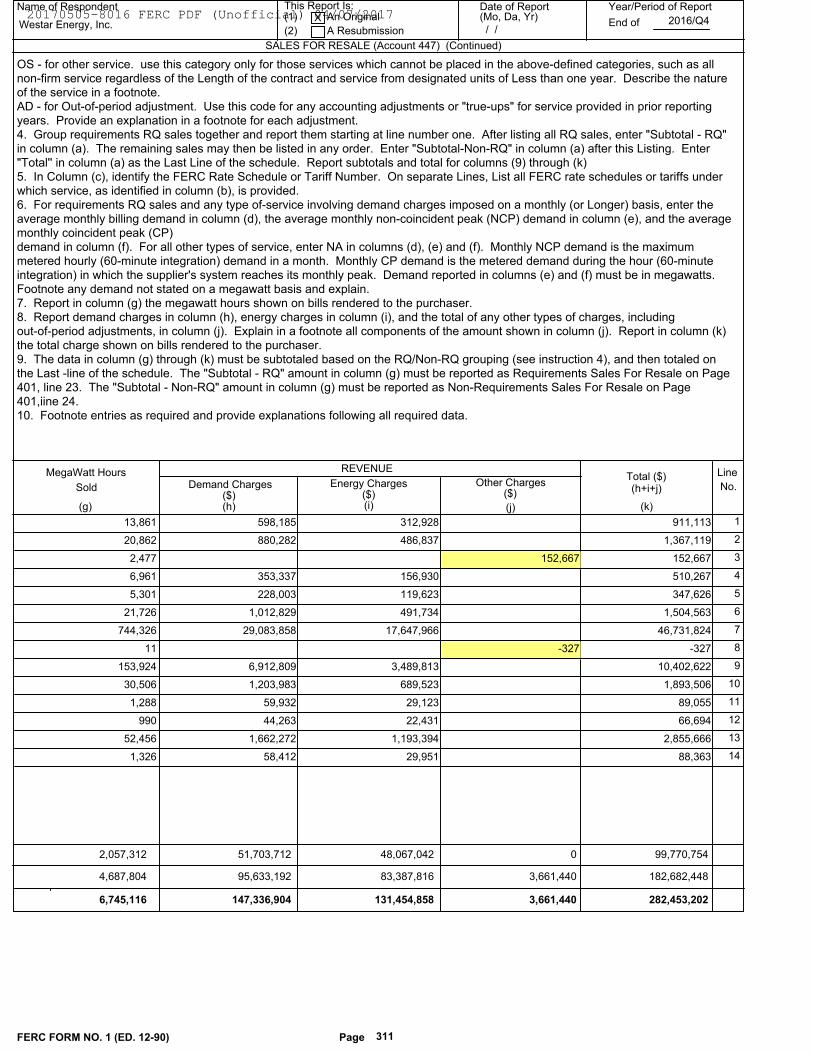
Name of Respondent This Report Is:(1) An Original
(2) A Resubmission
Date of Report(Mo, Da, Yr)
Year/Period of Report
End of
SALES FOR RESALE (Account 447) (Continued)
Westar Energy, Inc.X
/ /2016/Q4
Line
No.
MegaWatt Hours
(i)(h)(g) (j)
Demand Charges Energy Charges Other Charges
(k)
Sold (h+i+j)Total ($)
REVENUE
($) ($) ($)
OS - for other service. use this category only for those services which cannot be placed in the above-defined categories, such as allnon-firm service regardless of the Length of the contract and service from designated units of Less than one year. Describe the natureof the service in a footnote.AD - for Out-of-period adjustment. Use this code for any accounting adjustments or "true-ups" for service provided in prior reportingyears. Provide an explanation in a footnote for each adjustment.4. Group requirements RQ sales together and report them starting at line number one. After listing all RQ sales, enter "Subtotal - RQ"in column (a). The remaining sales may then be listed in any order. Enter "Subtotal-Non-RQ" in column (a) after this Listing. Enter"Total'' in column (a) as the Last Line of the schedule. Report subtotals and total for columns (9) through (k)5. In Column (c), identify the FERC Rate Schedule or Tariff Number. On separate Lines, List all FERC rate schedules or tariffs underwhich service, as identified in column (b), is provided.6. For requirements RQ sales and any type of-service involving demand charges imposed on a monthly (or Longer) basis, enter theaverage monthly billing demand in column (d), the average monthly non-coincident peak (NCP) demand in column (e), and the averagemonthly coincident peak (CP)demand in column (f). For all other types of service, enter NA in columns (d), (e) and (f). Monthly NCP demand is the maximummetered hourly (60-minute integration) demand in a month. Monthly CP demand is the metered demand during the hour (60-minuteintegration) in which the supplier's system reaches its monthly peak. Demand reported in columns (e) and (f) must be in megawatts.Footnote any demand not stated on a megawatt basis and explain.7. Report in column (g) the megawatt hours shown on bills rendered to the purchaser.8. Report demand charges in column (h), energy charges in column (i), and the total of any other types of charges, includingout-of-period adjustments, in column (j). Explain in a footnote all components of the amount shown in column (j). Report in column (k)the total charge shown on bills rendered to the purchaser.9. The data in column (g) through (k) must be subtotaled based on the RQ/Non-RQ grouping (see instruction 4), and then totaled onthe Last -line of the schedule. The "Subtotal - RQ" amount in column (g) must be reported as Requirements Sales For Resale on Page401, line 23. The "Subtotal - Non-RQ" amount in column (g) must be reported as Non-Requirements Sales For Resale on Page401,iine 24.10. Footnote entries as required and provide explanations following all required data.
312,928 598,185 911,113 13,861 1
486,837 880,282 1,367,119 20,862 2
152,667 152,667 2,477 3
156,930 353,337 510,267 6,961 4
119,623 228,003 347,626 5,301 5
491,734 1,012,829 1,504,563 21,726 6
17,647,966 29,083,858 46,731,824 744,326 7
-327 -327 11 8
3,489,813 6,912,809 10,402,622 153,924 9
689,523 1,203,983 1,893,506 30,506 10
29,123 59,932 89,055 1,288 11
22,431 44,263 66,694 990 12
1,193,394 1,662,272 2,855,666 52,456 13
29,951 58,412 88,363 1,326 14
FERC FORM NO. 1 (ED. 12-90) Page 311
48,067,042
83,387,816
131,454,858
2,057,312
4,687,804
6,745,116
0 99,770,754
3,661,440
3,661,440
182,682,448
282,453,202
51,703,712
95,633,192
147,336,904
20170505-8016 FERC PDF (Unofficial) 04/07/2017
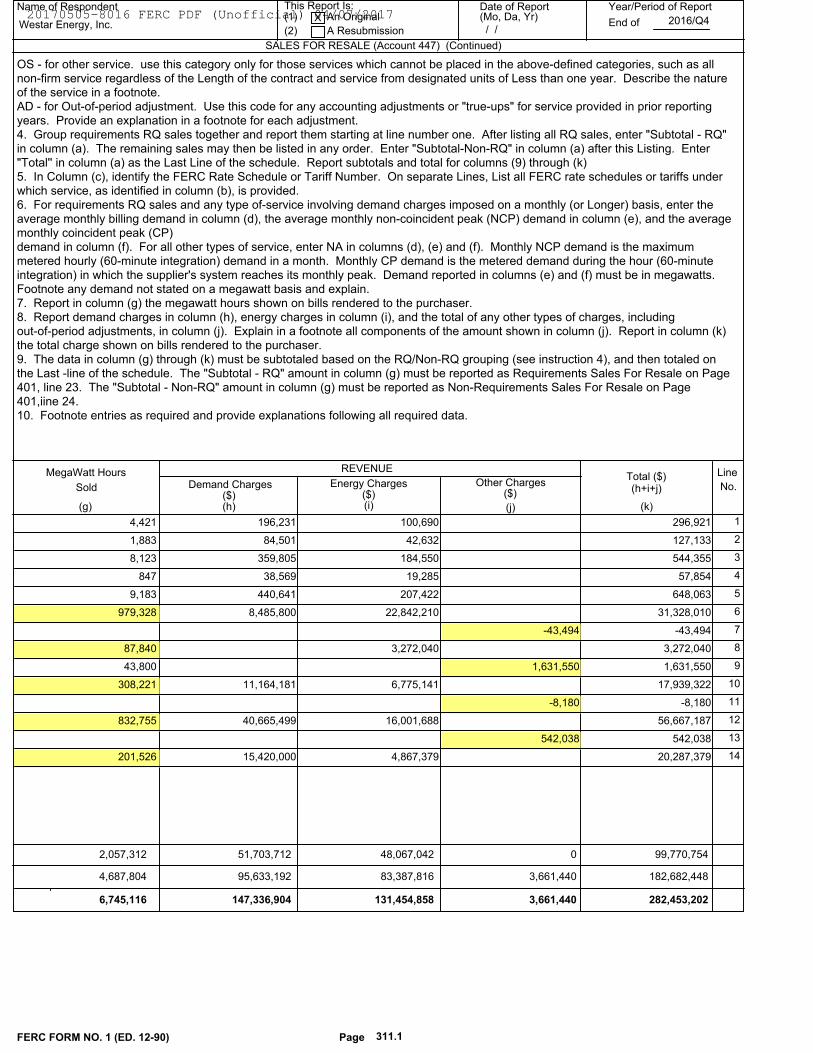
Name of Respondent This Report Is:(1) An Original
(2) A Resubmission
Date of Report(Mo, Da, Yr)
Year/Period of Report
End of
SALES FOR RESALE (Account 447) (Continued)
Westar Energy, Inc.X
/ /2016/Q4
Line
No.
MegaWatt Hours
(i)(h)(g) (j)
Demand Charges Energy Charges Other Charges
(k)
Sold (h+i+j)Total ($)
REVENUE
($) ($) ($)
OS - for other service. use this category only for those services which cannot be placed in the above-defined categories, such as allnon-firm service regardless of the Length of the contract and service from designated units of Less than one year. Describe the natureof the service in a footnote.AD - for Out-of-period adjustment. Use this code for any accounting adjustments or "true-ups" for service provided in prior reportingyears. Provide an explanation in a footnote for each adjustment.4. Group requirements RQ sales together and report them starting at line number one. After listing all RQ sales, enter "Subtotal - RQ"in column (a). The remaining sales may then be listed in any order. Enter "Subtotal-Non-RQ" in column (a) after this Listing. Enter"Total'' in column (a) as the Last Line of the schedule. Report subtotals and total for columns (9) through (k)5. In Column (c), identify the FERC Rate Schedule or Tariff Number. On separate Lines, List all FERC rate schedules or tariffs underwhich service, as identified in column (b), is provided.6. For requirements RQ sales and any type of-service involving demand charges imposed on a monthly (or Longer) basis, enter theaverage monthly billing demand in column (d), the average monthly non-coincident peak (NCP) demand in column (e), and the averagemonthly coincident peak (CP)demand in column (f). For all other types of service, enter NA in columns (d), (e) and (f). Monthly NCP demand is the maximummetered hourly (60-minute integration) demand in a month. Monthly CP demand is the metered demand during the hour (60-minuteintegration) in which the supplier's system reaches its monthly peak. Demand reported in columns (e) and (f) must be in megawatts.Footnote any demand not stated on a megawatt basis and explain.7. Report in column (g) the megawatt hours shown on bills rendered to the purchaser.8. Report demand charges in column (h), energy charges in column (i), and the total of any other types of charges, includingout-of-period adjustments, in column (j). Explain in a footnote all components of the amount shown in column (j). Report in column (k)the total charge shown on bills rendered to the purchaser.9. The data in column (g) through (k) must be subtotaled based on the RQ/Non-RQ grouping (see instruction 4), and then totaled onthe Last -line of the schedule. The "Subtotal - RQ" amount in column (g) must be reported as Requirements Sales For Resale on Page401, line 23. The "Subtotal - Non-RQ" amount in column (g) must be reported as Non-Requirements Sales For Resale on Page401,iine 24.10. Footnote entries as required and provide explanations following all required data.
100,690 196,231 296,921 4,421 1
42,632 84,501 127,133 1,883 2
184,550 359,805 544,355 8,123 3
19,285 38,569 57,854 847 4
207,422 440,641 648,063 9,183 5
22,842,210 8,485,800 31,328,010 979,328 6
-43,494 -43,494 7
3,272,040 3,272,040 87,840 8
1,631,550 1,631,550 43,800 9
6,775,141 11,164,181 17,939,322 308,221 10
-8,180 -8,180 11
16,001,688 40,665,499 56,667,187 832,755 12
542,038 542,038 13
4,867,379 15,420,000 20,287,379 201,526 14
FERC FORM NO. 1 (ED. 12-90) Page 311.1
48,067,042
83,387,816
131,454,858
2,057,312
4,687,804
6,745,116
0 99,770,754
3,661,440
3,661,440
182,682,448
282,453,202
51,703,712
95,633,192
147,336,904
20170505-8016 FERC PDF (Unofficial) 04/07/2017
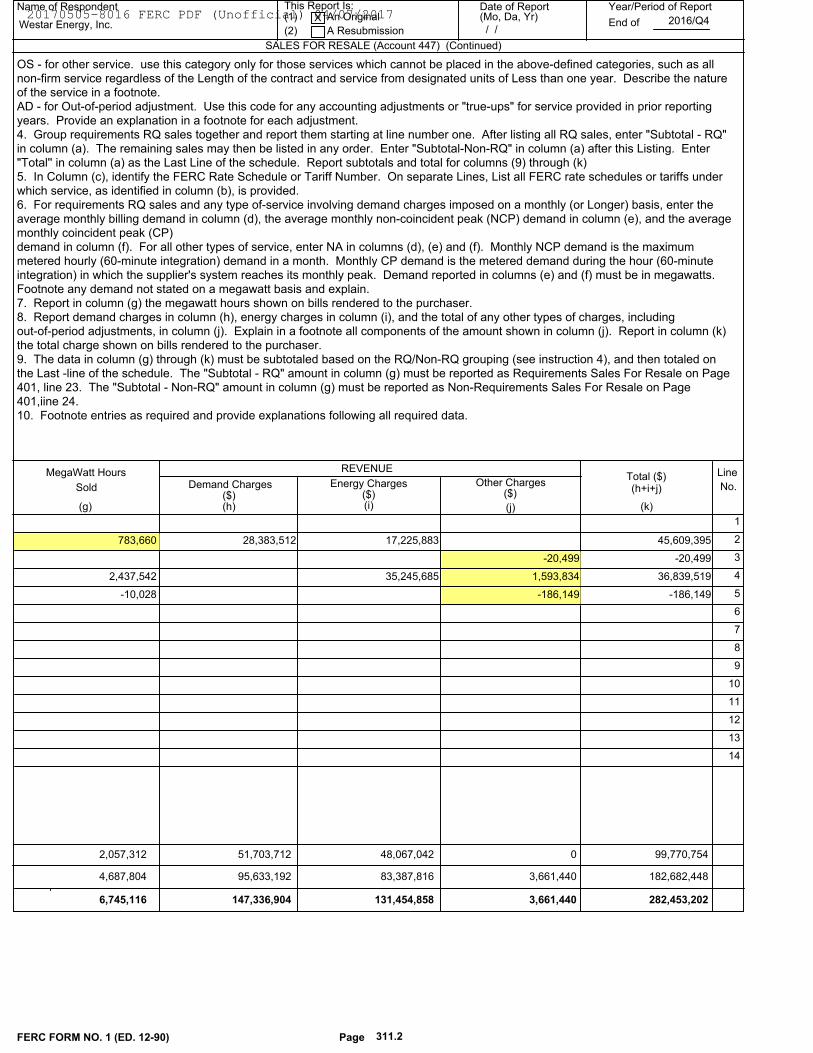
Name of Respondent This Report Is:(1) An Original
(2) A Resubmission
Date of Report(Mo, Da, Yr)
Year/Period of Report
End of
SALES FOR RESALE (Account 447) (Continued)
Westar Energy, Inc.X
/ /2016/Q4
Line
No.
MegaWatt Hours
(i)(h)(g) (j)
Demand Charges Energy Charges Other Charges
(k)
Sold (h+i+j)Total ($)
REVENUE
($) ($) ($)
OS - for other service. use this category only for those services which cannot be placed in the above-defined categories, such as allnon-firm service regardless of the Length of the contract and service from designated units of Less than one year. Describe the natureof the service in a footnote.AD - for Out-of-period adjustment. Use this code for any accounting adjustments or "true-ups" for service provided in prior reportingyears. Provide an explanation in a footnote for each adjustment.4. Group requirements RQ sales together and report them starting at line number one. After listing all RQ sales, enter "Subtotal - RQ"in column (a). The remaining sales may then be listed in any order. Enter "Subtotal-Non-RQ" in column (a) after this Listing. Enter"Total'' in column (a) as the Last Line of the schedule. Report subtotals and total for columns (9) through (k)5. In Column (c), identify the FERC Rate Schedule or Tariff Number. On separate Lines, List all FERC rate schedules or tariffs underwhich service, as identified in column (b), is provided.6. For requirements RQ sales and any type of-service involving demand charges imposed on a monthly (or Longer) basis, enter theaverage monthly billing demand in column (d), the average monthly non-coincident peak (NCP) demand in column (e), and the averagemonthly coincident peak (CP)demand in column (f). For all other types of service, enter NA in columns (d), (e) and (f). Monthly NCP demand is the maximummetered hourly (60-minute integration) demand in a month. Monthly CP demand is the metered demand during the hour (60-minuteintegration) in which the supplier's system reaches its monthly peak. Demand reported in columns (e) and (f) must be in megawatts.Footnote any demand not stated on a megawatt basis and explain.7. Report in column (g) the megawatt hours shown on bills rendered to the purchaser.8. Report demand charges in column (h), energy charges in column (i), and the total of any other types of charges, includingout-of-period adjustments, in column (j). Explain in a footnote all components of the amount shown in column (j). Report in column (k)the total charge shown on bills rendered to the purchaser.9. The data in column (g) through (k) must be subtotaled based on the RQ/Non-RQ grouping (see instruction 4), and then totaled onthe Last -line of the schedule. The "Subtotal - RQ" amount in column (g) must be reported as Requirements Sales For Resale on Page401, line 23. The "Subtotal - Non-RQ" amount in column (g) must be reported as Non-Requirements Sales For Resale on Page401,iine 24.10. Footnote entries as required and provide explanations following all required data.
1
17,225,883 28,383,512 45,609,395 783,660 2
-20,499 -20,499 3
35,245,685 1,593,834 36,839,519 2,437,542 4
-186,149 -186,149 -10,028 5
6
7
8
9
10
11
12
13
14
FERC FORM NO. 1 (ED. 12-90) Page 311.2
48,067,042
83,387,816
131,454,858
2,057,312
4,687,804
6,745,116
0 99,770,754
3,661,440
3,661,440
182,682,448
282,453,202
51,703,712
95,633,192
147,336,904
20170505-8016 FERC PDF (Unofficial) 04/07/2017
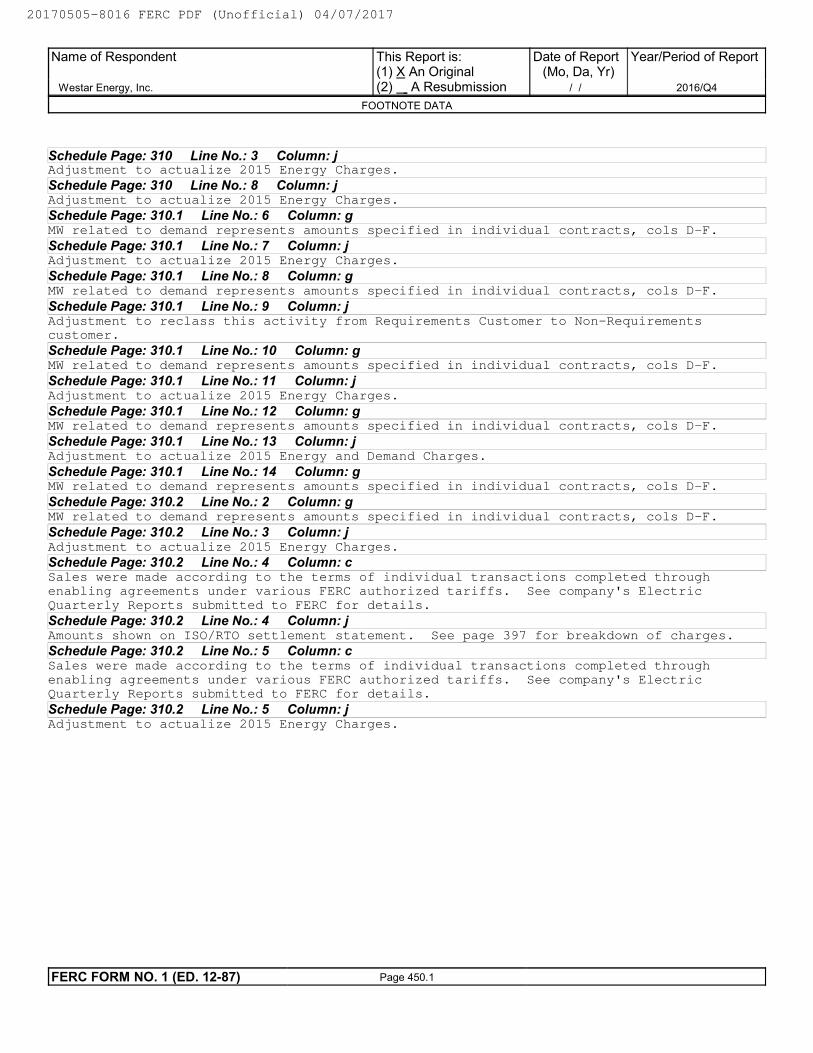
Schedule Page: 310 Line No.: 3 Column: jAdjustment to actualize 2015 Energy Charges.
Schedule Page: 310 Line No.: 8 Column: jAdjustment to actualize 2015 Energy Charges.
Schedule Page: 310.1 Line No.: 6 Column: gMW related to demand represents amounts specified in individual contracts, cols D-F.
Schedule Page: 310.1 Line No.: 7 Column: jAdjustment to actualize 2015 Energy Charges.
Schedule Page: 310.1 Line No.: 8 Column: gMW related to demand represents amounts specified in individual contracts, cols D-F.
Schedule Page: 310.1 Line No.: 9 Column: jAdjustment to reclass this activity from Requirements Customer to Non-Requirementscustomer.
Schedule Page: 310.1 Line No.: 10 Column: gMW related to demand represents amounts specified in individual contracts, cols D-F.
Schedule Page: 310.1 Line No.: 11 Column: jAdjustment to actualize 2015 Energy Charges.
Schedule Page: 310.1 Line No.: 12 Column: gMW related to demand represents amounts specified in individual contracts, cols D-F.
Schedule Page: 310.1 Line No.: 13 Column: jAdjustment to actualize 2015 Energy and Demand Charges.
Schedule Page: 310.1 Line No.: 14 Column: gMW related to demand represents amounts specified in individual contracts, cols D-F.
Schedule Page: 310.2 Line No.: 2 Column: gMW related to demand represents amounts specified in individual contracts, cols D-F.
Schedule Page: 310.2 Line No.: 3 Column: jAdjustment to actualize 2015 Energy Charges.
Schedule Page: 310.2 Line No.: 4 Column: cSales were made according to the terms of individual transactions completed throughenabling agreements under various FERC authorized tariffs. See company's ElectricQuarterly Reports submitted to FERC for details.
Schedule Page: 310.2 Line No.: 4 Column: jAmounts shown on ISO/RTO settlement statement. See page 397 for breakdown of charges.
Schedule Page: 310.2 Line No.: 5 Column: cSales were made according to the terms of individual transactions completed throughenabling agreements under various FERC authorized tariffs. See company's ElectricQuarterly Reports submitted to FERC for details.
Schedule Page: 310.2 Line No.: 5 Column: jAdjustment to actualize 2015 Energy Charges.
Name of Respondent
Westar Energy, Inc.
This Report is:(1) X An Original(2) A Resubmission
Date of Report(Mo, Da, Yr)
/ /
Year/Period of Report
2016/Q4
FOOTNOTE DATA
FERC FORM NO. 1 (ED. 12-87) Page 450.1
20170505-8016 FERC PDF (Unofficial) 04/07/2017
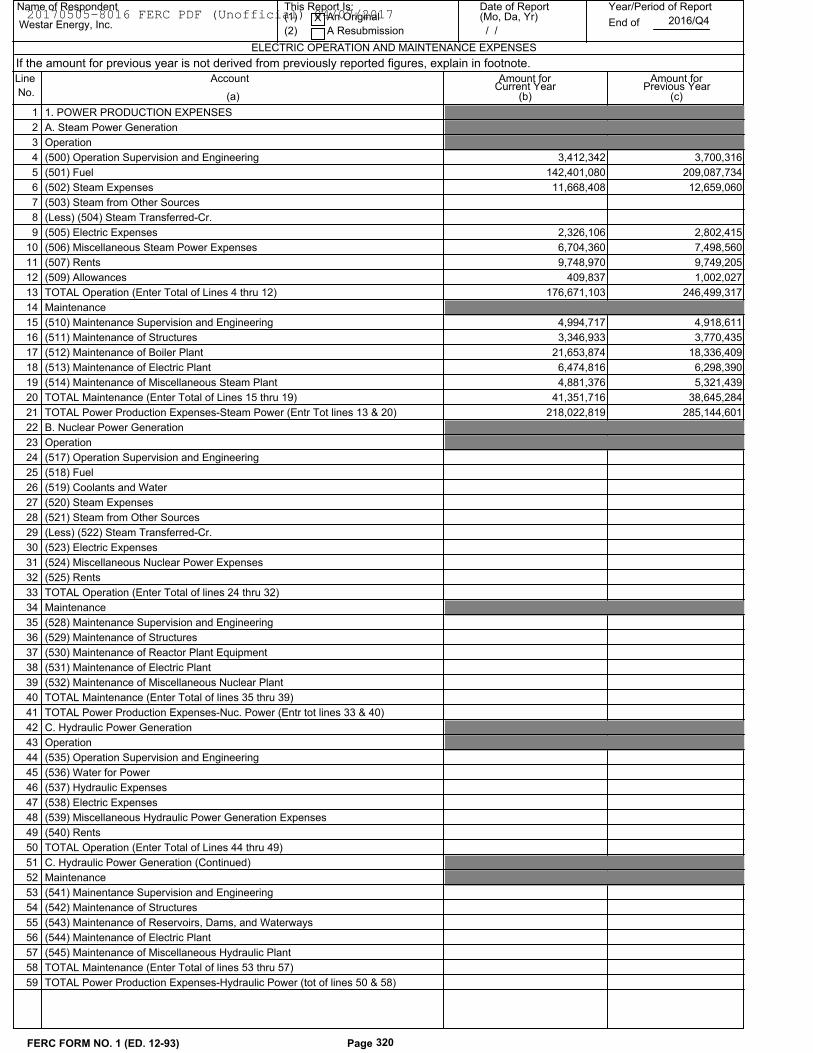
ELECTRIC OPERATION AND MAINTENANCE EXPENSES
Name of Respondent This Report Is:(1) An Original
(2) A Resubmission
Date of Report(Mo, Da, Yr)
Year/Period of Report
End ofWestar Energy, Inc.X
/ /2016/Q4
Line
No.
Account Amount for
(c)(b)(a)Current Year Previous Year
Amount for
If the amount for previous year is not derived from previously reported figures, explain in footnote.
1. POWER PRODUCTION EXPENSES 1
A. Steam Power Generation 2
Operation 3
(500) Operation Supervision and Engineering 4 3,700,316 3,412,342
(501) Fuel 5 209,087,734 142,401,080
(502) Steam Expenses 6 12,659,060 11,668,408
(503) Steam from Other Sources 7
(Less) (504) Steam Transferred-Cr. 8
(505) Electric Expenses 9 2,802,415 2,326,106
(506) Miscellaneous Steam Power Expenses 10 7,498,560 6,704,360
(507) Rents 11 9,749,205 9,748,970
(509) Allowances 12 1,002,027 409,837
TOTAL Operation (Enter Total of Lines 4 thru 12) 13 246,499,317 176,671,103
Maintenance 14
(510) Maintenance Supervision and Engineering 15 4,918,611 4,994,717
(511) Maintenance of Structures 16 3,770,435 3,346,933
(512) Maintenance of Boiler Plant 17 18,336,409 21,653,874
(513) Maintenance of Electric Plant 18 6,298,390 6,474,816
(514) Maintenance of Miscellaneous Steam Plant 19 5,321,439 4,881,376
TOTAL Maintenance (Enter Total of Lines 15 thru 19) 20 38,645,284 41,351,716
TOTAL Power Production Expenses-Steam Power (Entr Tot lines 13 & 20) 21 285,144,601 218,022,819
B. Nuclear Power Generation 22
Operation 23
(517) Operation Supervision and Engineering 24
(518) Fuel 25
(519) Coolants and Water 26
(520) Steam Expenses 27
(521) Steam from Other Sources 28
(Less) (522) Steam Transferred-Cr. 29
(523) Electric Expenses 30
(524) Miscellaneous Nuclear Power Expenses 31
(525) Rents 32
TOTAL Operation (Enter Total of lines 24 thru 32) 33
Maintenance 34
(528) Maintenance Supervision and Engineering 35
(529) Maintenance of Structures 36
(530) Maintenance of Reactor Plant Equipment 37
(531) Maintenance of Electric Plant 38
(532) Maintenance of Miscellaneous Nuclear Plant 39
TOTAL Maintenance (Enter Total of lines 35 thru 39) 40
TOTAL Power Production Expenses-Nuc. Power (Entr tot lines 33 & 40) 41
C. Hydraulic Power Generation 42
Operation 43
(535) Operation Supervision and Engineering 44
(536) Water for Power 45
(537) Hydraulic Expenses 46
(538) Electric Expenses 47
(539) Miscellaneous Hydraulic Power Generation Expenses 48
(540) Rents 49
TOTAL Operation (Enter Total of Lines 44 thru 49) 50
C. Hydraulic Power Generation (Continued) 51
Maintenance 52
(541) Mainentance Supervision and Engineering 53
(542) Maintenance of Structures 54
(543) Maintenance of Reservoirs, Dams, and Waterways 55
(544) Maintenance of Electric Plant 56
(545) Maintenance of Miscellaneous Hydraulic Plant 57
TOTAL Maintenance (Enter Total of lines 53 thru 57) 58
TOTAL Power Production Expenses-Hydraulic Power (tot of lines 50 & 58) 59
FERC FORM NO. 1 (ED. 12-93) Page 320
20170505-8016 FERC PDF (Unofficial) 04/07/2017
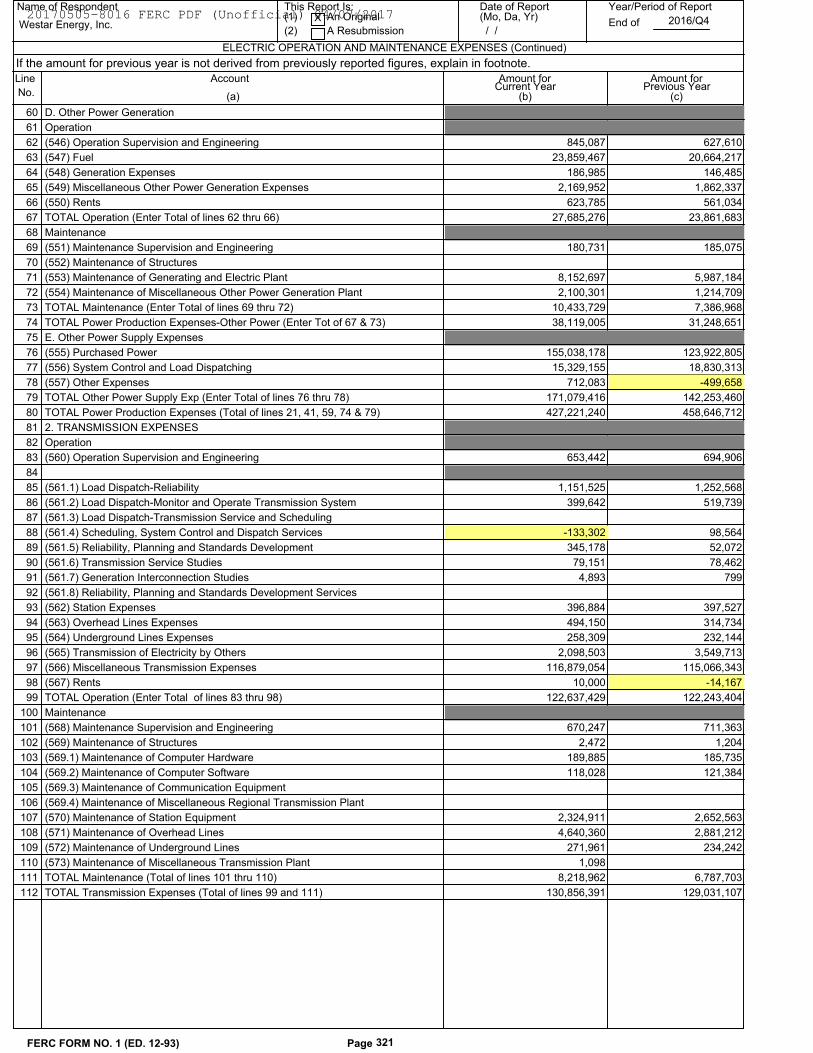
ELECTRIC OPERATION AND MAINTENANCE EXPENSES (Continued)
Name of Respondent This Report Is:(1) An Original
(2) A Resubmission
Date of Report(Mo, Da, Yr)
Year/Period of Report
End ofWestar Energy, Inc.X
/ /2016/Q4
Line
No.
Account Amount for
(c)(b)(a)Current Year Previous Year
Amount for
If the amount for previous year is not derived from previously reported figures, explain in footnote.
D. Other Power Generation 60
Operation 61
(546) Operation Supervision and Engineering 62 627,610 845,087
(547) Fuel 63 20,664,217 23,859,467
(548) Generation Expenses 64 146,485 186,985
(549) Miscellaneous Other Power Generation Expenses 65 1,862,337 2,169,952
(550) Rents 66 561,034 623,785
TOTAL Operation (Enter Total of lines 62 thru 66) 67 23,861,683 27,685,276
Maintenance 68
(551) Maintenance Supervision and Engineering 69 185,075 180,731
(552) Maintenance of Structures 70
(553) Maintenance of Generating and Electric Plant 71 5,987,184 8,152,697
(554) Maintenance of Miscellaneous Other Power Generation Plant 72 1,214,709 2,100,301
TOTAL Maintenance (Enter Total of lines 69 thru 72) 73 7,386,968 10,433,729
TOTAL Power Production Expenses-Other Power (Enter Tot of 67 & 73) 74 31,248,651 38,119,005
E. Other Power Supply Expenses 75
(555) Purchased Power 76 123,922,805 155,038,178
(556) System Control and Load Dispatching 77 18,830,313 15,329,155
(557) Other Expenses 78 -499,658 712,083
TOTAL Other Power Supply Exp (Enter Total of lines 76 thru 78) 79 142,253,460 171,079,416
TOTAL Power Production Expenses (Total of lines 21, 41, 59, 74 & 79) 80 458,646,712 427,221,240
2. TRANSMISSION EXPENSES 81
Operation 82
(560) Operation Supervision and Engineering 83 694,906 653,442
84
(561.1) Load Dispatch-Reliability 85 1,252,568 1,151,525
(561.2) Load Dispatch-Monitor and Operate Transmission System 86 519,739 399,642
(561.3) Load Dispatch-Transmission Service and Scheduling 87
(561.4) Scheduling, System Control and Dispatch Services 88 98,564 -133,302
(561.5) Reliability, Planning and Standards Development 89 52,072 345,178
(561.6) Transmission Service Studies 90 78,462 79,151
(561.7) Generation Interconnection Studies 91 799 4,893
(561.8) Reliability, Planning and Standards Development Services 92
(562) Station Expenses 93 397,527 396,884
(563) Overhead Lines Expenses 94 314,734 494,150
(564) Underground Lines Expenses 95 232,144 258,309
(565) Transmission of Electricity by Others 96 3,549,713 2,098,503
(566) Miscellaneous Transmission Expenses 97 115,066,343 116,879,054
(567) Rents 98 -14,167 10,000
TOTAL Operation (Enter Total of lines 83 thru 98) 99 122,243,404 122,637,429
Maintenance 100
(568) Maintenance Supervision and Engineering 101 711,363 670,247
(569) Maintenance of Structures 102 1,204 2,472
(569.1) Maintenance of Computer Hardware 103 185,735 189,885
(569.2) Maintenance of Computer Software 104 121,384 118,028
(569.3) Maintenance of Communication Equipment 105
(569.4) Maintenance of Miscellaneous Regional Transmission Plant 106
(570) Maintenance of Station Equipment 107 2,652,563 2,324,911
(571) Maintenance of Overhead Lines 108 2,881,212 4,640,360
(572) Maintenance of Underground Lines 109 234,242 271,961
(573) Maintenance of Miscellaneous Transmission Plant 110 1,098
TOTAL Maintenance (Total of lines 101 thru 110) 111 6,787,703 8,218,962
TOTAL Transmission Expenses (Total of lines 99 and 111) 112 129,031,107 130,856,391
FERC FORM NO. 1 (ED. 12-93) Page 321
20170505-8016 FERC PDF (Unofficial) 04/07/2017
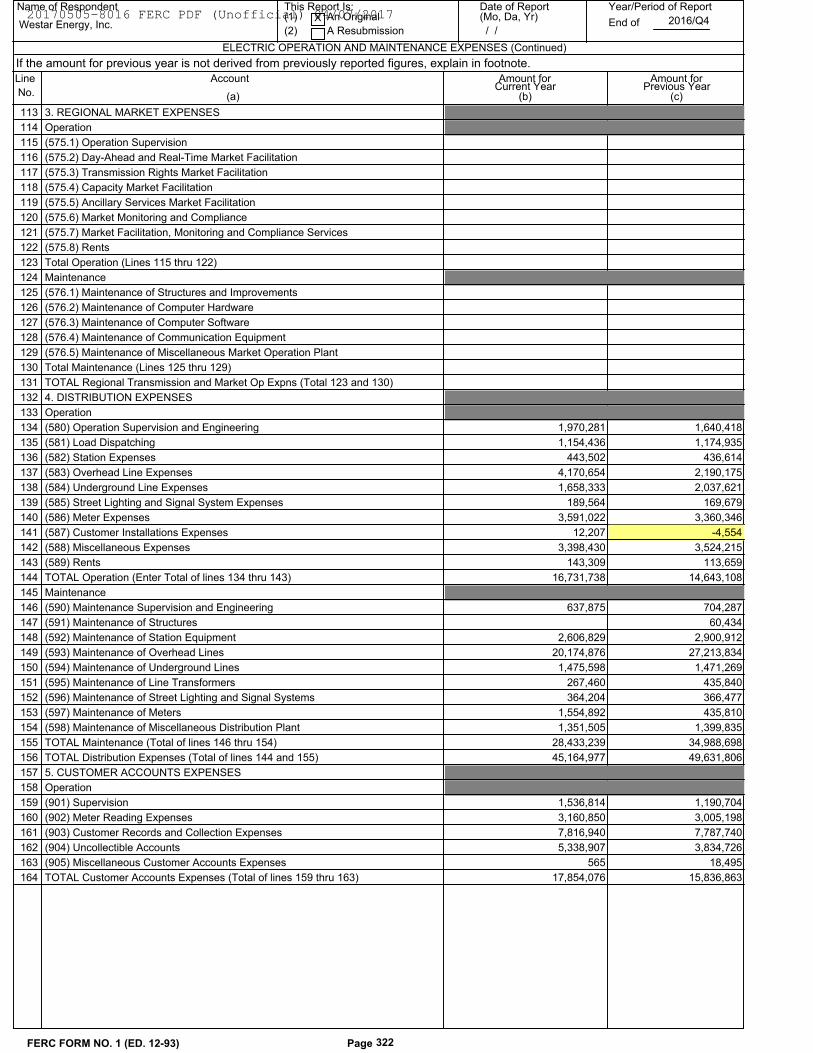
ELECTRIC OPERATION AND MAINTENANCE EXPENSES (Continued)
Name of Respondent This Report Is:(1) An Original
(2) A Resubmission
Date of Report(Mo, Da, Yr)
Year/Period of Report
End ofWestar Energy, Inc.X
/ /2016/Q4
Line
No.
Account Amount for
(c)(b)(a)Current Year Previous Year
Amount for
If the amount for previous year is not derived from previously reported figures, explain in footnote.
3. REGIONAL MARKET EXPENSES 113
Operation 114
(575.1) Operation Supervision 115
(575.2) Day-Ahead and Real-Time Market Facilitation 116
(575.3) Transmission Rights Market Facilitation 117
(575.4) Capacity Market Facilitation 118
(575.5) Ancillary Services Market Facilitation 119
(575.6) Market Monitoring and Compliance 120
(575.7) Market Facilitation, Monitoring and Compliance Services 121
(575.8) Rents 122
Total Operation (Lines 115 thru 122) 123
Maintenance 124
(576.1) Maintenance of Structures and Improvements 125
(576.2) Maintenance of Computer Hardware 126
(576.3) Maintenance of Computer Software 127
(576.4) Maintenance of Communication Equipment 128
(576.5) Maintenance of Miscellaneous Market Operation Plant 129
Total Maintenance (Lines 125 thru 129) 130
TOTAL Regional Transmission and Market Op Expns (Total 123 and 130) 131
4. DISTRIBUTION EXPENSES 132
Operation 133
(580) Operation Supervision and Engineering 134 1,640,418 1,970,281
(581) Load Dispatching 135 1,174,935 1,154,436
(582) Station Expenses 136 436,614 443,502
(583) Overhead Line Expenses 137 2,190,175 4,170,654
(584) Underground Line Expenses 138 2,037,621 1,658,333
(585) Street Lighting and Signal System Expenses 139 169,679 189,564
(586) Meter Expenses 140 3,360,346 3,591,022
(587) Customer Installations Expenses 141 -4,554 12,207
(588) Miscellaneous Expenses 142 3,524,215 3,398,430
(589) Rents 143 113,659 143,309
TOTAL Operation (Enter Total of lines 134 thru 143) 144 14,643,108 16,731,738
Maintenance 145
(590) Maintenance Supervision and Engineering 146 704,287 637,875
(591) Maintenance of Structures 147 60,434
(592) Maintenance of Station Equipment 148 2,900,912 2,606,829
(593) Maintenance of Overhead Lines 149 27,213,834 20,174,876
(594) Maintenance of Underground Lines 150 1,471,269 1,475,598
(595) Maintenance of Line Transformers 151 435,840 267,460
(596) Maintenance of Street Lighting and Signal Systems 152 366,477 364,204
(597) Maintenance of Meters 153 435,810 1,554,892
(598) Maintenance of Miscellaneous Distribution Plant 154 1,399,835 1,351,505
TOTAL Maintenance (Total of lines 146 thru 154) 155 34,988,698 28,433,239
TOTAL Distribution Expenses (Total of lines 144 and 155) 156 49,631,806 45,164,977
5. CUSTOMER ACCOUNTS EXPENSES 157
Operation 158
(901) Supervision 159 1,190,704 1,536,814
(902) Meter Reading Expenses 160 3,005,198 3,160,850
(903) Customer Records and Collection Expenses 161 7,787,740 7,816,940
(904) Uncollectible Accounts 162 3,834,726 5,338,907
(905) Miscellaneous Customer Accounts Expenses 163 18,495 565
TOTAL Customer Accounts Expenses (Total of lines 159 thru 163) 164 15,836,863 17,854,076
FERC FORM NO. 1 (ED. 12-93) Page 322
20170505-8016 FERC PDF (Unofficial) 04/07/2017
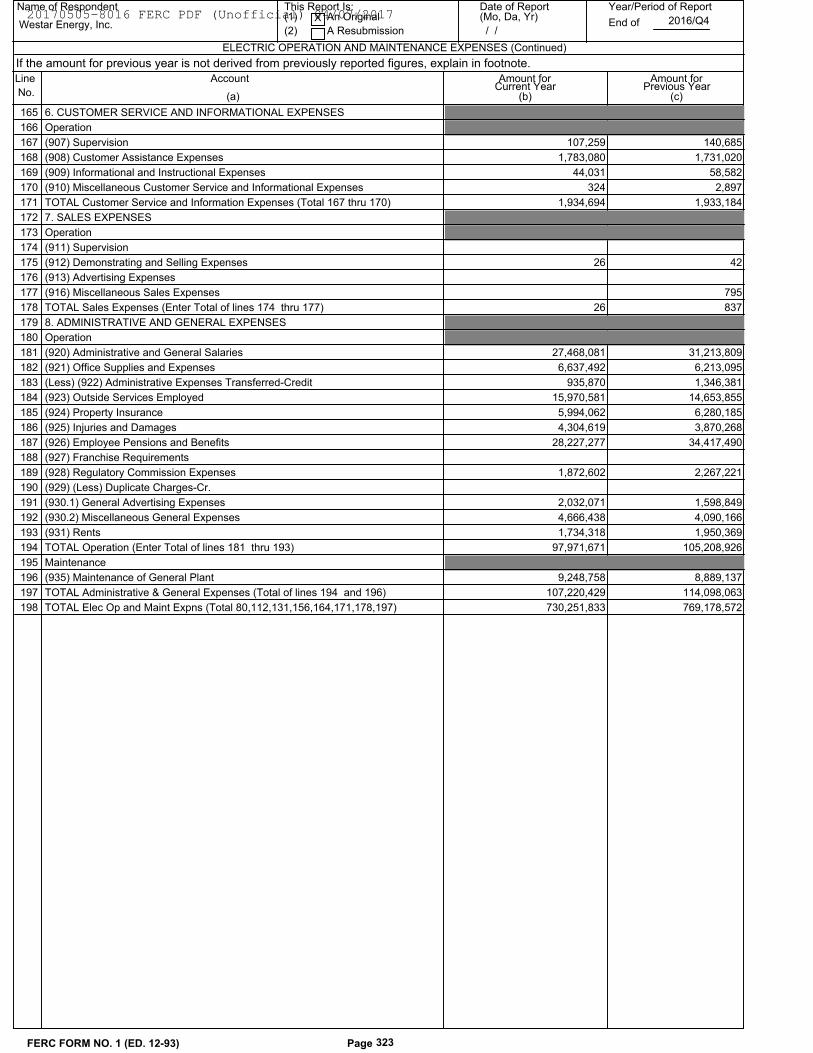
ELECTRIC OPERATION AND MAINTENANCE EXPENSES (Continued)
Name of Respondent This Report Is:(1) An Original
(2) A Resubmission
Date of Report(Mo, Da, Yr)
Year/Period of Report
End ofWestar Energy, Inc.X
/ /2016/Q4
Line
No.
Account Amount for
(c)(b)(a)Current Year Previous Year
Amount for
If the amount for previous year is not derived from previously reported figures, explain in footnote.
6. CUSTOMER SERVICE AND INFORMATIONAL EXPENSES 165
Operation 166
(907) Supervision 167 140,685 107,259
(908) Customer Assistance Expenses 168 1,731,020 1,783,080
(909) Informational and Instructional Expenses 169 58,582 44,031
(910) Miscellaneous Customer Service and Informational Expenses 170 2,897 324
TOTAL Customer Service and Information Expenses (Total 167 thru 170) 171 1,933,184 1,934,694
7. SALES EXPENSES 172
Operation 173
(911) Supervision 174
(912) Demonstrating and Selling Expenses 175 42 26
(913) Advertising Expenses 176
(916) Miscellaneous Sales Expenses 177 795
TOTAL Sales Expenses (Enter Total of lines 174 thru 177) 178 837 26
8. ADMINISTRATIVE AND GENERAL EXPENSES 179
Operation 180
(920) Administrative and General Salaries 181 31,213,809 27,468,081
(921) Office Supplies and Expenses 182 6,213,095 6,637,492
(Less) (922) Administrative Expenses Transferred-Credit 183 1,346,381 935,870
(923) Outside Services Employed 184 14,653,855 15,970,581
(924) Property Insurance 185 6,280,185 5,994,062
(925) Injuries and Damages 186 3,870,268 4,304,619
(926) Employee Pensions and Benefits 187 34,417,490 28,227,277
(927) Franchise Requirements 188
(928) Regulatory Commission Expenses 189 2,267,221 1,872,602
(929) (Less) Duplicate Charges-Cr. 190
(930.1) General Advertising Expenses 191 1,598,849 2,032,071
(930.2) Miscellaneous General Expenses 192 4,090,166 4,666,438
(931) Rents 193 1,950,369 1,734,318
TOTAL Operation (Enter Total of lines 181 thru 193) 194 105,208,926 97,971,671
Maintenance 195
(935) Maintenance of General Plant 196 8,889,137 9,248,758
TOTAL Administrative & General Expenses (Total of lines 194 and 196) 197 114,098,063 107,220,429
TOTAL Elec Op and Maint Expns (Total 80,112,131,156,164,171,178,197) 198 769,178,572 730,251,833
FERC FORM NO. 1 (ED. 12-93) Page 323
20170505-8016 FERC PDF (Unofficial) 04/07/2017
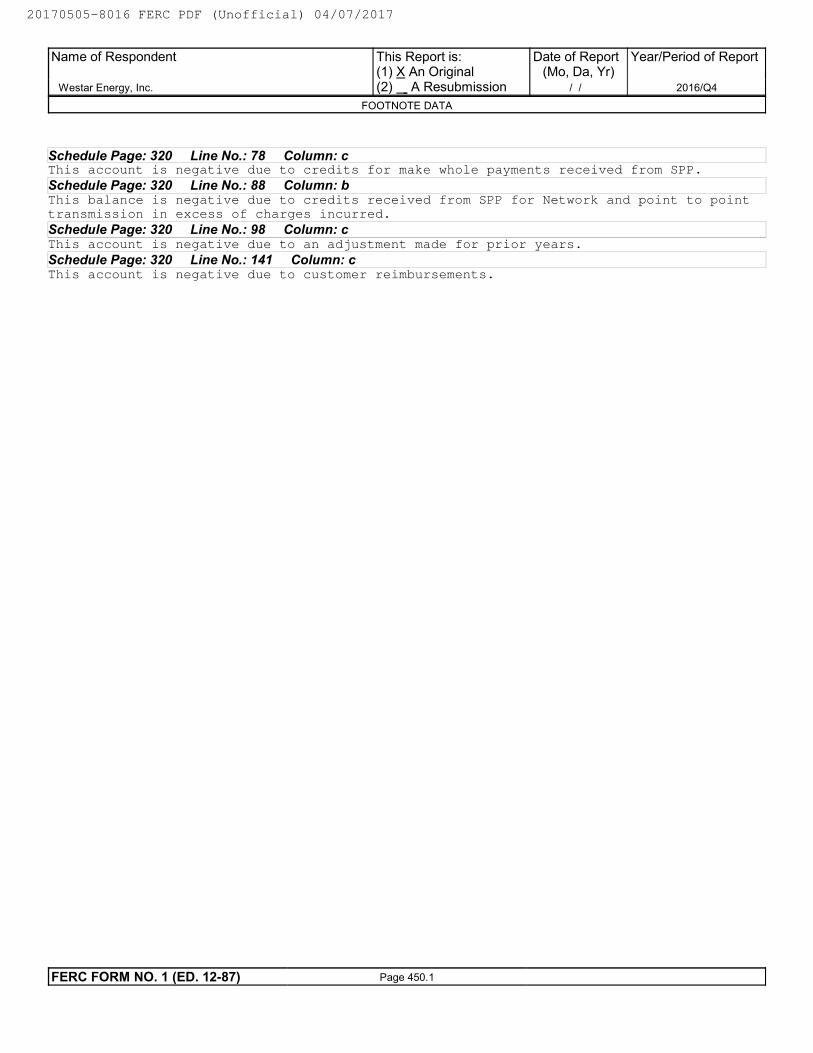
Schedule Page: 320 Line No.: 78 Column: cThis account is negative due to credits for make whole payments received from SPP.
Schedule Page: 320 Line No.: 88 Column: bThis balance is negative due to credits received from SPP for Network and point to point
transmission in excess of charges incurred.
Schedule Page: 320 Line No.: 98 Column: cThis account is negative due to an adjustment made for prior years.
Schedule Page: 320 Line No.: 141 Column: cThis account is negative due to customer reimbursements.
Name of Respondent
Westar Energy, Inc.
This Report is:(1) X An Original(2) A Resubmission
Date of Report(Mo, Da, Yr)
/ /
Year/Period of Report
2016/Q4
FOOTNOTE DATA
FERC FORM NO. 1 (ED. 12-87) Page 450.1
20170505-8016 FERC PDF (Unofficial) 04/07/2017
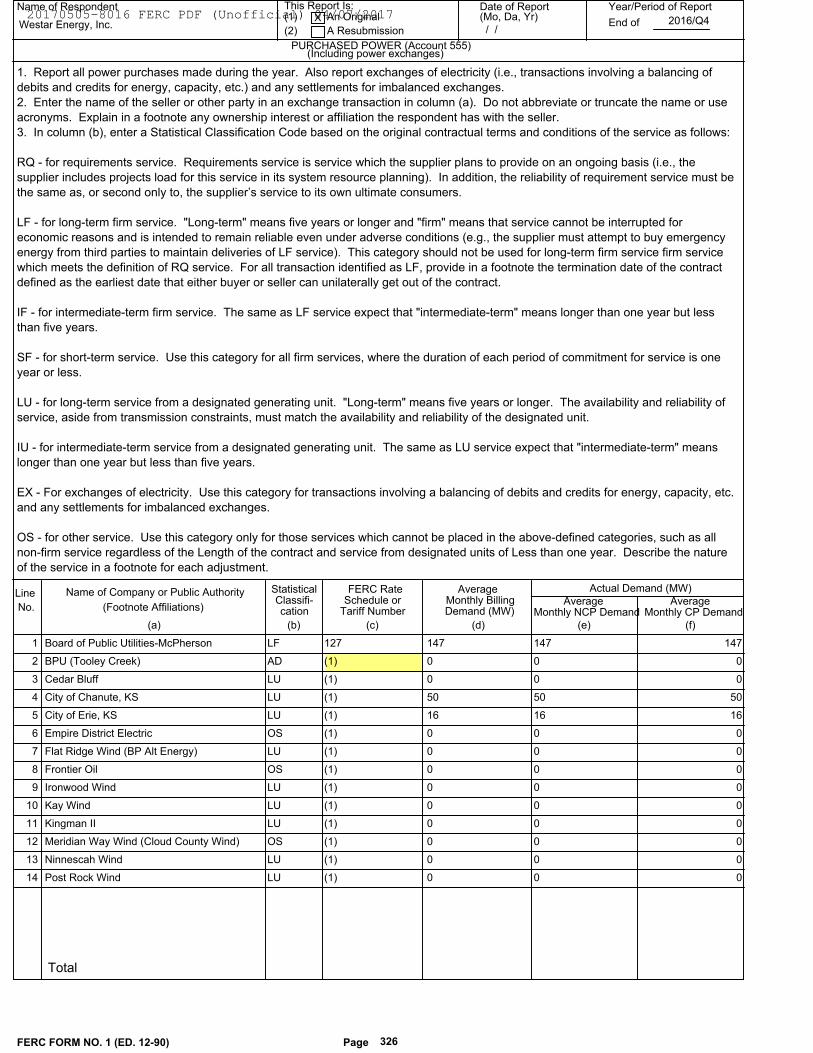
Name of Respondent This Report Is:(1) An Original
(2) A Resubmission
Date of Report(Mo, Da, Yr)
Year/Period of Report
End of
PURCHASED POWER (Account 555)
Westar Energy, Inc.X
/ /2016/Q4
Line
No.
Name of Company or Public Authority
(c)(b)(a)
FERC RateMonthly Billing
Average
(d)
Statistical
cationClassifi- Schedule or
Tariff Number Demand (MW)
(e) (f)
(Footnote Affiliations)
Actual Demand (MW)
Average AverageMonthly NCP Demand Monthly CP Demand
(Including power exchanges)
1. Report all power purchases made during the year. Also report exchanges of electricity (i.e., transactions involving a balancing of
debits and credits for energy, capacity, etc.) and any settlements for imbalanced exchanges.
2. Enter the name of the seller or other party in an exchange transaction in column (a). Do not abbreviate or truncate the name or use
acronyms. Explain in a footnote any ownership interest or affiliation the respondent has with the seller.
3. In column (b), enter a Statistical Classification Code based on the original contractual terms and conditions of the service as follows:
RQ - for requirements service. Requirements service is service which the supplier plans to provide on an ongoing basis (i.e., the
supplier includes projects load for this service in its system resource planning). In addition, the reliability of requirement service must be
the same as, or second only to, the supplier’s service to its own ultimate consumers.
LF - for long-term firm service. "Long-term" means five years or longer and "firm" means that service cannot be interrupted for
economic reasons and is intended to remain reliable even under adverse conditions (e.g., the supplier must attempt to buy emergency
energy from third parties to maintain deliveries of LF service). This category should not be used for long-term firm service firm service
which meets the definition of RQ service. For all transaction identified as LF, provide in a footnote the termination date of the contract
defined as the earliest date that either buyer or seller can unilaterally get out of the contract.
IF - for intermediate-term firm service. The same as LF service expect that "intermediate-term" means longer than one year but less
than five years.
SF - for short-term service. Use this category for all firm services, where the duration of each period of commitment for service is one
year or less.
LU - for long-term service from a designated generating unit. "Long-term" means five years or longer. The availability and reliability of
service, aside from transmission constraints, must match the availability and reliability of the designated unit.
IU - for intermediate-term service from a designated generating unit. The same as LU service expect that "intermediate-term" means
longer than one year but less than five years.
EX - For exchanges of electricity. Use this category for transactions involving a balancing of debits and credits for energy, capacity, etc.
and any settlements for imbalanced exchanges.
OS - for other service. Use this category only for those services which cannot be placed in the above-defined categories, such as all
non-firm service regardless of the Length of the contract and service from designated units of Less than one year. Describe the nature
of the service in a footnote for each adjustment.
147147147Board of Public Utilities-McPherson 127LF 1
000BPU (Tooley Creek) (1)AD 2
000Cedar Bluff (1)LU 3
505050City of Chanute, KS (1)LU 4
161616City of Erie, KS (1)LU 5
000Empire District Electric (1)OS 6
000Flat Ridge Wind (BP Alt Energy) (1)LU 7
000Frontier Oil (1)OS 8
000Ironwood Wind (1)LU 9
000Kay Wind (1)LU 10
000Kingman II (1)LU 11
000Meridian Way Wind (Cloud County Wind) (1)OS 12
000Ninnescah Wind (1)LU 13
000Post Rock Wind (1)LU 14
FERC FORM NO. 1 (ED. 12-90) Page 326
Total
20170505-8016 FERC PDF (Unofficial) 04/07/2017
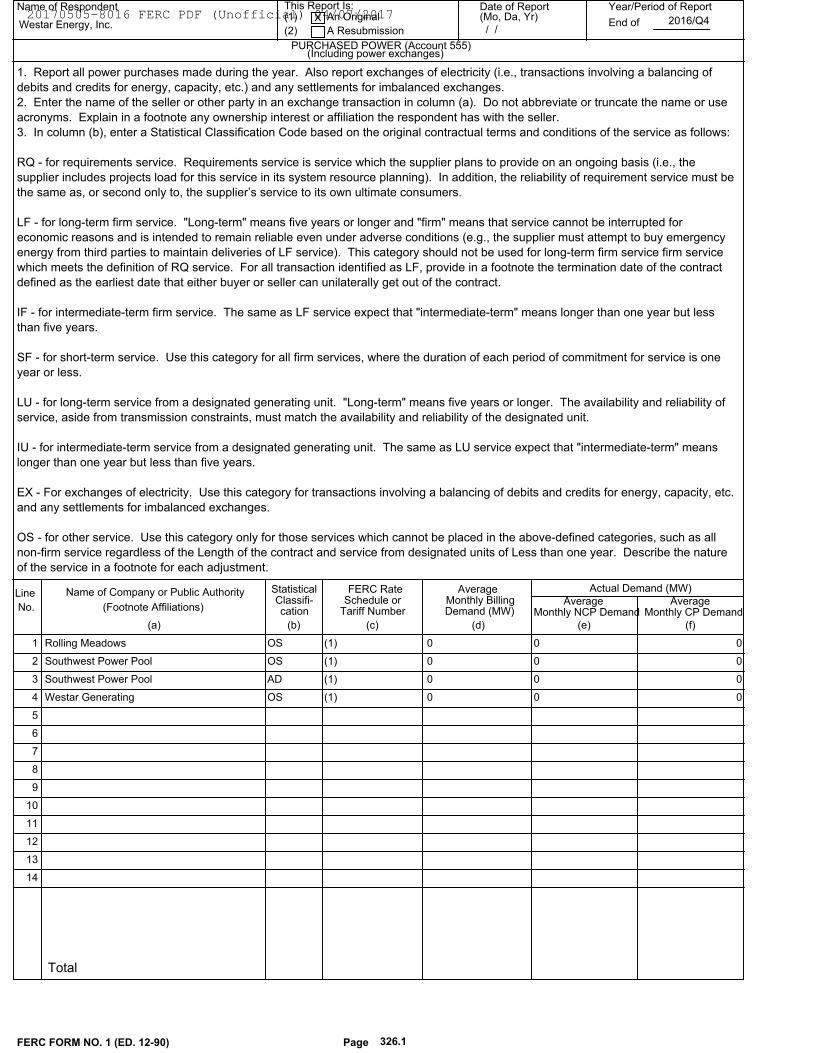
Name of Respondent This Report Is:(1) An Original
(2) A Resubmission
Date of Report(Mo, Da, Yr)
Year/Period of Report
End of
PURCHASED POWER (Account 555)
Westar Energy, Inc.X
/ /2016/Q4
Line
No.
Name of Company or Public Authority
(c)(b)(a)
FERC RateMonthly Billing
Average
(d)
Statistical
cationClassifi- Schedule or
Tariff Number Demand (MW)
(e) (f)
(Footnote Affiliations)
Actual Demand (MW)
Average AverageMonthly NCP Demand Monthly CP Demand
(Including power exchanges)
1. Report all power purchases made during the year. Also report exchanges of electricity (i.e., transactions involving a balancing of
debits and credits for energy, capacity, etc.) and any settlements for imbalanced exchanges.
2. Enter the name of the seller or other party in an exchange transaction in column (a). Do not abbreviate or truncate the name or use
acronyms. Explain in a footnote any ownership interest or affiliation the respondent has with the seller.
3. In column (b), enter a Statistical Classification Code based on the original contractual terms and conditions of the service as follows:
RQ - for requirements service. Requirements service is service which the supplier plans to provide on an ongoing basis (i.e., the
supplier includes projects load for this service in its system resource planning). In addition, the reliability of requirement service must be
the same as, or second only to, the supplier’s service to its own ultimate consumers.
LF - for long-term firm service. "Long-term" means five years or longer and "firm" means that service cannot be interrupted for
economic reasons and is intended to remain reliable even under adverse conditions (e.g., the supplier must attempt to buy emergency
energy from third parties to maintain deliveries of LF service). This category should not be used for long-term firm service firm service
which meets the definition of RQ service. For all transaction identified as LF, provide in a footnote the termination date of the contract
defined as the earliest date that either buyer or seller can unilaterally get out of the contract.
IF - for intermediate-term firm service. The same as LF service expect that "intermediate-term" means longer than one year but less
than five years.
SF - for short-term service. Use this category for all firm services, where the duration of each period of commitment for service is one
year or less.
LU - for long-term service from a designated generating unit. "Long-term" means five years or longer. The availability and reliability of
service, aside from transmission constraints, must match the availability and reliability of the designated unit.
IU - for intermediate-term service from a designated generating unit. The same as LU service expect that "intermediate-term" means
longer than one year but less than five years.
EX - For exchanges of electricity. Use this category for transactions involving a balancing of debits and credits for energy, capacity, etc.
and any settlements for imbalanced exchanges.
OS - for other service. Use this category only for those services which cannot be placed in the above-defined categories, such as all
non-firm service regardless of the Length of the contract and service from designated units of Less than one year. Describe the nature
of the service in a footnote for each adjustment.
000Rolling Meadows (1)OS 1
000Southwest Power Pool (1)OS 2
000Southwest Power Pool (1)AD 3
000Westar Generating (1)OS 4
5
6
7
8
9
10
11
12
13
14
FERC FORM NO. 1 (ED. 12-90) Page 326.1
Total
20170505-8016 FERC PDF (Unofficial) 04/07/2017

Name of Respondent This Report Is:(1) An Original
(2) A Resubmission
Date of Report(Mo, Da, Yr)
Year/Period of Report
End of
PURCHASED POWER(Account 555) (Continued)
Westar Energy, Inc.X
/ /2016/Q4
Line
No.MegaWatt Hours
(i)(h)(g) (j)
Demand Charges Energy Charges Other Charges
(k)
Purchased(j+k+l)Total
COST/SETTLEMENT OF POWER
($) ($) ($)
(Including power exchanges)
POWER EXCHANGES
MegaWatt HoursReceived
MegaWatt HoursDelivered
(l) (m)of Settlement ($)
AD - for out-of-period adjustment. Use this code for any accounting adjustments or "true-ups" for service provided in prior reporting
years. Provide an explanation in a footnote for each adjustment.
4. In column (c), identify the FERC Rate Schedule Number or Tariff, or, for non-FERC jurisdictional sellers, include an appropriate
designation for the contract. On separate lines, list all FERC rate schedules, tariffs or contract designations under which service, as
identified in column (b), is provided.
5. For requirements RQ purchases and any type of service involving demand charges imposed on a monnthly (or longer) basis, enter
the monthly average billing demand in column (d), the average monthly non-coincident peak (NCP) demand in column (e), and the
average monthly coincident peak (CP) demand in column (f). For all other types of service, enter NA in columns (d), (e) and (f). Monthly
NCP demand is the maximum metered hourly (60-minute integration) demand in a month. Monthly CP demand is the metered demand
during the hour (60-minute integration) in which the supplier's system reaches its monthly peak. Demand reported in columns (e) and (f)
must be in megawatts. Footnote any demand not stated on a megawatt basis and explain.
6. Report in column (g) the megawatthours shown on bills rendered to the respondent. Report in columns (h) and (i) the megawatthours
of power exchanges received and delivered, used as the basis for settlement. Do not report net exchange.
7. Report demand charges in column (j), energy charges in column (k), and the total of any other types of charges, including
out-of-period adjustments, in column (l). Explain in a footnote all components of the amount shown in column (l). Report in column (m)
the total charge shown on bills received as settlement by the respondent. For power exchanges, report in column (m) the settlement
amount for the net receipt of energy. If more energy was delivered than received, enter a negative amount. If the settlement amount (l)
include credits or charges other than incremental generation expenses, or (2) excludes certain credits or charges covered by the
agreement, provide an explanatory footnote.
8. The data in column (g) through (m) must be totalled on the last line of the schedule. The total amount in column (g) must be
reported as Purchases on Page 401, line 10. The total amount in column (h) must be reported as Exchange Received on Page 401,
line 12. The total amount in column (i) must be reported as Exchange Delivered on Page 401, line 13.
9. Footnote entries as required and provide explanations following all required data.
2,919,220 1,189,872 34,176 4,143,268 1 15,970
2,066 2,066 2 46
15,616,568 303,858 15,920,426 3 814,196
480,000 480,000 4
888,000 67,787 955,787 5 143
34,906 34,906 6 1,367
6,449,469 6,449,469 7 159,443
35,261 35,261 8
18,848,202 18,848,202 9 649,938
14,862,358 14,862,358 10 700,187
252,610 252,610 11 15,222
11,979,286 11,979,286 12 263,281
693,000 693,000 13 37,061
26,251,016 26,251,016 14 760,899
FERC FORM NO. 1 (ED. 12-90) Page 327
5,586,110 22,800,619 146,488,647 -14,251,088 155,038,178
20170505-8016 FERC PDF (Unofficial) 04/07/2017
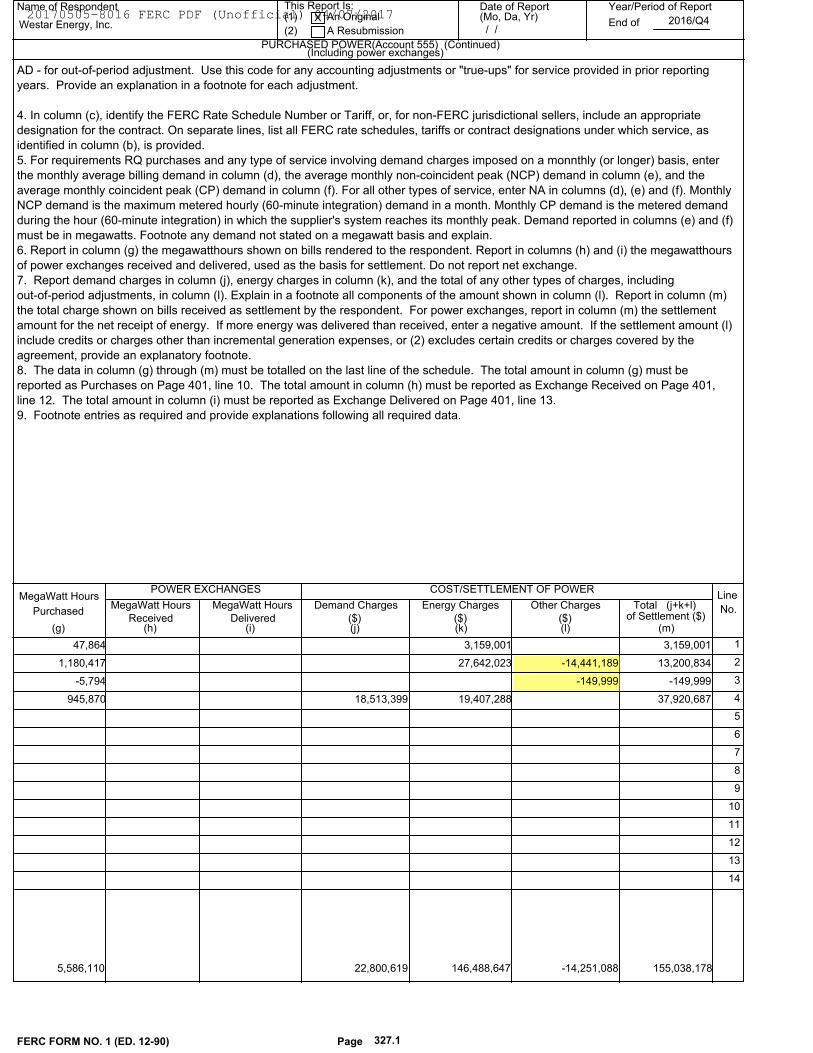
Name of Respondent This Report Is:(1) An Original
(2) A Resubmission
Date of Report(Mo, Da, Yr)
Year/Period of Report
End of
PURCHASED POWER(Account 555) (Continued)
Westar Energy, Inc.X
/ /2016/Q4
Line
No.MegaWatt Hours
(i)(h)(g) (j)
Demand Charges Energy Charges Other Charges
(k)
Purchased(j+k+l)Total
COST/SETTLEMENT OF POWER
($) ($) ($)
(Including power exchanges)
POWER EXCHANGES
MegaWatt HoursReceived
MegaWatt HoursDelivered
(l) (m)of Settlement ($)
AD - for out-of-period adjustment. Use this code for any accounting adjustments or "true-ups" for service provided in prior reporting
years. Provide an explanation in a footnote for each adjustment.
4. In column (c), identify the FERC Rate Schedule Number or Tariff, or, for non-FERC jurisdictional sellers, include an appropriate
designation for the contract. On separate lines, list all FERC rate schedules, tariffs or contract designations under which service, as
identified in column (b), is provided.
5. For requirements RQ purchases and any type of service involving demand charges imposed on a monnthly (or longer) basis, enter
the monthly average billing demand in column (d), the average monthly non-coincident peak (NCP) demand in column (e), and the
average monthly coincident peak (CP) demand in column (f). For all other types of service, enter NA in columns (d), (e) and (f). Monthly
NCP demand is the maximum metered hourly (60-minute integration) demand in a month. Monthly CP demand is the metered demand
during the hour (60-minute integration) in which the supplier's system reaches its monthly peak. Demand reported in columns (e) and (f)
must be in megawatts. Footnote any demand not stated on a megawatt basis and explain.
6. Report in column (g) the megawatthours shown on bills rendered to the respondent. Report in columns (h) and (i) the megawatthours
of power exchanges received and delivered, used as the basis for settlement. Do not report net exchange.
7. Report demand charges in column (j), energy charges in column (k), and the total of any other types of charges, including
out-of-period adjustments, in column (l). Explain in a footnote all components of the amount shown in column (l). Report in column (m)
the total charge shown on bills received as settlement by the respondent. For power exchanges, report in column (m) the settlement
amount for the net receipt of energy. If more energy was delivered than received, enter a negative amount. If the settlement amount (l)
include credits or charges other than incremental generation expenses, or (2) excludes certain credits or charges covered by the
agreement, provide an explanatory footnote.
8. The data in column (g) through (m) must be totalled on the last line of the schedule. The total amount in column (g) must be
reported as Purchases on Page 401, line 10. The total amount in column (h) must be reported as Exchange Received on Page 401,
line 12. The total amount in column (i) must be reported as Exchange Delivered on Page 401, line 13.
9. Footnote entries as required and provide explanations following all required data.
3,159,001 3,159,001 1 47,864
27,642,023 -14,441,189 13,200,834 2 1,180,417
-149,999 -149,999 3 -5,794
18,513,399 19,407,288 37,920,687 4 945,870
5
6
7
8
9
10
11
12
13
14
FERC FORM NO. 1 (ED. 12-90) Page 327.1
5,586,110 22,800,619 146,488,647 -14,251,088 155,038,178
20170505-8016 FERC PDF (Unofficial) 04/07/2017
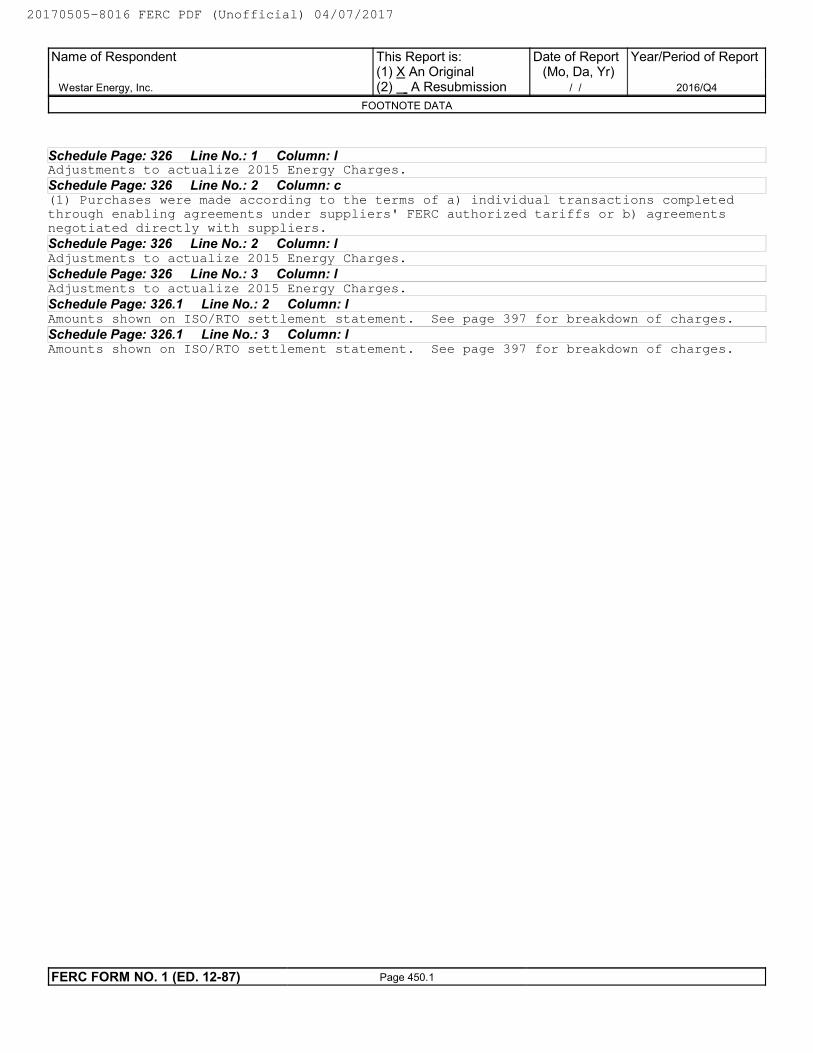
Schedule Page: 326 Line No.: 1 Column: lAdjustments to actualize 2015 Energy Charges.
Schedule Page: 326 Line No.: 2 Column: c(1) Purchases were made according to the terms of a) individual transactions completedthrough enabling agreements under suppliers' FERC authorized tariffs or b) agreementsnegotiated directly with suppliers.
Schedule Page: 326 Line No.: 2 Column: lAdjustments to actualize 2015 Energy Charges.
Schedule Page: 326 Line No.: 3 Column: lAdjustments to actualize 2015 Energy Charges.
Schedule Page: 326.1 Line No.: 2 Column: lAmounts shown on ISO/RTO settlement statement. See page 397 for breakdown of charges.
Schedule Page: 326.1 Line No.: 3 Column: lAmounts shown on ISO/RTO settlement statement. See page 397 for breakdown of charges.
Name of Respondent
Westar Energy, Inc.
This Report is:(1) X An Original(2) A Resubmission
Date of Report(Mo, Da, Yr)
/ /
Year/Period of Report
2016/Q4
FOOTNOTE DATA
FERC FORM NO. 1 (ED. 12-87) Page 450.1
20170505-8016 FERC PDF (Unofficial) 04/07/2017
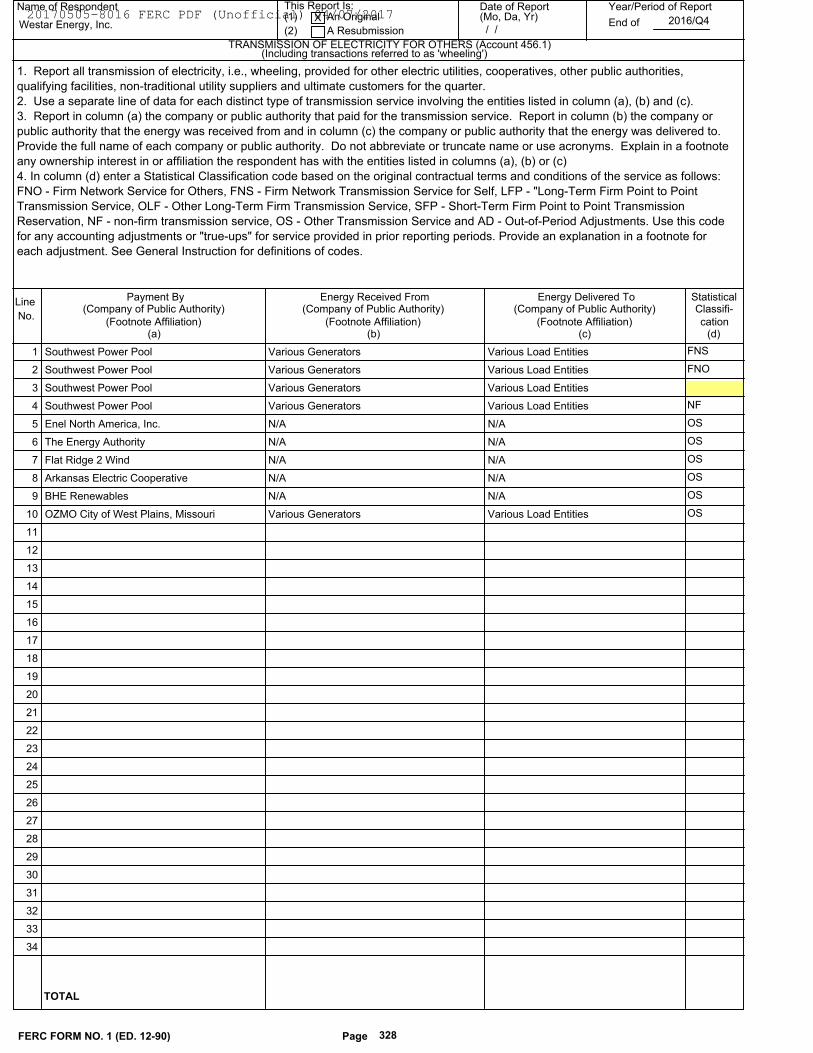
TRANSMISSION OF ELECTRICITY FOR OTHERS (Account 456.1)
Name of Respondent This Report Is:(1) An Original
(2) A Resubmission
Date of Report(Mo, Da, Yr)
Year/Period of Report
End ofWestar Energy, Inc.X
/ /2016/Q4
Line
No.
Payment By
(c)(b)(a) (d)
Statistical
cation
Classifi-
(Footnote Affiliation)
(Including transactions referred to as 'wheeling')
(Company of Public Authority)
(Footnote Affiliation)
(Company of Public Authority)
(Footnote Affiliation)
(Company of Public Authority)Energy Received From Energy Delivered To
1. Report all transmission of electricity, i.e., wheeling, provided for other electric utilities, cooperatives, other public authorities,
qualifying facilities, non-traditional utility suppliers and ultimate customers for the quarter.
2. Use a separate line of data for each distinct type of transmission service involving the entities listed in column (a), (b) and (c).
3. Report in column (a) the company or public authority that paid for the transmission service. Report in column (b) the company or
public authority that the energy was received from and in column (c) the company or public authority that the energy was delivered to.
Provide the full name of each company or public authority. Do not abbreviate or truncate name or use acronyms. Explain in a footnote
any ownership interest in or affiliation the respondent has with the entities listed in columns (a), (b) or (c)
4. In column (d) enter a Statistical Classification code based on the original contractual terms and conditions of the service as follows:
FNO - Firm Network Service for Others, FNS - Firm Network Transmission Service for Self, LFP - "Long-Term Firm Point to Point
Transmission Service, OLF - Other Long-Term Firm Transmission Service, SFP - Short-Term Firm Point to Point Transmission
Reservation, NF - non-firm transmission service, OS - Other Transmission Service and AD - Out-of-Period Adjustments. Use this code
for any accounting adjustments or "true-ups" for service provided in prior reporting periods. Provide an explanation in a footnote for
each adjustment. See General Instruction for definitions of codes.
Southwest Power Pool Various Generators Various Load Entities FNS 1
Southwest Power Pool Various Generators Various Load Entities FNO 2
Southwest Power Pool Various Generators Various Load Entities 3
Southwest Power Pool Various Generators Various Load Entities NF 4
Enel North America, Inc. N/A N/A OS 5
The Energy Authority N/A N/A OS 6
Flat Ridge 2 Wind N/A N/A OS 7
Arkansas Electric Cooperative N/A N/A OS 8
BHE Renewables N/A N/A OS 9
OZMO City of West Plains, Missouri Various Generators Various Load Entities OS 10
11
12
13
14
15
16
17
18
19
20
21
22
23
24
25
26
27
28
29
30
31
32
33
34
FERC FORM NO. 1 (ED. 12-90) Page 328
TOTAL
20170505-8016 FERC PDF (Unofficial) 04/07/2017
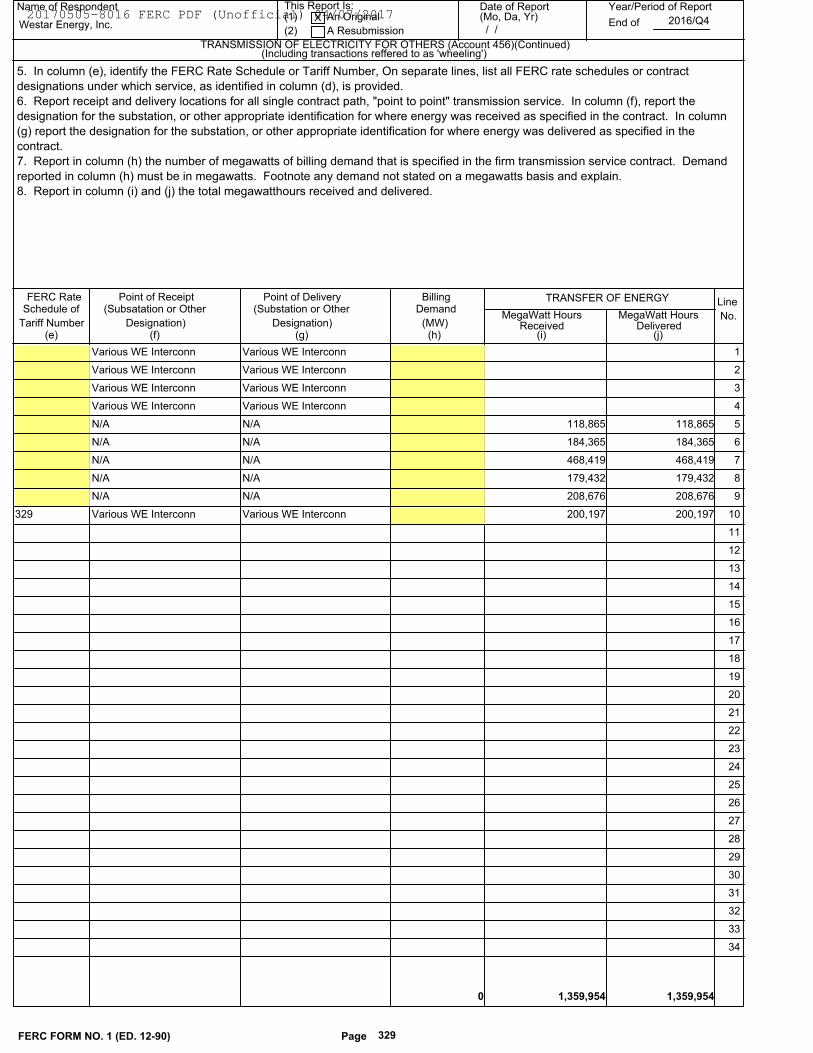
Name of Respondent This Report Is:(1) An Original
(2) A Resubmission
Date of Report(Mo, Da, Yr)
Year/Period of Report
End of
TRANSMISSION OF ELECTRICITY FOR OTHERS (Account 456)(Continued)
Westar Energy, Inc.X
/ /2016/Q4
Line
No.
(Including transactions reffered to as 'wheeling')
FERC RateSchedule of
Tariff Number(e)
Point of Receipt(Subsatation or Other
Designation)(f)
Point of Delivery(Substation or Other
(g)
BillingDemand
(MW)(h)
TRANSFER OF ENERGY
MegaWatt HoursReceived
(i)Delivered
(j)
MegaWatt HoursDesignation)
5. In column (e), identify the FERC Rate Schedule or Tariff Number, On separate lines, list all FERC rate schedules or contract
designations under which service, as identified in column (d), is provided.
6. Report receipt and delivery locations for all single contract path, "point to point" transmission service. In column (f), report the
designation for the substation, or other appropriate identification for where energy was received as specified in the contract. In column
(g) report the designation for the substation, or other appropriate identification for where energy was delivered as specified in the
contract.
7. Report in column (h) the number of megawatts of billing demand that is specified in the firm transmission service contract. Demand
reported in column (h) must be in megawatts. Footnote any demand not stated on a megawatts basis and explain.
8. Report in column (i) and (j) the total megawatthours received and delivered.
Various WE Interconn Various WE Interconn 1
Various WE Interconn Various WE Interconn 2
Various WE Interconn Various WE Interconn 3
Various WE Interconn Various WE Interconn 4
N/A N/A 118,865 118,865 5
N/A N/A 184,365 184,365 6
N/A N/A 468,419 468,419 7
N/A N/A 179,432 179,432 8
N/A N/A 208,676 208,676 9
Various WE Interconn329 Various WE Interconn 200,197 200,197 10
11
12
13
14
15
16
17
18
19
20
21
22
23
24
25
26
27
28
29
30
31
32
33
34
FERC FORM NO. 1 (ED. 12-90) Page 329
0 1,359,954 1,359,954
20170505-8016 FERC PDF (Unofficial) 04/07/2017
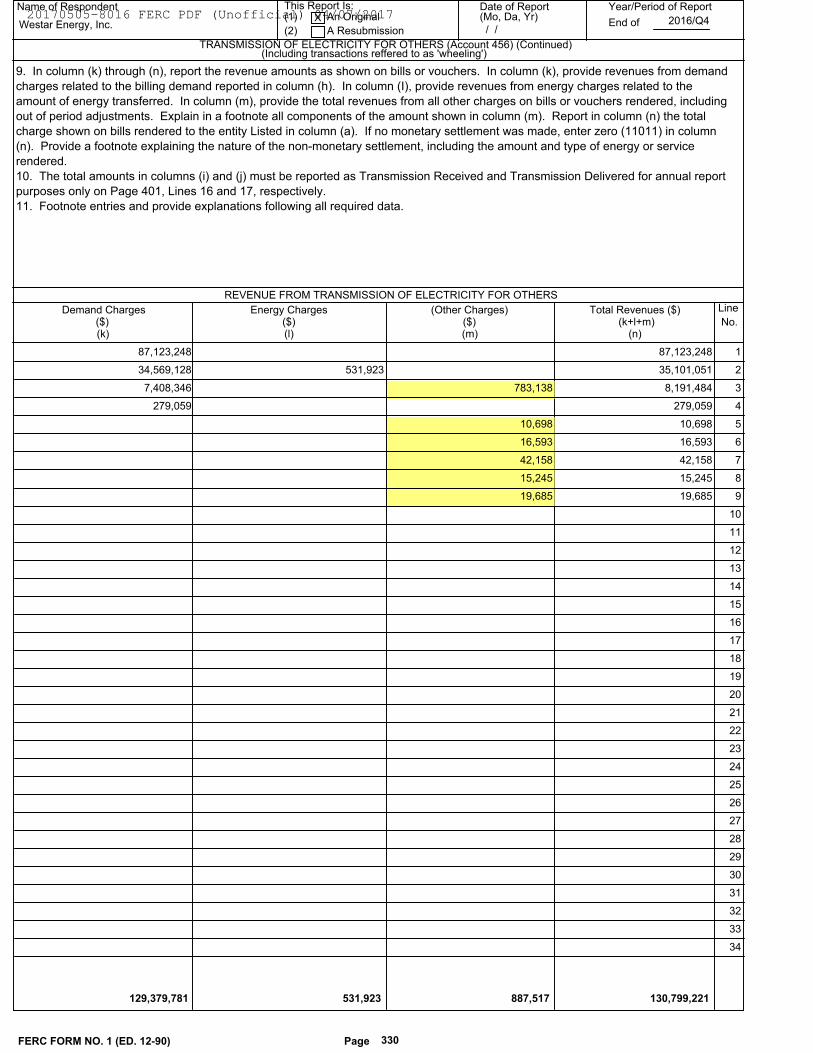
Name of Respondent This Report Is:(1) An Original
(2) A Resubmission
Date of Report(Mo, Da, Yr)
Year/Period of Report
End of
TRANSMISSION OF ELECTRICITY FOR OTHERS (Account 456) (Continued)
Westar Energy, Inc.X
/ /2016/Q4
Line
No.(m)(l)(k) (n)
(k+l+m)Total Revenues ($)
(Including transactions reffered to as 'wheeling')
($)Energy Charges
($)(Other Charges)Demand Charges
($)
REVENUE FROM TRANSMISSION OF ELECTRICITY FOR OTHERS
9. In column (k) through (n), report the revenue amounts as shown on bills or vouchers. In column (k), provide revenues from demand
charges related to the billing demand reported in column (h). In column (I), provide revenues from energy charges related to the
amount of energy transferred. In column (m), provide the total revenues from all other charges on bills or vouchers rendered, including
out of period adjustments. Explain in a footnote all components of the amount shown in column (m). Report in column (n) the total
charge shown on bills rendered to the entity Listed in column (a). If no monetary settlement was made, enter zero (11011) in column
(n). Provide a footnote explaining the nature of the non-monetary settlement, including the amount and type of energy or service
rendered.
10. The total amounts in columns (i) and (j) must be reported as Transmission Received and Transmission Delivered for annual report
purposes only on Page 401, Lines 16 and 17, respectively.
11. Footnote entries and provide explanations following all required data.
87,123,248 87,123,248 1
34,569,128 35,101,051 531,923 2
7,408,346 8,191,484 783,138 3
279,059 279,059 4
10,698 10,698 5
16,593 16,593 6
42,158 42,158 7
15,245 15,245 8
19,685 19,685 9
10
11
12
13
14
15
16
17
18
19
20
21
22
23
24
25
26
27
28
29
30
31
32
33
34
FERC FORM NO. 1 (ED. 12-90) Page 330
129,379,781 130,799,221 887,517 531,923
20170505-8016 FERC PDF (Unofficial) 04/07/2017
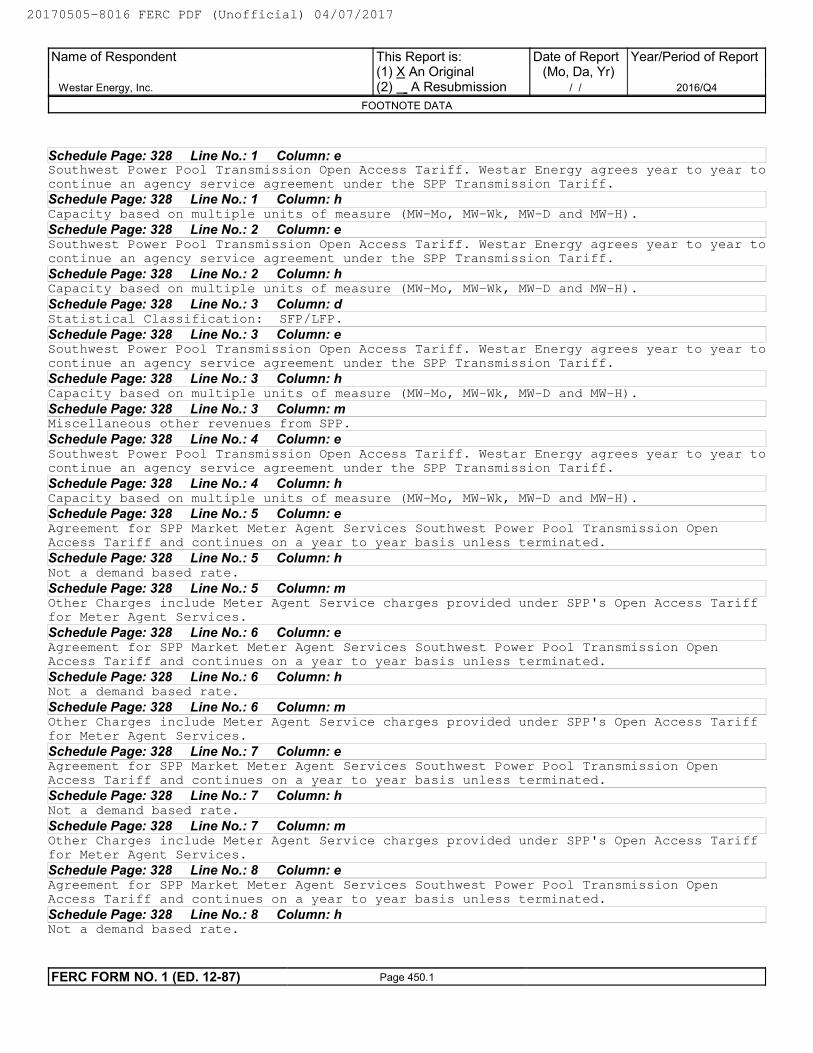
Schedule Page: 328 Line No.: 1 Column: eSouthwest Power Pool Transmission Open Access Tariff. Westar Energy agrees year to year tocontinue an agency service agreement under the SPP Transmission Tariff.
Schedule Page: 328 Line No.: 1 Column: hCapacity based on multiple units of measure (MW-Mo, MW-Wk, MW-D and MW-H).
Schedule Page: 328 Line No.: 2 Column: eSouthwest Power Pool Transmission Open Access Tariff. Westar Energy agrees year to year tocontinue an agency service agreement under the SPP Transmission Tariff.
Schedule Page: 328 Line No.: 2 Column: hCapacity based on multiple units of measure (MW-Mo, MW-Wk, MW-D and MW-H).
Schedule Page: 328 Line No.: 3 Column: dStatistical Classification: SFP/LFP.
Schedule Page: 328 Line No.: 3 Column: eSouthwest Power Pool Transmission Open Access Tariff. Westar Energy agrees year to year tocontinue an agency service agreement under the SPP Transmission Tariff.
Schedule Page: 328 Line No.: 3 Column: hCapacity based on multiple units of measure (MW-Mo, MW-Wk, MW-D and MW-H).
Schedule Page: 328 Line No.: 3 Column: mMiscellaneous other revenues from SPP.
Schedule Page: 328 Line No.: 4 Column: eSouthwest Power Pool Transmission Open Access Tariff. Westar Energy agrees year to year tocontinue an agency service agreement under the SPP Transmission Tariff.
Schedule Page: 328 Line No.: 4 Column: hCapacity based on multiple units of measure (MW-Mo, MW-Wk, MW-D and MW-H).
Schedule Page: 328 Line No.: 5 Column: eAgreement for SPP Market Meter Agent Services Southwest Power Pool Transmission OpenAccess Tariff and continues on a year to year basis unless terminated.
Schedule Page: 328 Line No.: 5 Column: hNot a demand based rate.
Schedule Page: 328 Line No.: 5 Column: mOther Charges include Meter Agent Service charges provided under SPP's Open Access Tarifffor Meter Agent Services.
Schedule Page: 328 Line No.: 6 Column: eAgreement for SPP Market Meter Agent Services Southwest Power Pool Transmission OpenAccess Tariff and continues on a year to year basis unless terminated.
Schedule Page: 328 Line No.: 6 Column: hNot a demand based rate.
Schedule Page: 328 Line No.: 6 Column: mOther Charges include Meter Agent Service charges provided under SPP's Open Access Tarifffor Meter Agent Services.
Schedule Page: 328 Line No.: 7 Column: eAgreement for SPP Market Meter Agent Services Southwest Power Pool Transmission OpenAccess Tariff and continues on a year to year basis unless terminated.
Schedule Page: 328 Line No.: 7 Column: hNot a demand based rate.
Schedule Page: 328 Line No.: 7 Column: mOther Charges include Meter Agent Service charges provided under SPP's Open Access Tarifffor Meter Agent Services.
Schedule Page: 328 Line No.: 8 Column: eAgreement for SPP Market Meter Agent Services Southwest Power Pool Transmission OpenAccess Tariff and continues on a year to year basis unless terminated.
Schedule Page: 328 Line No.: 8 Column: hNot a demand based rate.
Name of Respondent
Westar Energy, Inc.
This Report is:(1) X An Original(2) A Resubmission
Date of Report(Mo, Da, Yr)
/ /
Year/Period of Report
2016/Q4
FOOTNOTE DATA
FERC FORM NO. 1 (ED. 12-87) Page 450.1
20170505-8016 FERC PDF (Unofficial) 04/07/2017
Schedule Page: 328 Line No.: 8 Column: mOther Charges include Meter Agent Service charges provided under SPP's Open Access Tarifffor Meter Agent Services.
Schedule Page: 328 Line No.: 9 Column: eAgreement for SPP Market Meter Agent Services Southwest Power Pool Transmission OpenAccess Tariff and continues on a year to year basis unless terminated.
Schedule Page: 328 Line No.: 9 Column: hNot a demand based rate.
Schedule Page: 328 Line No.: 9 Column: mOther Charges include Meter Agent Service charges provided under SPP's Open Access Tarifffor Meter Agent Services.
Schedule Page: 328 Line No.: 10 Column: hNot a demand based rate.
Name of Respondent
Westar Energy, Inc.
This Report is:(1) X An Original(2) A Resubmission
Date of Report(Mo, Da, Yr)
/ /
Year/Period of Report
2016/Q4
FOOTNOTE DATA
FERC FORM NO. 1 (ED. 12-87) Page 450.2
20170505-8016 FERC PDF (Unofficial) 04/07/2017
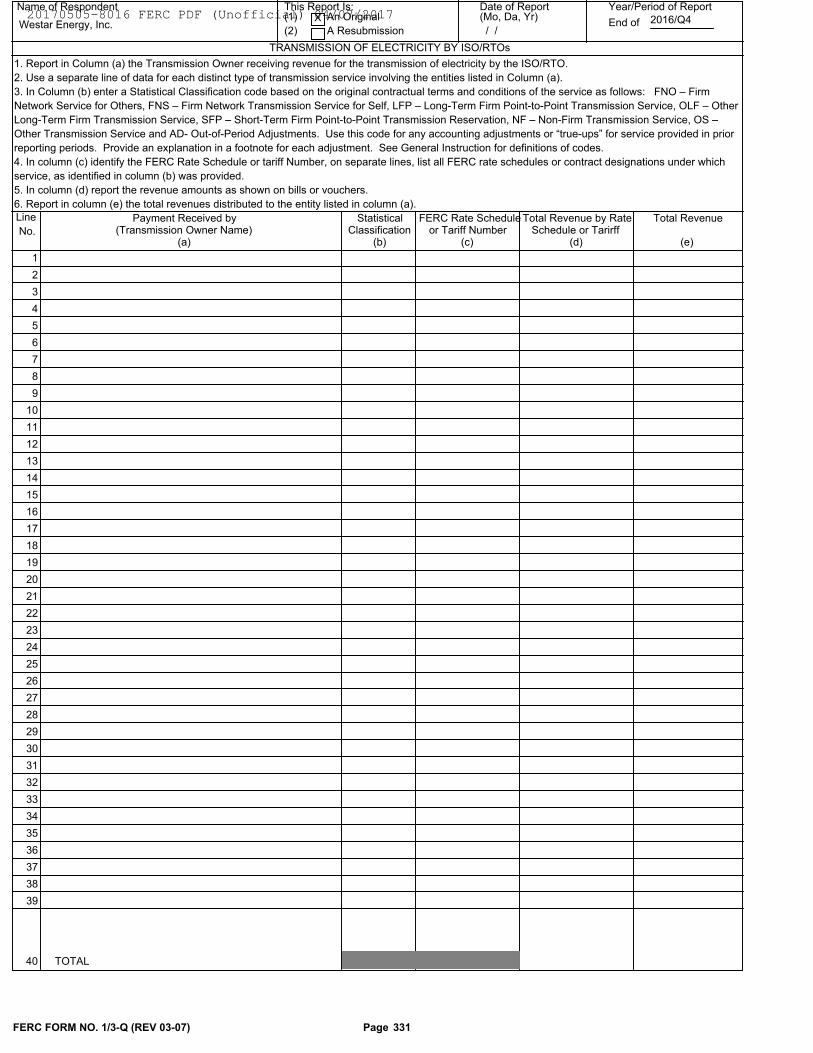
Name of Respondent This Report Is:(1) An Original
(2) A Resubmission
Date of Report(Mo, Da, Yr)
Year/Period of Report
End of
TRANSMISSION OF ELECTRICITY BY ISO/RTOs
Westar Energy, Inc.X
/ /2016/Q4
Line
No.
Payment Received by Statistical
(b)(a)(Transmission Owner Name) Classification
FERC Rate Scheduleor Tariff Number
(c)
Total Revenue by RateSchedule or Tarirff
(d)
Total Revenue
(e)
1. Report in Column (a) the Transmission Owner receiving revenue for the transmission of electricity by the ISO/RTO.
2. Use a separate line of data for each distinct type of transmission service involving the entities listed in Column (a).
3. In Column (b) enter a Statistical Classification code based on the original contractual terms and conditions of the service as follows: FNO – Firm
Network Service for Others, FNS – Firm Network Transmission Service for Self, LFP – Long-Term Firm Point-to-Point Transmission Service, OLF – Other
Long-Term Firm Transmission Service, SFP – Short-Term Firm Point-to-Point Transmission Reservation, NF – Non-Firm Transmission Service, OS –
Other Transmission Service and AD- Out-of-Period Adjustments. Use this code for any accounting adjustments or “true-ups” for service provided in prior
reporting periods. Provide an explanation in a footnote for each adjustment. See General Instruction for definitions of codes.
4. In column (c) identify the FERC Rate Schedule or tariff Number, on separate lines, list all FERC rate schedules or contract designations under which
service, as identified in column (b) was provided.
5. In column (d) report the revenue amounts as shown on bills or vouchers.
6. Report in column (e) the total revenues distributed to the entity listed in column (a).
1
2
3
4
5
6
7
8
9
10
11
12
13
14
15
16
17
18
19
20
21
22
23
24
25
26
27
28
29
30
31
32
33
34
35
36
37
38
39
Page 331
40 TOTAL
FERC FORM NO. 1/3-Q (REV 03-07)
20170505-8016 FERC PDF (Unofficial) 04/07/2017
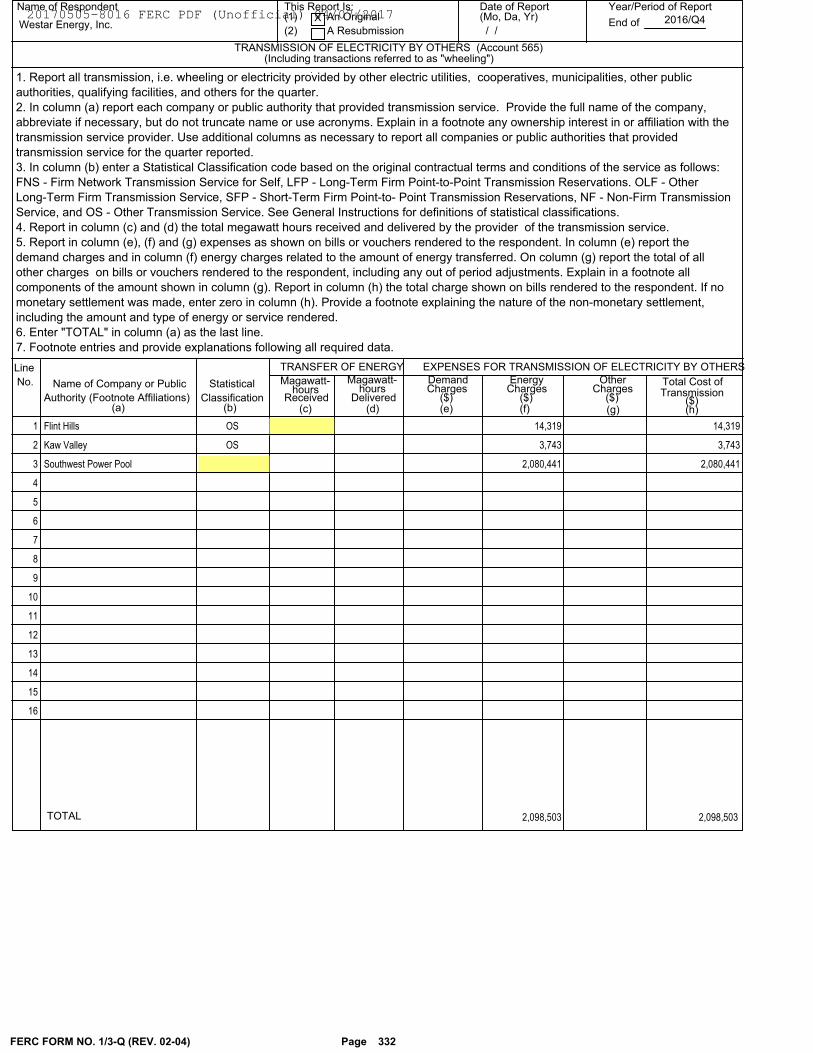
Name of Respondent This Report Is:(1) An Original
(2) A Resubmission
Date of Report(Mo, Da, Yr)
Year/Period of Report
End of
TRANSMISSION OF ELECTRICITY BY OTHERS (Account 565)
Westar Energy, Inc.X
/ /2016/Q4
Line
No. Name of Company or Public
(d)(c)(a)Authority (Footnote Affiliations)
TRANSFER OF ENERGY
Magawatt-hours
Received
Magawatt-
Deliveredhours
EXPENSES FOR TRANSMISSION OF ELECTRICITY BY OTHERSDemandCharges
($)(e)
EnergyCharges
(f)($)
OtherCharges
($)(g)
($)
Total Cost ofTransmission
(h)
(Including transactions referred to as "wheeling")
1. Report all transmission, i.e. wheeling or electricity provided by other electric utilities, cooperatives, municipalities, other public
authorities, qualifying facilities, and others for the quarter.
2. In column (a) report each company or public authority that provided transmission service. Provide the full name of the company,
abbreviate if necessary, but do not truncate name or use acronyms. Explain in a footnote any ownership interest in or affiliation with the
transmission service provider. Use additional columns as necessary to report all companies or public authorities that provided
transmission service for the quarter reported.
3. In column (b) enter a Statistical Classification code based on the original contractual terms and conditions of the service as follows:
FNS - Firm Network Transmission Service for Self, LFP - Long-Term Firm Point-to-Point Transmission Reservations. OLF - Other
Long-Term Firm Transmission Service, SFP - Short-Term Firm Point-to- Point Transmission Reservations, NF - Non-Firm Transmission
Service, and OS - Other Transmission Service. See General Instructions for definitions of statistical classifications.
4. Report in column (c) and (d) the total megawatt hours received and delivered by the provider of the transmission service.
5. Report in column (e), (f) and (g) expenses as shown on bills or vouchers rendered to the respondent. In column (e) report the
demand charges and in column (f) energy charges related to the amount of energy transferred. On column (g) report the total of all
other charges on bills or vouchers rendered to the respondent, including any out of period adjustments. Explain in a footnote all
components of the amount shown in column (g). Report in column (h) the total charge shown on bills rendered to the respondent. If no
monetary settlement was made, enter zero in column (h). Provide a footnote explaining the nature of the non-monetary settlement,
including the amount and type of energy or service rendered.
6. Enter "TOTAL" in column (a) as the last line.
7. Footnote entries and provide explanations following all required data.
Statistical
Classification(b)
OS 14,319 14,319Flint Hills 1
OS 3,743 3,743Kaw Valley 2
2,080,441 2,080,441Southwest Power Pool 3
4
5
6
7
8
9
10
11
12
13
14
15
16
FERC FORM NO. 1/3-Q (REV. 02-04) Page 332
2,098,503 2,098,503TOTAL
20170505-8016 FERC PDF (Unofficial) 04/07/2017
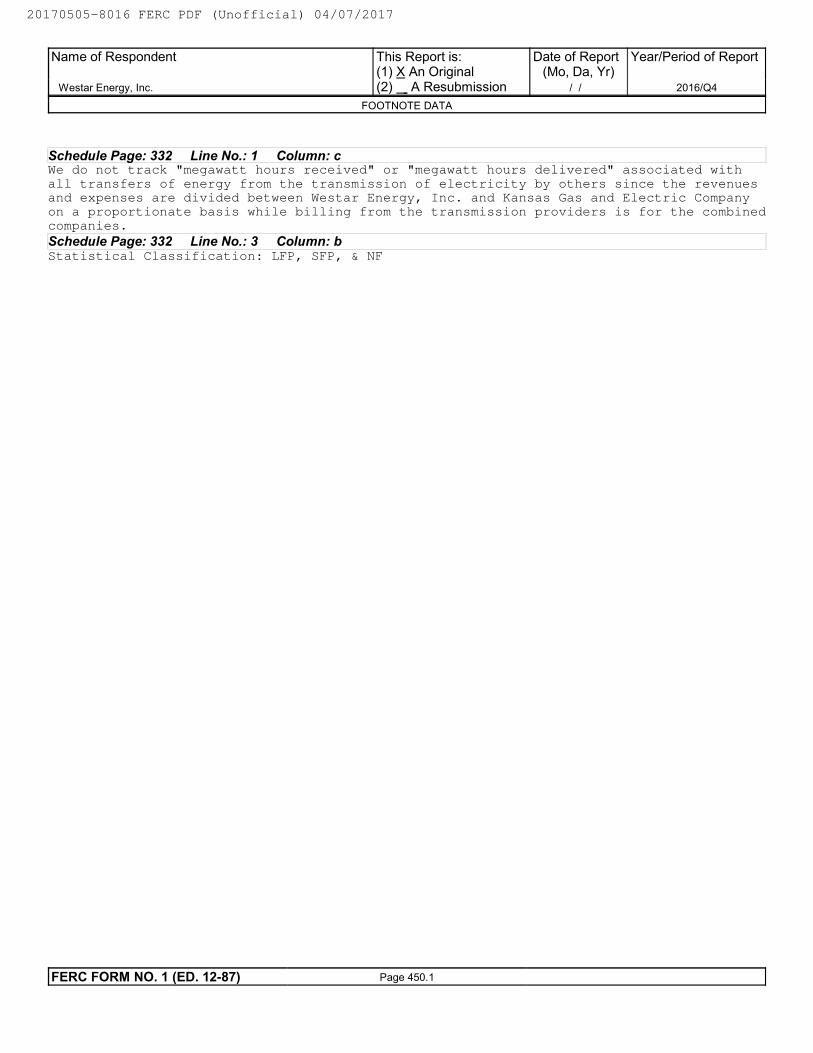
Schedule Page: 332 Line No.: 1 Column: cWe do not track "megawatt hours received" or "megawatt hours delivered" associated with
all transfers of energy from the transmission of electricity by others since the revenues
and expenses are divided between Westar Energy, Inc. and Kansas Gas and Electric Company
on a proportionate basis while billing from the transmission providers is for the combined
companies.
Schedule Page: 332 Line No.: 3 Column: bStatistical Classification: LFP, SFP, & NF
Name of Respondent
Westar Energy, Inc.
This Report is:(1) X An Original(2) A Resubmission
Date of Report(Mo, Da, Yr)
/ /
Year/Period of Report
2016/Q4
FOOTNOTE DATA
FERC FORM NO. 1 (ED. 12-87) Page 450.1
20170505-8016 FERC PDF (Unofficial) 04/07/2017
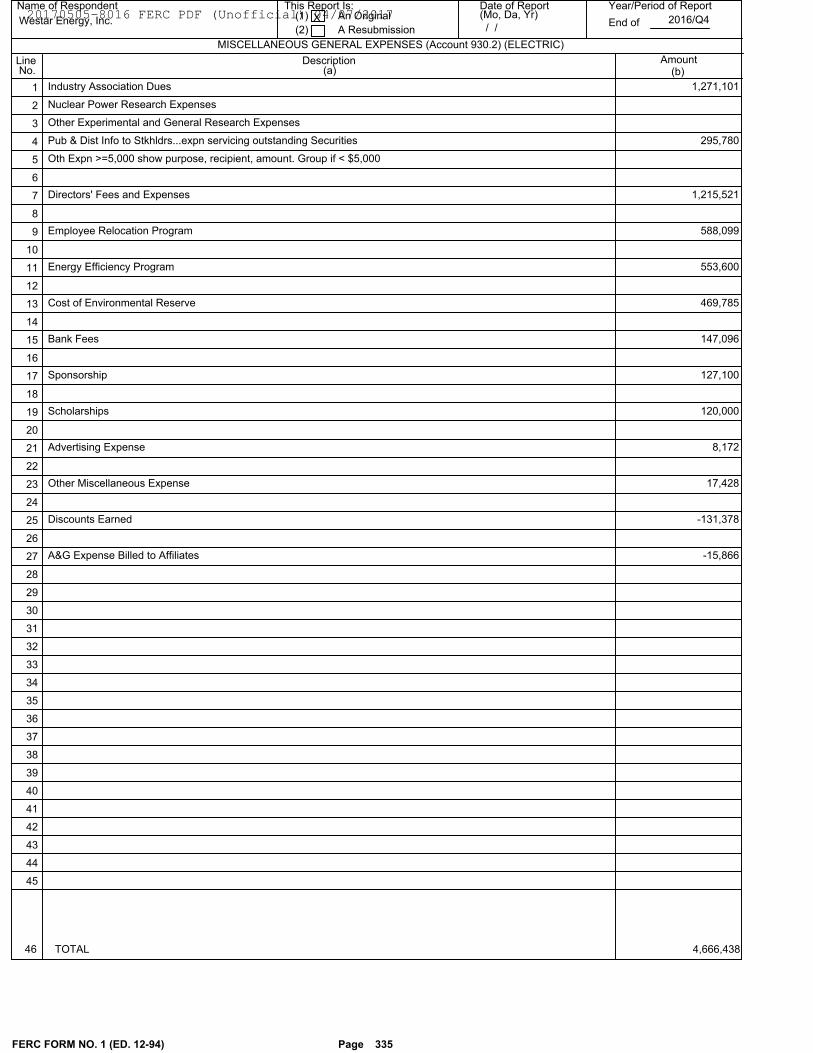
Name of Respondent This Report Is:(1) An Original
(2) A Resubmission
Date of Report(Mo, Da, Yr)
Year/Period of Report
End of
MISCELLANEOUS GENERAL EXPENSES (Account 930.2) (ELECTRIC)
Westar Energy, Inc. X / /
2016/Q4
Line Description Amount(b)(a)No.
1,271,101Industry Association Dues 1
Nuclear Power Research Expenses 2
Other Experimental and General Research Expenses 3
295,780Pub & Dist Info to Stkhldrs...expn servicing outstanding Securities 4
Oth Expn >=5,000 show purpose, recipient, amount. Group if < $5,000 5
6
1,215,521Directors' Fees and Expenses 7
8
588,099Employee Relocation Program 9
10
553,600Energy Efficiency Program 11
12
469,785Cost of Environmental Reserve 13
14
147,096Bank Fees 15
16
127,100Sponsorship 17
18
120,000Scholarships 19
20
8,172Advertising Expense 21
22
17,428Other Miscellaneous Expense 23
24
-131,378Discounts Earned 25
26
-15,866A&G Expense Billed to Affiliates 27
28
29
30
31
32
33
34
35
36
37
38
39
40
41
42
43
44
45
4,666,438
FERC FORM NO. 1 (ED. 12-94) Page 335
46 TOTAL
20170505-8016 FERC PDF (Unofficial) 04/07/2017
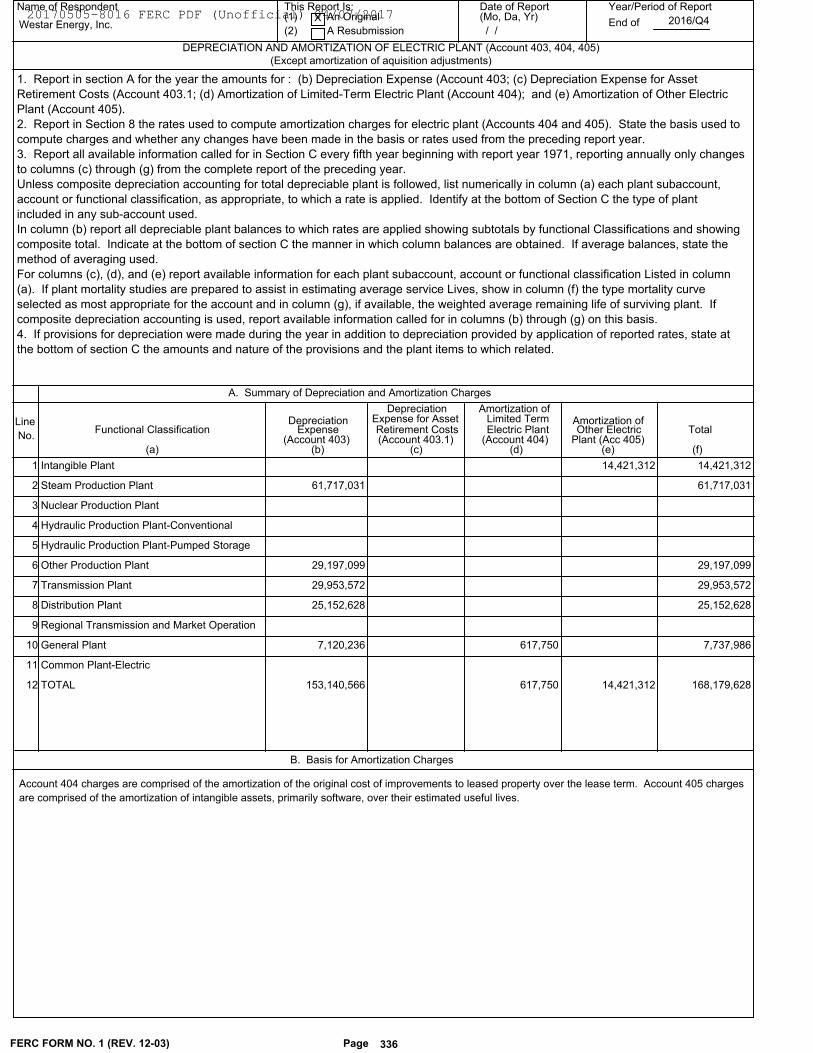
Name of Respondent This Report Is:(1) An Original
(2) A Resubmission
Date of Report(Mo, Da, Yr)
Year/Period of Report
End of
DEPRECIATION AND AMORTIZATION OF ELECTRIC PLANT (Account 403, 404, 405)
Westar Energy, Inc.X
/ /2016/Q4
Line
No.Functional Classification
Depreciation
(d)(b)(a)
Amortization of
Total
(Except amortization of aquisition adjustments)
A. Summary of Depreciation and Amortization Charges
Expense(Account 403)
Limited TermElectric Plant
Amortization ofOther Electric
Plant (Acc 405)(e) (f)
1. Report in section A for the year the amounts for : (b) Depreciation Expense (Account 403; (c) Depreciation Expense for Asset
Retirement Costs (Account 403.1; (d) Amortization of Limited-Term Electric Plant (Account 404); and (e) Amortization of Other Electric
Plant (Account 405).
2. Report in Section 8 the rates used to compute amortization charges for electric plant (Accounts 404 and 405). State the basis used to
compute charges and whether any changes have been made in the basis or rates used from the preceding report year.
3. Report all available information called for in Section C every fifth year beginning with report year 1971, reporting annually only changes
to columns (c) through (g) from the complete report of the preceding year.
Unless composite depreciation accounting for total depreciable plant is followed, list numerically in column (a) each plant subaccount,
account or functional classification, as appropriate, to which a rate is applied. Identify at the bottom of Section C the type of plant
included in any sub-account used.
In column (b) report all depreciable plant balances to which rates are applied showing subtotals by functional Classifications and showing
composite total. Indicate at the bottom of section C the manner in which column balances are obtained. If average balances, state the
method of averaging used.
For columns (c), (d), and (e) report available information for each plant subaccount, account or functional classification Listed in column
(a). If plant mortality studies are prepared to assist in estimating average service Lives, show in column (f) the type mortality curve
selected as most appropriate for the account and in column (g), if available, the weighted average remaining life of surviving plant. If
composite depreciation accounting is used, report available information called for in columns (b) through (g) on this basis.
4. If provisions for depreciation were made during the year in addition to depreciation provided by application of reported rates, state at
the bottom of section C the amounts and nature of the provisions and the plant items to which related.
(Account 404)(c)
DepreciationExpense for AssetRetirement Costs(Account 403.1)
14,421,312 14,421,312 1 Intangible Plant
61,717,031 61,717,031 2 Steam Production Plant
3 Nuclear Production Plant
4 Hydraulic Production Plant-Conventional
5 Hydraulic Production Plant-Pumped Storage
29,197,099 29,197,099 6 Other Production Plant
29,953,572 29,953,572 7 Transmission Plant
25,152,628 25,152,628 8 Distribution Plant
9 Regional Transmission and Market Operation
7,737,986 7,120,236 617,750 10 General Plant
11 Common Plant-Electric
168,179,628 153,140,566 617,750 14,421,312 12 TOTAL
Account 404 charges are comprised of the amortization of the original cost of improvements to leased property over the lease term. Account 405 charges
are comprised of the amortization of intangible assets, primarily software, over their estimated useful lives.
FERC FORM NO. 1 (REV. 12-03) Page 336
B. Basis for Amortization Charges
20170505-8016 FERC PDF (Unofficial) 04/07/2017
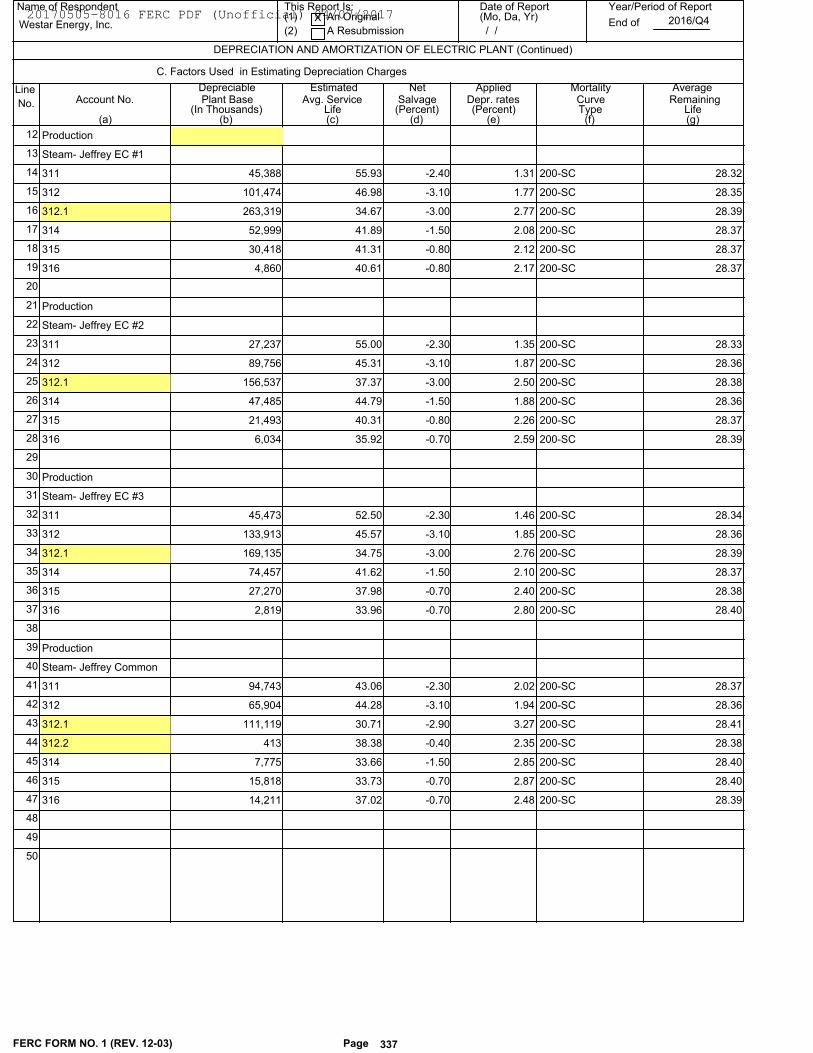
Name of Respondent This Report Is:(1) An Original
(2) A Resubmission
Date of Report(Mo, Da, Yr)
Year/Period of Report
End of
DEPRECIATION AND AMORTIZATION OF ELECTRIC PLANT (Continued)
Westar Energy, Inc.X
/ /2016/Q4
Line
No. Account No.
(c)(b)(a) (d) (e)
C. Factors Used in Estimating Depreciation Charges
DepreciablePlant Base
(In Thousands)
EstimatedAvg. Service
Life
NetSalvage
(Percent)
AppliedDepr. rates
MortalityCurveType
AverageRemaining
Life(f) (g)
(Percent)
Production 12
Steam- Jeffrey EC #1 13
55.93 -2.40 1.31 28.32200-SC311 45,388 14
46.98 -3.10 1.77 28.35200-SC312 101,474 15
34.67 -3.00 2.77 28.39200-SC312.1 263,319 16
41.89 -1.50 2.08 28.37200-SC314 52,999 17
41.31 -0.80 2.12 28.37200-SC315 30,418 18
40.61 -0.80 2.17 28.37200-SC316 4,860 19
20
Production 21
Steam- Jeffrey EC #2 22
55.00 -2.30 1.35 28.33200-SC311 27,237 23
45.31 -3.10 1.87 28.36200-SC312 89,756 24
37.37 -3.00 2.50 28.38200-SC312.1 156,537 25
44.79 -1.50 1.88 28.36200-SC314 47,485 26
40.31 -0.80 2.26 28.37200-SC315 21,493 27
35.92 -0.70 2.59 28.39200-SC316 6,034 28
29
Production 30
Steam- Jeffrey EC #3 31
52.50 -2.30 1.46 28.34200-SC311 45,473 32
45.57 -3.10 1.85 28.36200-SC312 133,913 33
34.75 -3.00 2.76 28.39200-SC312.1 169,135 34
41.62 -1.50 2.10 28.37200-SC314 74,457 35
37.98 -0.70 2.40 28.38200-SC315 27,270 36
33.96 -0.70 2.80 28.40200-SC316 2,819 37
38
Production 39
Steam- Jeffrey Common 40
43.06 -2.30 2.02 28.37200-SC311 94,743 41
44.28 -3.10 1.94 28.36200-SC312 65,904 42
30.71 -2.90 3.27 28.41200-SC312.1 111,119 43
38.38 -0.40 2.35 28.38200-SC312.2 413 44
33.66 -1.50 2.85 28.40200-SC314 7,775 45
33.73 -0.70 2.87 28.40200-SC315 15,818 46
37.02 -0.70 2.48 28.39200-SC316 14,211 47
48
49
50
FERC FORM NO. 1 (REV. 12-03) Page 337
20170505-8016 FERC PDF (Unofficial) 04/07/2017
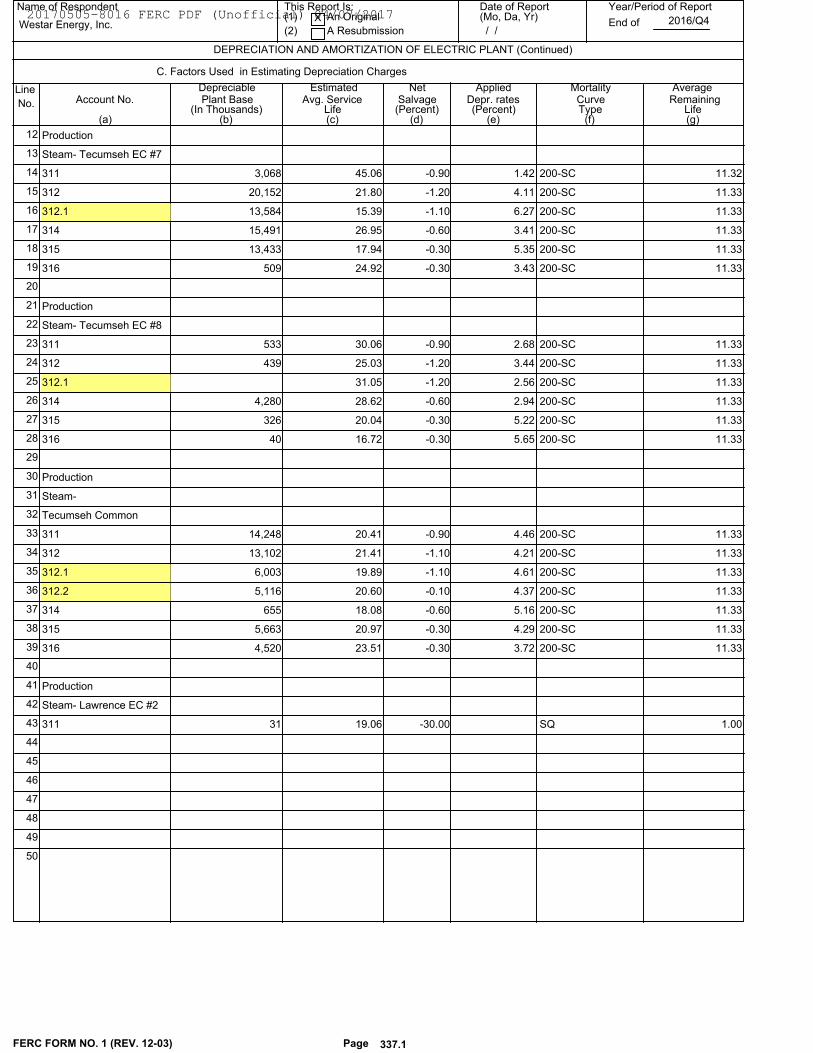
Name of Respondent This Report Is:(1) An Original
(2) A Resubmission
Date of Report(Mo, Da, Yr)
Year/Period of Report
End of
DEPRECIATION AND AMORTIZATION OF ELECTRIC PLANT (Continued)
Westar Energy, Inc.X
/ /2016/Q4
Line
No. Account No.
(c)(b)(a) (d) (e)
C. Factors Used in Estimating Depreciation Charges
DepreciablePlant Base
(In Thousands)
EstimatedAvg. Service
Life
NetSalvage
(Percent)
AppliedDepr. rates
MortalityCurveType
AverageRemaining
Life(f) (g)
(Percent)
Production 12
Steam- Tecumseh EC #7 13
45.06 -0.90 1.42 11.32200-SC311 3,068 14
21.80 -1.20 4.11 11.33200-SC312 20,152 15
15.39 -1.10 6.27 11.33200-SC312.1 13,584 16
26.95 -0.60 3.41 11.33200-SC314 15,491 17
17.94 -0.30 5.35 11.33200-SC315 13,433 18
24.92 -0.30 3.43 11.33200-SC316 509 19
20
Production 21
Steam- Tecumseh EC #8 22
30.06 -0.90 2.68 11.33200-SC311 533 23
25.03 -1.20 3.44 11.33200-SC312 439 24
31.05 -1.20 2.56 11.33200-SC312.1 25
28.62 -0.60 2.94 11.33200-SC314 4,280 26
20.04 -0.30 5.22 11.33200-SC315 326 27
16.72 -0.30 5.65 11.33200-SC316 40 28
29
Production 30
Steam- 31
Tecumseh Common 32
20.41 -0.90 4.46 11.33200-SC311 14,248 33
21.41 -1.10 4.21 11.33200-SC312 13,102 34
19.89 -1.10 4.61 11.33200-SC312.1 6,003 35
20.60 -0.10 4.37 11.33200-SC312.2 5,116 36
18.08 -0.60 5.16 11.33200-SC314 655 37
20.97 -0.30 4.29 11.33200-SC315 5,663 38
23.51 -0.30 3.72 11.33200-SC316 4,520 39
40
Production 41
Steam- Lawrence EC #2 42
19.06 -30.00 1.00SQ311 31 43
44
45
46
47
48
49
50
FERC FORM NO. 1 (REV. 12-03) Page 337.1
20170505-8016 FERC PDF (Unofficial) 04/07/2017
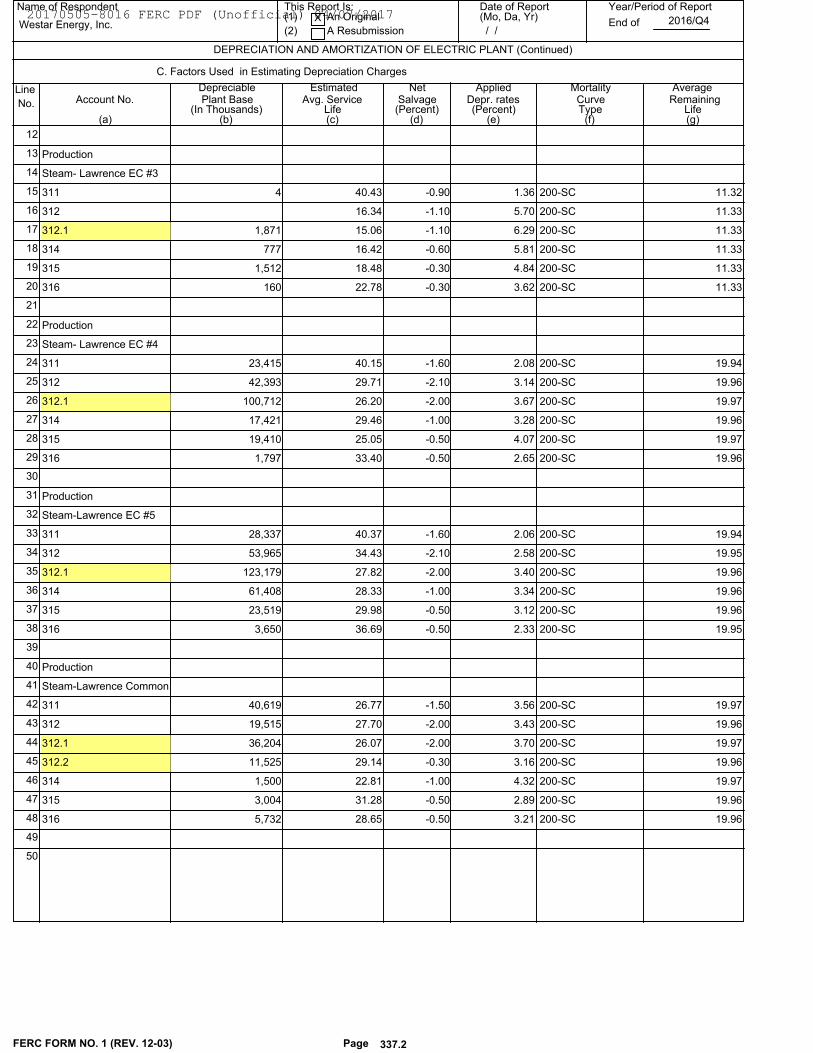
Name of Respondent This Report Is:(1) An Original
(2) A Resubmission
Date of Report(Mo, Da, Yr)
Year/Period of Report
End of
DEPRECIATION AND AMORTIZATION OF ELECTRIC PLANT (Continued)
Westar Energy, Inc.X
/ /2016/Q4
Line
No. Account No.
(c)(b)(a) (d) (e)
C. Factors Used in Estimating Depreciation Charges
DepreciablePlant Base
(In Thousands)
EstimatedAvg. Service
Life
NetSalvage
(Percent)
AppliedDepr. rates
MortalityCurveType
AverageRemaining
Life(f) (g)
(Percent)
12
Production 13
Steam- Lawrence EC #3 14
40.43 -0.90 1.36 11.32200-SC311 4 15
16.34 -1.10 5.70 11.33200-SC312 16
15.06 -1.10 6.29 11.33200-SC312.1 1,871 17
16.42 -0.60 5.81 11.33200-SC314 777 18
18.48 -0.30 4.84 11.33200-SC315 1,512 19
22.78 -0.30 3.62 11.33200-SC316 160 20
21
Production 22
Steam- Lawrence EC #4 23
40.15 -1.60 2.08 19.94200-SC311 23,415 24
29.71 -2.10 3.14 19.96200-SC312 42,393 25
26.20 -2.00 3.67 19.97200-SC312.1 100,712 26
29.46 -1.00 3.28 19.96200-SC314 17,421 27
25.05 -0.50 4.07 19.97200-SC315 19,410 28
33.40 -0.50 2.65 19.96200-SC316 1,797 29
30
Production 31
Steam-Lawrence EC #5 32
40.37 -1.60 2.06 19.94200-SC311 28,337 33
34.43 -2.10 2.58 19.95200-SC312 53,965 34
27.82 -2.00 3.40 19.96200-SC312.1 123,179 35
28.33 -1.00 3.34 19.96200-SC314 61,408 36
29.98 -0.50 3.12 19.96200-SC315 23,519 37
36.69 -0.50 2.33 19.95200-SC316 3,650 38
39
Production 40
Steam-Lawrence Common 41
26.77 -1.50 3.56 19.97200-SC311 40,619 42
27.70 -2.00 3.43 19.96200-SC312 19,515 43
26.07 -2.00 3.70 19.97200-SC312.1 36,204 44
29.14 -0.30 3.16 19.96200-SC312.2 11,525 45
22.81 -1.00 4.32 19.97200-SC314 1,500 46
31.28 -0.50 2.89 19.96200-SC315 3,004 47
28.65 -0.50 3.21 19.96200-SC316 5,732 48
49
50
FERC FORM NO. 1 (REV. 12-03) Page 337.2
20170505-8016 FERC PDF (Unofficial) 04/07/2017
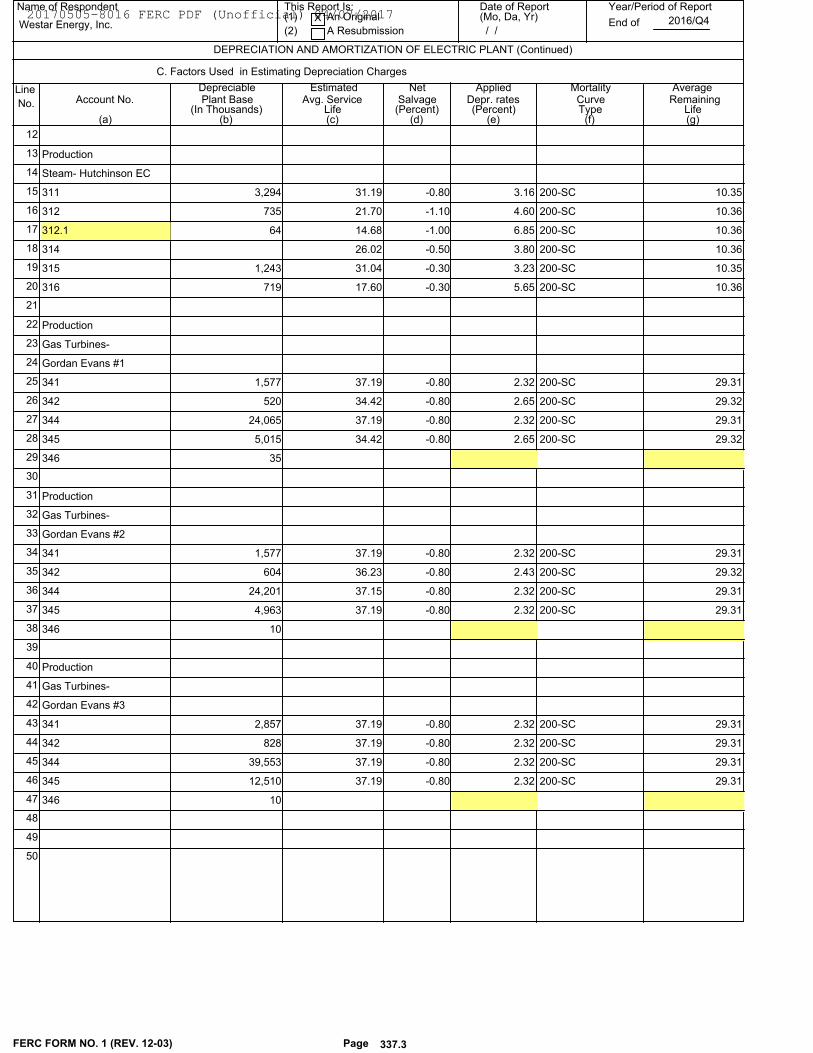
Name of Respondent This Report Is:(1) An Original
(2) A Resubmission
Date of Report(Mo, Da, Yr)
Year/Period of Report
End of
DEPRECIATION AND AMORTIZATION OF ELECTRIC PLANT (Continued)
Westar Energy, Inc.X
/ /2016/Q4
Line
No. Account No.
(c)(b)(a) (d) (e)
C. Factors Used in Estimating Depreciation Charges
DepreciablePlant Base
(In Thousands)
EstimatedAvg. Service
Life
NetSalvage
(Percent)
AppliedDepr. rates
MortalityCurveType
AverageRemaining
Life(f) (g)
(Percent)
12
Production 13
Steam- Hutchinson EC 14
31.19 -0.80 3.16 10.35200-SC311 3,294 15
21.70 -1.10 4.60 10.36200-SC312 735 16
14.68 -1.00 6.85 10.36200-SC312.1 64 17
26.02 -0.50 3.80 10.36200-SC314 18
31.04 -0.30 3.23 10.35200-SC315 1,243 19
17.60 -0.30 5.65 10.36200-SC316 719 20
21
Production 22
Gas Turbines- 23
Gordan Evans #1 24
37.19 -0.80 2.32 29.31200-SC341 1,577 25
34.42 -0.80 2.65 29.32200-SC342 520 26
37.19 -0.80 2.32 29.31200-SC344 24,065 27
34.42 -0.80 2.65 29.32200-SC345 5,015 28
346 35 29
30
Production 31
Gas Turbines- 32
Gordan Evans #2 33
37.19 -0.80 2.32 29.31200-SC341 1,577 34
36.23 -0.80 2.43 29.32200-SC342 604 35
37.15 -0.80 2.32 29.31200-SC344 24,201 36
37.19 -0.80 2.32 29.31200-SC345 4,963 37
346 10 38
39
Production 40
Gas Turbines- 41
Gordan Evans #3 42
37.19 -0.80 2.32 29.31200-SC341 2,857 43
37.19 -0.80 2.32 29.31200-SC342 828 44
37.19 -0.80 2.32 29.31200-SC344 39,553 45
37.19 -0.80 2.32 29.31200-SC345 12,510 46
346 10 47
48
49
50
FERC FORM NO. 1 (REV. 12-03) Page 337.3
20170505-8016 FERC PDF (Unofficial) 04/07/2017
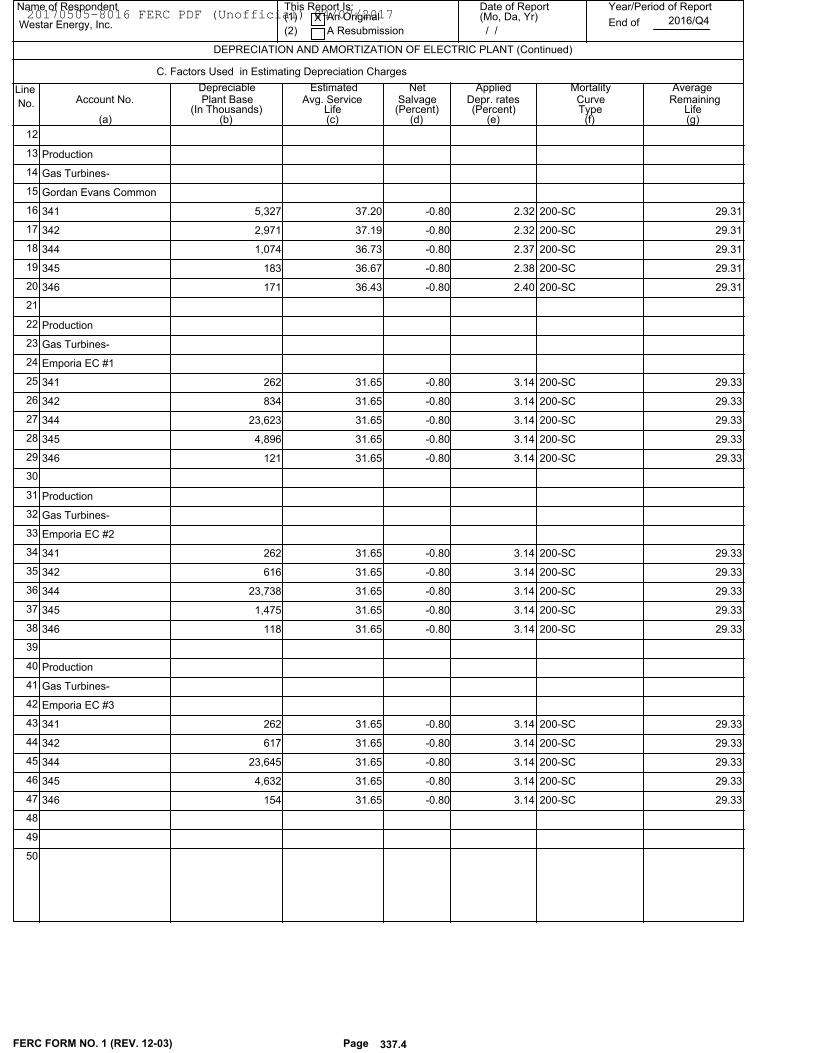
Name of Respondent This Report Is:(1) An Original
(2) A Resubmission
Date of Report(Mo, Da, Yr)
Year/Period of Report
End of
DEPRECIATION AND AMORTIZATION OF ELECTRIC PLANT (Continued)
Westar Energy, Inc.X
/ /2016/Q4
Line
No. Account No.
(c)(b)(a) (d) (e)
C. Factors Used in Estimating Depreciation Charges
DepreciablePlant Base
(In Thousands)
EstimatedAvg. Service
Life
NetSalvage
(Percent)
AppliedDepr. rates
MortalityCurveType
AverageRemaining
Life(f) (g)
(Percent)
12
Production 13
Gas Turbines- 14
Gordan Evans Common 15
37.20 -0.80 2.32 29.31200-SC341 5,327 16
37.19 -0.80 2.32 29.31200-SC342 2,971 17
36.73 -0.80 2.37 29.31200-SC344 1,074 18
36.67 -0.80 2.38 29.31200-SC345 183 19
36.43 -0.80 2.40 29.31200-SC346 171 20
21
Production 22
Gas Turbines- 23
Emporia EC #1 24
31.65 -0.80 3.14 29.33200-SC341 262 25
31.65 -0.80 3.14 29.33200-SC342 834 26
31.65 -0.80 3.14 29.33200-SC344 23,623 27
31.65 -0.80 3.14 29.33200-SC345 4,896 28
31.65 -0.80 3.14 29.33200-SC346 121 29
30
Production 31
Gas Turbines- 32
Emporia EC #2 33
31.65 -0.80 3.14 29.33200-SC341 262 34
31.65 -0.80 3.14 29.33200-SC342 616 35
31.65 -0.80 3.14 29.33200-SC344 23,738 36
31.65 -0.80 3.14 29.33200-SC345 1,475 37
31.65 -0.80 3.14 29.33200-SC346 118 38
39
Production 40
Gas Turbines- 41
Emporia EC #3 42
31.65 -0.80 3.14 29.33200-SC341 262 43
31.65 -0.80 3.14 29.33200-SC342 617 44
31.65 -0.80 3.14 29.33200-SC344 23,645 45
31.65 -0.80 3.14 29.33200-SC345 4,632 46
31.65 -0.80 3.14 29.33200-SC346 154 47
48
49
50
FERC FORM NO. 1 (REV. 12-03) Page 337.4
20170505-8016 FERC PDF (Unofficial) 04/07/2017
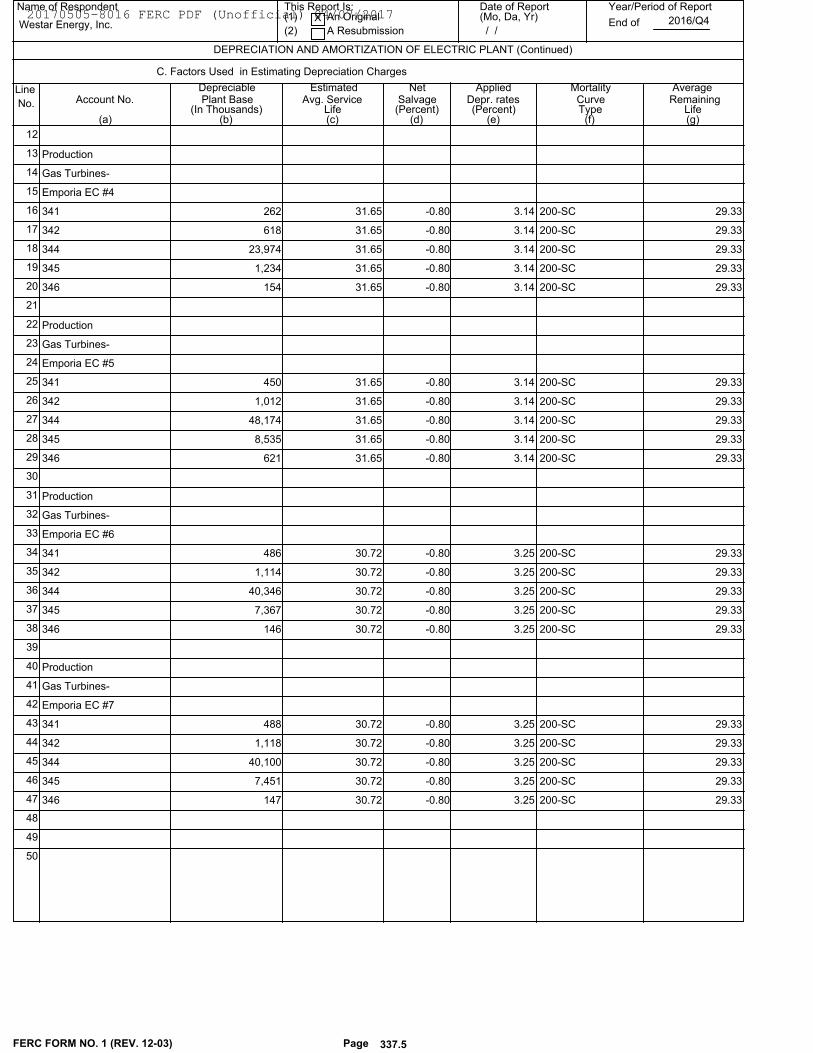
Name of Respondent This Report Is:(1) An Original
(2) A Resubmission
Date of Report(Mo, Da, Yr)
Year/Period of Report
End of
DEPRECIATION AND AMORTIZATION OF ELECTRIC PLANT (Continued)
Westar Energy, Inc.X
/ /2016/Q4
Line
No. Account No.
(c)(b)(a) (d) (e)
C. Factors Used in Estimating Depreciation Charges
DepreciablePlant Base
(In Thousands)
EstimatedAvg. Service
Life
NetSalvage
(Percent)
AppliedDepr. rates
MortalityCurveType
AverageRemaining
Life(f) (g)
(Percent)
12
Production 13
Gas Turbines- 14
Emporia EC #4 15
31.65 -0.80 3.14 29.33200-SC341 262 16
31.65 -0.80 3.14 29.33200-SC342 618 17
31.65 -0.80 3.14 29.33200-SC344 23,974 18
31.65 -0.80 3.14 29.33200-SC345 1,234 19
31.65 -0.80 3.14 29.33200-SC346 154 20
21
Production 22
Gas Turbines- 23
Emporia EC #5 24
31.65 -0.80 3.14 29.33200-SC341 450 25
31.65 -0.80 3.14 29.33200-SC342 1,012 26
31.65 -0.80 3.14 29.33200-SC344 48,174 27
31.65 -0.80 3.14 29.33200-SC345 8,535 28
31.65 -0.80 3.14 29.33200-SC346 621 29
30
Production 31
Gas Turbines- 32
Emporia EC #6 33
30.72 -0.80 3.25 29.33200-SC341 486 34
30.72 -0.80 3.25 29.33200-SC342 1,114 35
30.72 -0.80 3.25 29.33200-SC344 40,346 36
30.72 -0.80 3.25 29.33200-SC345 7,367 37
30.72 -0.80 3.25 29.33200-SC346 146 38
39
Production 40
Gas Turbines- 41
Emporia EC #7 42
30.72 -0.80 3.25 29.33200-SC341 488 43
30.72 -0.80 3.25 29.33200-SC342 1,118 44
30.72 -0.80 3.25 29.33200-SC344 40,100 45
30.72 -0.80 3.25 29.33200-SC345 7,451 46
30.72 -0.80 3.25 29.33200-SC346 147 47
48
49
50
FERC FORM NO. 1 (REV. 12-03) Page 337.5
20170505-8016 FERC PDF (Unofficial) 04/07/2017

Name of Respondent This Report Is:(1) An Original
(2) A Resubmission
Date of Report(Mo, Da, Yr)
Year/Period of Report
End of
DEPRECIATION AND AMORTIZATION OF ELECTRIC PLANT (Continued)
Westar Energy, Inc.X
/ /2016/Q4
Line
No. Account No.
(c)(b)(a) (d) (e)
C. Factors Used in Estimating Depreciation Charges
DepreciablePlant Base
(In Thousands)
EstimatedAvg. Service
Life
NetSalvage
(Percent)
AppliedDepr. rates
MortalityCurveType
AverageRemaining
Life(f) (g)
(Percent)
12
Production 13
Gas Turbines- 14
Emporia Common 15
31.65 -0.80 3.14 29.33200-SC341 16,760 16
31.65 -0.80 3.14 29.33200-SC342 226 17
31.65 -0.80 3.14 29.33200-SC344 7,250 18
31.65 -0.80 3.14 29.33200-SC345 6,880 19
29.80 -0.80 3.37 29.34200-SC346 7,218 20
21
Production 22
Gas Turbines- 23
Hutchinson EC #1 24
33.08 -0.30 0.90 10.35200-SC341 14 25
42.76 -0.30 -0.01 10.35200-SC342 168 26
31.63 -0.30 1.08 10.35200-SC344 7,299 27
41.14 -0.30 0.11 10.35200-SC345 406 28
45.65 -0.30 -0.21 10.35200-SC346 59 29
30
Production 31
Gas Turbines- 32
Hutchinson EC #2 33
31.63 -0.30 1.08 10.35200-SC341 22 34
42.76 -0.30 -0.01 10.35200-SC342 160 35
29.47 -0.30 1.39 10.36200-SC344 6,687 36
41.39 -0.30 0.09 10.35200-SC345 384 37
45.65 -0.30 -0.21 10.35200-SC346 26 38
39
Production 40
Gas Turbines- 41
Hutchinson EC #3 42
31.63 -0.30 1.08 10.35200-SC341 22 43
23.92 -0.30 2.43 10.36200-SC342 388 44
31.49 -0.30 1.10 10.35200-SC344 7,902 45
15.16 -0.30 5.62 10.36200-SC345 622 46
45.65 -0.30 -0.21 10.35200-SC346 26 47
48
49
50
FERC FORM NO. 1 (REV. 12-03) Page 337.6
20170505-8016 FERC PDF (Unofficial) 04/07/2017
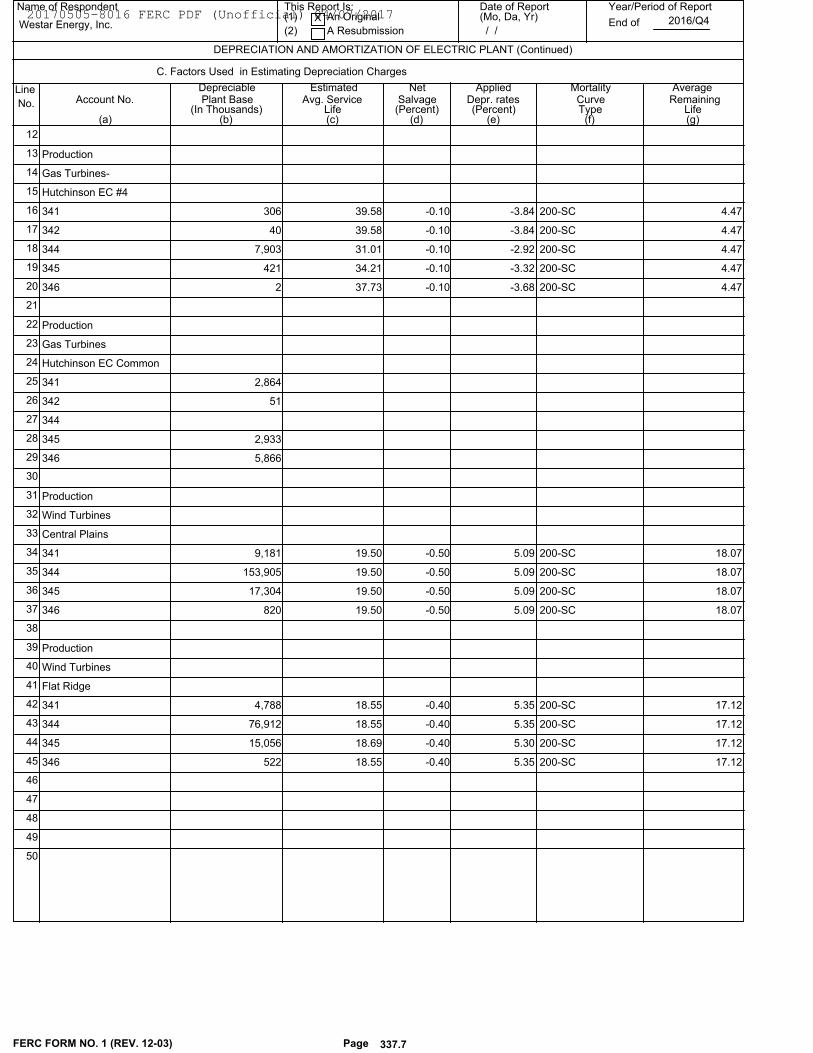
Name of Respondent This Report Is:(1) An Original
(2) A Resubmission
Date of Report(Mo, Da, Yr)
Year/Period of Report
End of
DEPRECIATION AND AMORTIZATION OF ELECTRIC PLANT (Continued)
Westar Energy, Inc.X
/ /2016/Q4
Line
No. Account No.
(c)(b)(a) (d) (e)
C. Factors Used in Estimating Depreciation Charges
DepreciablePlant Base
(In Thousands)
EstimatedAvg. Service
Life
NetSalvage
(Percent)
AppliedDepr. rates
MortalityCurveType
AverageRemaining
Life(f) (g)
(Percent)
12
Production 13
Gas Turbines- 14
Hutchinson EC #4 15
39.58 -0.10 -3.84 4.47200-SC341 306 16
39.58 -0.10 -3.84 4.47200-SC342 40 17
31.01 -0.10 -2.92 4.47200-SC344 7,903 18
34.21 -0.10 -3.32 4.47200-SC345 421 19
37.73 -0.10 -3.68 4.47200-SC346 2 20
21
Production 22
Gas Turbines 23
Hutchinson EC Common 24
341 2,864 25
342 51 26
344 27
345 2,933 28
346 5,866 29
30
Production 31
Wind Turbines 32
Central Plains 33
19.50 -0.50 5.09 18.07200-SC341 9,181 34
19.50 -0.50 5.09 18.07200-SC344 153,905 35
19.50 -0.50 5.09 18.07200-SC345 17,304 36
19.50 -0.50 5.09 18.07200-SC346 820 37
38
Production 39
Wind Turbines 40
Flat Ridge 41
18.55 -0.40 5.35 17.12200-SC341 4,788 42
18.55 -0.40 5.35 17.12200-SC344 76,912 43
18.69 -0.40 5.30 17.12200-SC345 15,056 44
18.55 -0.40 5.35 17.12200-SC346 522 45
46
47
48
49
50
FERC FORM NO. 1 (REV. 12-03) Page 337.7
20170505-8016 FERC PDF (Unofficial) 04/07/2017
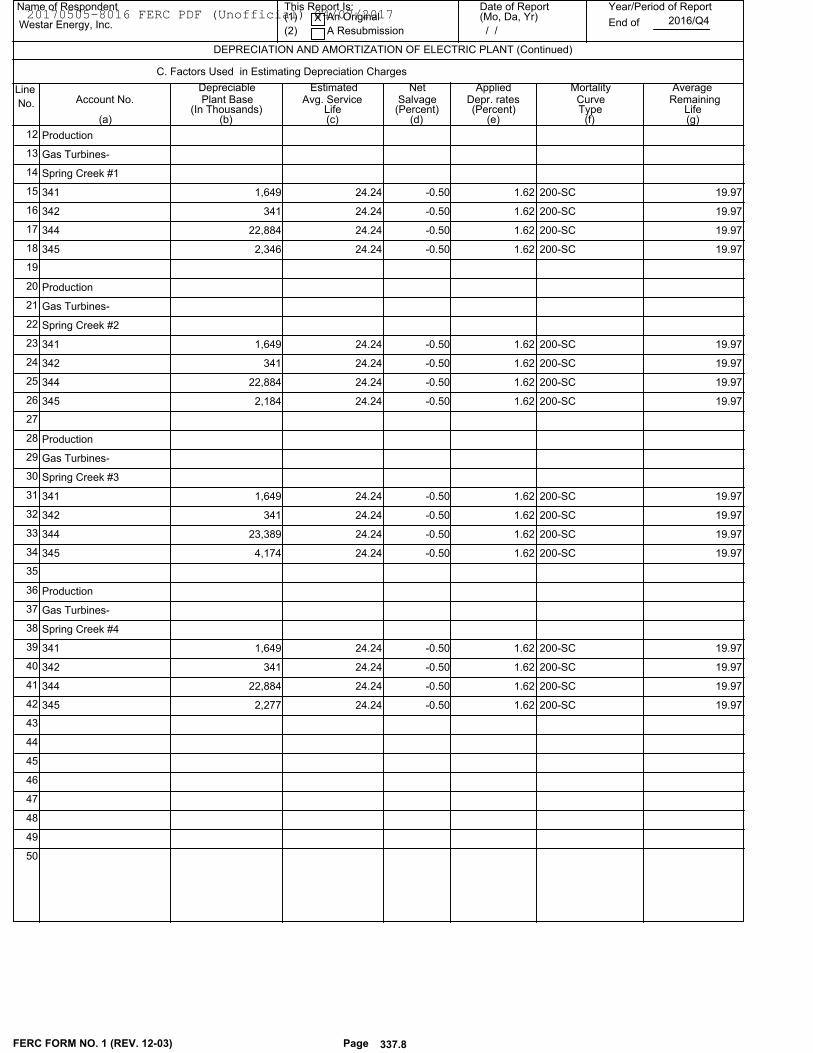
Name of Respondent This Report Is:(1) An Original
(2) A Resubmission
Date of Report(Mo, Da, Yr)
Year/Period of Report
End of
DEPRECIATION AND AMORTIZATION OF ELECTRIC PLANT (Continued)
Westar Energy, Inc.X
/ /2016/Q4
Line
No. Account No.
(c)(b)(a) (d) (e)
C. Factors Used in Estimating Depreciation Charges
DepreciablePlant Base
(In Thousands)
EstimatedAvg. Service
Life
NetSalvage
(Percent)
AppliedDepr. rates
MortalityCurveType
AverageRemaining
Life(f) (g)
(Percent)
Production 12
Gas Turbines- 13
Spring Creek #1 14
24.24 -0.50 1.62 19.97200-SC341 1,649 15
24.24 -0.50 1.62 19.97200-SC342 341 16
24.24 -0.50 1.62 19.97200-SC344 22,884 17
24.24 -0.50 1.62 19.97200-SC345 2,346 18
19
Production 20
Gas Turbines- 21
Spring Creek #2 22
24.24 -0.50 1.62 19.97200-SC341 1,649 23
24.24 -0.50 1.62 19.97200-SC342 341 24
24.24 -0.50 1.62 19.97200-SC344 22,884 25
24.24 -0.50 1.62 19.97200-SC345 2,184 26
27
Production 28
Gas Turbines- 29
Spring Creek #3 30
24.24 -0.50 1.62 19.97200-SC341 1,649 31
24.24 -0.50 1.62 19.97200-SC342 341 32
24.24 -0.50 1.62 19.97200-SC344 23,389 33
24.24 -0.50 1.62 19.97200-SC345 4,174 34
35
Production 36
Gas Turbines- 37
Spring Creek #4 38
24.24 -0.50 1.62 19.97200-SC341 1,649 39
24.24 -0.50 1.62 19.97200-SC342 341 40
24.24 -0.50 1.62 19.97200-SC344 22,884 41
24.24 -0.50 1.62 19.97200-SC345 2,277 42
43
44
45
46
47
48
49
50
FERC FORM NO. 1 (REV. 12-03) Page 337.8
20170505-8016 FERC PDF (Unofficial) 04/07/2017
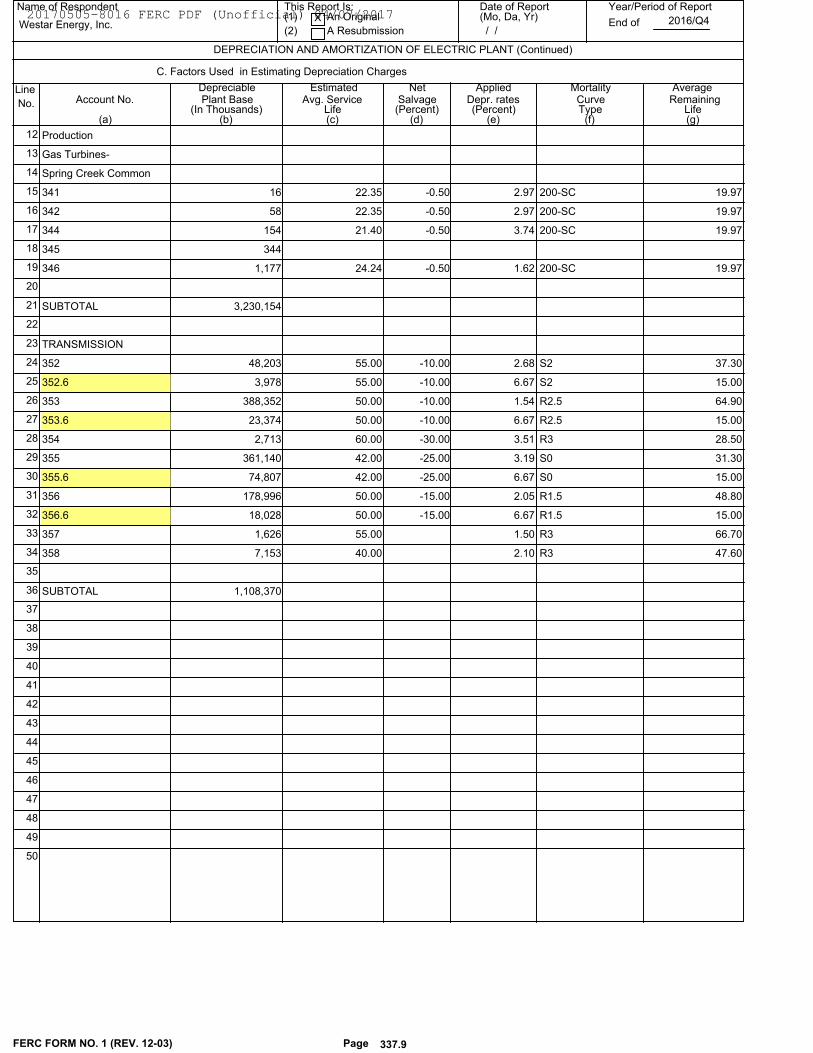
Name of Respondent This Report Is:(1) An Original
(2) A Resubmission
Date of Report(Mo, Da, Yr)
Year/Period of Report
End of
DEPRECIATION AND AMORTIZATION OF ELECTRIC PLANT (Continued)
Westar Energy, Inc.X
/ /2016/Q4
Line
No. Account No.
(c)(b)(a) (d) (e)
C. Factors Used in Estimating Depreciation Charges
DepreciablePlant Base
(In Thousands)
EstimatedAvg. Service
Life
NetSalvage
(Percent)
AppliedDepr. rates
MortalityCurveType
AverageRemaining
Life(f) (g)
(Percent)
Production 12
Gas Turbines- 13
Spring Creek Common 14
22.35 -0.50 2.97 19.97200-SC341 16 15
22.35 -0.50 2.97 19.97200-SC342 58 16
21.40 -0.50 3.74 19.97200-SC344 154 17
345 344 18
24.24 -0.50 1.62 19.97200-SC346 1,177 19
20
SUBTOTAL 3,230,154 21
22
TRANSMISSION 23
55.00 -10.00 2.68 37.30S2352 48,203 24
55.00 -10.00 6.67 15.00S2352.6 3,978 25
50.00 -10.00 1.54 64.90R2.5353 388,352 26
50.00 -10.00 6.67 15.00R2.5353.6 23,374 27
60.00 -30.00 3.51 28.50R3354 2,713 28
42.00 -25.00 3.19 31.30S0355 361,140 29
42.00 -25.00 6.67 15.00S0355.6 74,807 30
50.00 -15.00 2.05 48.80R1.5356 178,996 31
50.00 -15.00 6.67 15.00R1.5356.6 18,028 32
55.00 1.50 66.70R3357 1,626 33
40.00 2.10 47.60R3358 7,153 34
35
SUBTOTAL 1,108,370 36
37
38
39
40
41
42
43
44
45
46
47
48
49
50
FERC FORM NO. 1 (REV. 12-03) Page 337.9
20170505-8016 FERC PDF (Unofficial) 04/07/2017
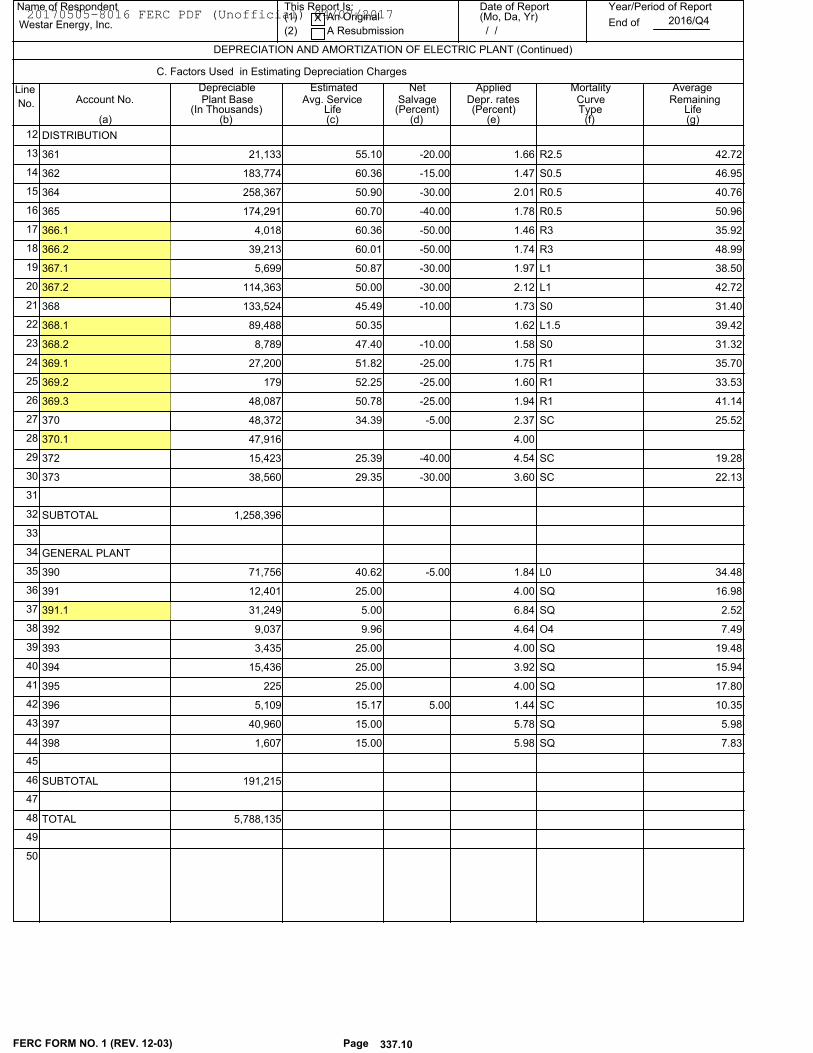
Name of Respondent This Report Is:(1) An Original
(2) A Resubmission
Date of Report(Mo, Da, Yr)
Year/Period of Report
End of
DEPRECIATION AND AMORTIZATION OF ELECTRIC PLANT (Continued)
Westar Energy, Inc.X
/ /2016/Q4
Line
No. Account No.
(c)(b)(a) (d) (e)
C. Factors Used in Estimating Depreciation Charges
DepreciablePlant Base
(In Thousands)
EstimatedAvg. Service
Life
NetSalvage
(Percent)
AppliedDepr. rates
MortalityCurveType
AverageRemaining
Life(f) (g)
(Percent)
DISTRIBUTION 12
55.10 -20.00 1.66 42.72R2.5361 21,133 13
60.36 -15.00 1.47 46.95S0.5362 183,774 14
50.90 -30.00 2.01 40.76R0.5364 258,367 15
60.70 -40.00 1.78 50.96R0.5365 174,291 16
60.36 -50.00 1.46 35.92R3366.1 4,018 17
60.01 -50.00 1.74 48.99R3366.2 39,213 18
50.87 -30.00 1.97 38.50L1367.1 5,699 19
50.00 -30.00 2.12 42.72L1367.2 114,363 20
45.49 -10.00 1.73 31.40S0368 133,524 21
50.35 1.62 39.42L1.5368.1 89,488 22
47.40 -10.00 1.58 31.32S0368.2 8,789 23
51.82 -25.00 1.75 35.70R1369.1 27,200 24
52.25 -25.00 1.60 33.53R1369.2 179 25
50.78 -25.00 1.94 41.14R1369.3 48,087 26
34.39 -5.00 2.37 25.52SC370 48,372 27
4.00370.1 47,916 28
25.39 -40.00 4.54 19.28SC372 15,423 29
29.35 -30.00 3.60 22.13SC373 38,560 30
31
SUBTOTAL 1,258,396 32
33
GENERAL PLANT 34
40.62 -5.00 1.84 34.48L0390 71,756 35
25.00 4.00 16.98SQ391 12,401 36
5.00 6.84 2.52SQ391.1 31,249 37
9.96 4.64 7.49O4392 9,037 38
25.00 4.00 19.48SQ393 3,435 39
25.00 3.92 15.94SQ394 15,436 40
25.00 4.00 17.80SQ395 225 41
15.17 5.00 1.44 10.35SC396 5,109 42
15.00 5.78 5.98SQ397 40,960 43
15.00 5.98 7.83SQ398 1,607 44
45
SUBTOTAL 191,215 46
47
TOTAL 5,788,135 48
49
50
FERC FORM NO. 1 (REV. 12-03) Page 337.10
20170505-8016 FERC PDF (Unofficial) 04/07/2017
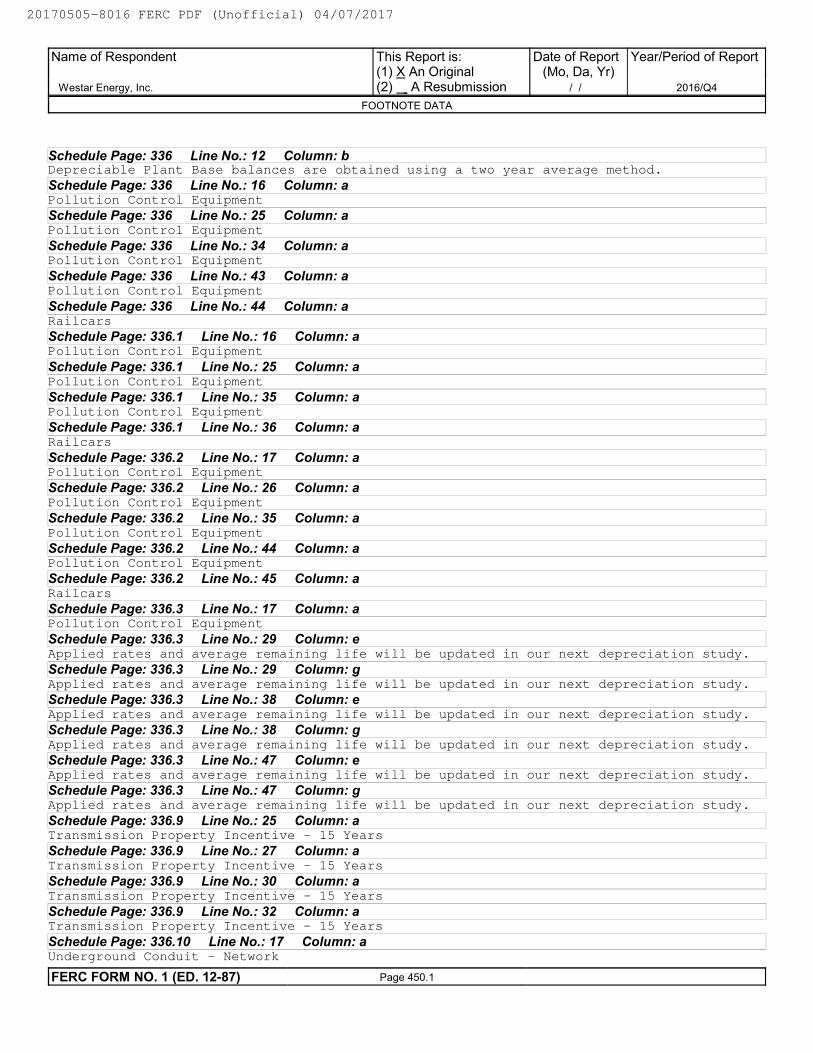
Schedule Page: 336 Line No.: 12 Column: bDepreciable Plant Base balances are obtained using a two year average method.
Schedule Page: 336 Line No.: 16 Column: aPollution Control Equipment
Schedule Page: 336 Line No.: 25 Column: aPollution Control Equipment
Schedule Page: 336 Line No.: 34 Column: aPollution Control Equipment
Schedule Page: 336 Line No.: 43 Column: aPollution Control Equipment
Schedule Page: 336 Line No.: 44 Column: aRailcars
Schedule Page: 336.1 Line No.: 16 Column: aPollution Control Equipment
Schedule Page: 336.1 Line No.: 25 Column: aPollution Control Equipment
Schedule Page: 336.1 Line No.: 35 Column: aPollution Control Equipment
Schedule Page: 336.1 Line No.: 36 Column: aRailcars
Schedule Page: 336.2 Line No.: 17 Column: aPollution Control Equipment
Schedule Page: 336.2 Line No.: 26 Column: aPollution Control Equipment
Schedule Page: 336.2 Line No.: 35 Column: aPollution Control Equipment
Schedule Page: 336.2 Line No.: 44 Column: aPollution Control Equipment
Schedule Page: 336.2 Line No.: 45 Column: aRailcars
Schedule Page: 336.3 Line No.: 17 Column: aPollution Control Equipment
Schedule Page: 336.3 Line No.: 29 Column: eApplied rates and average remaining life will be updated in our next depreciation study.
Schedule Page: 336.3 Line No.: 29 Column: gApplied rates and average remaining life will be updated in our next depreciation study.
Schedule Page: 336.3 Line No.: 38 Column: eApplied rates and average remaining life will be updated in our next depreciation study.
Schedule Page: 336.3 Line No.: 38 Column: gApplied rates and average remaining life will be updated in our next depreciation study.
Schedule Page: 336.3 Line No.: 47 Column: eApplied rates and average remaining life will be updated in our next depreciation study.
Schedule Page: 336.3 Line No.: 47 Column: gApplied rates and average remaining life will be updated in our next depreciation study.
Schedule Page: 336.9 Line No.: 25 Column: aTransmission Property Incentive - 15 Years
Schedule Page: 336.9 Line No.: 27 Column: aTransmission Property Incentive - 15 Years
Schedule Page: 336.9 Line No.: 30 Column: aTransmission Property Incentive - 15 Years
Schedule Page: 336.9 Line No.: 32 Column: aTransmission Property Incentive - 15 Years
Schedule Page: 336.10 Line No.: 17 Column: aUnderground Conduit - Network
Name of Respondent
Westar Energy, Inc.
This Report is:(1) X An Original(2) A Resubmission
Date of Report(Mo, Da, Yr)
/ /
Year/Period of Report
2016/Q4
FOOTNOTE DATA
FERC FORM NO. 1 (ED. 12-87) Page 450.1
20170505-8016 FERC PDF (Unofficial) 04/07/2017
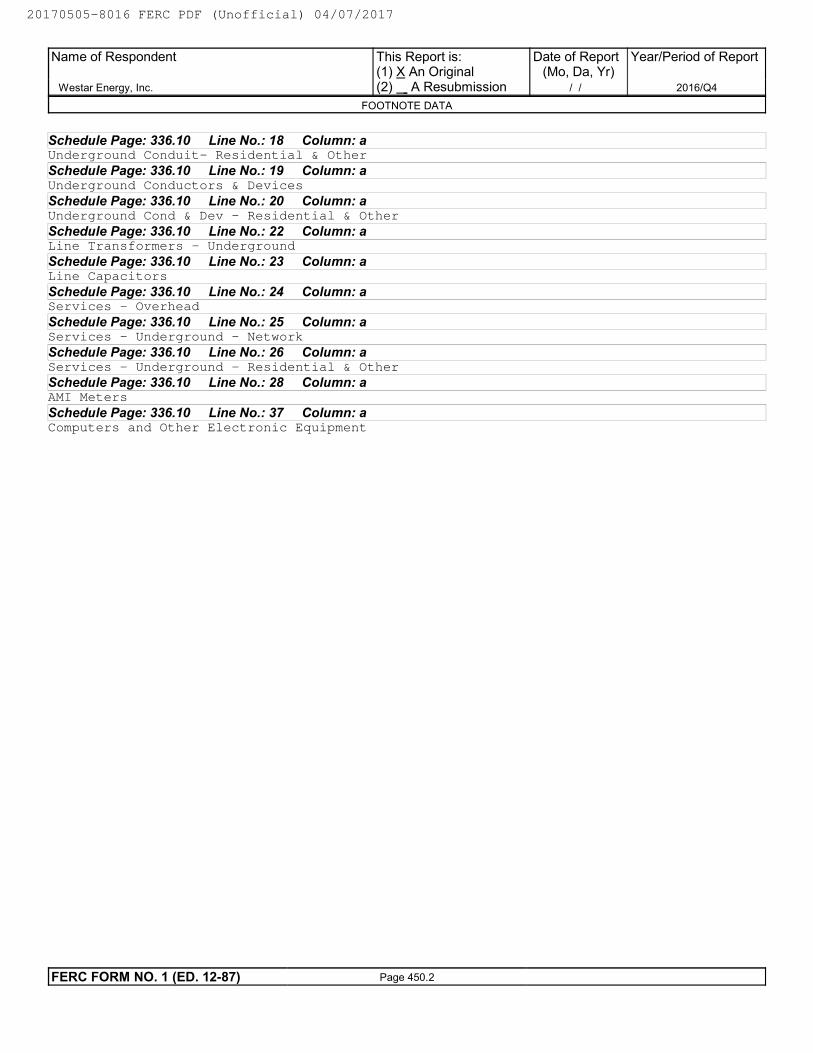
Schedule Page: 336.10 Line No.: 18 Column: aUnderground Conduit- Residential & Other
Schedule Page: 336.10 Line No.: 19 Column: aUnderground Conductors & Devices
Schedule Page: 336.10 Line No.: 20 Column: aUnderground Cond & Dev - Residential & Other
Schedule Page: 336.10 Line No.: 22 Column: aLine Transformers - Underground
Schedule Page: 336.10 Line No.: 23 Column: aLine Capacitors
Schedule Page: 336.10 Line No.: 24 Column: aServices - Overhead
Schedule Page: 336.10 Line No.: 25 Column: aServices - Underground - Network
Schedule Page: 336.10 Line No.: 26 Column: aServices - Underground - Residential & Other
Schedule Page: 336.10 Line No.: 28 Column: aAMI Meters
Schedule Page: 336.10 Line No.: 37 Column: aComputers and Other Electronic Equipment
Name of Respondent
Westar Energy, Inc.
This Report is:(1) X An Original(2) A Resubmission
Date of Report(Mo, Da, Yr)
/ /
Year/Period of Report
2016/Q4
FOOTNOTE DATA
FERC FORM NO. 1 (ED. 12-87) Page 450.2
20170505-8016 FERC PDF (Unofficial) 04/07/2017
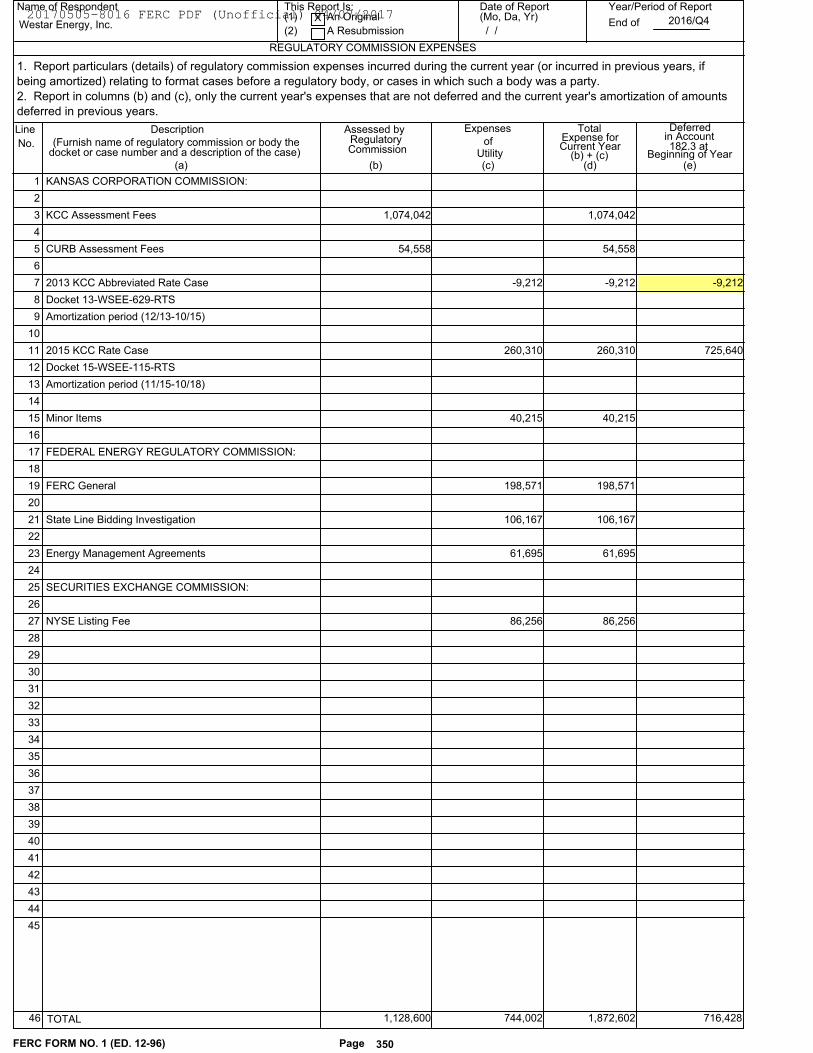
Name of Respondent This Report Is:(1) An Original
(2) A Resubmission
Date of Report(Mo, Da, Yr)
Year/Period of Report
End of
REGULATORY COMMISSION EXPENSES
Westar Energy, Inc.X
/ /2016/Q4
Line
No.
Description Assessed by
(c)(b)(a)
Total Expense for
Expenses
of
(d)
(Furnish name of regulatory commission or body the Regulatory
docket or case number and a description of the case) Commission UtilityCurrent Year
(b) + (c)
Deferredin Account182.3 at
Beginning of Year(e)
1. Report particulars (details) of regulatory commission expenses incurred during the current year (or incurred in previous years, if
being amortized) relating to format cases before a regulatory body, or cases in which such a body was a party.
2. Report in columns (b) and (c), only the current year's expenses that are not deferred and the current year's amortization of amounts
deferred in previous years.
KANSAS CORPORATION COMMISSION: 1
2
KCC Assessment Fees 1,074,042 1,074,042 3
4
CURB Assessment Fees 54,558 54,558 5
6
-9,2122013 KCC Abbreviated Rate Case -9,212 -9,212 7
Docket 13-WSEE-629-RTS 8
Amortization period (12/13-10/15) 9
10
725,6402015 KCC Rate Case 260,310 260,310 11
Docket 15-WSEE-115-RTS 12
Amortization period (11/15-10/18) 13
14
Minor Items 40,215 40,215 15
16
FEDERAL ENERGY REGULATORY COMMISSION: 17
18
FERC General 198,571 198,571 19
20
State Line Bidding Investigation 106,167 106,167 21
22
Energy Management Agreements 61,695 61,695 23
24
SECURITIES EXCHANGE COMMISSION: 25
26
NYSE Listing Fee 86,256 86,256 27
28
29
30
31
32
33
34
35
36
37
38
39
40
41
42
43
44
45
FERC FORM NO. 1 (ED. 12-96) Page 350
46 TOTAL 1,128,600 744,002 1,872,602 716,428
20170505-8016 FERC PDF (Unofficial) 04/07/2017
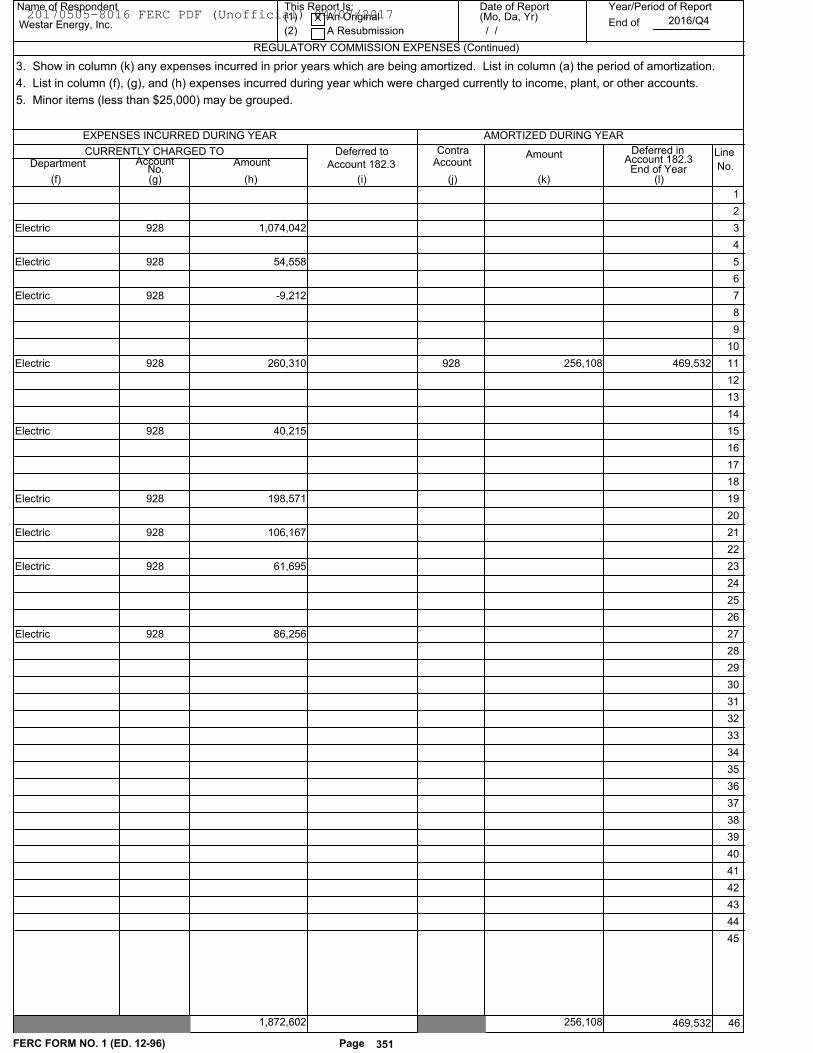
Name of Respondent This Report Is:(1) An Original
(2) A Resubmission
Date of Report(Mo, Da, Yr)
Year/Period of Report
End of
REGULATORY COMMISSION EXPENSES (Continued)
Westar Energy, Inc.X
/ /2016/Q4
Line
No.(j)(i)(f) (k) (l)
EXPENSES INCURRED DURING YEAR AMORTIZED DURING YEAR
CURRENTLY CHARGED TODepartment Account
No.(g)
Amount
(h)
Deferred toAccount 182.3
ContraAccount
Amount Deferred in Account 182.3End of Year
3. Show in column (k) any expenses incurred in prior years which are being amortized. List in column (a) the period of amortization.
4. List in column (f), (g), and (h) expenses incurred during year which were charged currently to income, plant, or other accounts.
5. Minor items (less than $25,000) may be grouped.
1
2
Electric 3 1,074,042928
4
Electric 5 54,558928
6
Electric 7 -9,212928
8
9
10
469,532 256,108928Electric 11 260,310928
12
13
14
Electric 15 40,215928
16
17
18
Electric 19 198,571928
20
Electric 21 106,167928
22
Electric 23 61,695928
24
25
26
Electric 27 86,256928
28
29
30
31
32
33
34
35
36
37
38
39
40
41
42
43
44
45
FERC FORM NO. 1 (ED. 12-96) Page 351
46 1,872,602 256,108 469,532
20170505-8016 FERC PDF (Unofficial) 04/07/2017

Schedule Page: 350 Line No.: 7 Column: eThis credit balance includes an additional two months of amortization that was reversed in
January 2016.
Name of Respondent
Westar Energy, Inc.
This Report is:(1) X An Original(2) A Resubmission
Date of Report(Mo, Da, Yr)
/ /
Year/Period of Report
2016/Q4
FOOTNOTE DATA
FERC FORM NO. 1 (ED. 12-87) Page 450.1
20170505-8016 FERC PDF (Unofficial) 04/07/2017
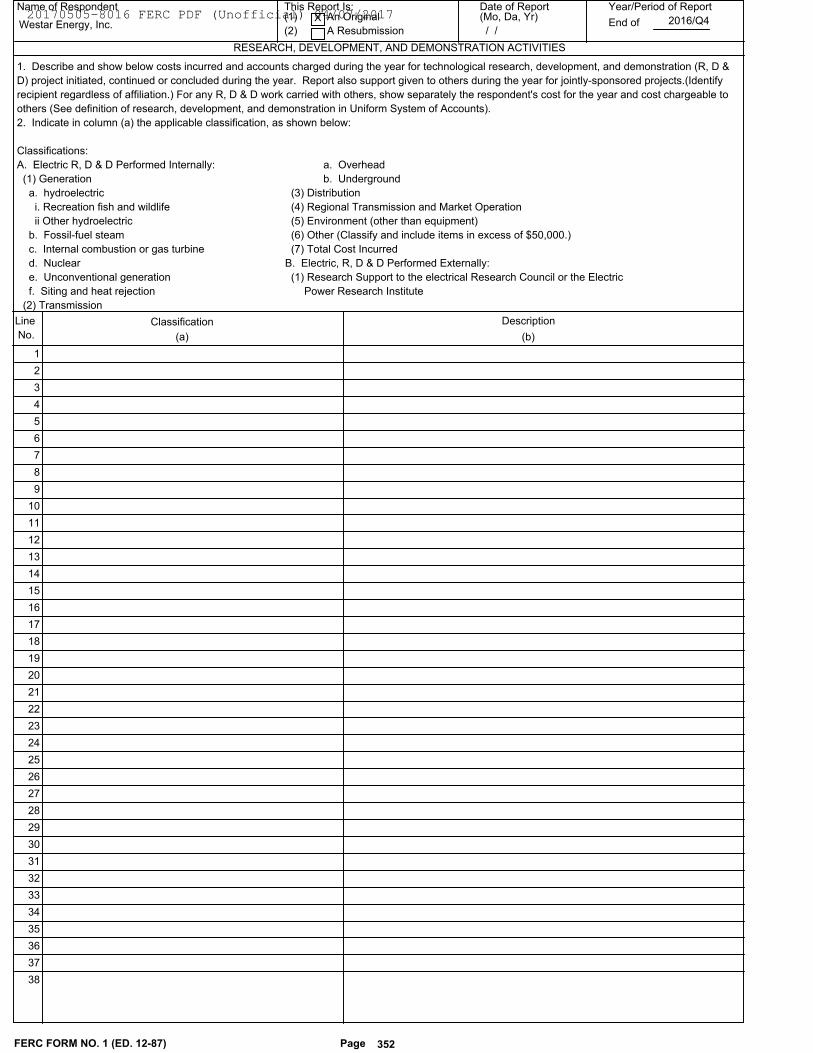
Name of Respondent This Report Is:(1) An Original
(2) A Resubmission
Date of Report(Mo, Da, Yr)
Year/Period of Report
End of
RESEARCH, DEVELOPMENT, AND DEMONSTRATION ACTIVITIES
Westar Energy, Inc.X
/ /2016/Q4
Line
No.
Description
(b)(a)
Classification
1. Describe and show below costs incurred and accounts charged during the year for technological research, development, and demonstration (R, D &
D) project initiated, continued or concluded during the year. Report also support given to others during the year for jointly-sponsored projects.(Identify
recipient regardless of affiliation.) For any R, D & D work carried with others, show separately the respondent's cost for the year and cost chargeable to
others (See definition of research, development, and demonstration in Uniform System of Accounts).
2. Indicate in column (a) the applicable classification, as shown below:
Classifications:
A. Electric R, D & D Performed Internally: a. Overhead
(1) Generation b. Underground
a. hydroelectric (3) Distribution
i. Recreation fish and wildlife (4) Regional Transmission and Market Operation
ii Other hydroelectric (5) Environment (other than equipment)
b. Fossil-fuel steam (6) Other (Classify and include items in excess of $50,000.)
c. Internal combustion or gas turbine (7) Total Cost Incurred
d. Nuclear B. Electric, R, D & D Performed Externally:
e. Unconventional generation (1) Research Support to the electrical Research Council or the Electric
f. Siting and heat rejection Power Research Institute
(2) Transmission
1
2
3
4
5
6
7
8
9
10
11
12
13
14
15
16
17
18
19
20
21
22
23
24
25
26
27
28
29
30
31
32
33
34
35
36
37
38
FERC FORM NO. 1 (ED. 12-87) Page 352
20170505-8016 FERC PDF (Unofficial) 04/07/2017
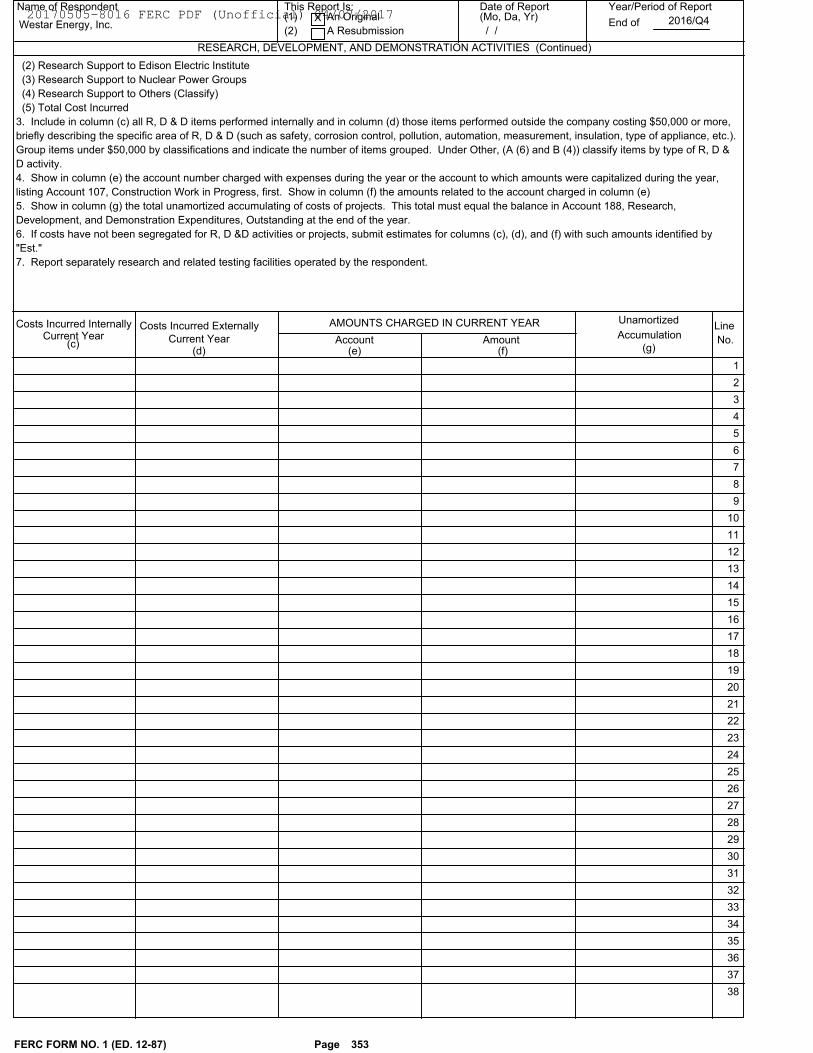
Name of Respondent This Report Is:(1) An Original
(2) A Resubmission
Date of Report(Mo, Da, Yr)
Year/Period of Report
End of
RESEARCH, DEVELOPMENT, AND DEMONSTRATION ACTIVITIES (Continued)
Westar Energy, Inc.X
/ /2016/Q4
Line
No.
AMOUNTS CHARGED IN CURRENT YEAR
(e)(c)
Costs Incurred InternallyCurrent Year
Costs Incurred ExternallyCurrent Year
(d)Account Amount
(f)
Unamortized
Accumulation(g)
(2) Research Support to Edison Electric Institute
(3) Research Support to Nuclear Power Groups
(4) Research Support to Others (Classify)
(5) Total Cost Incurred
3. Include in column (c) all R, D & D items performed internally and in column (d) those items performed outside the company costing $50,000 or more,
briefly describing the specific area of R, D & D (such as safety, corrosion control, pollution, automation, measurement, insulation, type of appliance, etc.).
Group items under $50,000 by classifications and indicate the number of items grouped. Under Other, (A (6) and B (4)) classify items by type of R, D &
D activity.
4. Show in column (e) the account number charged with expenses during the year or the account to which amounts were capitalized during the year,
listing Account 107, Construction Work in Progress, first. Show in column (f) the amounts related to the account charged in column (e)
5. Show in column (g) the total unamortized accumulating of costs of projects. This total must equal the balance in Account 188, Research,
Development, and Demonstration Expenditures, Outstanding at the end of the year.
6. If costs have not been segregated for R, D &D activities or projects, submit estimates for columns (c), (d), and (f) with such amounts identified by
"Est."
7. Report separately research and related testing facilities operated by the respondent.
1
2
3
4
5
6
7
8
9
10
11
12
13
14
15
16
17
18
19
20
21
22
23
24
25
26
27
28
29
30
31
32
33
34
35
36
37
38
FERC FORM NO. 1 (ED. 12-87) Page 353
20170505-8016 FERC PDF (Unofficial) 04/07/2017
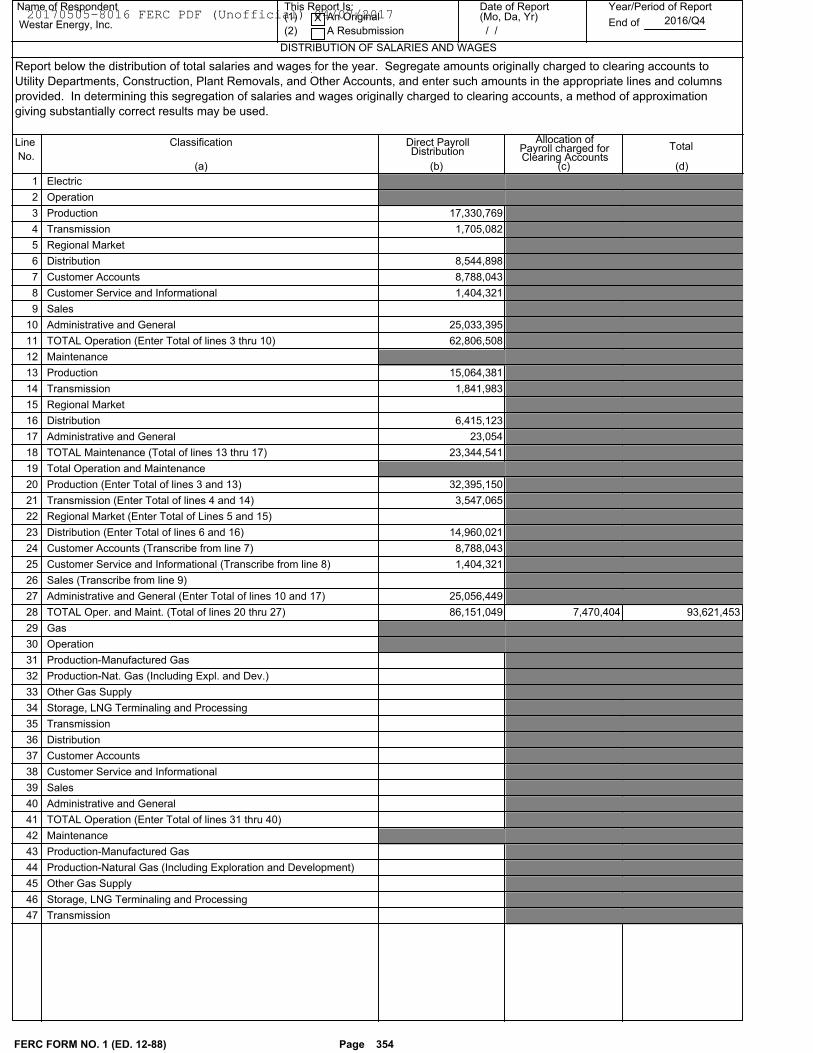
Name of Respondent This Report Is:(1) An Original
(2) A Resubmission
Date of Report(Mo, Da, Yr)
Year/Period of Report
End of
DISTRIBUTION OF SALARIES AND WAGES
Westar Energy, Inc.X
/ /2016/Q4
Line
No.
Classification
(c)(b)(a)
Direct Payroll Allocation ofTotal
(d)
Distribution Payroll charged forClearing Accounts
Report below the distribution of total salaries and wages for the year. Segregate amounts originally charged to clearing accounts to
Utility Departments, Construction, Plant Removals, and Other Accounts, and enter such amounts in the appropriate lines and columns
provided. In determining this segregation of salaries and wages originally charged to clearing accounts, a method of approximation
giving substantially correct results may be used.
Electric 1
Operation 2
17,330,769Production 3
1,705,082Transmission 4
Regional Market 5
8,544,898Distribution 6
8,788,043Customer Accounts 7
1,404,321Customer Service and Informational 8
Sales 9
25,033,395Administrative and General 10
62,806,508TOTAL Operation (Enter Total of lines 3 thru 10) 11
Maintenance 12
15,064,381Production 13
1,841,983Transmission 14
Regional Market 15
6,415,123Distribution 16
23,054Administrative and General 17
23,344,541TOTAL Maintenance (Total of lines 13 thru 17) 18
Total Operation and Maintenance 19
32,395,150Production (Enter Total of lines 3 and 13) 20
3,547,065Transmission (Enter Total of lines 4 and 14) 21
Regional Market (Enter Total of Lines 5 and 15) 22
14,960,021Distribution (Enter Total of lines 6 and 16) 23
8,788,043Customer Accounts (Transcribe from line 7) 24
1,404,321Customer Service and Informational (Transcribe from line 8) 25
Sales (Transcribe from line 9) 26
25,056,449Administrative and General (Enter Total of lines 10 and 17) 27
93,621,453 7,470,404 86,151,049TOTAL Oper. and Maint. (Total of lines 20 thru 27) 28
Gas 29
Operation 30
Production-Manufactured Gas 31
Production-Nat. Gas (Including Expl. and Dev.) 32
Other Gas Supply 33
Storage, LNG Terminaling and Processing 34
Transmission 35
Distribution 36
Customer Accounts 37
Customer Service and Informational 38
Sales 39
Administrative and General 40
TOTAL Operation (Enter Total of lines 31 thru 40) 41
Maintenance 42
Production-Manufactured Gas 43
Production-Natural Gas (Including Exploration and Development) 44
Other Gas Supply 45
Storage, LNG Terminaling and Processing 46
Transmission 47
FERC FORM NO. 1 (ED. 12-88) Page 354
20170505-8016 FERC PDF (Unofficial) 04/07/2017
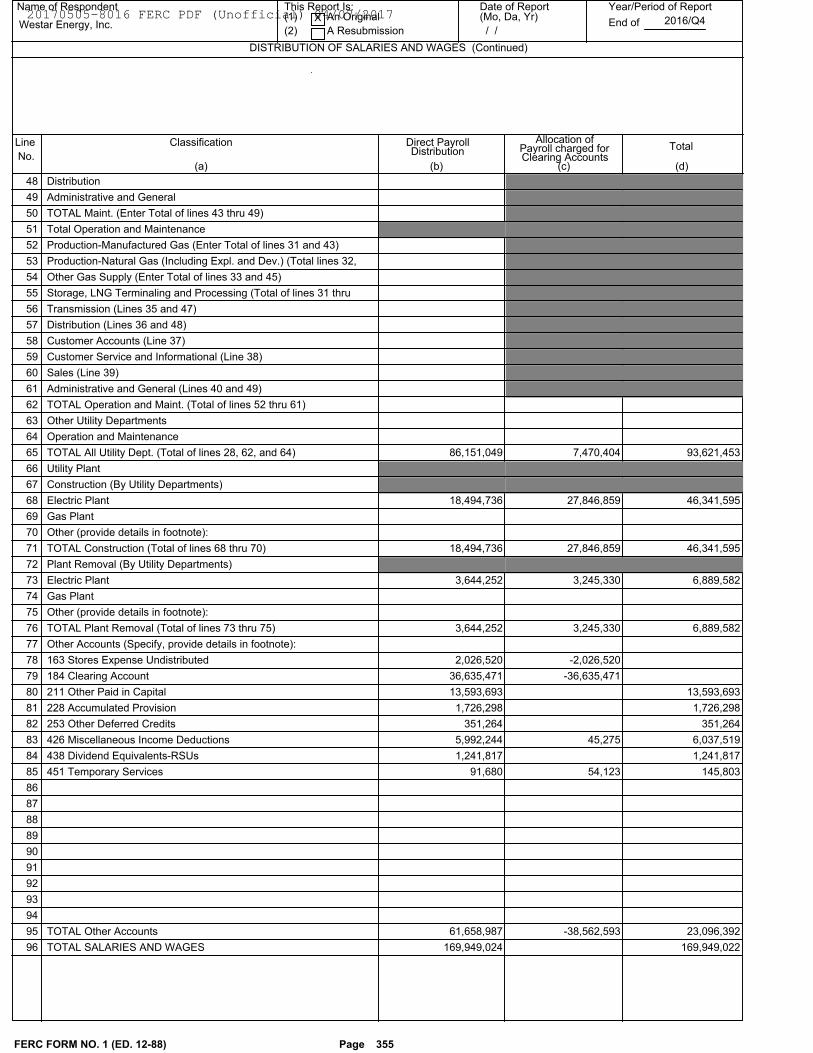
Name of Respondent This Report Is:(1) An Original
(2) A Resubmission
Date of Report(Mo, Da, Yr)
Year/Period of Report
End ofWestar Energy, Inc.X
/ /2016/Q4
Line
No.
Classification
(c)(b)(a)
Direct Payroll Allocation ofTotal
(d)
Distribution Payroll charged forClearing Accounts
DISTRIBUTION OF SALARIES AND WAGES (Continued)
Distribution 48
Administrative and General 49
TOTAL Maint. (Enter Total of lines 43 thru 49) 50
Total Operation and Maintenance 51
Production-Manufactured Gas (Enter Total of lines 31 and 43) 52
Production-Natural Gas (Including Expl. and Dev.) (Total lines 32, 53
Other Gas Supply (Enter Total of lines 33 and 45) 54
Storage, LNG Terminaling and Processing (Total of lines 31 thru 55
Transmission (Lines 35 and 47) 56
Distribution (Lines 36 and 48) 57
Customer Accounts (Line 37) 58
Customer Service and Informational (Line 38) 59
Sales (Line 39) 60
Administrative and General (Lines 40 and 49) 61
TOTAL Operation and Maint. (Total of lines 52 thru 61) 62
Other Utility Departments 63
Operation and Maintenance 64
93,621,453 7,470,404 86,151,049TOTAL All Utility Dept. (Total of lines 28, 62, and 64) 65
Utility Plant 66
Construction (By Utility Departments) 67
46,341,595 27,846,859 18,494,736Electric Plant 68
Gas Plant 69
Other (provide details in footnote): 70
46,341,595 27,846,859 18,494,736TOTAL Construction (Total of lines 68 thru 70) 71
Plant Removal (By Utility Departments) 72
6,889,582 3,245,330 3,644,252Electric Plant 73
Gas Plant 74
Other (provide details in footnote): 75
6,889,582 3,245,330 3,644,252TOTAL Plant Removal (Total of lines 73 thru 75) 76
Other Accounts (Specify, provide details in footnote): 77
-2,026,520 2,026,520163 Stores Expense Undistributed 78
-36,635,471 36,635,471184 Clearing Account 79
13,593,693 13,593,693211 Other Paid in Capital 80
1,726,298 1,726,298228 Accumulated Provision 81
351,264 351,264253 Other Deferred Credits 82
6,037,519 45,275 5,992,244426 Miscellaneous Income Deductions 83
1,241,817 1,241,817438 Dividend Equivalents-RSUs 84
145,803 54,123 91,680451 Temporary Services 85
86
87
88
89
90
91
92
93
94
23,096,392 -38,562,593 61,658,987TOTAL Other Accounts 95
169,949,022 169,949,024TOTAL SALARIES AND WAGES 96
FERC FORM NO. 1 (ED. 12-88) Page 355
20170505-8016 FERC PDF (Unofficial) 04/07/2017
Name of Respondent This Report Is:
(1) An Original
(2) A Resubmission
Date of Report(Mo, Da, Yr)
Year/Period of Report
End of
COMMON UTILITY PLANT AND EXPENSES
Westar Energy, Inc. X
/ /2016/Q4
1. Describe the property carried in the utility's accounts as common utility plant and show the book cost of such plant at end of year classified by
accounts as provided by Plant Instruction 13, Common Utility Plant, of the Uniform System of Accounts. Also show the allocation of such plant costs to
the respective departments using the common utility plant and explain the basis of allocation used, giving the allocation factors.
2. Furnish the accumulated provisions for depreciation and amortization at end of year, showing the amounts and classifications of such accumulated
provisions, and amounts allocated to utility departments using the Common utility plant to which such accumulated provisions relate, including
explanation of basis of allocation and factors used.
3. Give for the year the expenses of operation, maintenance, rents, depreciation, and amortization for common utility plant classified by accounts as
provided by the Uniform System of Accounts. Show the allocation of such expenses to the departments using the common utility plant to which such
expenses are related. Explain the basis of allocation used and give the factors of allocation.
4. Give date of approval by the Commission for use of the common utility plant classification and reference to order of the Commission or other
authorization.
FERC FORM NO. 1 (ED. 12-87) Page 356
20170505-8016 FERC PDF (Unofficial) 04/07/2017
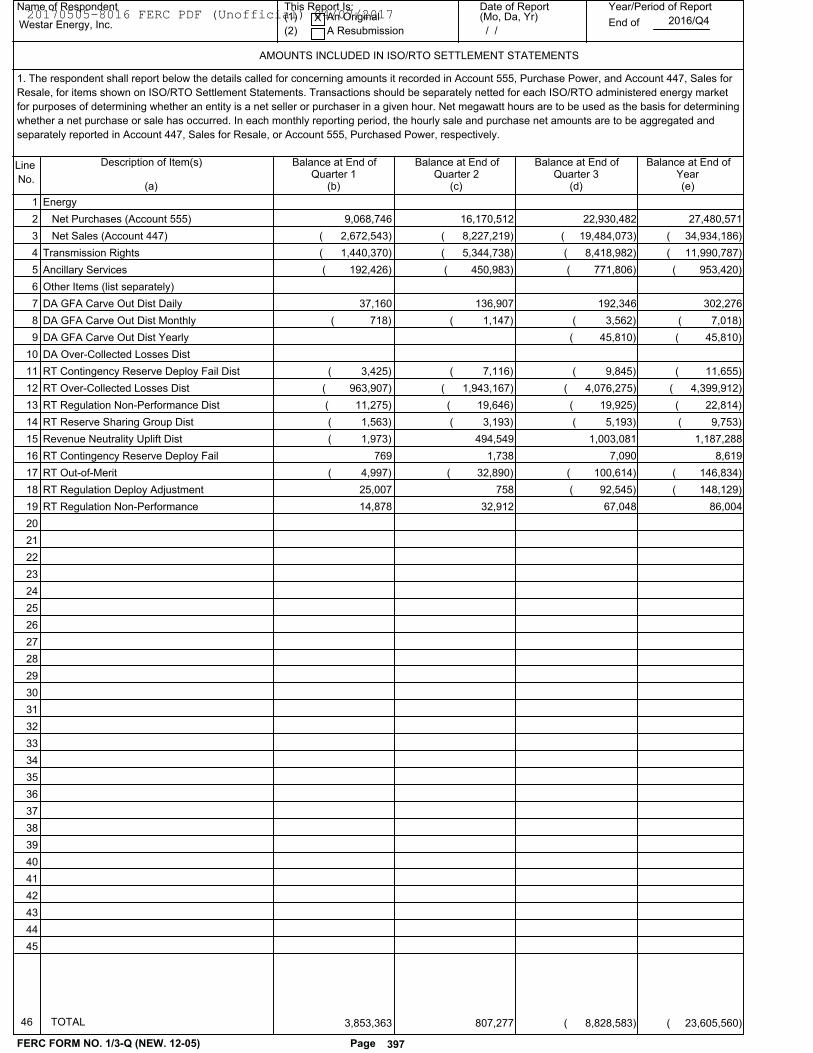
Name of Respondent This Report Is:(1) An Original
(2) A Resubmission
Date of Report(Mo, Da, Yr)
Year/Period of Report
End ofWestar Energy, Inc.X
/ /2016/Q4
Line
No.
Description of Item(s) Balance at End of
(c)(b)(a)
Balance at End of
AMOUNTS INCLUDED IN ISO/RTO SETTLEMENT STATEMENTS
Quarter 1 Quarter 2Balance at End of
Quarter 3(d) (e)
1. The respondent shall report below the details called for concerning amounts it recorded in Account 555, Purchase Power, and Account 447, Sales for
Resale, for items shown on ISO/RTO Settlement Statements. Transactions should be separately netted for each ISO/RTO administered energy market
for purposes of determining whether an entity is a net seller or purchaser in a given hour. Net megawatt hours are to be used as the basis for determining
whether a net purchase or sale has occurred. In each monthly reporting period, the hourly sale and purchase net amounts are to be aggregated and
separately reported in Account 447, Sales for Resale, or Account 555, Purchased Power, respectively.
Balance at End ofYear
Energy 1
Net Purchases (Account 555) 2 27,480,5719,068,746 16,170,512 22,930,482
Net Sales (Account 447) 3 ( 34,934,186)( 2,672,543) ( 8,227,219) ( 19,484,073)
Transmission Rights 4 ( 11,990,787)( 1,440,370) ( 5,344,738) ( 8,418,982)
Ancillary Services 5 ( 953,420)( 192,426) ( 450,983) ( 771,806)
Other Items (list separately) 6
DA GFA Carve Out Dist Daily 7 302,27637,160 136,907 192,346
DA GFA Carve Out Dist Monthly 8 ( 7,018)( 718) ( 1,147) ( 3,562)
DA GFA Carve Out Dist Yearly 9 ( 45,810)( 45,810)
DA Over-Collected Losses Dist 10
RT Contingency Reserve Deploy Fail Dist 11 ( 11,655)( 3,425) ( 7,116) ( 9,845)
RT Over-Collected Losses Dist 12 ( 4,399,912)( 963,907) ( 1,943,167) ( 4,076,275)
RT Regulation Non-Performance Dist 13 ( 22,814)( 11,275) ( 19,646) ( 19,925)
RT Reserve Sharing Group Dist 14 ( 9,753)( 1,563) ( 3,193) ( 5,193)
Revenue Neutrality Uplift Dist 15 1,187,288( 1,973) 494,549 1,003,081
RT Contingency Reserve Deploy Fail 16 8,619769 1,738 7,090
RT Out-of-Merit 17 ( 146,834)( 4,997) ( 32,890) ( 100,614)
RT Regulation Deploy Adjustment 18 ( 148,129)25,007 758 ( 92,545)
RT Regulation Non-Performance 19 86,00414,878 32,912 67,048
20
21
22
23
24
25
26
27
28
29
30
31
32
33
34
35
36
37
38
39
40
41
42
43
44
45
( 23,605,560)3,853,363 807,277 ( 8,828,583)
FERC FORM NO. 1/3-Q (NEW. 12-05) Page 397
46 TOTAL
20170505-8016 FERC PDF (Unofficial) 04/07/2017
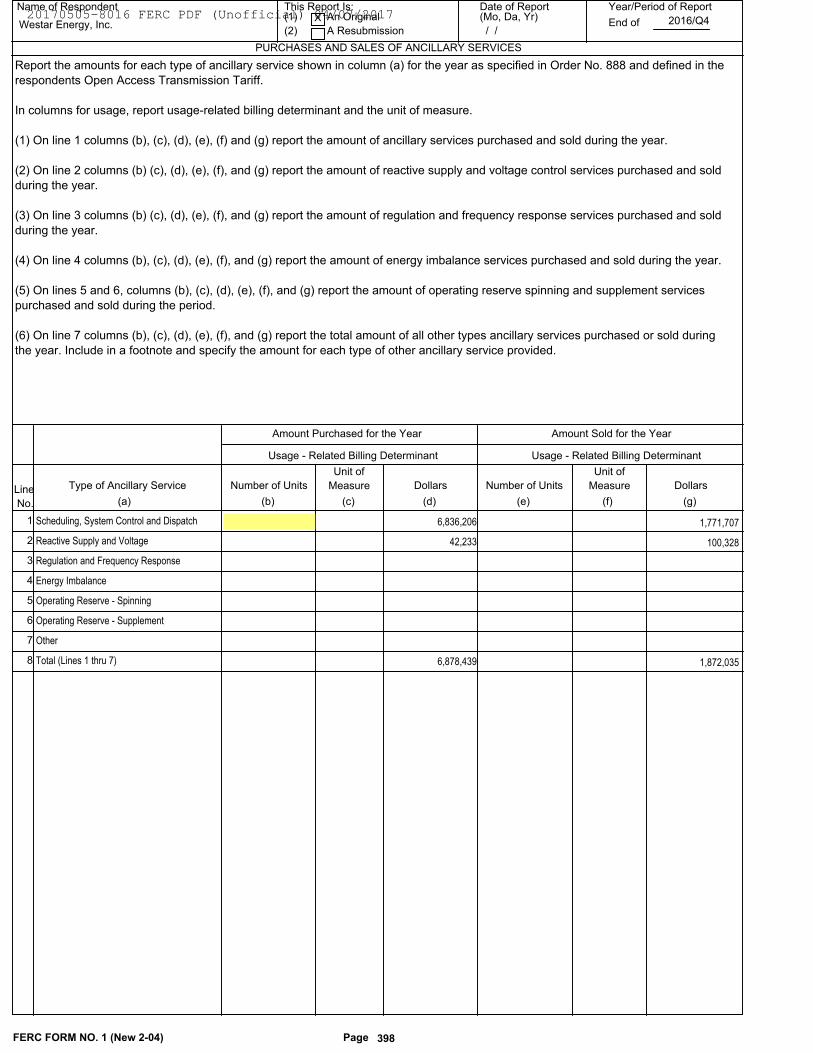
Name of Respondent This Report Is:(1) An Original
(2) A Resubmission
Date of Report(Mo, Da, Yr)
Year/Period of Report
End of
PURCHASES AND SALES OF ANCILLARY SERVICES
Westar Energy, Inc.X
/ /2016/Q4
Line
No.
Type of Ancillary Service
(a)
Report the amounts for each type of ancillary service shown in column (a) for the year as specified in Order No. 888 and defined in the
respondents Open Access Transmission Tariff.
In columns for usage, report usage-related billing determinant and the unit of measure.
(1) On line 1 columns (b), (c), (d), (e), (f) and (g) report the amount of ancillary services purchased and sold during the year.
(2) On line 2 columns (b) (c), (d), (e), (f), and (g) report the amount of reactive supply and voltage control services purchased and sold
during the year.
(3) On line 3 columns (b) (c), (d), (e), (f), and (g) report the amount of regulation and frequency response services purchased and sold
during the year.
(4) On line 4 columns (b), (c), (d), (e), (f), and (g) report the amount of energy imbalance services purchased and sold during the year.
(5) On lines 5 and 6, columns (b), (c), (d), (e), (f), and (g) report the amount of operating reserve spinning and supplement services
purchased and sold during the period.
(6) On line 7 columns (b), (c), (d), (e), (f), and (g) report the total amount of all other types ancillary services purchased or sold during
the year. Include in a footnote and specify the amount for each type of other ancillary service provided.
Number of Units
Unit of
Measure Dollars
(b) (c) (d)
Number of Units
Unit of
Measure Dollars
(e) (f) (g)
Usage - Related Billing Determinant Usage - Related Billing Determinant
Amount Purchased for the Year Amount Sold for the Year
1,771,707 6,836,206Scheduling, System Control and Dispatch 1
100,328 42,233Reactive Supply and Voltage 2
Regulation and Frequency Response 3
Energy Imbalance 4
Operating Reserve - Spinning 5
Operating Reserve - Supplement 6
Other 7
1,872,035 6,878,439Total (Lines 1 thru 7) 8
FERC FORM NO. 1 (New 2-04) Page 398
20170505-8016 FERC PDF (Unofficial) 04/07/2017
Schedule Page: 398 Line No.: 1 Column: bWe do not track "number of units" or "units of measure" associated with all Ancillary
Services since the revenues and expenses are divided between Westar Energy, Inc. and
Kansas Gas and Electric Company on a proportionate basis while the billing or revenue
received from the southwest Power Pool and other entities are for the combined companies.
Name of Respondent
Westar Energy, Inc.
This Report is:(1) X An Original(2) A Resubmission
Date of Report(Mo, Da, Yr)
/ /
Year/Period of Report
2016/Q4
FOOTNOTE DATA
FERC FORM NO. 1 (ED. 12-87) Page 450.1
20170505-8016 FERC PDF (Unofficial) 04/07/2017
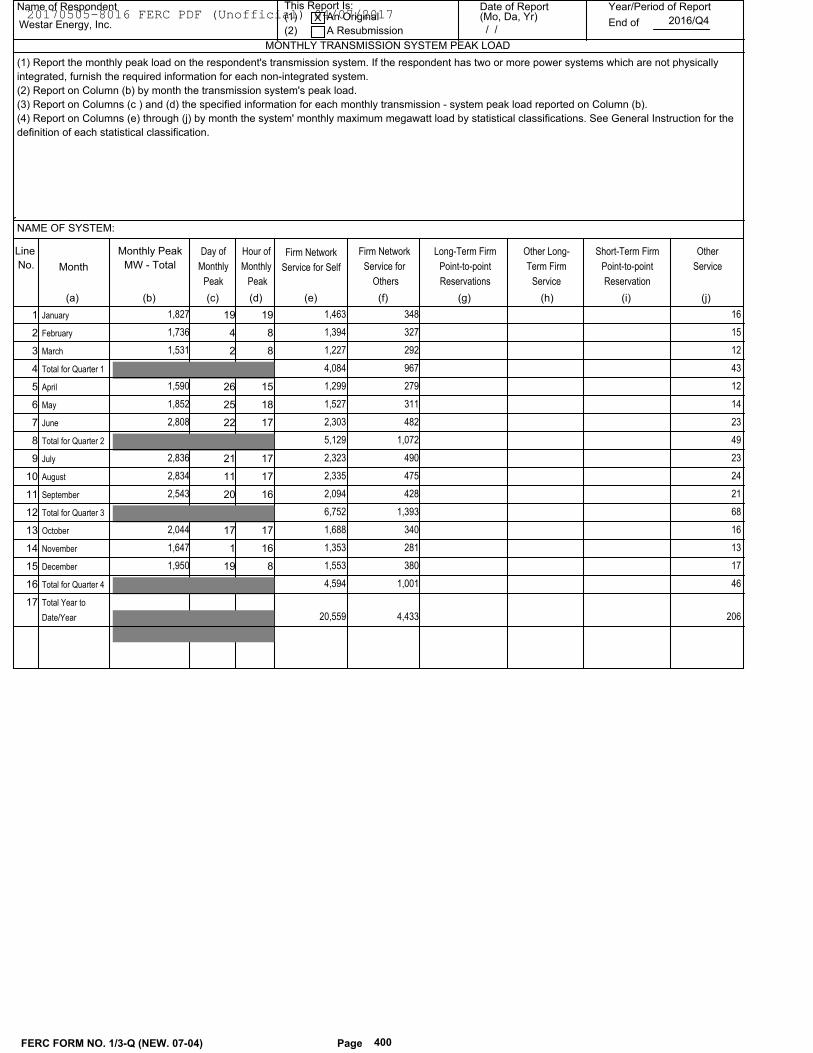
Name of Respondent This Report Is:(1) An Original
(2) A Resubmission
Date of Report(Mo, Da, Yr)
Year/Period of Report
End of
MONTHLY TRANSMISSION SYSTEM PEAK LOAD
Westar Energy, Inc.X
/ /2016/Q4
Line
No.
Monthly Peak
MW - Total
(c)(b)(a)
Month
NAME OF SYSTEM:
Day of
Monthly
Peak
(1) Report the monthly peak load on the respondent's transmission system. If the respondent has two or more power systems which are not physically
integrated, furnish the required information for each non-integrated system.
(2) Report on Column (b) by month the transmission system's peak load.
(3) Report on Columns (c ) and (d) the specified information for each monthly transmission - system peak load reported on Column (b).
(4) Report on Columns (e) through (j) by month the system' monthly maximum megawatt load by statistical classifications. See General Instruction for the
definition of each statistical classification.
(d)
Hour of
Monthly
Peak
(e)
Firm Network
Service for Self
(f)
Firm Network
Service for
Others
(g)
Long-Term Firm
Point-to-point
Reservations
(h)
Other Long-
Term Firm
Service
(i)
Short-Term Firm
Point-to-point
Reservation
(j)
Other
Service
16 348 1,463 1919 1,827January 1
15 327 1,394 8 4 1,736February 2
12 292 1,227 8 2 1,531March 3
43 967 4,084Total for Quarter 1 4
12 279 1,299 1526 1,590April 5
14 311 1,527 1825 1,852May 6
23 482 2,303 1722 2,808June 7
49 1,072 5,129Total for Quarter 2 8
23 490 2,323 1721 2,836July 9
24 475 2,335 1711 2,834August 10
21 428 2,094 1620 2,543September 11
68 1,393 6,752Total for Quarter 3 12
16 340 1,688 1717 2,044October 13
13 281 1,353 16 1 1,647November 14
17 380 1,553 819 1,950December 15
46 1,001 4,594Total for Quarter 4 16
206 4,433 20,559
Total Year to
Date/Year
17
FERC FORM NO. 1/3-Q (NEW. 07-04) Page 400
20170505-8016 FERC PDF (Unofficial) 04/07/2017
Name of Respondent This Report Is:(1) An Original
(2) A Resubmission
Date of Report(Mo, Da, Yr)
Year/Period of Report
End of
MONTHLY ISO/RTO TRANSMISSION SYSTEM PEAK LOAD
Westar Energy, Inc.X
/ /2016/Q4
Line
No.
Monthly Peak
MW - Total
(c)(b)(a)
Month
NAME OF SYSTEM:
Day of
Monthly
Peak
(1) Report the monthly peak load on the respondent's transmission system. If the Respondent has two or more power systems which are not physically
integrated, furnish the required information for each non-integrated system.
(2) Report on Column (b) by month the transmission system's peak load.
(3) Report on Column (c) and (d) the specified information for each monthly transmission - system peak load reported on Column (b).
(4) Report on Columns (e) through (i) by month the system’s transmission usage by classification. Amounts reported as Through and Out Service in
Column (g) are to be excluded from those amounts reported in Columns (e) and (f).
(5) Amounts reported in Column (j) for Total Usage is the sum of Columns (h) and (i).
(d)
Hour of
Monthly
Peak
(e)
Imports into
ISO/RTO
(f)
Exports from
ISO/RTO
(g)
Through and
Out Service
(h)
Network
Service Usage
(i)
Point-to-Point
Service Usage
(j)
Total Usage
January 1
February 2
March 3
Total for Quarter 1 4
April 5
May 6
June 7
Total for Quarter 2 8
July 9
August 10
September 11
Total for Quarter 3 12
October 13
November 14
December 15
Total for Quarter 4 16
Total Year to
Date/Year
17
FERC FORM NO. 1/3-Q (NEW. 07-04) Page 400a
20170505-8016 FERC PDF (Unofficial) 04/07/2017
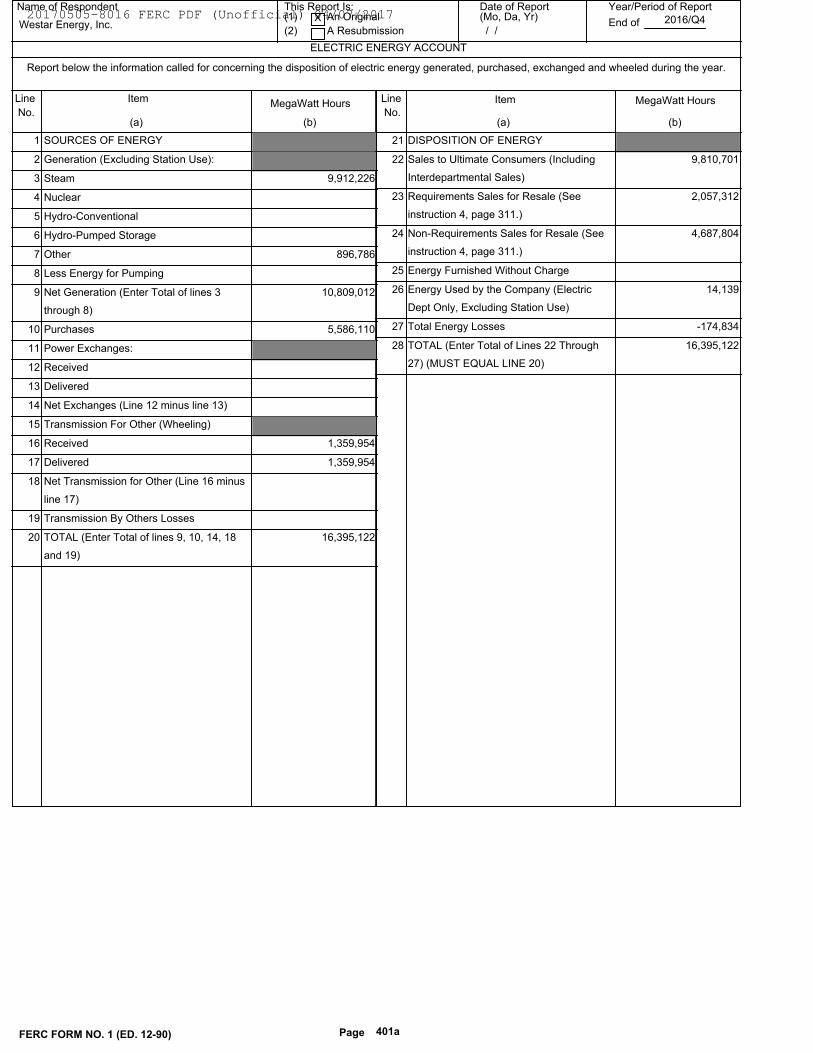
Name of Respondent This Report Is:(1) An Original
(2) A Resubmission
Date of Report(Mo, Da, Yr)
Year/Period of Report
End of
ELECTRIC ENERGY ACCOUNT
Westar Energy, Inc.X
/ /2016/Q4
Line
No.
Item
(a)(b)(a) (b)
Line
No.MegaWatt Hours Item MegaWatt Hours
Report below the information called for concerning the disposition of electric energy generated, purchased, exchanged and wheeled during the year.
SOURCES OF ENERGY1
Generation (Excluding Station Use):2
9,912,226Steam3
Nuclear4
Hydro-Conventional5
Hydro-Pumped Storage6
896,786Other7
Less Energy for Pumping8
10,809,012Net Generation (Enter Total of lines 3
through 8)
9
5,586,110Purchases10
Power Exchanges:11
Received12
Delivered13
Net Exchanges (Line 12 minus line 13)14
Transmission For Other (Wheeling)15
1,359,954Received16
1,359,954Delivered17
Net Transmission for Other (Line 16 minus
line 17)
18
Transmission By Others Losses19
16,395,122TOTAL (Enter Total of lines 9, 10, 14, 18
and 19)
20
DISPOSITION OF ENERGY21
9,810,701Sales to Ultimate Consumers (Including
Interdepartmental Sales)
22
2,057,312Requirements Sales for Resale (See
instruction 4, page 311.)
23
4,687,804Non-Requirements Sales for Resale (See
instruction 4, page 311.)
24
Energy Furnished Without Charge25
14,139Energy Used by the Company (Electric
Dept Only, Excluding Station Use)
26
-174,834Total Energy Losses27
16,395,122TOTAL (Enter Total of Lines 22 Through
27) (MUST EQUAL LINE 20)
28
FERC FORM NO. 1 (ED. 12-90) Page 401a
20170505-8016 FERC PDF (Unofficial) 04/07/2017
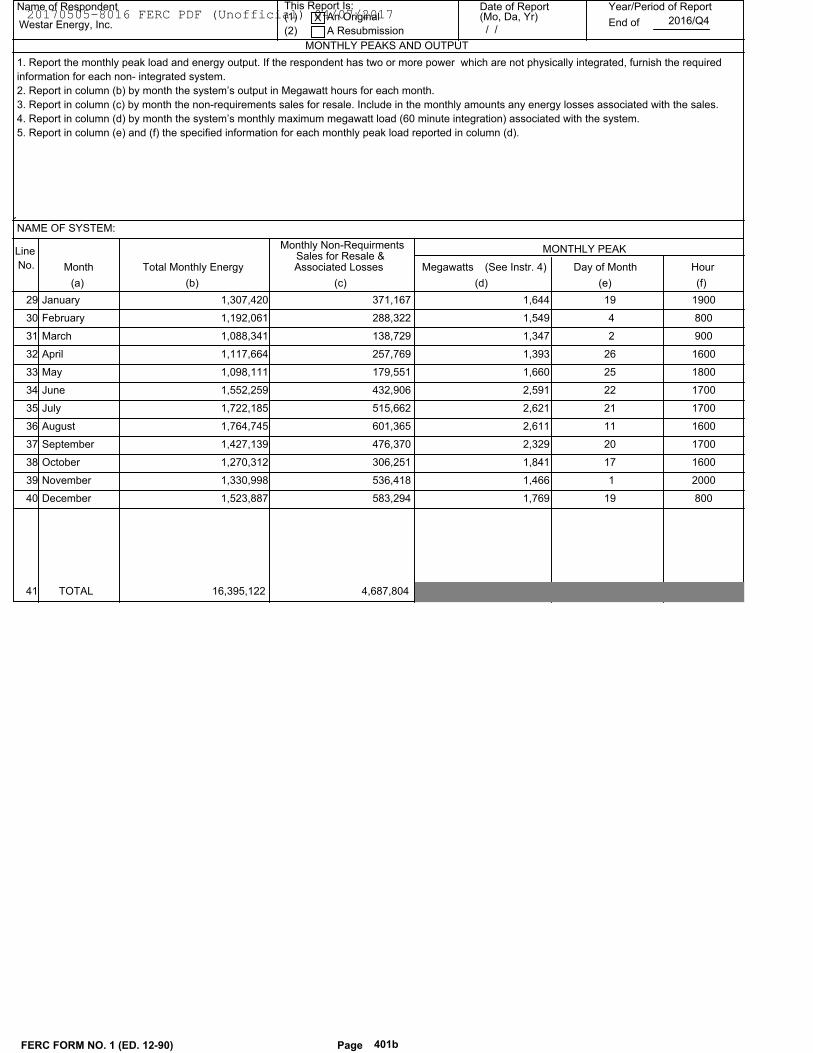
(d)
Day of Month
Name of Respondent This Report Is:(1) An Original
(2) A Resubmission
Date of Report(Mo, Da, Yr)
Year/Period of Report
End of
MONTHLY PEAKS AND OUTPUT
Westar Energy, Inc.X
/ /2016/Q4
Line
No. Total Monthly Energy Megawatts
(c)(b)(a)
Hour
(e)
MONTHLY PEAK
Month
NAME OF SYSTEM:
Monthly Non-RequirmentsSales for Resale &Associated Losses (See Instr. 4)
1. Report the monthly peak load and energy output. If the respondent has two or more power which are not physically integrated, furnish the required
information for each non- integrated system.
2. Report in column (b) by month the system’s output in Megawatt hours for each month.
3. Report in column (c) by month the non-requirements sales for resale. Include in the monthly amounts any energy losses associated with the sales.
4. Report in column (d) by month the system’s monthly maximum megawatt load (60 minute integration) associated with the system.
5. Report in column (e) and (f) the specified information for each monthly peak load reported in column (d).
(f)
January 29 19 1,644 371,167 1900 1,307,420
February 30 4 1,549 288,322 800 1,192,061
March 31 2 1,347 138,729 900 1,088,341
April 32 26 1,393 257,769 1600 1,117,664
May 33 25 1,660 179,551 1800 1,098,111
June 34 22 2,591 432,906 1700 1,552,259
July 35 21 2,621 515,662 1700 1,722,185
August 36 11 2,611 601,365 1600 1,764,745
September 37 20 2,329 476,370 1700 1,427,139
October 38 17 1,841 306,251 1600 1,270,312
November 39 1 1,466 536,418 2000 1,330,998
December 40 19 1,769 583,294 800 1,523,887
FERC FORM NO. 1 (ED. 12-90) Page 401b
41 TOTAL 16,395,122 4,687,804
20170505-8016 FERC PDF (Unofficial) 04/07/2017
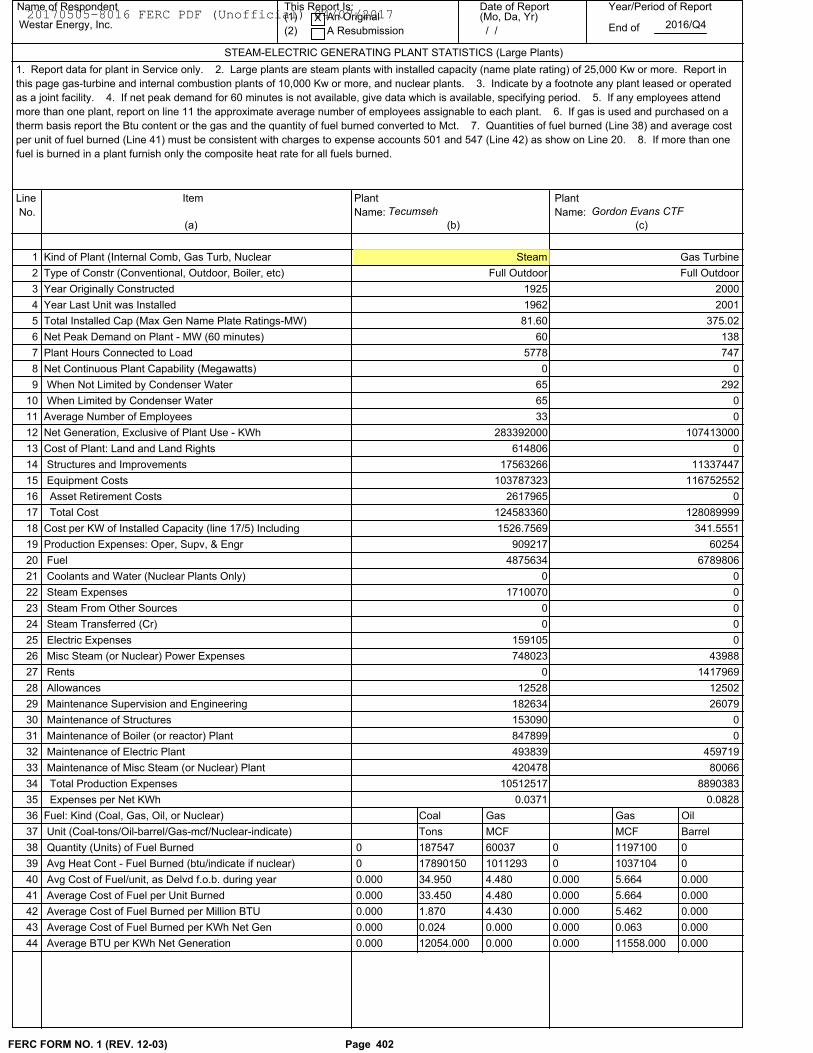
Gordon Evans CTFTecumseh
Name of Respondent This Report Is:(1) An Original
(2) A Resubmission
Date of Report(Mo, Da, Yr)
Year/Period of Report
End ofWestar Energy, Inc.X
/ /2016/Q4
Line
No.
Item
(b)(a) (c)
Plant
Name:
Plant
Name:
STEAM-ELECTRIC GENERATING PLANT STATISTICS (Large Plants)
1. Report data for plant in Service only. 2. Large plants are steam plants with installed capacity (name plate rating) of 25,000 Kw or more. Report in
this page gas-turbine and internal combustion plants of 10,000 Kw or more, and nuclear plants. 3. Indicate by a footnote any plant leased or operated
as a joint facility. 4. If net peak demand for 60 minutes is not available, give data which is available, specifying period. 5. If any employees attend
more than one plant, report on line 11 the approximate average number of employees assignable to each plant. 6. If gas is used and purchased on a
therm basis report the Btu content or the gas and the quantity of fuel burned converted to Mct. 7. Quantities of fuel burned (Line 38) and average cost
per unit of fuel burned (Line 41) must be consistent with charges to expense accounts 501 and 547 (Line 42) as show on Line 20. 8. If more than one
fuel is burned in a plant furnish only the composite heat rate for all fuels burned.
Gas TurbineSteam 1 Kind of Plant (Internal Comb, Gas Turb, Nuclear
Full OutdoorFull Outdoor 2 Type of Constr (Conventional, Outdoor, Boiler, etc)
20001925 3 Year Originally Constructed
20011962 4 Year Last Unit was Installed
375.0281.60 5 Total Installed Cap (Max Gen Name Plate Ratings-MW)
13860 6 Net Peak Demand on Plant - MW (60 minutes)
7475778 7 Plant Hours Connected to Load
00 8 Net Continuous Plant Capability (Megawatts)
29265 9 When Not Limited by Condenser Water
065 10 When Limited by Condenser Water
033 11 Average Number of Employees
107413000283392000 12 Net Generation, Exclusive of Plant Use - KWh
0614806 13 Cost of Plant: Land and Land Rights
1133744717563266 14 Structures and Improvements
116752552103787323 15 Equipment Costs
02617965 16 Asset Retirement Costs
128089999124583360 17 Total Cost
341.55511526.7569 18 Cost per KW of Installed Capacity (line 17/5) Including
60254909217 19 Production Expenses: Oper, Supv, & Engr
67898064875634 20 Fuel
00 21 Coolants and Water (Nuclear Plants Only)
01710070 22 Steam Expenses
00 23 Steam From Other Sources
00 24 Steam Transferred (Cr)
0159105 25 Electric Expenses
43988748023 26 Misc Steam (or Nuclear) Power Expenses
14179690 27 Rents
1250212528 28 Allowances
26079182634 29 Maintenance Supervision and Engineering
0153090 30 Maintenance of Structures
0847899 31 Maintenance of Boiler (or reactor) Plant
459719493839 32 Maintenance of Electric Plant
80066420478 33 Maintenance of Misc Steam (or Nuclear) Plant
889038310512517 34 Total Production Expenses
0.08280.0371 35 Expenses per Net KWh
Coal Gas Gas Oil 36 Fuel: Kind (Coal, Gas, Oil, or Nuclear)
Tons MCF MCF Barrel 37 Unit (Coal-tons/Oil-barrel/Gas-mcf/Nuclear-indicate)
0 187547 60037 0 1197100 0 38 Quantity (Units) of Fuel Burned
0 17890150 1011293 0 1037104 0 39 Avg Heat Cont - Fuel Burned (btu/indicate if nuclear)
0.000 34.950 4.480 0.000 5.664 0.000 40 Avg Cost of Fuel/unit, as Delvd f.o.b. during year
0.000 33.450 4.480 0.000 5.664 0.000 41 Average Cost of Fuel per Unit Burned
0.000 1.870 4.430 0.000 5.462 0.000 42 Average Cost of Fuel Burned per Million BTU
0.000 0.024 0.000 0.000 0.063 0.000 43 Average Cost of Fuel Burned per KWh Net Gen
0.000 12054.000 0.000 0.000 11558.000 0.000 44 Average BTU per KWh Net Generation
FERC FORM NO. 1 (REV. 12-03) Page 402
20170505-8016 FERC PDF (Unofficial) 04/07/2017
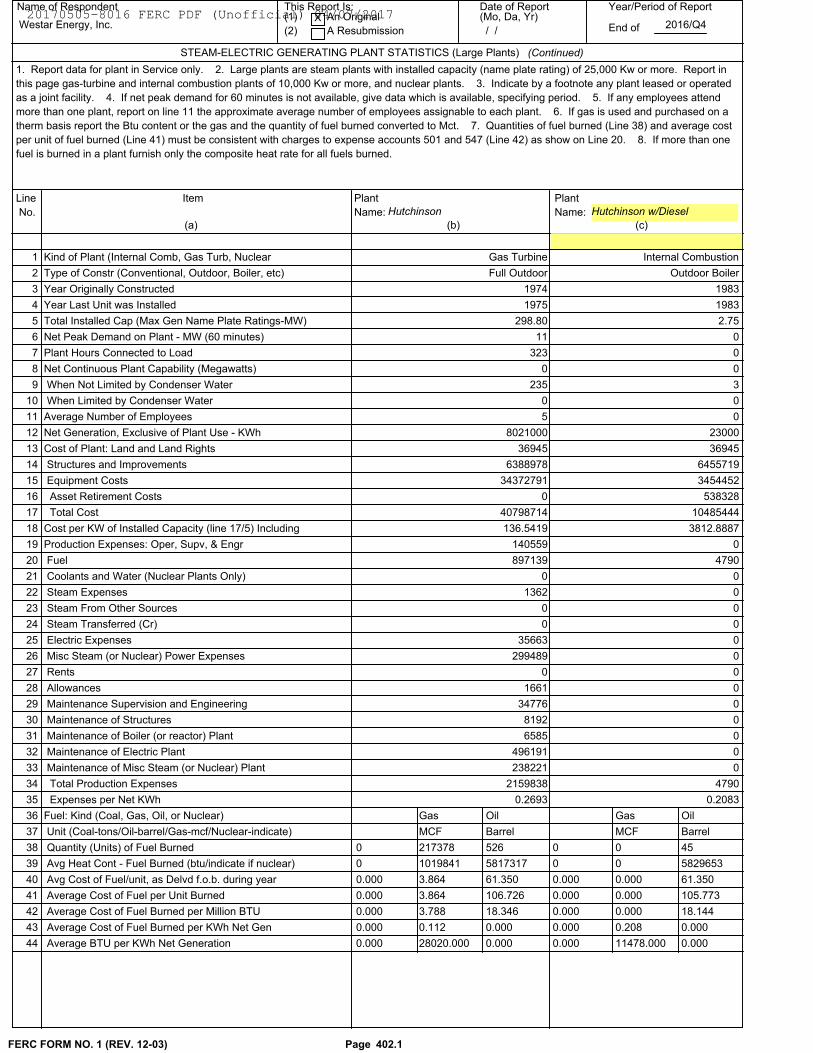
Hutchinson w/DieselHutchinson
Name of Respondent This Report Is:(1) An Original
(2) A Resubmission
Date of Report(Mo, Da, Yr)
Year/Period of Report
End ofWestar Energy, Inc.X
/ /2016/Q4
Line
No.
Item
(b)(a) (c)
Plant
Name:
Plant
Name:
STEAM-ELECTRIC GENERATING PLANT STATISTICS (Large Plants) (Continued)
1. Report data for plant in Service only. 2. Large plants are steam plants with installed capacity (name plate rating) of 25,000 Kw or more. Report in
this page gas-turbine and internal combustion plants of 10,000 Kw or more, and nuclear plants. 3. Indicate by a footnote any plant leased or operated
as a joint facility. 4. If net peak demand for 60 minutes is not available, give data which is available, specifying period. 5. If any employees attend
more than one plant, report on line 11 the approximate average number of employees assignable to each plant. 6. If gas is used and purchased on a
therm basis report the Btu content or the gas and the quantity of fuel burned converted to Mct. 7. Quantities of fuel burned (Line 38) and average cost
per unit of fuel burned (Line 41) must be consistent with charges to expense accounts 501 and 547 (Line 42) as show on Line 20. 8. If more than one
fuel is burned in a plant furnish only the composite heat rate for all fuels burned.
Internal CombustionGas Turbine 1 Kind of Plant (Internal Comb, Gas Turb, Nuclear
Outdoor BoilerFull Outdoor 2 Type of Constr (Conventional, Outdoor, Boiler, etc)
19831974 3 Year Originally Constructed
19831975 4 Year Last Unit was Installed
2.75298.80 5 Total Installed Cap (Max Gen Name Plate Ratings-MW)
011 6 Net Peak Demand on Plant - MW (60 minutes)
0323 7 Plant Hours Connected to Load
00 8 Net Continuous Plant Capability (Megawatts)
3235 9 When Not Limited by Condenser Water
00 10 When Limited by Condenser Water
05 11 Average Number of Employees
230008021000 12 Net Generation, Exclusive of Plant Use - KWh
3694536945 13 Cost of Plant: Land and Land Rights
64557196388978 14 Structures and Improvements
345445234372791 15 Equipment Costs
5383280 16 Asset Retirement Costs
1048544440798714 17 Total Cost
3812.8887136.5419 18 Cost per KW of Installed Capacity (line 17/5) Including
0140559 19 Production Expenses: Oper, Supv, & Engr
4790897139 20 Fuel
00 21 Coolants and Water (Nuclear Plants Only)
01362 22 Steam Expenses
00 23 Steam From Other Sources
00 24 Steam Transferred (Cr)
035663 25 Electric Expenses
0299489 26 Misc Steam (or Nuclear) Power Expenses
00 27 Rents
01661 28 Allowances
034776 29 Maintenance Supervision and Engineering
08192 30 Maintenance of Structures
06585 31 Maintenance of Boiler (or reactor) Plant
0496191 32 Maintenance of Electric Plant
0238221 33 Maintenance of Misc Steam (or Nuclear) Plant
47902159838 34 Total Production Expenses
0.20830.2693 35 Expenses per Net KWh
Gas Oil Gas Oil 36 Fuel: Kind (Coal, Gas, Oil, or Nuclear)
MCF Barrel MCF Barrel 37 Unit (Coal-tons/Oil-barrel/Gas-mcf/Nuclear-indicate)
0 217378 526 0 0 45 38 Quantity (Units) of Fuel Burned
0 1019841 5817317 0 0 5829653 39 Avg Heat Cont - Fuel Burned (btu/indicate if nuclear)
0.000 3.864 61.350 0.000 0.000 61.350 40 Avg Cost of Fuel/unit, as Delvd f.o.b. during year
0.000 3.864 106.726 0.000 0.000 105.773 41 Average Cost of Fuel per Unit Burned
0.000 3.788 18.346 0.000 0.000 18.144 42 Average Cost of Fuel Burned per Million BTU
0.000 0.112 0.000 0.000 0.208 0.000 43 Average Cost of Fuel Burned per KWh Net Gen
0.000 28020.000 0.000 0.000 11478.000 0.000 44 Average BTU per KWh Net Generation
FERC FORM NO. 1 (REV. 12-03) Page 402.1
20170505-8016 FERC PDF (Unofficial) 04/07/2017
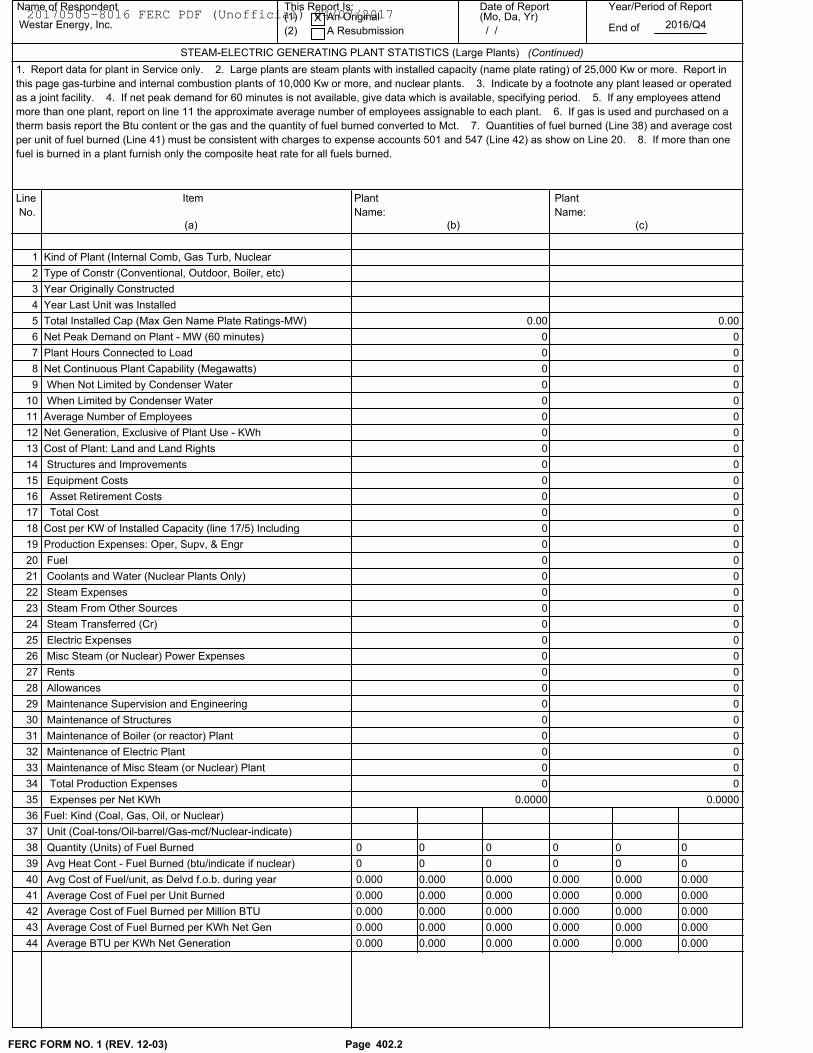
Name of Respondent This Report Is:(1) An Original
(2) A Resubmission
Date of Report(Mo, Da, Yr)
Year/Period of Report
End ofWestar Energy, Inc.X
/ /2016/Q4
Line
No.
Item
(b)(a) (c)
Plant
Name:
Plant
Name:
STEAM-ELECTRIC GENERATING PLANT STATISTICS (Large Plants) (Continued)
1. Report data for plant in Service only. 2. Large plants are steam plants with installed capacity (name plate rating) of 25,000 Kw or more. Report in
this page gas-turbine and internal combustion plants of 10,000 Kw or more, and nuclear plants. 3. Indicate by a footnote any plant leased or operated
as a joint facility. 4. If net peak demand for 60 minutes is not available, give data which is available, specifying period. 5. If any employees attend
more than one plant, report on line 11 the approximate average number of employees assignable to each plant. 6. If gas is used and purchased on a
therm basis report the Btu content or the gas and the quantity of fuel burned converted to Mct. 7. Quantities of fuel burned (Line 38) and average cost
per unit of fuel burned (Line 41) must be consistent with charges to expense accounts 501 and 547 (Line 42) as show on Line 20. 8. If more than one
fuel is burned in a plant furnish only the composite heat rate for all fuels burned.
1 Kind of Plant (Internal Comb, Gas Turb, Nuclear
2 Type of Constr (Conventional, Outdoor, Boiler, etc)
3 Year Originally Constructed
4 Year Last Unit was Installed
0.000.00 5 Total Installed Cap (Max Gen Name Plate Ratings-MW)
00 6 Net Peak Demand on Plant - MW (60 minutes)
00 7 Plant Hours Connected to Load
00 8 Net Continuous Plant Capability (Megawatts)
00 9 When Not Limited by Condenser Water
00 10 When Limited by Condenser Water
00 11 Average Number of Employees
00 12 Net Generation, Exclusive of Plant Use - KWh
00 13 Cost of Plant: Land and Land Rights
00 14 Structures and Improvements
00 15 Equipment Costs
00 16 Asset Retirement Costs
00 17 Total Cost
00 18 Cost per KW of Installed Capacity (line 17/5) Including
00 19 Production Expenses: Oper, Supv, & Engr
00 20 Fuel
00 21 Coolants and Water (Nuclear Plants Only)
00 22 Steam Expenses
00 23 Steam From Other Sources
00 24 Steam Transferred (Cr)
00 25 Electric Expenses
00 26 Misc Steam (or Nuclear) Power Expenses
00 27 Rents
00 28 Allowances
00 29 Maintenance Supervision and Engineering
00 30 Maintenance of Structures
00 31 Maintenance of Boiler (or reactor) Plant
00 32 Maintenance of Electric Plant
00 33 Maintenance of Misc Steam (or Nuclear) Plant
00 34 Total Production Expenses
0.00000.0000 35 Expenses per Net KWh
36 Fuel: Kind (Coal, Gas, Oil, or Nuclear)
37 Unit (Coal-tons/Oil-barrel/Gas-mcf/Nuclear-indicate)
0 0 0 0 0 0 38 Quantity (Units) of Fuel Burned
0 0 0 0 0 0 39 Avg Heat Cont - Fuel Burned (btu/indicate if nuclear)
0.000 0.000 0.000 0.000 0.000 0.000 40 Avg Cost of Fuel/unit, as Delvd f.o.b. during year
0.000 0.000 0.000 0.000 0.000 0.000 41 Average Cost of Fuel per Unit Burned
0.000 0.000 0.000 0.000 0.000 0.000 42 Average Cost of Fuel Burned per Million BTU
0.000 0.000 0.000 0.000 0.000 0.000 43 Average Cost of Fuel Burned per KWh Net Gen
0.000 0.000 0.000 0.000 0.000 0.000 44 Average BTU per KWh Net Generation
FERC FORM NO. 1 (REV. 12-03) Page 402.2
20170505-8016 FERC PDF (Unofficial) 04/07/2017
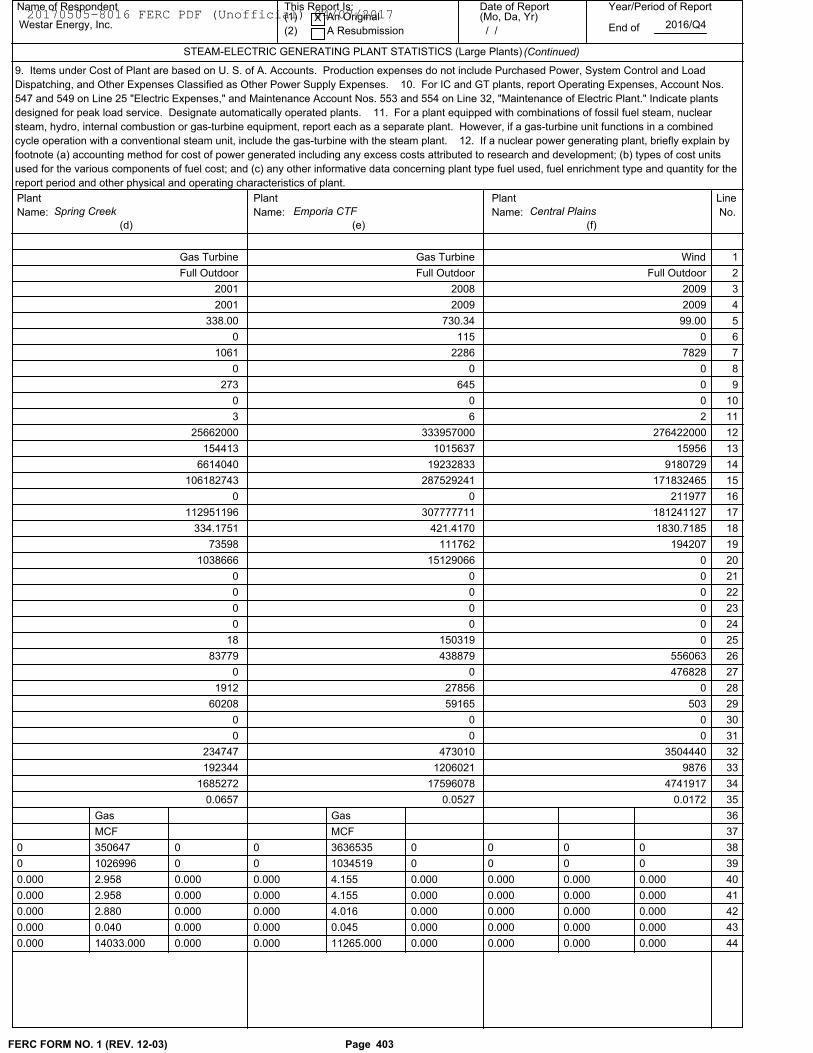
9. Items under Cost of Plant are based on U. S. of A. Accounts. Production expenses do not include Purchased Power, System Control and Load
Dispatching, and Other Expenses Classified as Other Power Supply Expenses. 10. For IC and GT plants, report Operating Expenses, Account Nos.
547 and 549 on Line 25 "Electric Expenses," and Maintenance Account Nos. 553 and 554 on Line 32, "Maintenance of Electric Plant." Indicate plants
designed for peak load service. Designate automatically operated plants. 11. For a plant equipped with combinations of fossil fuel steam, nuclear
steam, hydro, internal combustion or gas-turbine equipment, report each as a separate plant. However, if a gas-turbine unit functions in a combined
cycle operation with a conventional steam unit, include the gas-turbine with the steam plant. 12. If a nuclear power generating plant, briefly explain by
footnote (a) accounting method for cost of power generated including any excess costs attributed to research and development; (b) types of cost units
used for the various components of fuel cost; and (c) any other informative data concerning plant type fuel used, fuel enrichment type and quantity for the
report period and other physical and operating characteristics of plant.
Central PlainsEmporia CTFSpring Creek
Name of Respondent This Report Is:(1) An Original
(2) A Resubmission
Date of Report(Mo, Da, Yr)
Year/Period of Report
End of
STEAM-ELECTRIC GENERATING PLANT STATISTICS (Large Plants)
Westar Energy, Inc.X
/ /2016/Q4
Line
No.
(e) (f)
Plant
Name:
Plant
Name:
(d)
Plant
Name:
(Continued)
WindGas Turbine Gas Turbine 1
Full OutdoorFull Outdoor Full Outdoor 2
20092001 2008 3
20092001 2009 4
99.00338.00 730.34 5
00 115 6
78291061 2286 7
00 0 8
0273 645 9
00 0 10
23 6 11
27642200025662000 333957000 12
15956154413 1015637 13
91807296614040 19232833 14
171832465106182743 287529241 15
2119770 0 16
181241127112951196 307777711 17
1830.7185334.1751 421.4170 18
19420773598 111762 19
01038666 15129066 20
00 0 21
00 0 22
00 0 23
00 0 24
018 150319 25
55606383779 438879 26
4768280 0 27
01912 27856 28
50360208 59165 29
00 0 30
00 0 31
3504440234747 473010 32
9876192344 1206021 33
47419171685272 17596078 34
0.01720.0657 0.0527 35
Gas Gas 36
MCF MCF 37
0 350647 0 0 0 00 3636535 0 38
0 1026996 0 0 0 00 1034519 0 39
0.000 2.958 0.000 0.000 0.000 0.0000.000 4.155 0.000 40
0.000 2.958 0.000 0.000 0.000 0.0000.000 4.155 0.000 41
0.000 2.880 0.000 0.000 0.000 0.0000.000 4.016 0.000 42
0.000 0.040 0.000 0.000 0.000 0.0000.000 0.045 0.000 43
0.000 14033.000 0.000 0.000 0.000 0.0000.000 11265.000 0.000 44
FERC FORM NO. 1 (REV. 12-03) Page 403
20170505-8016 FERC PDF (Unofficial) 04/07/2017
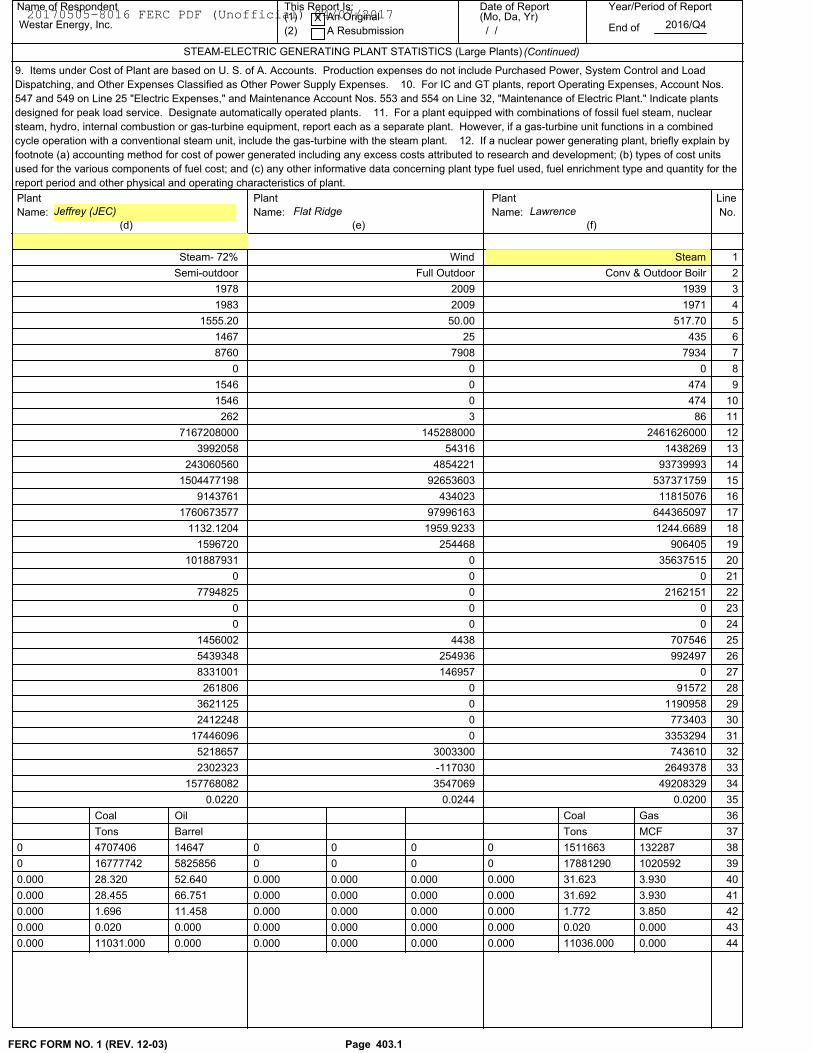
9. Items under Cost of Plant are based on U. S. of A. Accounts. Production expenses do not include Purchased Power, System Control and Load
Dispatching, and Other Expenses Classified as Other Power Supply Expenses. 10. For IC and GT plants, report Operating Expenses, Account Nos.
547 and 549 on Line 25 "Electric Expenses," and Maintenance Account Nos. 553 and 554 on Line 32, "Maintenance of Electric Plant." Indicate plants
designed for peak load service. Designate automatically operated plants. 11. For a plant equipped with combinations of fossil fuel steam, nuclear
steam, hydro, internal combustion or gas-turbine equipment, report each as a separate plant. However, if a gas-turbine unit functions in a combined
cycle operation with a conventional steam unit, include the gas-turbine with the steam plant. 12. If a nuclear power generating plant, briefly explain by
footnote (a) accounting method for cost of power generated including any excess costs attributed to research and development; (b) types of cost units
used for the various components of fuel cost; and (c) any other informative data concerning plant type fuel used, fuel enrichment type and quantity for the
report period and other physical and operating characteristics of plant.
LawrenceFlat RidgeJeffrey (JEC)
Name of Respondent This Report Is:(1) An Original
(2) A Resubmission
Date of Report(Mo, Da, Yr)
Year/Period of Report
End of
STEAM-ELECTRIC GENERATING PLANT STATISTICS (Large Plants)
Westar Energy, Inc.X
/ /2016/Q4
Line
No.
(e) (f)
Plant
Name:
Plant
Name:
(d)
Plant
Name:
(Continued)
SteamSteam- 72% Wind 1
Conv & Outdoor BoilrSemi-outdoor Full Outdoor 2
19391978 2009 3
19711983 2009 4
517.701555.20 50.00 5
4351467 25 6
79348760 7908 7
00 0 8
4741546 0 9
4741546 0 10
86262 3 11
24616260007167208000 145288000 12
14382693992058 54316 13
93739993243060560 4854221 14
5373717591504477198 92653603 15
118150769143761 434023 16
6443650971760673577 97996163 17
1244.66891132.1204 1959.9233 18
9064051596720 254468 19
35637515101887931 0 20
00 0 21
21621517794825 0 22
00 0 23
00 0 24
7075461456002 4438 25
9924975439348 254936 26
08331001 146957 27
91572261806 0 28
11909583621125 0 29
7734032412248 0 30
335329417446096 0 31
7436105218657 3003300 32
26493782302323 -117030 33
49208329157768082 3547069 34
0.02000.0220 0.0244 35
Coal Oil Coal Gas 36
Tons Barrel Tons MCF 37
0 4707406 14647 0 1511663 1322870 0 0 38
0 16777742 5825856 0 17881290 10205920 0 0 39
0.000 28.320 52.640 0.000 31.623 3.9300.000 0.000 0.000 40
0.000 28.455 66.751 0.000 31.692 3.9300.000 0.000 0.000 41
0.000 1.696 11.458 0.000 1.772 3.8500.000 0.000 0.000 42
0.000 0.020 0.000 0.000 0.020 0.0000.000 0.000 0.000 43
0.000 11031.000 0.000 0.000 11036.000 0.0000.000 0.000 0.000 44
FERC FORM NO. 1 (REV. 12-03) Page 403.1
20170505-8016 FERC PDF (Unofficial) 04/07/2017
9. Items under Cost of Plant are based on U. S. of A. Accounts. Production expenses do not include Purchased Power, System Control and Load
Dispatching, and Other Expenses Classified as Other Power Supply Expenses. 10. For IC and GT plants, report Operating Expenses, Account Nos.
547 and 549 on Line 25 "Electric Expenses," and Maintenance Account Nos. 553 and 554 on Line 32, "Maintenance of Electric Plant." Indicate plants
designed for peak load service. Designate automatically operated plants. 11. For a plant equipped with combinations of fossil fuel steam, nuclear
steam, hydro, internal combustion or gas-turbine equipment, report each as a separate plant. However, if a gas-turbine unit functions in a combined
cycle operation with a conventional steam unit, include the gas-turbine with the steam plant. 12. If a nuclear power generating plant, briefly explain by
footnote (a) accounting method for cost of power generated including any excess costs attributed to research and development; (b) types of cost units
used for the various components of fuel cost; and (c) any other informative data concerning plant type fuel used, fuel enrichment type and quantity for the
report period and other physical and operating characteristics of plant.
Name of Respondent This Report Is:(1) An Original
(2) A Resubmission
Date of Report(Mo, Da, Yr)
Year/Period of Report
End of
STEAM-ELECTRIC GENERATING PLANT STATISTICS (Large Plants)
Westar Energy, Inc.X
/ /2016/Q4
Line
No.
(e) (f)
Plant
Name:
Plant
Name:
(d)
Plant
Name:
(Continued)
0 0 1
0 0 2
0 0 3
0 0 4
0.000.00 0.00 5
00 0 6
00 0 7
00 0 8
00 0 9
00 0 10
00 0 11
00 0 12
00 0 13
00 0 14
00 0 15
00 0 16
00 0 17
00 0 18
00 0 19
00 0 20
00 0 21
00 0 22
00 0 23
00 0 24
00 0 25
00 0 26
00 0 27
00 0 28
00 0 29
00 0 30
00 0 31
00 0 32
00 0 33
00 0 34
0.00000.0000 0.0000 35
36
37
0 0 0 0 0 00 0 0 38
0 0 0 0 0 00 0 0 39
0.000 0.000 0.000 0.000 0.000 0.0000.000 0.000 0.000 40
0.000 0.000 0.000 0.000 0.000 0.0000.000 0.000 0.000 41
0.000 0.000 0.000 0.000 0.000 0.0000.000 0.000 0.000 42
0.000 0.000 0.000 0.000 0.000 0.0000.000 0.000 0.000 43
0.000 0.000 0.000 0.000 0.000 0.0000.000 0.000 0.000 44
FERC FORM NO. 1 (REV. 12-03) Page 403.2
20170505-8016 FERC PDF (Unofficial) 04/07/2017
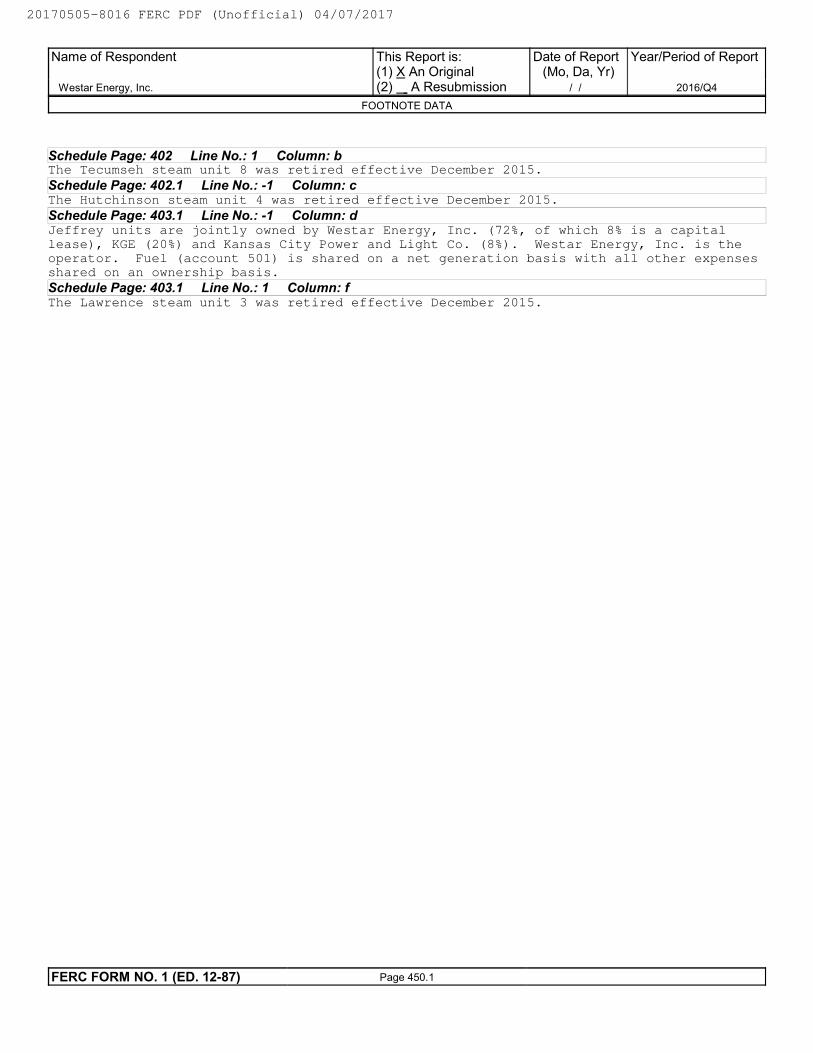
Schedule Page: 402 Line No.: 1 Column: bThe Tecumseh steam unit 8 was retired effective December 2015.
Schedule Page: 402.1 Line No.: -1 Column: cThe Hutchinson steam unit 4 was retired effective December 2015.
Schedule Page: 403.1 Line No.: -1 Column: dJeffrey units are jointly owned by Westar Energy, Inc. (72%, of which 8% is a capital
lease), KGE (20%) and Kansas City Power and Light Co. (8%). Westar Energy, Inc. is the
operator. Fuel (account 501) is shared on a net generation basis with all other expenses
shared on an ownership basis.
Schedule Page: 403.1 Line No.: 1 Column: fThe Lawrence steam unit 3 was retired effective December 2015.
Name of Respondent
Westar Energy, Inc.
This Report is:(1) X An Original(2) A Resubmission
Date of Report(Mo, Da, Yr)
/ /
Year/Period of Report
2016/Q4
FOOTNOTE DATA
FERC FORM NO. 1 (ED. 12-87) Page 450.1
20170505-8016 FERC PDF (Unofficial) 04/07/2017
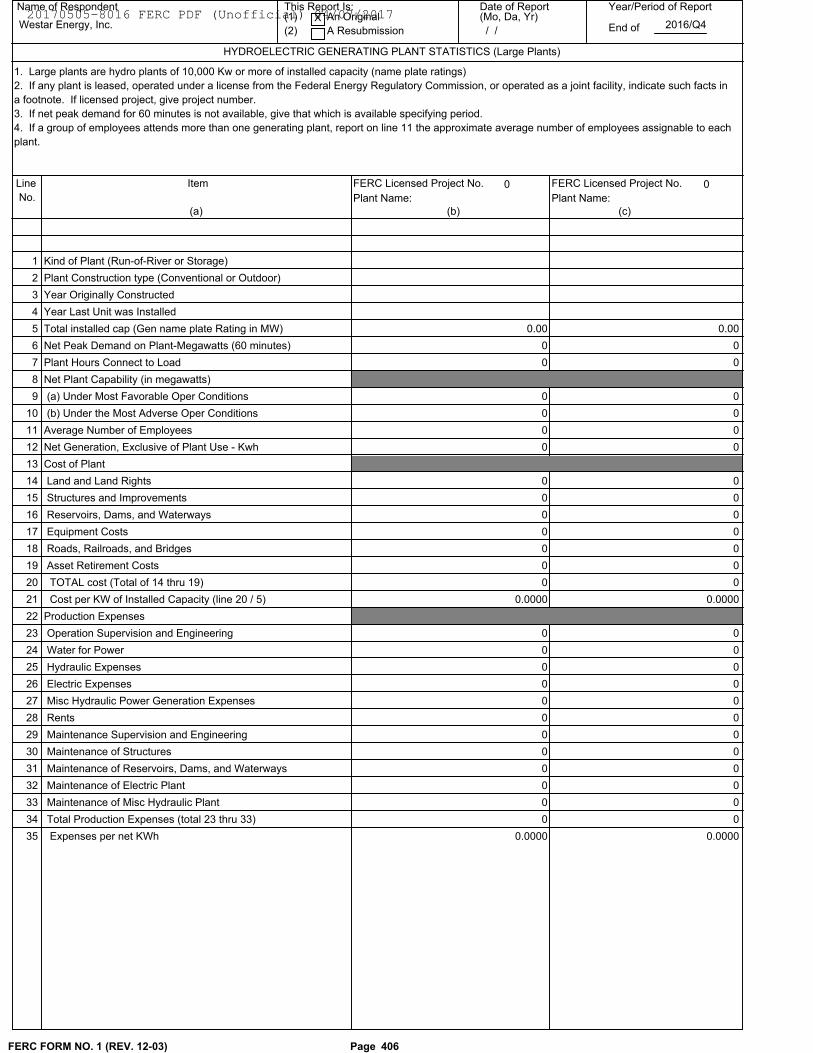
0 0
Name of Respondent This Report Is:(1) An Original
(2) A Resubmission
Date of Report(Mo, Da, Yr)
Year/Period of Report
End of
HYDROELECTRIC GENERATING PLANT STATISTICS (Large Plants)
Westar Energy, Inc.X
/ /2016/Q4
Line
No.
Item FERC Licensed Project No.
(b)(a) (c)
Plant Name:
FERC Licensed Project No.
Plant Name:
1. Large plants are hydro plants of 10,000 Kw or more of installed capacity (name plate ratings)
2. If any plant is leased, operated under a license from the Federal Energy Regulatory Commission, or operated as a joint facility, indicate such facts in
a footnote. If licensed project, give project number.
3. If net peak demand for 60 minutes is not available, give that which is available specifying period.
4. If a group of employees attends more than one generating plant, report on line 11 the approximate average number of employees assignable to each
plant.
Kind of Plant (Run-of-River or Storage) 1
Plant Construction type (Conventional or Outdoor) 2
Year Originally Constructed 3
Year Last Unit was Installed 4
Total installed cap (Gen name plate Rating in MW) 5 0.00 0.00
Net Peak Demand on Plant-Megawatts (60 minutes) 6 0 0
Plant Hours Connect to Load 7 0 0
Net Plant Capability (in megawatts) 8
(a) Under Most Favorable Oper Conditions 9 0 0
(b) Under the Most Adverse Oper Conditions 10 0 0
Average Number of Employees 11 0 0
Net Generation, Exclusive of Plant Use - Kwh 12 0 0
Cost of Plant 13
Land and Land Rights 14 0 0
Structures and Improvements 15 0 0
Reservoirs, Dams, and Waterways 16 0 0
Equipment Costs 17 0 0
Roads, Railroads, and Bridges 18 0 0
Asset Retirement Costs 19 0 0
TOTAL cost (Total of 14 thru 19) 20 0 0
Cost per KW of Installed Capacity (line 20 / 5) 21 0.0000 0.0000
Production Expenses 22
Operation Supervision and Engineering 23 0 0
Water for Power 24 0 0
Hydraulic Expenses 25 0 0
Electric Expenses 26 0 0
Misc Hydraulic Power Generation Expenses 27 0 0
Rents 28 0 0
Maintenance Supervision and Engineering 29 0 0
Maintenance of Structures 30 0 0
Maintenance of Reservoirs, Dams, and Waterways 31 0 0
Maintenance of Electric Plant 32 0 0
Maintenance of Misc Hydraulic Plant 33 0 0
Total Production Expenses (total 23 thru 33) 34 0 0
Expenses per net KWh 35 0.0000 0.0000
FERC FORM NO. 1 (REV. 12-03) Page 406
20170505-8016 FERC PDF (Unofficial) 04/07/2017
0 0 0
Name of Respondent This Report Is:(1) An Original
(2) A Resubmission
Date of Report(Mo, Da, Yr)
Year/Period of Report
End of
HYDROELECTRIC GENERATING PLANT STATISTICS (Large Plants) (Continued)
Westar Energy, Inc.X
/ /2016/Q4
FERC Licensed Project No.
(e)(d) (f)
Plant Name:
FERC Licensed Project No.
Plant Name:
FERC Licensed Project No.
Plant Name:
Line
No.
5. The items under Cost of Plant represent accounts or combinations of accounts prescribed by the Uniform System of Accounts. Production Expenses
do not include Purchased Power, System control and Load Dispatching, and Other Expenses classified as "Other Power Supply Expenses."
6. Report as a separate plant any plant equipped with combinations of steam, hydro, internal combustion engine, or gas turbine equipment.
1
2
3
4
0.00 0.000.00 5
0 00 6
0 00 7
8
0 00 9
0 00 10
0 00 11
0 00 12
13
0 00 14
0 00 15
0 00 16
0 00 17
0 00 18
0 00 19
0 00 20
0.0000 0.00000.0000 21
22
0 00 23
0 00 24
0 00 25
0 00 26
0 00 27
0 00 28
0 00 29
0 00 30
0 00 31
0 00 32
0 00 33
0 00 34
0.0000 0.00000.0000 35
FERC FORM NO. 1 (REV. 12-03) Page 407
20170505-8016 FERC PDF (Unofficial) 04/07/2017
FERC Licensed Project No.
Plant Name:
(b)
Name of Respondent This Report Is:(1) An Original
(2) A Resubmission
Date of Report(Mo, Da, Yr)
Year/Period of Report
End of
PUMPED STORAGE GENERATING PLANT STATISTICS (Large Plants)
Westar Energy, Inc.X
/ /2016/Q4
Line
No.
Item
(a)
1. Large plants and pumped storage plants of 10,000 Kw or more of installed capacity (name plate ratings)
2. If any plant is leased, operating under a license from the Federal Energy Regulatory Commission, or operated as a joint facility, indicate such facts in
a footnote. Give project number.
3. If net peak demand for 60 minutes is not available, give the which is available, specifying period.
4. If a group of employees attends more than one generating plant, report on line 8 the approximate average number of employees assignable to each
plant.
5. The items under Cost of Plant represent accounts or combinations of accounts prescribed by the Uniform System of Accounts. Production Expenses
do not include Purchased Power System Control and Load Dispatching, and Other Expenses classified as "Other Power Supply Expenses."
1 Type of Plant Construction (Conventional or Outdoor)
2 Year Originally Constructed
3 Year Last Unit was Installed
4 Total installed cap (Gen name plate Rating in MW)
5 Net Peak Demaind on Plant-Megawatts (60 minutes)
6 Plant Hours Connect to Load While Generating
7 Net Plant Capability (in megawatts)
8 Average Number of Employees
9 Generation, Exclusive of Plant Use - Kwh
10 Energy Used for Pumping
11 Net Output for Load (line 9 - line 10) - Kwh
12 Cost of Plant
13 Land and Land Rights
14 Structures and Improvements
15 Reservoirs, Dams, and Waterways
16 Water Wheels, Turbines, and Generators
17 Accessory Electric Equipment
18 Miscellaneous Powerplant Equipment
19 Roads, Railroads, and Bridges
20 Asset Retirement Costs
21 Total cost (total 13 thru 20)
22 Cost per KW of installed cap (line 21 / 4)
23 Production Expenses
24 Operation Supervision and Engineering
25 Water for Power
26 Pumped Storage Expenses
27 Electric Expenses
28 Misc Pumped Storage Power generation Expenses
29 Rents
30 Maintenance Supervision and Engineering
31 Maintenance of Structures
32 Maintenance of Reservoirs, Dams, and Waterways
33 Maintenance of Electric Plant
34 Maintenance of Misc Pumped Storage Plant
35 Production Exp Before Pumping Exp (24 thru 34)
36 Pumping Expenses
37 Total Production Exp (total 35 and 36)
38 Expenses per KWh (line 37 / 9)
FERC FORM NO. 1 (REV. 12-03) Page 408
20170505-8016 FERC PDF (Unofficial) 04/07/2017
FERC Licensed Project No.
Plant Name:
FERC Licensed Project No.
Plant Name:(d)
Name of Respondent This Report Is:(1) An Original
(2) A Resubmission
Date of Report(Mo, Da, Yr)
Year/Period of Report
End of
PUMPED STORAGE GENERATING PLANT STATISTICS (Large Plants) (Continued)
Westar Energy, Inc.X
/ /2016/Q4
Line
No.
FERC Licensed Project No.
Plant Name:
(e)(c)
6. Pumping energy (Line 10) is that energy measured as input to the plant for pumping purposes.
7. Include on Line 36 the cost of energy used in pumping into the storage reservoir. When this item cannot be accurately computed leave Lines 36, 37
and 38 blank and describe at the bottom of the schedule the company's principal sources of pumping power, the estimated amounts of energy from each
station or other source that individually provides more than 10 percent of the total energy used for pumping, and production expenses per net MWH as
reported herein for each source described. Group together stations and other resources which individually provide less than 10 percent of total pumping
energy. If contracts are made with others to purchase power for pumping, give the supplier contract number, and date of contract.
1
2
3
4
5
6
7
8
9
10
11
12
13
14
15
16
17
18
19
20
21
22
23
24
25
26
27
28
29
30
31
32
33
34
35
36
37
38
FERC FORM NO. 1 (REV. 12-03) Page 409
20170505-8016 FERC PDF (Unofficial) 04/07/2017
Name of Respondent This Report Is:(1) An Original
(2) A Resubmission
Date of Report(Mo, Da, Yr)
Year/Period of Report
End of
GENERATING PLANT STATISTICS (Small Plants)
Westar Energy, Inc.X
/ /2016/Q4
Line
No.Name of Plant
Installed Capacity
(c)(b)(a)
Cost of PlantNet PeakDemand
(d)
YearOrig.
Const.Name Plate Rating
(In MW) MW(60 min.)
Net GenerationExcludingPlant Use
(e) (f)
1. Small generating plants are steam plants of, less than 25,000 Kw; internal combustion and gas turbine-plants, conventional hydro plants and pumped
storage plants of less than 10,000 Kw installed capacity (name plate rating). 2. Designate any plant leased from others, operated under a license from
the Federal Energy Regulatory Commission, or operated as a joint facility, and give a concise statement of the facts in a footnote. If licensed project,
give project number in footnote.
1
2
3
4
5
6
7
8
9
10
11
12
13
14
15
16
17
18
19
20
21
22
23
24
25
26
27
28
29
30
31
32
33
34
35
36
37
38
39
40
41
42
43
44
45
46
FERC FORM NO. 1 (REV. 12-03) Page 410
20170505-8016 FERC PDF (Unofficial) 04/07/2017
Name of Respondent This Report Is:(1) An Original
(2) A Resubmission
Date of Report(Mo, Da, Yr)
Year/Period of Report
End of
GENERATING PLANT STATISTICS (Small Plants) (Continued)
Westar Energy, Inc.X
/ /2016/Q4
Line
No.(i)(h)(g) (j) (k) (l)
Operation
Exc'l. Fuel
Production Expenses
Fuel Maintenance Kind of FuelFuel Costs (in cents
(per Million Btu)
3. List plants appropriately under subheadings for steam, hydro, nuclear, internal combustion and gas turbine plants. For nuclear, see instruction 11,
Page 403. 4. If net peak demand for 60 minutes is not available, give the which is available, specifying period. 5. If any plant is equipped with
combinations of steam, hydro internal combustion or gas turbine equipment, report each as a separate plant. However, if the exhaust heat from the gas
turbine is utilized in a steam turbine regenerative feed water cycle, or for preheated combustion air in a boiler, report as one plant.
Plant Cost (Incl AssetRetire. Costs) Per MW
1
2
3
4
5
6
7
8
9
10
11
12
13
14
15
16
17
18
19
20
21
22
23
24
25
26
27
28
29
30
31
32
33
34
35
36
37
38
39
40
41
42
43
44
45
46
FERC FORM NO. 1 (REV. 12-03) Page 411
20170505-8016 FERC PDF (Unofficial) 04/07/2017
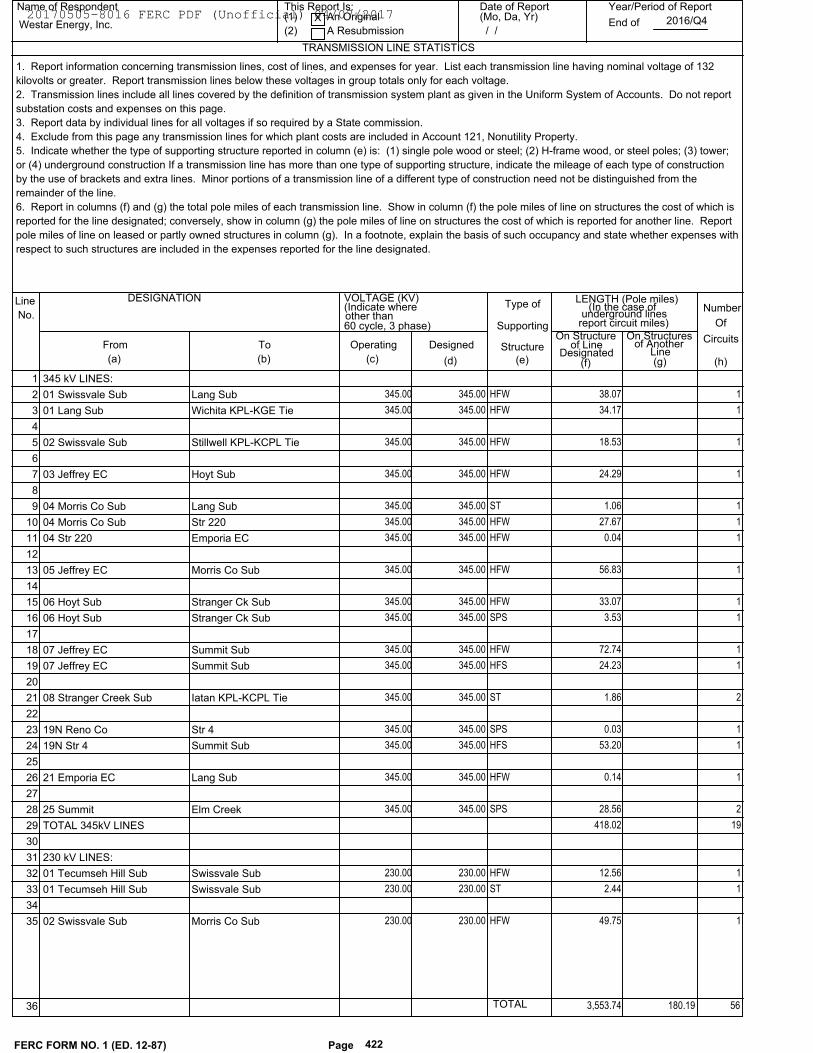
Name of Respondent This Report Is:(1) An Original
(2) A Resubmission
Date of Report(Mo, Da, Yr)
Year/Period of Report
End of
TRANSMISSION LINE STATISTICS
Westar Energy, Inc.X
/ /2016/Q4
Line
No.
(c)(b)(a) (d) (e)
DESIGNATION
From To
(f) (g)
VOLTAGE (KV)(Indicate whereother than60 cycle, 3 phase)
Operating Designed
Type of
Supporting
Structure
LENGTH (Pole miles)(In the case of
underground linesreport circuit miles)
On Structureof Line
Designated
On Structuresof Another
Line
Number
Of
Circuits
(h)
1. Report information concerning transmission lines, cost of lines, and expenses for year. List each transmission line having nominal voltage of 132
kilovolts or greater. Report transmission lines below these voltages in group totals only for each voltage.
2. Transmission lines include all lines covered by the definition of transmission system plant as given in the Uniform System of Accounts. Do not report
substation costs and expenses on this page.
3. Report data by individual lines for all voltages if so required by a State commission.
4. Exclude from this page any transmission lines for which plant costs are included in Account 121, Nonutility Property.
5. Indicate whether the type of supporting structure reported in column (e) is: (1) single pole wood or steel; (2) H-frame wood, or steel poles; (3) tower;
or (4) underground construction If a transmission line has more than one type of supporting structure, indicate the mileage of each type of construction
by the use of brackets and extra lines. Minor portions of a transmission line of a different type of construction need not be distinguished from the
remainder of the line.
6. Report in columns (f) and (g) the total pole miles of each transmission line. Show in column (f) the pole miles of line on structures the cost of which is
reported for the line designated; conversely, show in column (g) the pole miles of line on structures the cost of which is reported for another line. Report
pole miles of line on leased or partly owned structures in column (g). In a footnote, explain the basis of such occupancy and state whether expenses with
respect to such structures are included in the expenses reported for the line designated.
1 345 kV LINES:
HFW 345.00 345.00 38.07 1 2 01 Swissvale Sub Lang Sub
HFW 345.00 345.00 34.17 1 3 01 Lang Sub Wichita KPL-KGE Tie
4
HFW 345.00 345.00 18.53 1 5 02 Swissvale Sub Stillwell KPL-KCPL Tie
6
HFW 345.00 345.00 24.29 1 7 03 Jeffrey EC Hoyt Sub
8
ST 345.00 345.00 1.06 1 9 04 Morris Co Sub Lang Sub
HFW 345.00 345.00 27.67 1 10 04 Morris Co Sub Str 220
HFW 345.00 345.00 0.04 1 11 04 Str 220 Emporia EC
12
HFW 345.00 345.00 56.83 1 13 05 Jeffrey EC Morris Co Sub
14
HFW 345.00 345.00 33.07 1 15 06 Hoyt Sub Stranger Ck Sub
SPS 345.00 345.00 3.53 1 16 06 Hoyt Sub Stranger Ck Sub
17
HFW 345.00 345.00 72.74 1 18 07 Jeffrey EC Summit Sub
HFS 345.00 345.00 24.23 1 19 07 Jeffrey EC Summit Sub
20
ST 345.00 345.00 1.86 2 21 08 Stranger Creek Sub Iatan KPL-KCPL Tie
22
SPS 345.00 345.00 0.03 1 23 19N Reno Co Str 4
HFS 345.00 345.00 53.20 1 24 19N Str 4 Summit Sub
25
HFW 345.00 345.00 0.14 1 26 21 Emporia EC Lang Sub
27
SPS 345.00 345.00 28.56 2 28 25 Summit Elm Creek
418.02 19 29 TOTAL 345kV LINES
30
31 230 kV LINES:
HFW 230.00 230.00 12.56 1 32 01 Tecumseh Hill Sub Swissvale Sub
ST 230.00 230.00 2.44 1 33 01 Tecumseh Hill Sub Swissvale Sub
34
HFW 230.00 230.00 49.75 1 35 02 Swissvale Sub Morris Co Sub
FERC FORM NO. 1 (ED. 12-87) Page 422
36 TOTAL 3,553.74 180.19 56
20170505-8016 FERC PDF (Unofficial) 04/07/2017
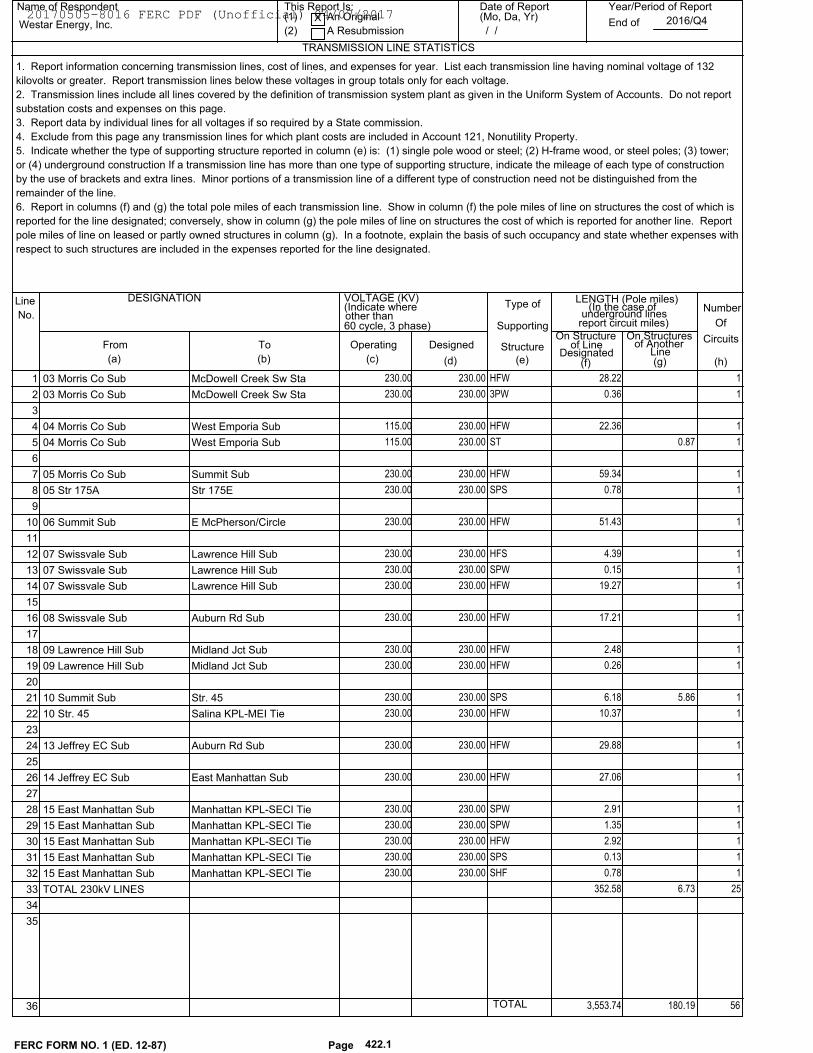
Name of Respondent This Report Is:(1) An Original
(2) A Resubmission
Date of Report(Mo, Da, Yr)
Year/Period of Report
End of
TRANSMISSION LINE STATISTICS
Westar Energy, Inc.X
/ /2016/Q4
Line
No.
(c)(b)(a) (d) (e)
DESIGNATION
From To
(f) (g)
VOLTAGE (KV)(Indicate whereother than60 cycle, 3 phase)
Operating Designed
Type of
Supporting
Structure
LENGTH (Pole miles)(In the case of
underground linesreport circuit miles)
On Structureof Line
Designated
On Structuresof Another
Line
Number
Of
Circuits
(h)
1. Report information concerning transmission lines, cost of lines, and expenses for year. List each transmission line having nominal voltage of 132
kilovolts or greater. Report transmission lines below these voltages in group totals only for each voltage.
2. Transmission lines include all lines covered by the definition of transmission system plant as given in the Uniform System of Accounts. Do not report
substation costs and expenses on this page.
3. Report data by individual lines for all voltages if so required by a State commission.
4. Exclude from this page any transmission lines for which plant costs are included in Account 121, Nonutility Property.
5. Indicate whether the type of supporting structure reported in column (e) is: (1) single pole wood or steel; (2) H-frame wood, or steel poles; (3) tower;
or (4) underground construction If a transmission line has more than one type of supporting structure, indicate the mileage of each type of construction
by the use of brackets and extra lines. Minor portions of a transmission line of a different type of construction need not be distinguished from the
remainder of the line.
6. Report in columns (f) and (g) the total pole miles of each transmission line. Show in column (f) the pole miles of line on structures the cost of which is
reported for the line designated; conversely, show in column (g) the pole miles of line on structures the cost of which is reported for another line. Report
pole miles of line on leased or partly owned structures in column (g). In a footnote, explain the basis of such occupancy and state whether expenses with
respect to such structures are included in the expenses reported for the line designated.
HFW 230.00 230.00 28.22 1 1 03 Morris Co Sub McDowell Creek Sw Sta
3PW 230.00 230.00 0.36 1 2 03 Morris Co Sub McDowell Creek Sw Sta
3
HFW 230.00 115.00 22.36 1 4 04 Morris Co Sub West Emporia Sub
ST 230.00 115.00 0.87 1 5 04 Morris Co Sub West Emporia Sub
6
HFW 230.00 230.00 59.34 1 7 05 Morris Co Sub Summit Sub
SPS 230.00 230.00 0.78 1 8 05 Str 175A Str 175E
9
HFW 230.00 230.00 51.43 1 10 06 Summit Sub E McPherson/Circle
11
HFS 230.00 230.00 4.39 1 12 07 Swissvale Sub Lawrence Hill Sub
SPW 230.00 230.00 0.15 1 13 07 Swissvale Sub Lawrence Hill Sub
HFW 230.00 230.00 19.27 1 14 07 Swissvale Sub Lawrence Hill Sub
15
HFW 230.00 230.00 17.21 1 16 08 Swissvale Sub Auburn Rd Sub
17
HFW 230.00 230.00 2.48 1 18 09 Lawrence Hill Sub Midland Jct Sub
HFW 230.00 230.00 0.26 1 19 09 Lawrence Hill Sub Midland Jct Sub
20
SPS 230.00 230.00 5.86 6.18 1 21 10 Summit Sub Str. 45
HFW 230.00 230.00 10.37 1 22 10 Str. 45 Salina KPL-MEI Tie
23
HFW 230.00 230.00 29.88 1 24 13 Jeffrey EC Sub Auburn Rd Sub
25
HFW 230.00 230.00 27.06 1 26 14 Jeffrey EC Sub East Manhattan Sub
27
SPW 230.00 230.00 2.91 1 28 15 East Manhattan Sub Manhattan KPL-SECI Tie
SPW 230.00 230.00 1.35 1 29 15 East Manhattan Sub Manhattan KPL-SECI Tie
HFW 230.00 230.00 2.92 1 30 15 East Manhattan Sub Manhattan KPL-SECI Tie
SPS 230.00 230.00 0.13 1 31 15 East Manhattan Sub Manhattan KPL-SECI Tie
SHF 230.00 230.00 0.78 1 32 15 East Manhattan Sub Manhattan KPL-SECI Tie
6.73 352.58 25 33 TOTAL 230kV LINES
34
35
FERC FORM NO. 1 (ED. 12-87) Page 422.1
36 TOTAL 3,553.74 180.19 56
20170505-8016 FERC PDF (Unofficial) 04/07/2017
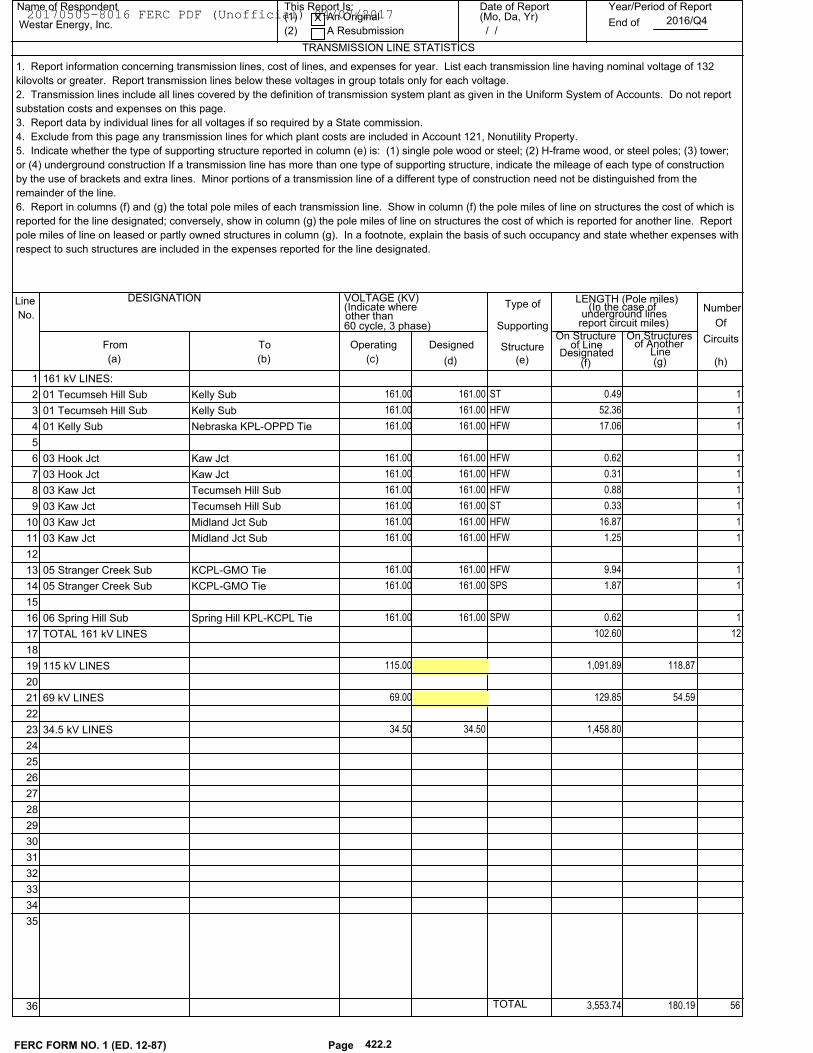
Name of Respondent This Report Is:(1) An Original
(2) A Resubmission
Date of Report(Mo, Da, Yr)
Year/Period of Report
End of
TRANSMISSION LINE STATISTICS
Westar Energy, Inc.X
/ /2016/Q4
Line
No.
(c)(b)(a) (d) (e)
DESIGNATION
From To
(f) (g)
VOLTAGE (KV)(Indicate whereother than60 cycle, 3 phase)
Operating Designed
Type of
Supporting
Structure
LENGTH (Pole miles)(In the case of
underground linesreport circuit miles)
On Structureof Line
Designated
On Structuresof Another
Line
Number
Of
Circuits
(h)
1. Report information concerning transmission lines, cost of lines, and expenses for year. List each transmission line having nominal voltage of 132
kilovolts or greater. Report transmission lines below these voltages in group totals only for each voltage.
2. Transmission lines include all lines covered by the definition of transmission system plant as given in the Uniform System of Accounts. Do not report
substation costs and expenses on this page.
3. Report data by individual lines for all voltages if so required by a State commission.
4. Exclude from this page any transmission lines for which plant costs are included in Account 121, Nonutility Property.
5. Indicate whether the type of supporting structure reported in column (e) is: (1) single pole wood or steel; (2) H-frame wood, or steel poles; (3) tower;
or (4) underground construction If a transmission line has more than one type of supporting structure, indicate the mileage of each type of construction
by the use of brackets and extra lines. Minor portions of a transmission line of a different type of construction need not be distinguished from the
remainder of the line.
6. Report in columns (f) and (g) the total pole miles of each transmission line. Show in column (f) the pole miles of line on structures the cost of which is
reported for the line designated; conversely, show in column (g) the pole miles of line on structures the cost of which is reported for another line. Report
pole miles of line on leased or partly owned structures in column (g). In a footnote, explain the basis of such occupancy and state whether expenses with
respect to such structures are included in the expenses reported for the line designated.
1 161 kV LINES:
ST 161.00 161.00 0.49 1 2 01 Tecumseh Hill Sub Kelly Sub
HFW 161.00 161.00 52.36 1 3 01 Tecumseh Hill Sub Kelly Sub
HFW 161.00 161.00 17.06 1 4 01 Kelly Sub Nebraska KPL-OPPD Tie
5
HFW 161.00 161.00 0.62 1 6 03 Hook Jct Kaw Jct
HFW 161.00 161.00 0.31 1 7 03 Hook Jct Kaw Jct
HFW 161.00 161.00 0.88 1 8 03 Kaw Jct Tecumseh Hill Sub
ST 161.00 161.00 0.33 1 9 03 Kaw Jct Tecumseh Hill Sub
HFW 161.00 161.00 16.87 1 10 03 Kaw Jct Midland Jct Sub
HFW 161.00 161.00 1.25 1 11 03 Kaw Jct Midland Jct Sub
12
HFW 161.00 161.00 9.94 1 13 05 Stranger Creek Sub KCPL-GMO Tie
SPS 161.00 161.00 1.87 1 14 05 Stranger Creek Sub KCPL-GMO Tie
15
SPW 161.00 161.00 0.62 1 16 06 Spring Hill Sub Spring Hill KPL-KCPL Tie
102.60 12 17 TOTAL 161 kV LINES
18
115.00 118.87 1,091.89 19 115 kV LINES
20
69.00 54.59 129.85 21 69 kV LINES
22
34.50 34.50 1,458.80 23 34.5 kV LINES
24
25
26
27
28
29
30
31
32
33
34
35
FERC FORM NO. 1 (ED. 12-87) Page 422.2
36 TOTAL 3,553.74 180.19 56
20170505-8016 FERC PDF (Unofficial) 04/07/2017
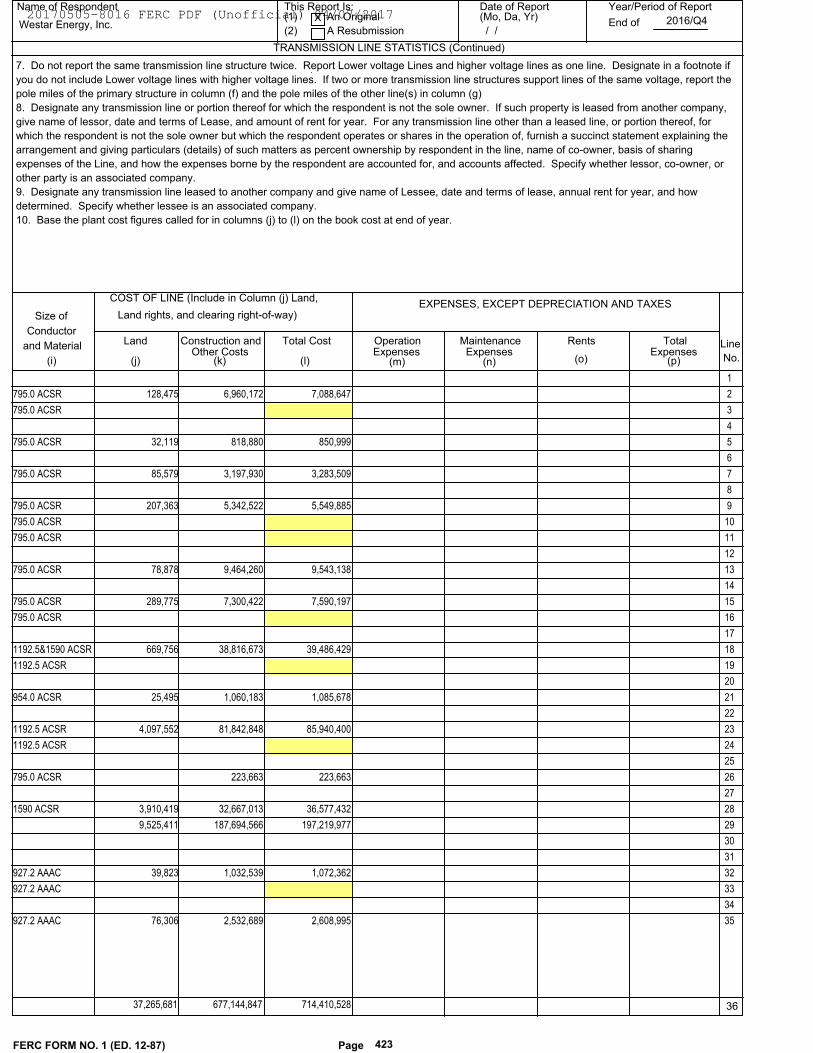
Name of Respondent This Report Is:(1) An Original
(2) A Resubmission
Date of Report(Mo, Da, Yr)
Year/Period of Report
End of
TRANSMISSION LINE STATISTICS (Continued)
Westar Energy, Inc.X
/ /2016/Q4
Line
No.
COST OF LINE (Include in Column (j) Land,
Size of
Conductor
and Material
Land rights, and clearing right-of-way)EXPENSES, EXCEPT DEPRECIATION AND TAXES
OperationExpenses
Maintenance Rents TotalLand Construction andOther Costs
Total Cost
(i) (j) (k) (l) (m) (n) (o) (p)Expenses Expenses
7. Do not report the same transmission line structure twice. Report Lower voltage Lines and higher voltage lines as one line. Designate in a footnote if
you do not include Lower voltage lines with higher voltage lines. If two or more transmission line structures support lines of the same voltage, report the
pole miles of the primary structure in column (f) and the pole miles of the other line(s) in column (g)
8. Designate any transmission line or portion thereof for which the respondent is not the sole owner. If such property is leased from another company,
give name of lessor, date and terms of Lease, and amount of rent for year. For any transmission line other than a leased line, or portion thereof, for
which the respondent is not the sole owner but which the respondent operates or shares in the operation of, furnish a succinct statement explaining the
arrangement and giving particulars (details) of such matters as percent ownership by respondent in the line, name of co-owner, basis of sharing
expenses of the Line, and how the expenses borne by the respondent are accounted for, and accounts affected. Specify whether lessor, co-owner, or
other party is an associated company.
9. Designate any transmission line leased to another company and give name of Lessee, date and terms of lease, annual rent for year, and how
determined. Specify whether lessee is an associated company.
10. Base the plant cost figures called for in columns (j) to (l) on the book cost at end of year.
1
7,088,647795.0 ACSR 6,960,172 128,475 2
795.0 ACSR 3
4
850,999795.0 ACSR 818,880 32,119 5
6
3,283,509795.0 ACSR 3,197,930 85,579 7
8
5,549,885795.0 ACSR 5,342,522 207,363 9
795.0 ACSR 10
795.0 ACSR 11
12
9,543,138795.0 ACSR 9,464,260 78,878 13
14
7,590,197795.0 ACSR 7,300,422 289,775 15
795.0 ACSR 16
17
39,486,4291192.5&1590 ACSR 38,816,673 669,756 18
1192.5 ACSR 19
20
1,085,678954.0 ACSR 1,060,183 25,495 21
22
85,940,4001192.5 ACSR 81,842,848 4,097,552 23
1192.5 ACSR 24
25
223,663795.0 ACSR 223,663 26
27
36,577,4321590 ACSR 32,667,013 3,910,419 28
197,219,977 187,694,566 9,525,411 29
30
31
1,072,362927.2 AAAC 1,032,539 39,823 32
927.2 AAAC 33
34
2,608,995927.2 AAAC 2,532,689 76,306 35
FERC FORM NO. 1 (ED. 12-87) Page 423
36 37,265,681 677,144,847 714,410,528
20170505-8016 FERC PDF (Unofficial) 04/07/2017
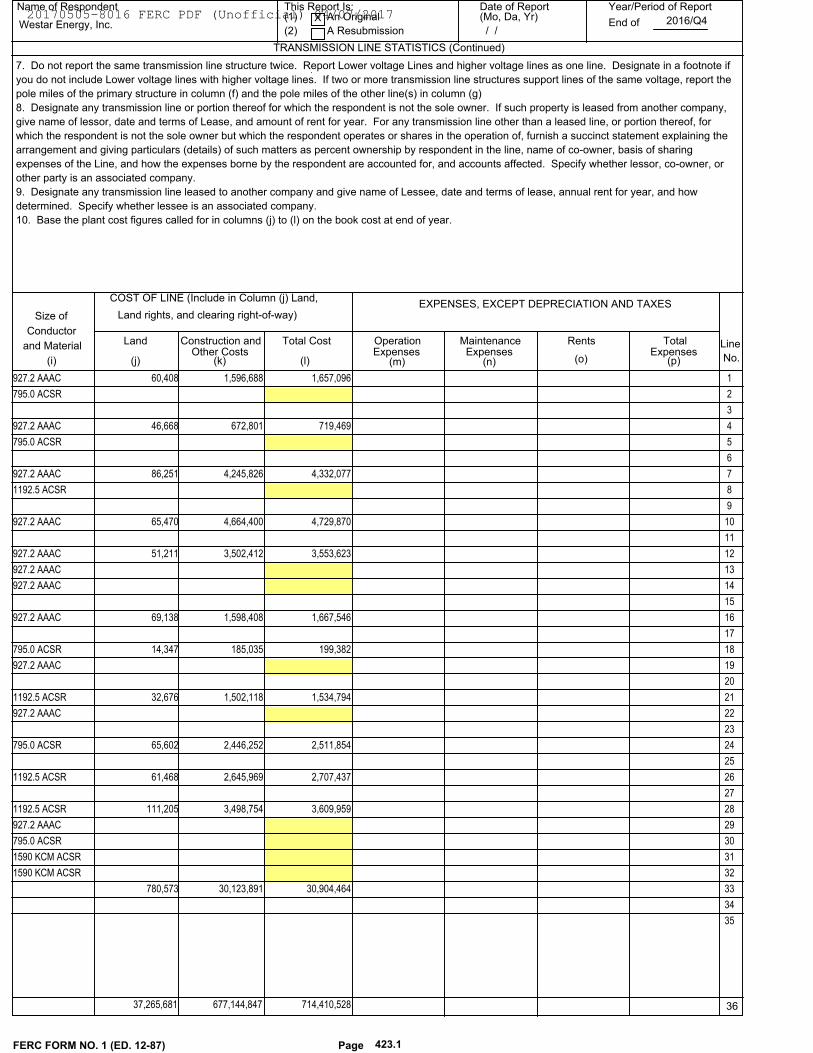
Name of Respondent This Report Is:(1) An Original
(2) A Resubmission
Date of Report(Mo, Da, Yr)
Year/Period of Report
End of
TRANSMISSION LINE STATISTICS (Continued)
Westar Energy, Inc.X
/ /2016/Q4
Line
No.
COST OF LINE (Include in Column (j) Land,
Size of
Conductor
and Material
Land rights, and clearing right-of-way)EXPENSES, EXCEPT DEPRECIATION AND TAXES
OperationExpenses
Maintenance Rents TotalLand Construction andOther Costs
Total Cost
(i) (j) (k) (l) (m) (n) (o) (p)Expenses Expenses
7. Do not report the same transmission line structure twice. Report Lower voltage Lines and higher voltage lines as one line. Designate in a footnote if
you do not include Lower voltage lines with higher voltage lines. If two or more transmission line structures support lines of the same voltage, report the
pole miles of the primary structure in column (f) and the pole miles of the other line(s) in column (g)
8. Designate any transmission line or portion thereof for which the respondent is not the sole owner. If such property is leased from another company,
give name of lessor, date and terms of Lease, and amount of rent for year. For any transmission line other than a leased line, or portion thereof, for
which the respondent is not the sole owner but which the respondent operates or shares in the operation of, furnish a succinct statement explaining the
arrangement and giving particulars (details) of such matters as percent ownership by respondent in the line, name of co-owner, basis of sharing
expenses of the Line, and how the expenses borne by the respondent are accounted for, and accounts affected. Specify whether lessor, co-owner, or
other party is an associated company.
9. Designate any transmission line leased to another company and give name of Lessee, date and terms of lease, annual rent for year, and how
determined. Specify whether lessee is an associated company.
10. Base the plant cost figures called for in columns (j) to (l) on the book cost at end of year.
1,657,096927.2 AAAC 1,596,688 60,408 1
795.0 ACSR 2
3
719,469927.2 AAAC 672,801 46,668 4
795.0 ACSR 5
6
4,332,077927.2 AAAC 4,245,826 86,251 7
1192.5 ACSR 8
9
4,729,870927.2 AAAC 4,664,400 65,470 10
11
3,553,623927.2 AAAC 3,502,412 51,211 12
927.2 AAAC 13
927.2 AAAC 14
15
1,667,546927.2 AAAC 1,598,408 69,138 16
17
199,382795.0 ACSR 185,035 14,347 18
927.2 AAAC 19
20
1,534,7941192.5 ACSR 1,502,118 32,676 21
927.2 AAAC 22
23
2,511,854795.0 ACSR 2,446,252 65,602 24
25
2,707,4371192.5 ACSR 2,645,969 61,468 26
27
3,609,9591192.5 ACSR 3,498,754 111,205 28
927.2 AAAC 29
795.0 ACSR 30
1590 KCM ACSR 31
1590 KCM ACSR 32
30,904,464 30,123,891 780,573 33
34
35
FERC FORM NO. 1 (ED. 12-87) Page 423.1
36 37,265,681 677,144,847 714,410,528
20170505-8016 FERC PDF (Unofficial) 04/07/2017
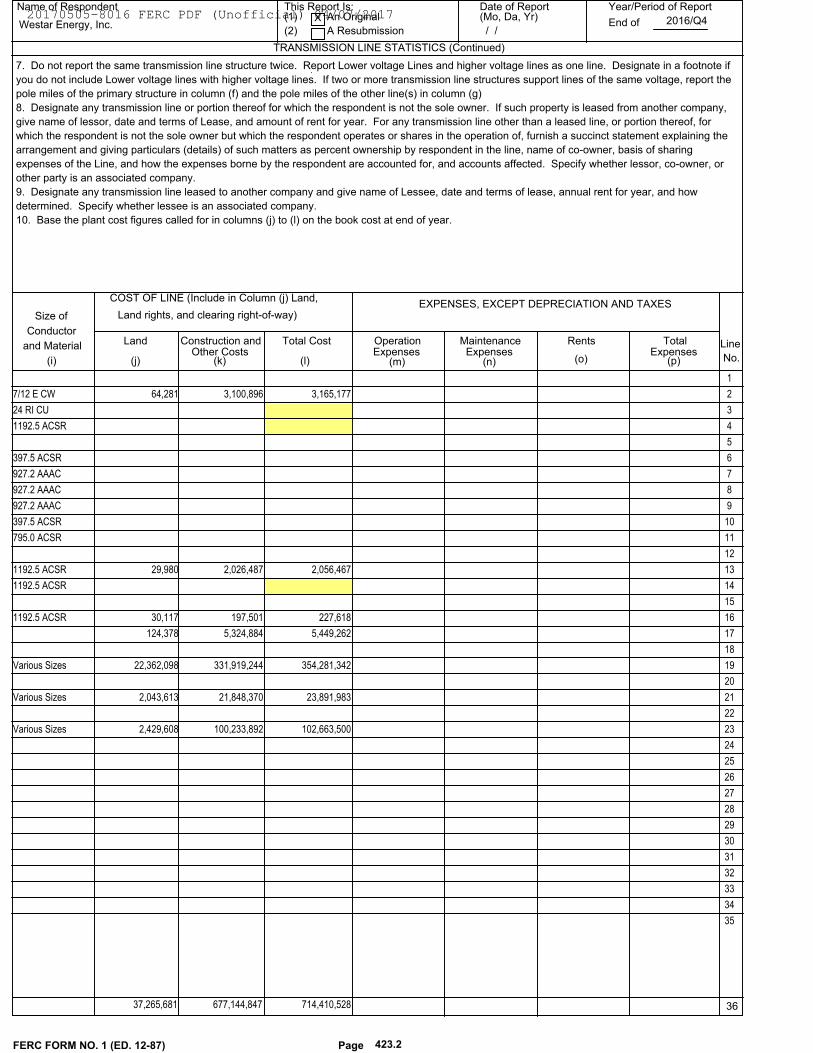
Name of Respondent This Report Is:(1) An Original
(2) A Resubmission
Date of Report(Mo, Da, Yr)
Year/Period of Report
End of
TRANSMISSION LINE STATISTICS (Continued)
Westar Energy, Inc.X
/ /2016/Q4
Line
No.
COST OF LINE (Include in Column (j) Land,
Size of
Conductor
and Material
Land rights, and clearing right-of-way)EXPENSES, EXCEPT DEPRECIATION AND TAXES
OperationExpenses
Maintenance Rents TotalLand Construction andOther Costs
Total Cost
(i) (j) (k) (l) (m) (n) (o) (p)Expenses Expenses
7. Do not report the same transmission line structure twice. Report Lower voltage Lines and higher voltage lines as one line. Designate in a footnote if
you do not include Lower voltage lines with higher voltage lines. If two or more transmission line structures support lines of the same voltage, report the
pole miles of the primary structure in column (f) and the pole miles of the other line(s) in column (g)
8. Designate any transmission line or portion thereof for which the respondent is not the sole owner. If such property is leased from another company,
give name of lessor, date and terms of Lease, and amount of rent for year. For any transmission line other than a leased line, or portion thereof, for
which the respondent is not the sole owner but which the respondent operates or shares in the operation of, furnish a succinct statement explaining the
arrangement and giving particulars (details) of such matters as percent ownership by respondent in the line, name of co-owner, basis of sharing
expenses of the Line, and how the expenses borne by the respondent are accounted for, and accounts affected. Specify whether lessor, co-owner, or
other party is an associated company.
9. Designate any transmission line leased to another company and give name of Lessee, date and terms of lease, annual rent for year, and how
determined. Specify whether lessee is an associated company.
10. Base the plant cost figures called for in columns (j) to (l) on the book cost at end of year.
1
3,165,1777/12 E CW 3,100,896 64,281 2
24 RI CU 3
1192.5 ACSR 4
5
397.5 ACSR 6
927.2 AAAC 7
927.2 AAAC 8
927.2 AAAC 9
397.5 ACSR 10
795.0 ACSR 11
12
2,056,4671192.5 ACSR 2,026,487 29,980 13
1192.5 ACSR 14
15
227,6181192.5 ACSR 197,501 30,117 16
5,449,262 5,324,884 124,378 17
18
354,281,342Various Sizes 331,919,244 22,362,098 19
20
23,891,983Various Sizes 21,848,370 2,043,613 21
22
102,663,500Various Sizes 100,233,892 2,429,608 23
24
25
26
27
28
29
30
31
32
33
34
35
FERC FORM NO. 1 (ED. 12-87) Page 423.2
36 37,265,681 677,144,847 714,410,528
20170505-8016 FERC PDF (Unofficial) 04/07/2017
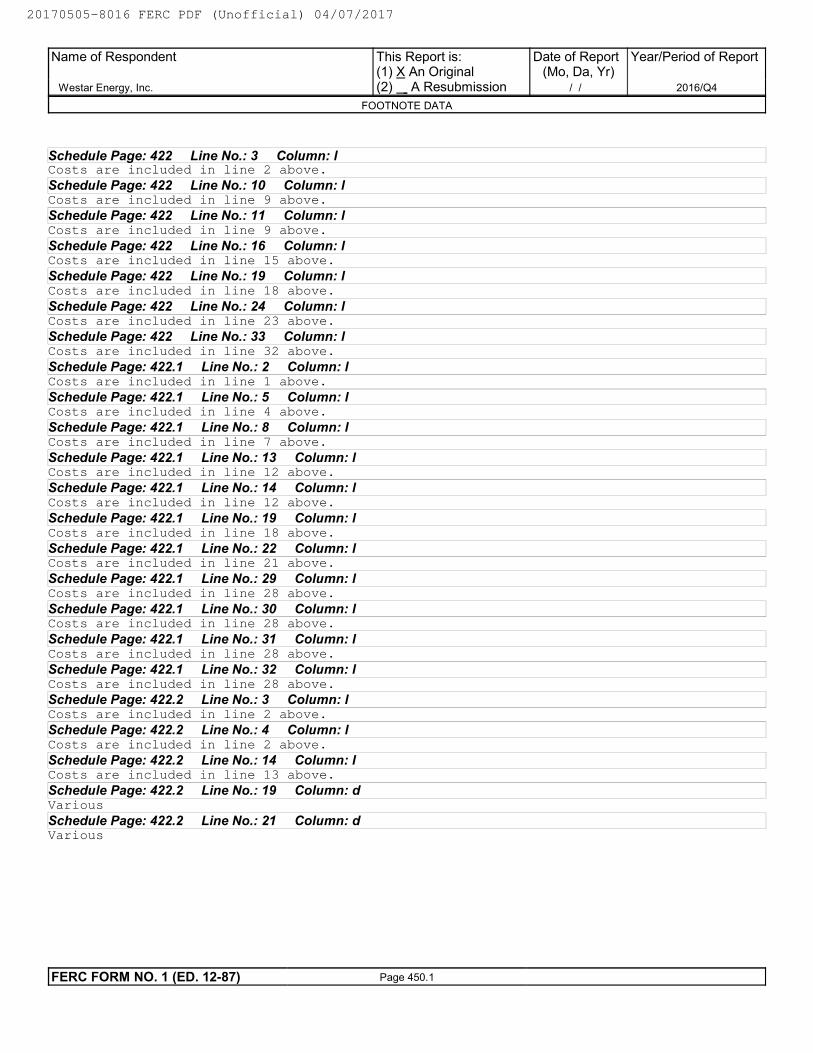
Schedule Page: 422 Line No.: 3 Column: lCosts are included in line 2 above.
Schedule Page: 422 Line No.: 10 Column: lCosts are included in line 9 above.
Schedule Page: 422 Line No.: 11 Column: lCosts are included in line 9 above.
Schedule Page: 422 Line No.: 16 Column: lCosts are included in line 15 above.
Schedule Page: 422 Line No.: 19 Column: lCosts are included in line 18 above.
Schedule Page: 422 Line No.: 24 Column: lCosts are included in line 23 above.
Schedule Page: 422 Line No.: 33 Column: lCosts are included in line 32 above.
Schedule Page: 422.1 Line No.: 2 Column: lCosts are included in line 1 above.
Schedule Page: 422.1 Line No.: 5 Column: lCosts are included in line 4 above.
Schedule Page: 422.1 Line No.: 8 Column: lCosts are included in line 7 above.
Schedule Page: 422.1 Line No.: 13 Column: lCosts are included in line 12 above.
Schedule Page: 422.1 Line No.: 14 Column: lCosts are included in line 12 above.
Schedule Page: 422.1 Line No.: 19 Column: lCosts are included in line 18 above.
Schedule Page: 422.1 Line No.: 22 Column: lCosts are included in line 21 above.
Schedule Page: 422.1 Line No.: 29 Column: lCosts are included in line 28 above.
Schedule Page: 422.1 Line No.: 30 Column: lCosts are included in line 28 above.
Schedule Page: 422.1 Line No.: 31 Column: lCosts are included in line 28 above.
Schedule Page: 422.1 Line No.: 32 Column: lCosts are included in line 28 above.
Schedule Page: 422.2 Line No.: 3 Column: lCosts are included in line 2 above.
Schedule Page: 422.2 Line No.: 4 Column: lCosts are included in line 2 above.
Schedule Page: 422.2 Line No.: 14 Column: lCosts are included in line 13 above.
Schedule Page: 422.2 Line No.: 19 Column: dVarious
Schedule Page: 422.2 Line No.: 21 Column: dVarious
Name of Respondent
Westar Energy, Inc.
This Report is:(1) X An Original(2) A Resubmission
Date of Report(Mo, Da, Yr)
/ /
Year/Period of Report
2016/Q4
FOOTNOTE DATA
FERC FORM NO. 1 (ED. 12-87) Page 450.1
20170505-8016 FERC PDF (Unofficial) 04/07/2017
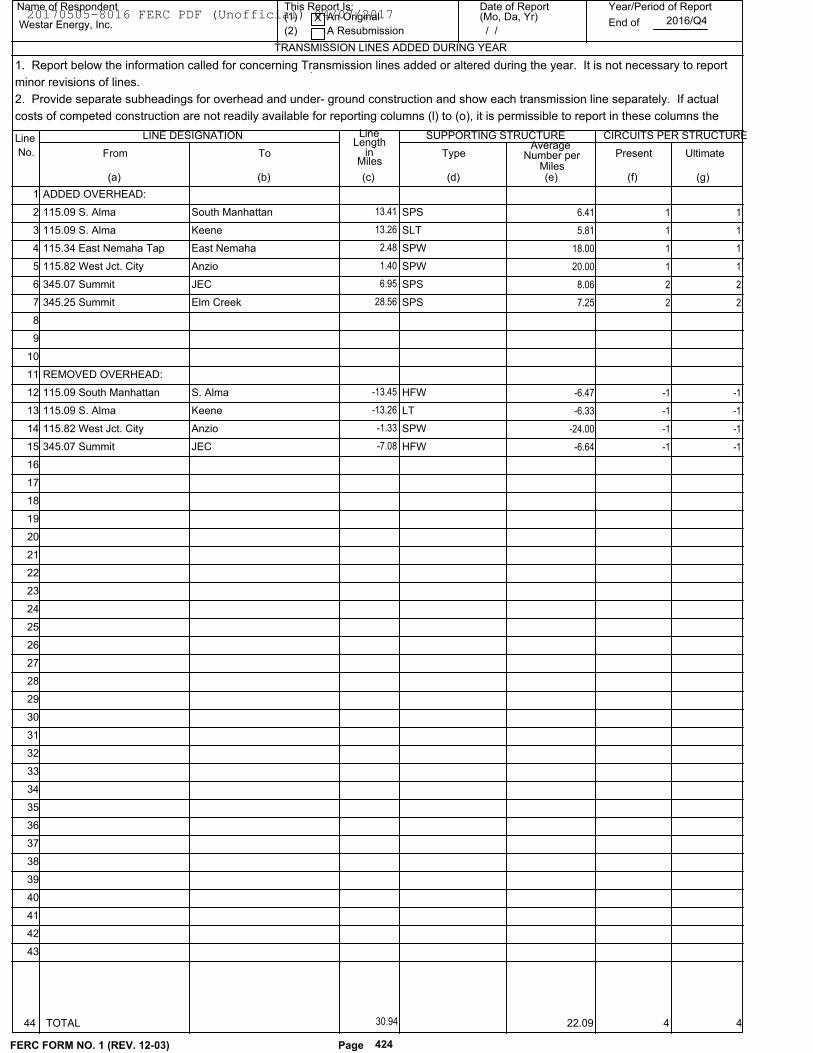
Name of Respondent This Report Is:(1) An Original
(2) A Resubmission
Date of Report(Mo, Da, Yr)
Year/Period of Report
End of
TRANSMISSION LINES ADDED DURING YEAR
Westar Energy, Inc.X
/ /2016/Q4
Line
No.
(c)(b)(a) (d) (e)
LINE DESIGNATION
From To
LineLength
inMiles
SUPPORTING STRUCTURE
TypeAverage
Number perMiles
CIRCUITS PER STRUCTURE
Present Ultimate
(f) (g)
1. Report below the information called for concerning Transmission lines added or altered during the year. It is not necessary to report
minor revisions of lines.
2. Provide separate subheadings for overhead and under- ground construction and show each transmission line separately. If actual
costs of competed construction are not readily available for reporting columns (l) to (o), it is permissible to report in these columns the
1 ADDED OVERHEAD:
6.41SPS 1 1 2 115.09 S. Alma South Manhattan 13.41
5.81SLT 1 1 3 115.09 S. Alma Keene 13.26
18.00SPW 1 1 4 115.34 East Nemaha Tap East Nemaha 2.48
20.00SPW 1 1 5 115.82 West Jct. City Anzio 1.40
8.06SPS 2 2 6 345.07 Summit JEC 6.95
7.25SPS 2 2 7 345.25 Summit Elm Creek 28.56
8
9
10
11 REMOVED OVERHEAD:
-6.47HFW -1 -1 12 115.09 South Manhattan S. Alma -13.45
-6.33LT -1 -1 13 115.09 S. Alma Keene -13.26
-24.00SPW -1 -1 14 115.82 West Jct. City Anzio -1.33
-6.64HFW -1 -1 15 345.07 Summit JEC -7.08
16
17
18
19
20
21
22
23
24
25
26
27
28
29
30
31
32
33
34
35
36
37
38
39
40
41
42
43
30.94 22.09 4 4
FERC FORM NO. 1 (REV. 12-03) Page 424
44 TOTAL
20170505-8016 FERC PDF (Unofficial) 04/07/2017
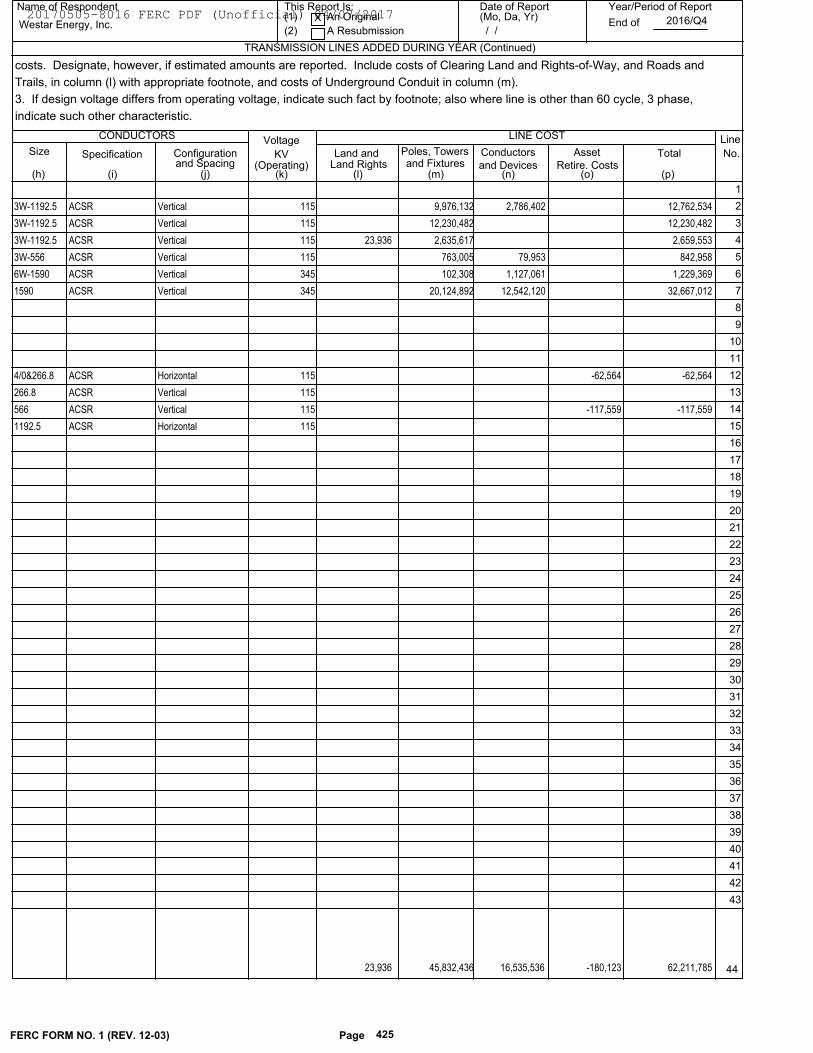
Total
Name of Respondent This Report Is:(1) An Original
(2) A Resubmission
Date of Report(Mo, Da, Yr)
Year/Period of Report
End of
TRANSMISSION LINES ADDED DURING YEAR (Continued)
Westar Energy, Inc.X
/ /2016/Q4
Line
No.
(k)(j)(h) (l) (m)
CONDUCTORS
Size Configuration
Voltage
KV
LINE COST
Land and Poles, Towersand Fixtures
Conductors
(n) (p)
Specificationand Spacing (Operating) Land Rights and Devices
(i)
costs. Designate, however, if estimated amounts are reported. Include costs of Clearing Land and Rights-of-Way, and Roads and
Trails, in column (l) with appropriate footnote, and costs of Underground Conduit in column (m).
3. If design voltage differs from operating voltage, indicate such fact by footnote; also where line is other than 60 cycle, 3 phase,
indicate such other characteristic.
Asset
(o)Retire. Costs
1
VerticalACSR3W-1192.5 2,786,402 12,762,534 9,976,132 115 2
VerticalACSR3W-1192.5 12,230,482 12,230,482 115 3
VerticalACSR3W-1192.5 2,659,553 2,635,617 23,936 115 4
VerticalACSR3W-556 79,953 842,958 763,005 115 5
VerticalACSR6W-1590 1,127,061 1,229,369 102,308 345 6
VerticalACSR1590 12,542,120 32,667,012 20,124,892 345 7
8
9
10
11
-62,564HorizontalACSR4/0&266.8 -62,564 115 12
VerticalACSR266.8 115 13
-117,559VerticalACSR566 -117,559 115 14
HorizontalACSR1192.5 115 15
16
17
18
19
20
21
22
23
24
25
26
27
28
29
30
31
32
33
34
35
36
37
38
39
40
41
42
43
-180,123 16,535,536 45,832,436
FERC FORM NO. 1 (REV. 12-03) Page 425
44 23,936 62,211,785
20170505-8016 FERC PDF (Unofficial) 04/07/2017
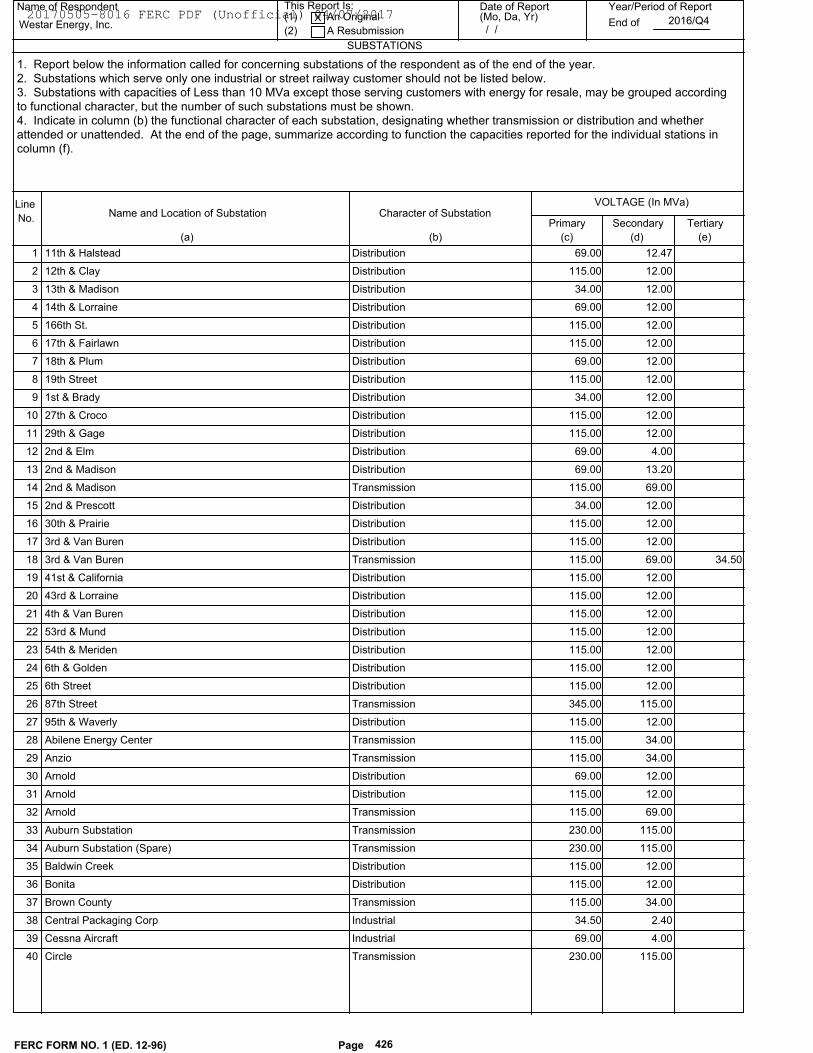
Name of Respondent This Report Is:(1) An Original
(2) A Resubmission
Date of Report(Mo, Da, Yr)
Year/Period of Report
End of
SUBSTATIONS
Westar Energy, Inc.X
/ /2016/Q4
Line
No.Name and Location of Substation
Primary
(c)(b)(a)
Tertiary
(d)
Character of Substation
(e)
Secondary
VOLTAGE (In MVa)
1. Report below the information called for concerning substations of the respondent as of the end of the year.
2. Substations which serve only one industrial or street railway customer should not be listed below.
3. Substations with capacities of Less than 10 MVa except those serving customers with energy for resale, may be grouped according
to functional character, but the number of such substations must be shown.
4. Indicate in column (b) the functional character of each substation, designating whether transmission or distribution and whether
attended or unattended. At the end of the page, summarize according to function the capacities reported for the individual stations in
column (f).
11th & Halstead 12.47 69.00Distribution 1
12th & Clay 12.00 115.00Distribution 2
13th & Madison 12.00 34.00Distribution 3
14th & Lorraine 12.00 69.00Distribution 4
166th St. 12.00 115.00Distribution 5
17th & Fairlawn 12.00 115.00Distribution 6
18th & Plum 12.00 69.00Distribution 7
19th Street 12.00 115.00Distribution 8
1st & Brady 12.00 34.00Distribution 9
27th & Croco 12.00 115.00Distribution 10
29th & Gage 12.00 115.00Distribution 11
2nd & Elm 4.00 69.00Distribution 12
2nd & Madison 13.20 69.00Distribution 13
2nd & Madison 69.00 115.00Transmission 14
2nd & Prescott 12.00 34.00Distribution 15
30th & Prairie 12.00 115.00Distribution 16
3rd & Van Buren 12.00 115.00Distribution 17
3rd & Van Buren 69.00 115.00 34.50Transmission 18
41st & California 12.00 115.00Distribution 19
43rd & Lorraine 12.00 115.00Distribution 20
4th & Van Buren 12.00 115.00Distribution 21
53rd & Mund 12.00 115.00Distribution 22
54th & Meriden 12.00 115.00Distribution 23
6th & Golden 12.00 115.00Distribution 24
6th Street 12.00 115.00Distribution 25
87th Street 115.00 345.00Transmission 26
95th & Waverly 12.00 115.00Distribution 27
Abilene Energy Center 34.00 115.00Transmission 28
Anzio 34.00 115.00Transmission 29
Arnold 12.00 69.00Distribution 30
Arnold 12.00 115.00Distribution 31
Arnold 69.00 115.00Transmission 32
Auburn Substation 115.00 230.00Transmission 33
Auburn Substation (Spare) 115.00 230.00Transmission 34
Baldwin Creek 12.00 115.00Distribution 35
Bonita 12.00 115.00Distribution 36
Brown County 34.00 115.00Transmission 37
Central Packaging Corp 2.40 34.50Industrial 38
Cessna Aircraft 4.00 69.00Industrial 39
Circle 115.00 230.00Transmission 40
FERC FORM NO. 1 (ED. 12-96) Page 426
20170505-8016 FERC PDF (Unofficial) 04/07/2017
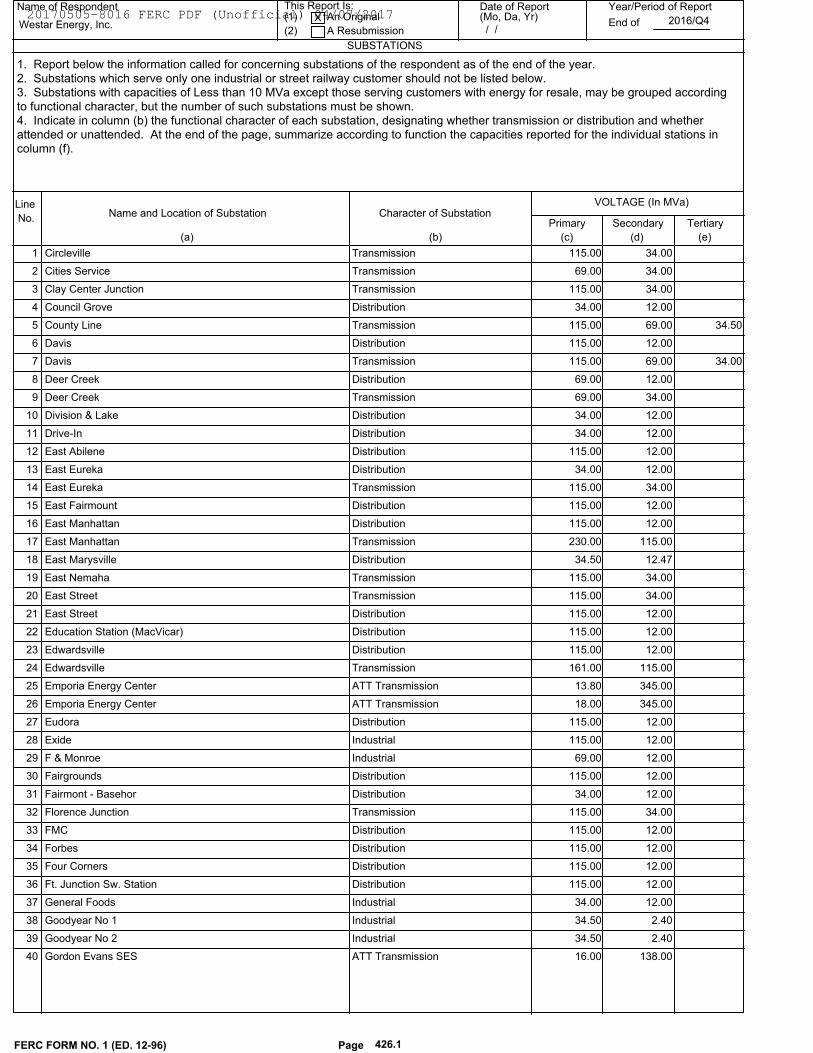
Name of Respondent This Report Is:(1) An Original
(2) A Resubmission
Date of Report(Mo, Da, Yr)
Year/Period of Report
End of
SUBSTATIONS
Westar Energy, Inc.X
/ /2016/Q4
Line
No.Name and Location of Substation
Primary
(c)(b)(a)
Tertiary
(d)
Character of Substation
(e)
Secondary
VOLTAGE (In MVa)
1. Report below the information called for concerning substations of the respondent as of the end of the year.
2. Substations which serve only one industrial or street railway customer should not be listed below.
3. Substations with capacities of Less than 10 MVa except those serving customers with energy for resale, may be grouped according
to functional character, but the number of such substations must be shown.
4. Indicate in column (b) the functional character of each substation, designating whether transmission or distribution and whether
attended or unattended. At the end of the page, summarize according to function the capacities reported for the individual stations in
column (f).
Circleville 34.00 115.00Transmission 1
Cities Service 34.00 69.00Transmission 2
Clay Center Junction 34.00 115.00Transmission 3
Council Grove 12.00 34.00Distribution 4
County Line 69.00 115.00 34.50Transmission 5
Davis 12.00 115.00Distribution 6
Davis 69.00 115.00 34.00Transmission 7
Deer Creek 12.00 69.00Distribution 8
Deer Creek 34.00 69.00Transmission 9
Division & Lake 12.00 34.00Distribution 10
Drive-In 12.00 34.00Distribution 11
East Abilene 12.00 115.00Distribution 12
East Eureka 12.00 34.00Distribution 13
East Eureka 34.00 115.00Transmission 14
East Fairmount 12.00 115.00Distribution 15
East Manhattan 12.00 115.00Distribution 16
East Manhattan 115.00 230.00Transmission 17
East Marysville 12.47 34.50Distribution 18
East Nemaha 34.00 115.00Transmission 19
East Street 34.00 115.00Transmission 20
East Street 12.00 115.00Distribution 21
Education Station (MacVicar) 12.00 115.00Distribution 22
Edwardsville 12.00 115.00Distribution 23
Edwardsville 115.00 161.00Transmission 24
Emporia Energy Center 345.00 13.80ATT Transmission 25
Emporia Energy Center 345.00 18.00ATT Transmission 26
Eudora 12.00 115.00Distribution 27
Exide 12.00 115.00Industrial 28
F & Monroe 12.00 69.00Industrial 29
Fairgrounds 12.00 115.00Distribution 30
Fairmont - Basehor 12.00 34.00Distribution 31
Florence Junction 34.00 115.00Transmission 32
FMC 12.00 115.00Distribution 33
Forbes 12.00 115.00Distribution 34
Four Corners 12.00 115.00Distribution 35
Ft. Junction Sw. Station 12.00 115.00Distribution 36
General Foods 12.00 34.00Industrial 37
Goodyear No 1 2.40 34.50Industrial 38
Goodyear No 2 2.40 34.50Industrial 39
Gordon Evans SES 138.00 16.00ATT Transmission 40
FERC FORM NO. 1 (ED. 12-96) Page 426.1
20170505-8016 FERC PDF (Unofficial) 04/07/2017
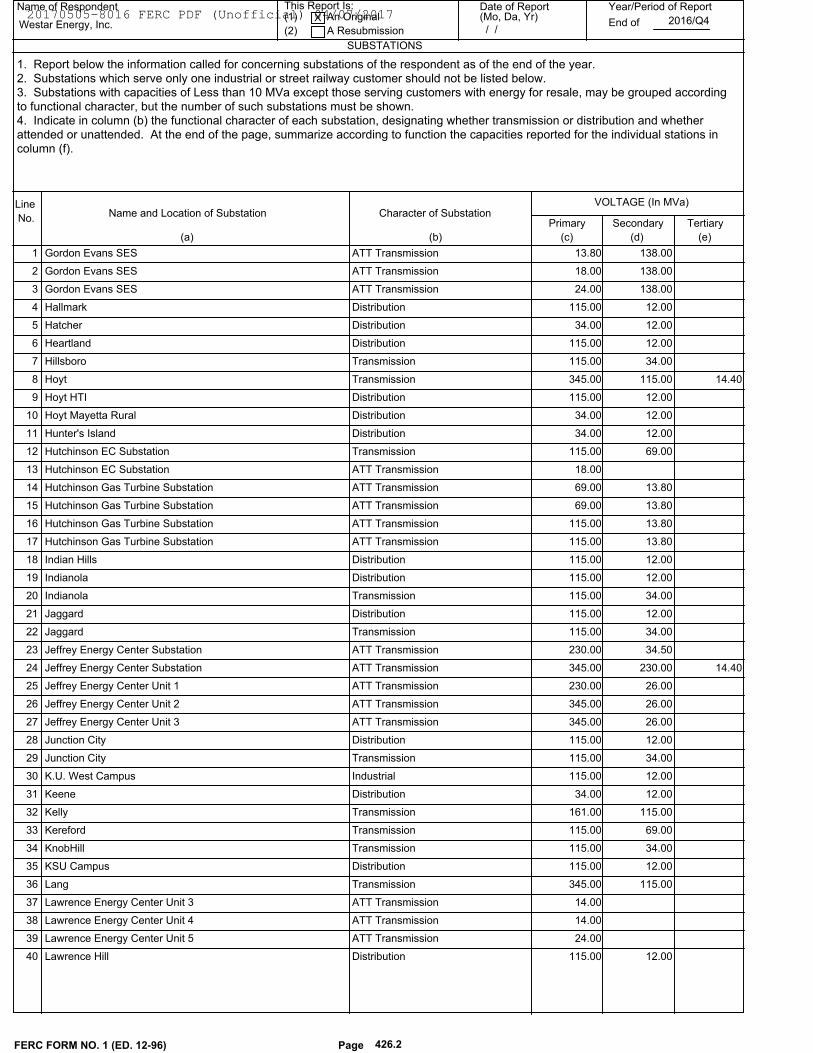
Name of Respondent This Report Is:(1) An Original
(2) A Resubmission
Date of Report(Mo, Da, Yr)
Year/Period of Report
End of
SUBSTATIONS
Westar Energy, Inc.X
/ /2016/Q4
Line
No.Name and Location of Substation
Primary
(c)(b)(a)
Tertiary
(d)
Character of Substation
(e)
Secondary
VOLTAGE (In MVa)
1. Report below the information called for concerning substations of the respondent as of the end of the year.
2. Substations which serve only one industrial or street railway customer should not be listed below.
3. Substations with capacities of Less than 10 MVa except those serving customers with energy for resale, may be grouped according
to functional character, but the number of such substations must be shown.
4. Indicate in column (b) the functional character of each substation, designating whether transmission or distribution and whether
attended or unattended. At the end of the page, summarize according to function the capacities reported for the individual stations in
column (f).
Gordon Evans SES 138.00 13.80ATT Transmission 1
Gordon Evans SES 138.00 18.00ATT Transmission 2
Gordon Evans SES 138.00 24.00ATT Transmission 3
Hallmark 12.00 115.00Distribution 4
Hatcher 12.00 34.00Distribution 5
Heartland 12.00 115.00Distribution 6
Hillsboro 34.00 115.00Transmission 7
Hoyt 115.00 345.00 14.40Transmission 8
Hoyt HTI 12.00 115.00Distribution 9
Hoyt Mayetta Rural 12.00 34.00Distribution 10
Hunter's Island 12.00 34.00Distribution 11
Hutchinson EC Substation 69.00 115.00Transmission 12
Hutchinson EC Substation 18.00ATT Transmission 13
Hutchinson Gas Turbine Substation 13.80 69.00ATT Transmission 14
Hutchinson Gas Turbine Substation 13.80 69.00ATT Transmission 15
Hutchinson Gas Turbine Substation 13.80 115.00ATT Transmission 16
Hutchinson Gas Turbine Substation 13.80 115.00ATT Transmission 17
Indian Hills 12.00 115.00Distribution 18
Indianola 12.00 115.00Distribution 19
Indianola 34.00 115.00Transmission 20
Jaggard 12.00 115.00Distribution 21
Jaggard 34.00 115.00Transmission 22
Jeffrey Energy Center Substation 34.50 230.00ATT Transmission 23
Jeffrey Energy Center Substation 230.00 345.00 14.40ATT Transmission 24
Jeffrey Energy Center Unit 1 26.00 230.00ATT Transmission 25
Jeffrey Energy Center Unit 2 26.00 345.00ATT Transmission 26
Jeffrey Energy Center Unit 3 26.00 345.00ATT Transmission 27
Junction City 12.00 115.00Distribution 28
Junction City 34.00 115.00Transmission 29
K.U. West Campus 12.00 115.00Industrial 30
Keene 12.00 34.00Distribution 31
Kelly 115.00 161.00Transmission 32
Kereford 69.00 115.00Transmission 33
KnobHill 34.00 115.00Transmission 34
KSU Campus 12.00 115.00Distribution 35
Lang 115.00 345.00Transmission 36
Lawrence Energy Center Unit 3 14.00ATT Transmission 37
Lawrence Energy Center Unit 4 14.00ATT Transmission 38
Lawrence Energy Center Unit 5 24.00ATT Transmission 39
Lawrence Hill 12.00 115.00Distribution 40
FERC FORM NO. 1 (ED. 12-96) Page 426.2
20170505-8016 FERC PDF (Unofficial) 04/07/2017

Name of Respondent This Report Is:(1) An Original
(2) A Resubmission
Date of Report(Mo, Da, Yr)
Year/Period of Report
End of
SUBSTATIONS
Westar Energy, Inc.X
/ /2016/Q4
Line
No.Name and Location of Substation
Primary
(c)(b)(a)
Tertiary
(d)
Character of Substation
(e)
Secondary
VOLTAGE (In MVa)
1. Report below the information called for concerning substations of the respondent as of the end of the year.
2. Substations which serve only one industrial or street railway customer should not be listed below.
3. Substations with capacities of Less than 10 MVa except those serving customers with energy for resale, may be grouped according
to functional character, but the number of such substations must be shown.
4. Indicate in column (b) the functional character of each substation, designating whether transmission or distribution and whether
attended or unattended. At the end of the page, summarize according to function the capacities reported for the individual stations in
column (f).
Lawrence Hill 115.00 230.00Transmission 1
Levee 12.47 115.00Distribution 2
LFM 12.00 69.00Industrial 3
LFM 14.40 69.00Industrial 4
Lindsborg Interconnect 12.00 34.00Distribution 5
Louisville 12.00 34.00Distribution 6
Mapco Sub No. 1 2.40 34.50Industrial 7
Marysville 12.00 34.00Distribution 8
Matters Corner 12.00 115.00Distribution 9
Matters Corner 34.00 115.00Transmission 10
Maur Hill 12.00 69.00Distribution 11
McDowell Creek 115.00 230.00Transmission 12
Meadowlark 12.00 115.00Distribution 13
Metropolitan 12.00 34.00Distribution 14
Midland Jct. 115.00 230.00Transmission 15
Midwest Grain 4.00 69.00Distribution 16
Monticello 12.00 115.00Distribution 17
Moonlight 34.00 115.00Transmission 18
Moonlight 12.00 115.00Distribution 19
Morris County 34.00 115.00Transmission 20
Morris County 115.00 230.00Transmission 21
Morris County 230.00 345.00 14.40Transmission 22
Moundridge 115.00 138.00Transmission 23
Mulberry Creek 12.00 34.00Distribution 24
Muscotah 34.00 69.00Transmission 25
N.W. Leavenworth 12.00 115.00Distribution 26
N.W. Leavenworth 34.00 115.00Transmission 27
New Cities Service 12.00 115.00Distribution 28
New Cities Service 69.00 115.00Transmission 29
North American Philips 12.00 115.00Industrial 30
North Central Foundry 34.00 115.00Transmission 31
North Manhattan 115.00 230.00 14.40Transmission 32
North Street 12.00 115.00Distribution 33
North Tyler 12.00 115.00Distribution 34
Northland 12.00 115.00Distribution 35
Parallel 12.00 115.00Distribution 36
Parallel 34.00 115.00Transmission 37
Pentagon 12.00 115.00Distribution 38
Quinton Heights 12.00 115.00Distribution 39
Reno County 115.00 345.00Transmission 40
FERC FORM NO. 1 (ED. 12-96) Page 426.3
20170505-8016 FERC PDF (Unofficial) 04/07/2017
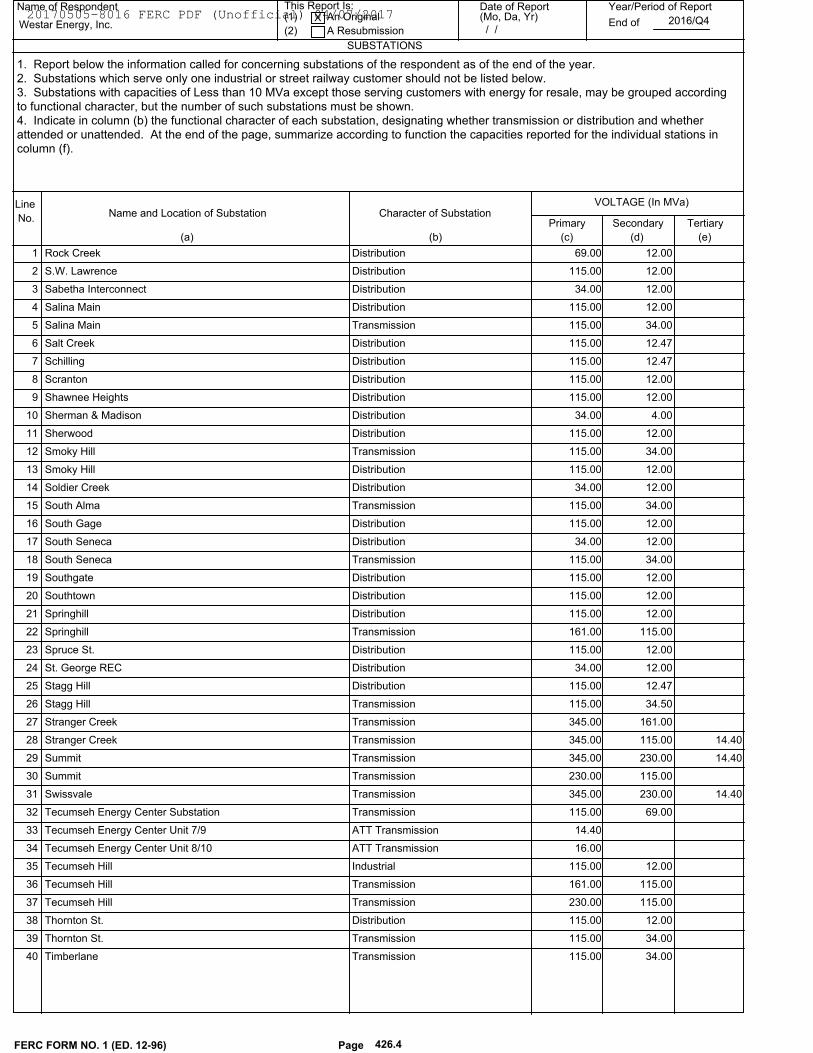
Name of Respondent This Report Is:(1) An Original
(2) A Resubmission
Date of Report(Mo, Da, Yr)
Year/Period of Report
End of
SUBSTATIONS
Westar Energy, Inc.X
/ /2016/Q4
Line
No.Name and Location of Substation
Primary
(c)(b)(a)
Tertiary
(d)
Character of Substation
(e)
Secondary
VOLTAGE (In MVa)
1. Report below the information called for concerning substations of the respondent as of the end of the year.
2. Substations which serve only one industrial or street railway customer should not be listed below.
3. Substations with capacities of Less than 10 MVa except those serving customers with energy for resale, may be grouped according
to functional character, but the number of such substations must be shown.
4. Indicate in column (b) the functional character of each substation, designating whether transmission or distribution and whether
attended or unattended. At the end of the page, summarize according to function the capacities reported for the individual stations in
column (f).
Rock Creek 12.00 69.00Distribution 1
S.W. Lawrence 12.00 115.00Distribution 2
Sabetha Interconnect 12.00 34.00Distribution 3
Salina Main 12.00 115.00Distribution 4
Salina Main 34.00 115.00Transmission 5
Salt Creek 12.47 115.00Distribution 6
Schilling 12.47 115.00Distribution 7
Scranton 12.00 115.00Distribution 8
Shawnee Heights 12.00 115.00Distribution 9
Sherman & Madison 4.00 34.00Distribution 10
Sherwood 12.00 115.00Distribution 11
Smoky Hill 34.00 115.00Transmission 12
Smoky Hill 12.00 115.00Distribution 13
Soldier Creek 12.00 34.00Distribution 14
South Alma 34.00 115.00Transmission 15
South Gage 12.00 115.00Distribution 16
South Seneca 12.00 34.00Distribution 17
South Seneca 34.00 115.00Transmission 18
Southgate 12.00 115.00Distribution 19
Southtown 12.00 115.00Distribution 20
Springhill 12.00 115.00Distribution 21
Springhill 115.00 161.00Transmission 22
Spruce St. 12.00 115.00Distribution 23
St. George REC 12.00 34.00Distribution 24
Stagg Hill 12.47 115.00Distribution 25
Stagg Hill 34.50 115.00Transmission 26
Stranger Creek 161.00 345.00Transmission 27
Stranger Creek 115.00 345.00 14.40Transmission 28
Summit 230.00 345.00 14.40Transmission 29
Summit 115.00 230.00Transmission 30
Swissvale 230.00 345.00 14.40Transmission 31
Tecumseh Energy Center Substation 69.00 115.00Transmission 32
Tecumseh Energy Center Unit 7/9 14.40ATT Transmission 33
Tecumseh Energy Center Unit 8/10 16.00ATT Transmission 34
Tecumseh Hill 12.00 115.00Industrial 35
Tecumseh Hill 115.00 161.00Transmission 36
Tecumseh Hill 115.00 230.00Transmission 37
Thornton St. 12.00 115.00Distribution 38
Thornton St. 34.00 115.00Transmission 39
Timberlane 34.00 115.00Transmission 40
FERC FORM NO. 1 (ED. 12-96) Page 426.4
20170505-8016 FERC PDF (Unofficial) 04/07/2017
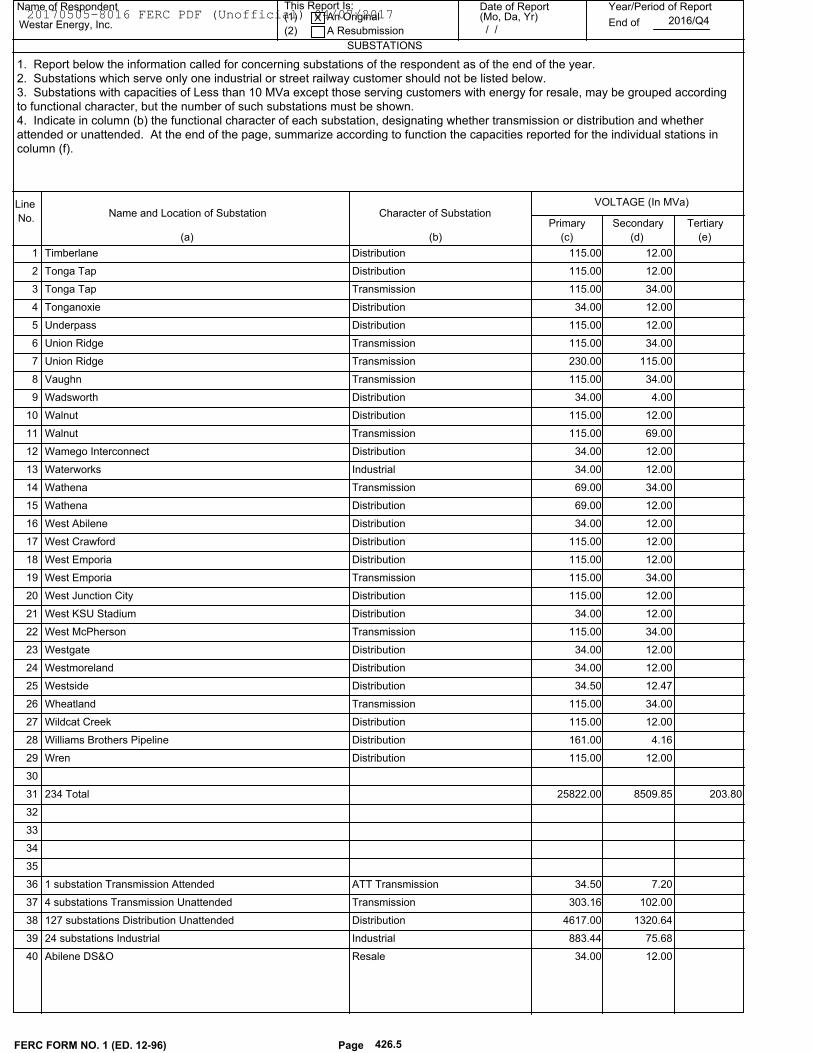
Name of Respondent This Report Is:(1) An Original
(2) A Resubmission
Date of Report(Mo, Da, Yr)
Year/Period of Report
End of
SUBSTATIONS
Westar Energy, Inc.X
/ /2016/Q4
Line
No.Name and Location of Substation
Primary
(c)(b)(a)
Tertiary
(d)
Character of Substation
(e)
Secondary
VOLTAGE (In MVa)
1. Report below the information called for concerning substations of the respondent as of the end of the year.
2. Substations which serve only one industrial or street railway customer should not be listed below.
3. Substations with capacities of Less than 10 MVa except those serving customers with energy for resale, may be grouped according
to functional character, but the number of such substations must be shown.
4. Indicate in column (b) the functional character of each substation, designating whether transmission or distribution and whether
attended or unattended. At the end of the page, summarize according to function the capacities reported for the individual stations in
column (f).
Timberlane 12.00 115.00Distribution 1
Tonga Tap 12.00 115.00Distribution 2
Tonga Tap 34.00 115.00Transmission 3
Tonganoxie 12.00 34.00Distribution 4
Underpass 12.00 115.00Distribution 5
Union Ridge 34.00 115.00Transmission 6
Union Ridge 115.00 230.00Transmission 7
Vaughn 34.00 115.00Transmission 8
Wadsworth 4.00 34.00Distribution 9
Walnut 12.00 115.00Distribution 10
Walnut 69.00 115.00Transmission 11
Wamego Interconnect 12.00 34.00Distribution 12
Waterworks 12.00 34.00Industrial 13
Wathena 34.00 69.00Transmission 14
Wathena 12.00 69.00Distribution 15
West Abilene 12.00 34.00Distribution 16
West Crawford 12.00 115.00Distribution 17
West Emporia 12.00 115.00Distribution 18
West Emporia 34.00 115.00Transmission 19
West Junction City 12.00 115.00Distribution 20
West KSU Stadium 12.00 34.00Distribution 21
West McPherson 34.00 115.00Transmission 22
Westgate 12.00 34.00Distribution 23
Westmoreland 12.00 34.00Distribution 24
Westside 12.47 34.50Distribution 25
Wheatland 34.00 115.00Transmission 26
Wildcat Creek 12.00 115.00Distribution 27
Williams Brothers Pipeline 4.16 161.00Distribution 28
Wren 12.00 115.00Distribution 29
30
234 Total 8509.85 25822.00 203.80 31
32
33
34
35
1 substation Transmission Attended 7.20 34.50ATT Transmission 36
4 substations Transmission Unattended 102.00 303.16Transmission 37
127 substations Distribution Unattended 1320.64 4617.00Distribution 38
24 substations Industrial 75.68 883.44Industrial 39
Abilene DS&O 12.00 34.00Resale 40
FERC FORM NO. 1 (ED. 12-96) Page 426.5
20170505-8016 FERC PDF (Unofficial) 04/07/2017
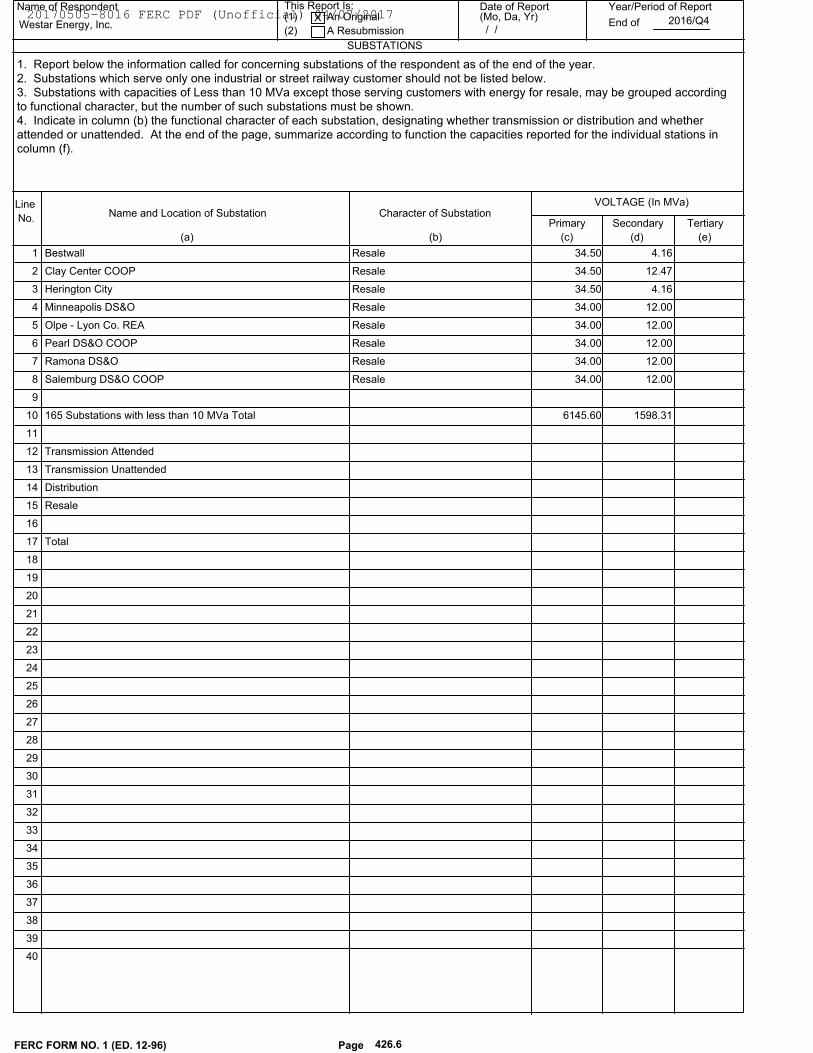
Name of Respondent This Report Is:(1) An Original
(2) A Resubmission
Date of Report(Mo, Da, Yr)
Year/Period of Report
End of
SUBSTATIONS
Westar Energy, Inc.X
/ /2016/Q4
Line
No.Name and Location of Substation
Primary
(c)(b)(a)
Tertiary
(d)
Character of Substation
(e)
Secondary
VOLTAGE (In MVa)
1. Report below the information called for concerning substations of the respondent as of the end of the year.
2. Substations which serve only one industrial or street railway customer should not be listed below.
3. Substations with capacities of Less than 10 MVa except those serving customers with energy for resale, may be grouped according
to functional character, but the number of such substations must be shown.
4. Indicate in column (b) the functional character of each substation, designating whether transmission or distribution and whether
attended or unattended. At the end of the page, summarize according to function the capacities reported for the individual stations in
column (f).
Bestwall 4.16 34.50Resale 1
Clay Center COOP 12.47 34.50Resale 2
Herington City 4.16 34.50Resale 3
Minneapolis DS&O 12.00 34.00Resale 4
Olpe - Lyon Co. REA 12.00 34.00Resale 5
Pearl DS&O COOP 12.00 34.00Resale 6
Ramona DS&O 12.00 34.00Resale 7
Salemburg DS&O COOP 12.00 34.00Resale 8
9
165 Substations with less than 10 MVa Total 1598.31 6145.60 10
11
Transmission Attended 12
Transmission Unattended 13
Distribution 14
Resale 15
16
Total 17
18
19
20
21
22
23
24
25
26
27
28
29
30
31
32
33
34
35
36
37
38
39
40
FERC FORM NO. 1 (ED. 12-96) Page 426.6
20170505-8016 FERC PDF (Unofficial) 04/07/2017
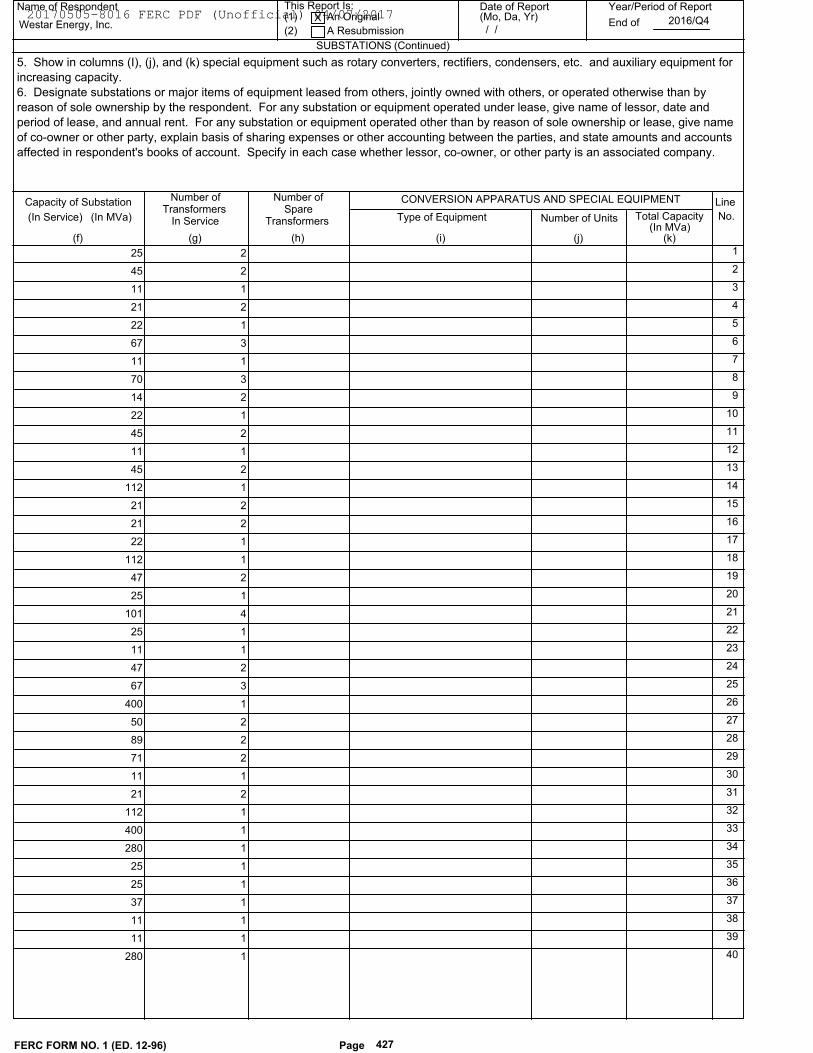
Name of Respondent This Report Is:(1) An Original
(2) A Resubmission
Date of Report(Mo, Da, Yr)
Year/Period of Report
End of
SUBSTATIONS
Westar Energy, Inc.X
/ /2016/Q4
Line
No.Number of Units
(g)(f) (h)
CONVERSION APPARATUS AND SPECIAL EQUIPMENT
(k)
Total Capacity
(Continued)
Capacity of Substation
(In Service) (In MVa)
Number ofTransformers
In ServiceSpare
Type of Equipment
Number of
Transformers(In MVa)
(i) (j)
5. Show in columns (I), (j), and (k) special equipment such as rotary converters, rectifiers, condensers, etc. and auxiliary equipment for
increasing capacity.
6. Designate substations or major items of equipment leased from others, jointly owned with others, or operated otherwise than by
reason of sole ownership by the respondent. For any substation or equipment operated under lease, give name of lessor, date and
period of lease, and annual rent. For any substation or equipment operated other than by reason of sole ownership or lease, give name
of co-owner or other party, explain basis of sharing expenses or other accounting between the parties, and state amounts and accounts
affected in respondent's books of account. Specify in each case whether lessor, co-owner, or other party is an associated company.
25 2 1
45 2 2
11 1 3
21 2 4
22 1 5
67 3 6
11 1 7
70 3 8
14 2 9
22 1 10
45 2 11
11 1 12
45 2 13
112 1 14
21 2 15
21 2 16
22 1 17
112 1 18
47 2 19
25 1 20
101 4 21
25 1 22
11 1 23
47 2 24
67 3 25
400 1 26
50 2 27
89 2 28
71 2 29
11 1 30
21 2 31
112 1 32
400 1 33
280 1 34
25 1 35
25 1 36
37 1 37
11 1 38
11 1 39
280 1 40
FERC FORM NO. 1 (ED. 12-96) Page 427
20170505-8016 FERC PDF (Unofficial) 04/07/2017

Name of Respondent This Report Is:(1) An Original
(2) A Resubmission
Date of Report(Mo, Da, Yr)
Year/Period of Report
End of
SUBSTATIONS
Westar Energy, Inc.X
/ /2016/Q4
Line
No.Number of Units
(g)(f) (h)
CONVERSION APPARATUS AND SPECIAL EQUIPMENT
(k)
Total Capacity
(Continued)
Capacity of Substation
(In Service) (In MVa)
Number ofTransformers
In ServiceSpare
Type of Equipment
Number of
Transformers(In MVa)
(i) (j)
5. Show in columns (I), (j), and (k) special equipment such as rotary converters, rectifiers, condensers, etc. and auxiliary equipment for
increasing capacity.
6. Designate substations or major items of equipment leased from others, jointly owned with others, or operated otherwise than by
reason of sole ownership by the respondent. For any substation or equipment operated under lease, give name of lessor, date and
period of lease, and annual rent. For any substation or equipment operated other than by reason of sole ownership or lease, give name
of co-owner or other party, explain basis of sharing expenses or other accounting between the parties, and state amounts and accounts
affected in respondent's books of account. Specify in each case whether lessor, co-owner, or other party is an associated company.
38 1 1
38 2 2
22 1 3
14 2 4
134 2 5
47 3 6
67 2 7
11 3 8
20 1 9
14 2 10
14 1 11
11 1 12
11 1 13
28 1 14
25 1 15
45 1 16
280 1 17
15 3 18
38 1 19
33 2 20
58 1 21
50 1 22
32 1 23
165 3 24
240 1 25
690 2 26
23 1 27
22 1 28
11 3 29
50 2 30
11 1 31
21 2 32
21 1 33
47 1 34
11 1 35
25 3 36
11 1 37
16 1 38
23 1 39
170 1 40
FERC FORM NO. 1 (ED. 12-96) Page 427.1
20170505-8016 FERC PDF (Unofficial) 04/07/2017

Name of Respondent This Report Is:(1) An Original
(2) A Resubmission
Date of Report(Mo, Da, Yr)
Year/Period of Report
End of
SUBSTATIONS
Westar Energy, Inc.X
/ /2016/Q4
Line
No.Number of Units
(g)(f) (h)
CONVERSION APPARATUS AND SPECIAL EQUIPMENT
(k)
Total Capacity
(Continued)
Capacity of Substation
(In Service) (In MVa)
Number ofTransformers
In ServiceSpare
Type of Equipment
Number of
Transformers(In MVa)
(i) (j)
5. Show in columns (I), (j), and (k) special equipment such as rotary converters, rectifiers, condensers, etc. and auxiliary equipment for
increasing capacity.
6. Designate substations or major items of equipment leased from others, jointly owned with others, or operated otherwise than by
reason of sole ownership by the respondent. For any substation or equipment operated under lease, give name of lessor, date and
period of lease, and annual rent. For any substation or equipment operated other than by reason of sole ownership or lease, give name
of co-owner or other party, explain basis of sharing expenses or other accounting between the parties, and state amounts and accounts
affected in respondent's books of account. Specify in each case whether lessor, co-owner, or other party is an associated company.
200 1 1
236 3 2
340 3 3
45 1 4
14 2 5
25 1 6
22 1 7
560 3 8
11 1 9
11 1 10
11 3 11
112 1 12
213 1 13
65 1 14
65 1 15
65 2 16
194 1 17
45 1 18
25 1 19
100 2 20
25 2 21
28 1 22
112 1 23
1120 1 24
750 2 25
750 2 26
750 1 27
21 1 28
22 1 29
11 1 30
25 1 31
167 1 32
42 1 33
75 1 34
95 4 35
280 1 36
65 3 37
15 1 38
448 1 39
95 1 40
FERC FORM NO. 1 (ED. 12-96) Page 427.2
20170505-8016 FERC PDF (Unofficial) 04/07/2017

Name of Respondent This Report Is:(1) An Original
(2) A Resubmission
Date of Report(Mo, Da, Yr)
Year/Period of Report
End of
SUBSTATIONS
Westar Energy, Inc.X
/ /2016/Q4
Line
No.Number of Units
(g)(f) (h)
CONVERSION APPARATUS AND SPECIAL EQUIPMENT
(k)
Total Capacity
(Continued)
Capacity of Substation
(In Service) (In MVa)
Number ofTransformers
In ServiceSpare
Type of Equipment
Number of
Transformers(In MVa)
(i) (j)
5. Show in columns (I), (j), and (k) special equipment such as rotary converters, rectifiers, condensers, etc. and auxiliary equipment for
increasing capacity.
6. Designate substations or major items of equipment leased from others, jointly owned with others, or operated otherwise than by
reason of sole ownership by the respondent. For any substation or equipment operated under lease, give name of lessor, date and
period of lease, and annual rent. For any substation or equipment operated other than by reason of sole ownership or lease, give name
of co-owner or other party, explain basis of sharing expenses or other accounting between the parties, and state amounts and accounts
affected in respondent's books of account. Specify in each case whether lessor, co-owner, or other party is an associated company.
280 1 1
25 3 2
11 1 3
18 1 4
11 3 5
11 1 6
12 3 7
10 1 8
45 1 9
56 2 10
11 2 11
280 1 12
50 1 13
11 3 14
280 2 15
25 2 16
25 1 17
28 1 18
45 1 19
33 3 20
280 1 21
560 1 22
350 1 23
11 1 24
20 2 25
11 1 26
27 1 27
22 1 28
56 1 29
28 1 30
11 1 31
280 1 32
14 1 33
22 1 34
36 1 35
11 1 36
28 1 37
50 1 38
45 1 39
560 2 40
FERC FORM NO. 1 (ED. 12-96) Page 427.3
20170505-8016 FERC PDF (Unofficial) 04/07/2017
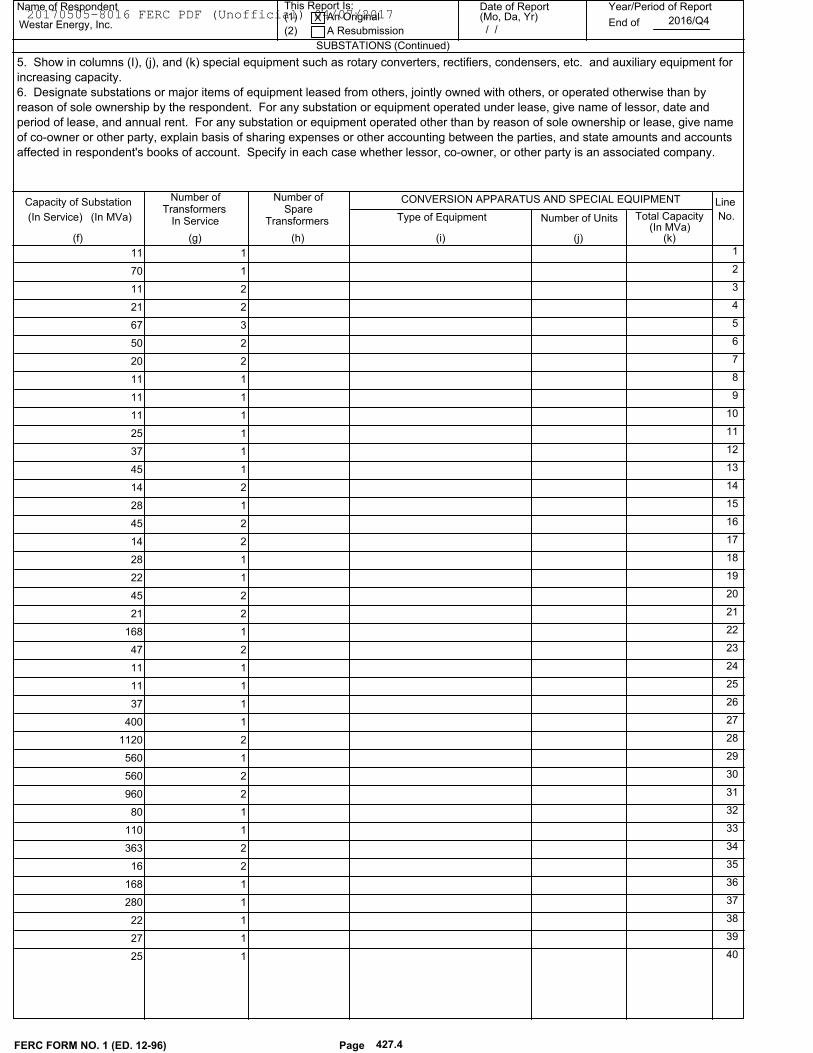
Name of Respondent This Report Is:(1) An Original
(2) A Resubmission
Date of Report(Mo, Da, Yr)
Year/Period of Report
End of
SUBSTATIONS
Westar Energy, Inc.X
/ /2016/Q4
Line
No.Number of Units
(g)(f) (h)
CONVERSION APPARATUS AND SPECIAL EQUIPMENT
(k)
Total Capacity
(Continued)
Capacity of Substation
(In Service) (In MVa)
Number ofTransformers
In ServiceSpare
Type of Equipment
Number of
Transformers(In MVa)
(i) (j)
5. Show in columns (I), (j), and (k) special equipment such as rotary converters, rectifiers, condensers, etc. and auxiliary equipment for
increasing capacity.
6. Designate substations or major items of equipment leased from others, jointly owned with others, or operated otherwise than by
reason of sole ownership by the respondent. For any substation or equipment operated under lease, give name of lessor, date and
period of lease, and annual rent. For any substation or equipment operated other than by reason of sole ownership or lease, give name
of co-owner or other party, explain basis of sharing expenses or other accounting between the parties, and state amounts and accounts
affected in respondent's books of account. Specify in each case whether lessor, co-owner, or other party is an associated company.
11 1 1
70 1 2
11 2 3
21 2 4
67 3 5
50 2 6
20 2 7
11 1 8
11 1 9
11 1 10
25 1 11
37 1 12
45 1 13
14 2 14
28 1 15
45 2 16
14 2 17
28 1 18
22 1 19
45 2 20
21 2 21
168 1 22
47 2 23
11 1 24
11 1 25
37 1 26
400 1 27
1120 2 28
560 1 29
560 2 30
960 2 31
80 1 32
110 1 33
363 2 34
16 2 35
168 1 36
280 1 37
22 1 38
27 1 39
25 1 40
FERC FORM NO. 1 (ED. 12-96) Page 427.4
20170505-8016 FERC PDF (Unofficial) 04/07/2017
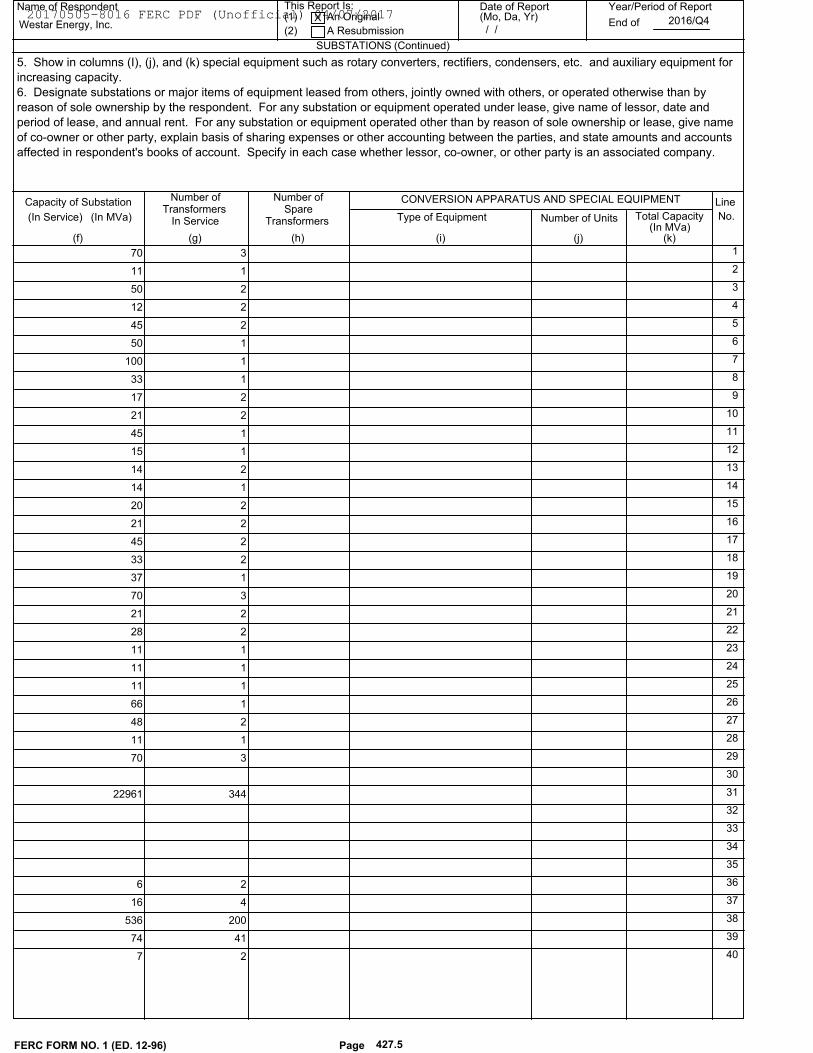
Name of Respondent This Report Is:(1) An Original
(2) A Resubmission
Date of Report(Mo, Da, Yr)
Year/Period of Report
End of
SUBSTATIONS
Westar Energy, Inc.X
/ /2016/Q4
Line
No.Number of Units
(g)(f) (h)
CONVERSION APPARATUS AND SPECIAL EQUIPMENT
(k)
Total Capacity
(Continued)
Capacity of Substation
(In Service) (In MVa)
Number ofTransformers
In ServiceSpare
Type of Equipment
Number of
Transformers(In MVa)
(i) (j)
5. Show in columns (I), (j), and (k) special equipment such as rotary converters, rectifiers, condensers, etc. and auxiliary equipment for
increasing capacity.
6. Designate substations or major items of equipment leased from others, jointly owned with others, or operated otherwise than by
reason of sole ownership by the respondent. For any substation or equipment operated under lease, give name of lessor, date and
period of lease, and annual rent. For any substation or equipment operated other than by reason of sole ownership or lease, give name
of co-owner or other party, explain basis of sharing expenses or other accounting between the parties, and state amounts and accounts
affected in respondent's books of account. Specify in each case whether lessor, co-owner, or other party is an associated company.
70 3 1
11 1 2
50 2 3
12 2 4
45 2 5
50 1 6
100 1 7
33 1 8
17 2 9
21 2 10
45 1 11
15 1 12
14 2 13
14 1 14
20 2 15
21 2 16
45 2 17
33 2 18
37 1 19
70 3 20
21 2 21
28 2 22
11 1 23
11 1 24
11 1 25
66 1 26
48 2 27
11 1 28
70 3 29
30
22961 344 31
32
33
34
35
6 2 36
16 4 37
536 200 38
74 41 39
7 2 40
FERC FORM NO. 1 (ED. 12-96) Page 427.5
20170505-8016 FERC PDF (Unofficial) 04/07/2017
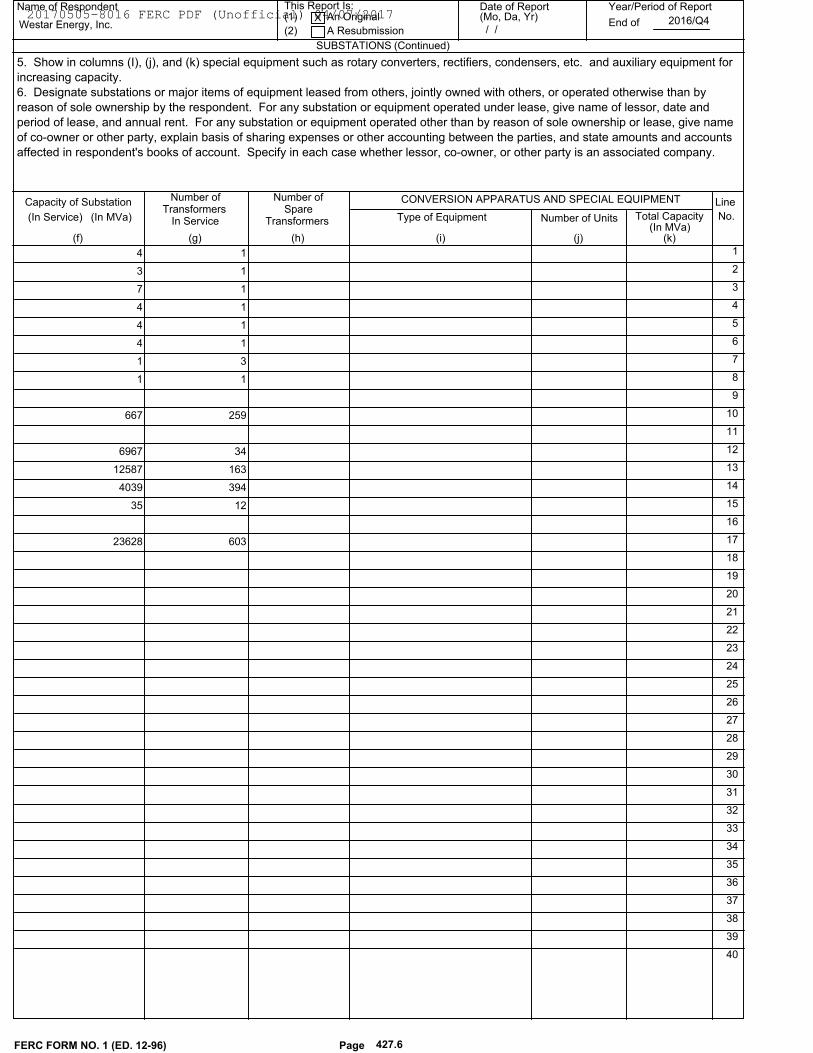
Name of Respondent This Report Is:(1) An Original
(2) A Resubmission
Date of Report(Mo, Da, Yr)
Year/Period of Report
End of
SUBSTATIONS
Westar Energy, Inc.X
/ /2016/Q4
Line
No.Number of Units
(g)(f) (h)
CONVERSION APPARATUS AND SPECIAL EQUIPMENT
(k)
Total Capacity
(Continued)
Capacity of Substation
(In Service) (In MVa)
Number ofTransformers
In ServiceSpare
Type of Equipment
Number of
Transformers(In MVa)
(i) (j)
5. Show in columns (I), (j), and (k) special equipment such as rotary converters, rectifiers, condensers, etc. and auxiliary equipment for
increasing capacity.
6. Designate substations or major items of equipment leased from others, jointly owned with others, or operated otherwise than by
reason of sole ownership by the respondent. For any substation or equipment operated under lease, give name of lessor, date and
period of lease, and annual rent. For any substation or equipment operated other than by reason of sole ownership or lease, give name
of co-owner or other party, explain basis of sharing expenses or other accounting between the parties, and state amounts and accounts
affected in respondent's books of account. Specify in each case whether lessor, co-owner, or other party is an associated company.
4 1 1
3 1 2
7 1 3
4 1 4
4 1 5
4 1 6
1 3 7
1 1 8
9
667 259 10
11
6967 34 12
12587 163 13
4039 394 14
35 12 15
16
23628 603 17
18
19
20
21
22
23
24
25
26
27
28
29
30
31
32
33
34
35
36
37
38
39
40
FERC FORM NO. 1 (ED. 12-96) Page 427.6
20170505-8016 FERC PDF (Unofficial) 04/07/2017
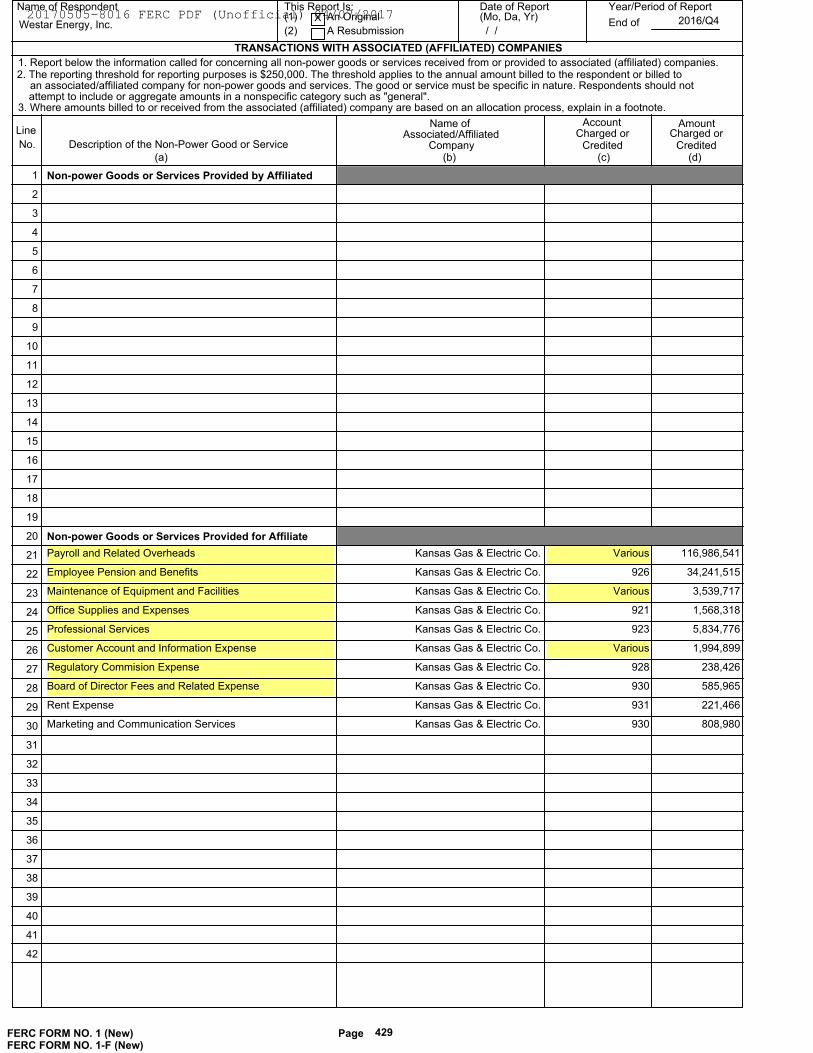
Name of Respondent This Report Is:(1) An Original
(2) A Resubmission
Date of Report(Mo, Da, Yr)
Year/Period of Report
End of
TRANSACTIONS WITH ASSOCIATED (AFFILIATED) COMPANIES
Westar Energy, Inc.X
/ /2016/Q4
Line
No. Description of the Non-Power Good or Service
Name of
(c)(b)(a) (d)
Associated/AffiliatedCompany
AccountCharged or
Credited
Amount
Credited
1. Report below the information called for concerning all non-power goods or services received from or provided to associated (affiliated) companies.2. The reporting threshold for reporting purposes is $250,000. The threshold applies to the annual amount billed to the respondent or billed to
an associated/affiliated company for non-power goods and services. The good or service must be specific in nature. Respondents should notattempt to include or aggregate amounts in a nonspecific category such as "general".
3. Where amounts billed to or received from the associated (affiliated) company are based on an allocation process, explain in a footnote.
Charged or
1 Non-power Goods or Services Provided by Affiliated
2
3
4
5
6
7
8
9
10
11
12
13
14
15
16
17
18
19
20 Non-power Goods or Services Provided for Affiliate
21 Payroll and Related Overheads 116,986,541Kansas Gas & Electric Co. Various
22 Employee Pension and Benefits 34,241,515Kansas Gas & Electric Co. 926
23 Maintenance of Equipment and Facilities 3,539,717Kansas Gas & Electric Co. Various
24 Office Supplies and Expenses 1,568,318Kansas Gas & Electric Co. 921
25 Professional Services 5,834,776Kansas Gas & Electric Co. 923
26 Customer Account and Information Expense 1,994,899Kansas Gas & Electric Co. Various
27 Regulatory Commision Expense 238,426Kansas Gas & Electric Co. 928
28 Board of Director Fees and Related Expense 585,965Kansas Gas & Electric Co. 930
29 Rent Expense 221,466Kansas Gas & Electric Co. 931
30 Marketing and Communication Services 808,980Kansas Gas & Electric Co. 930
31
32
33
34
35
36
37
38
39
40
41
42
FERC FORM NO. 1 (New) Page 429
FERC FORM NO. 1-F (New)
20170505-8016 FERC PDF (Unofficial) 04/07/2017
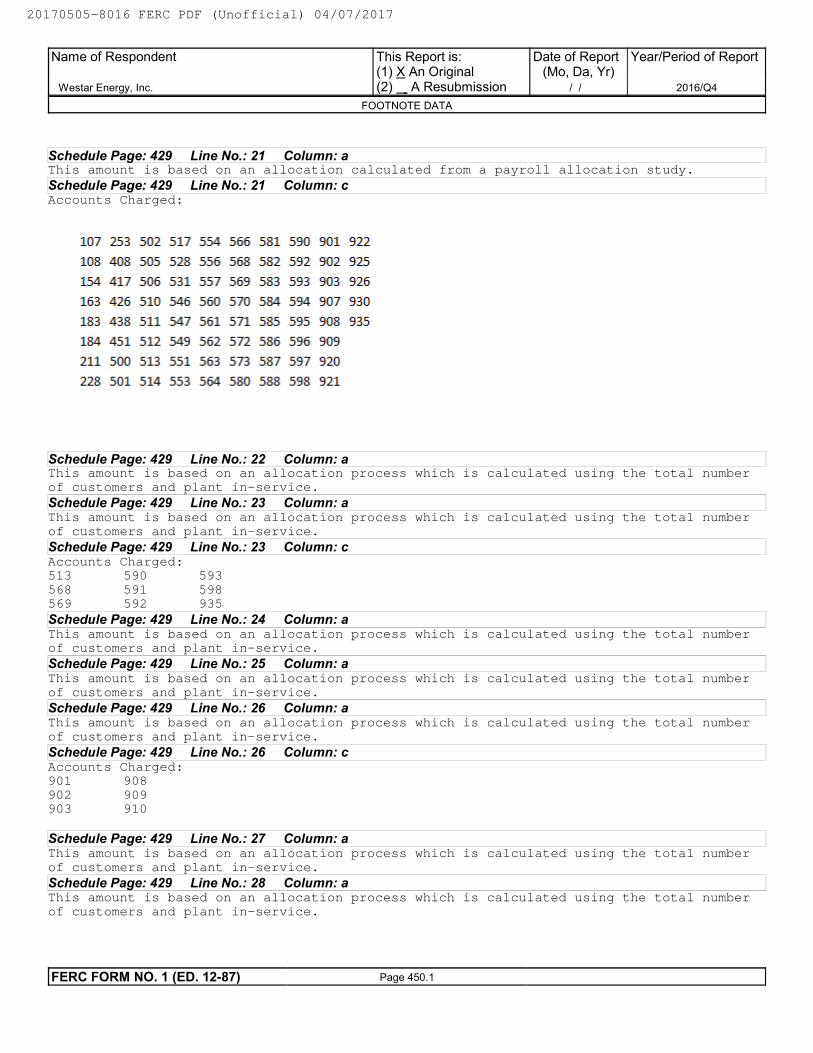
Schedule Page: 429 Line No.: 21 Column: aThis amount is based on an allocation calculated from a payroll allocation study.
Schedule Page: 429 Line No.: 21 Column: cAccounts Charged:
Schedule Page: 429 Line No.: 22 Column: aThis amount is based on an allocation process which is calculated using the total number
of customers and plant in-service.
Schedule Page: 429 Line No.: 23 Column: aThis amount is based on an allocation process which is calculated using the total number
of customers and plant in-service.
Schedule Page: 429 Line No.: 23 Column: cAccounts Charged:
513 590 593
568 591 598
569 592 935
Schedule Page: 429 Line No.: 24 Column: aThis amount is based on an allocation process which is calculated using the total number
of customers and plant in-service.
Schedule Page: 429 Line No.: 25 Column: aThis amount is based on an allocation process which is calculated using the total number
of customers and plant in-service.
Schedule Page: 429 Line No.: 26 Column: aThis amount is based on an allocation process which is calculated using the total number
of customers and plant in-service.
Schedule Page: 429 Line No.: 26 Column: cAccounts Charged:
901 908
902 909
903 910
Schedule Page: 429 Line No.: 27 Column: aThis amount is based on an allocation process which is calculated using the total number
of customers and plant in-service.
Schedule Page: 429 Line No.: 28 Column: aThis amount is based on an allocation process which is calculated using the total number
of customers and plant in-service.
Name of Respondent
Westar Energy, Inc.
This Report is:(1) X An Original(2) A Resubmission
Date of Report(Mo, Da, Yr)
/ /
Year/Period of Report
2016/Q4
FOOTNOTE DATA
FERC FORM NO. 1 (ED. 12-87) Page 450.1
20170505-8016 FERC PDF (Unofficial) 04/07/2017
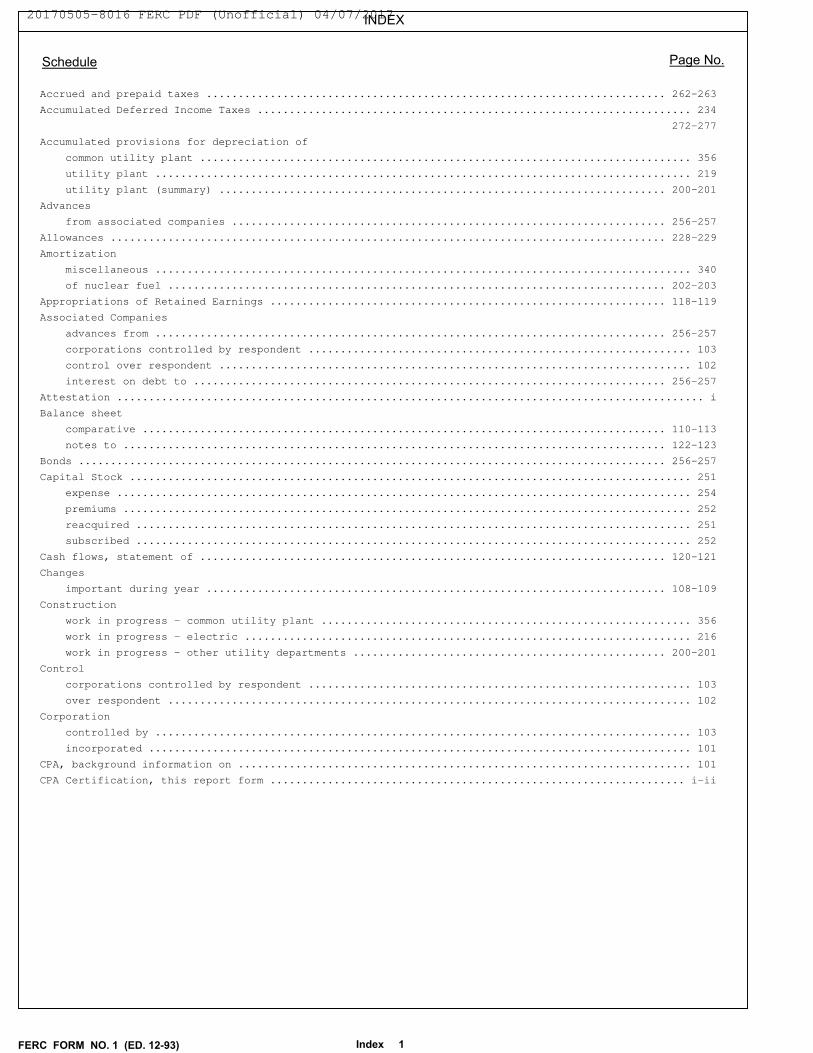
INDEX
Schedule Page No.
Accrued and prepaid taxes ........................................................................ 262-263
Accumulated Deferred Income Taxes .................................................................... 234
272-277
Accumulated provisions for depreciation of
common utility plant ............................................................................. 356
utility plant .................................................................................... 219
utility plant (summary) ...................................................................... 200-201
Advances
from associated companies .................................................................... 256-257
Allowances ....................................................................................... 228-229
Amortization
miscellaneous .................................................................................... 340
of nuclear fuel .............................................................................. 202-203
Appropriations of Retained Earnings .............................................................. 118-119
Associated Companies
advances from ................................................................................ 256-257
corporations controlled by respondent ............................................................ 103
control over respondent .......................................................................... 102
interest on debt to .......................................................................... 256-257
Attestation ............................................................................................ i
Balance sheet
comparative .................................................................................. 110-113
notes to ..................................................................................... 122-123
Bonds ............................................................................................ 256-257
Capital Stock ........................................................................................ 251
expense .......................................................................................... 254
premiums ......................................................................................... 252
reacquired ....................................................................................... 251
subscribed ....................................................................................... 252
Cash flows, statement of ......................................................................... 120-121
Changes
important during year ........................................................................ 108-109
Construction
work in progress - common utility plant .......................................................... 356
work in progress - electric ...................................................................... 216
work in progress - other utility departments ................................................. 200-201
Control
corporations controlled by respondent ............................................................ 103
over respondent .................................................................................. 102
Corporation
controlled by .................................................................................... 103
incorporated ..................................................................................... 101
CPA, background information on ....................................................................... 101
CPA Certification, this report form ................................................................. i-ii
FERC FORM NO. 1 (ED. 12-93) Index 1
20170505-8016 FERC PDF (Unofficial) 04/07/2017
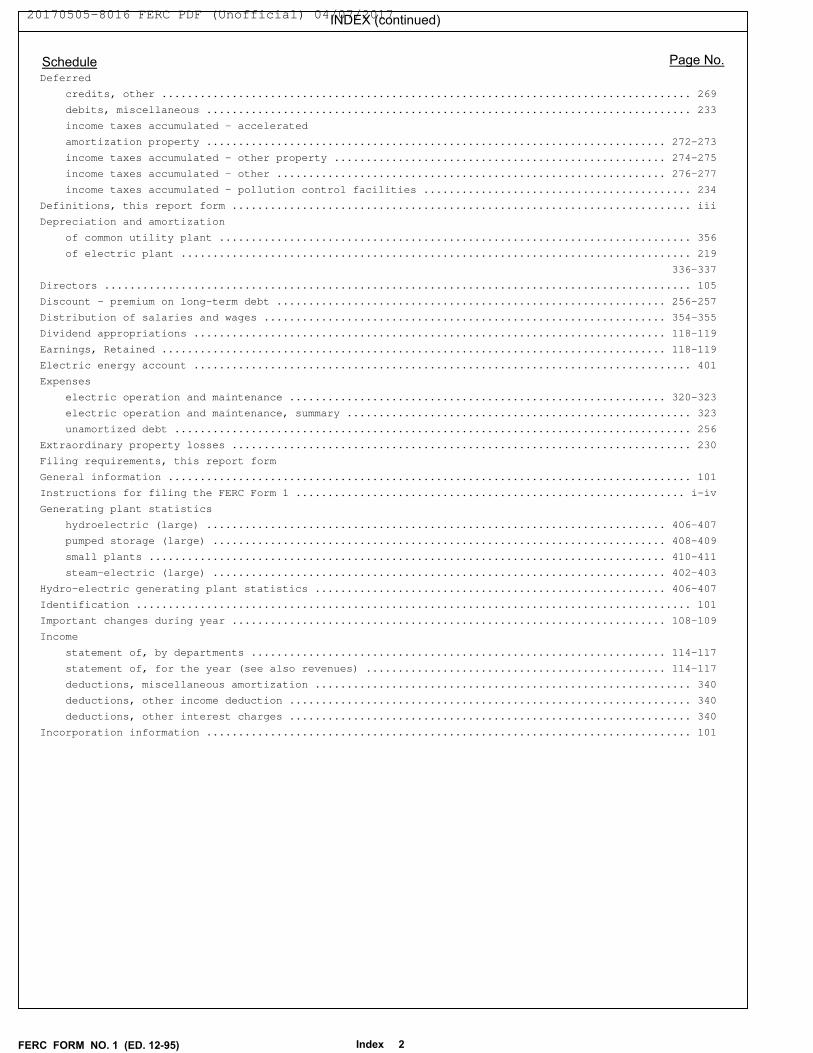
INDEX (continued)
Schedule Page No.
Deferred
credits, other ................................................................................... 269
debits, miscellaneous ............................................................................ 233
income taxes accumulated - accelerated
amortization property ........................................................................ 272-273
income taxes accumulated - other property .................................................... 274-275
income taxes accumulated - other ............................................................. 276-277
income taxes accumulated - pollution control facilities .......................................... 234
Definitions, this report form ........................................................................ iii
Depreciation and amortization
of common utility plant .......................................................................... 356
of electric plant ................................................................................ 219
336-337
Directors ............................................................................................ 105
Discount - premium on long-term debt ............................................................. 256-257
Distribution of salaries and wages ............................................................... 354-355
Dividend appropriations .......................................................................... 118-119
Earnings, Retained ............................................................................... 118-119
Electric energy account .............................................................................. 401
Expenses
electric operation and maintenance ........................................................... 320-323
electric operation and maintenance, summary ...................................................... 323
unamortized debt ................................................................................. 256
Extraordinary property losses ........................................................................ 230
Filing requirements, this report form
General information .................................................................................. 101
Instructions for filing the FERC Form 1 ............................................................. i-iv
Generating plant statistics
hydroelectric (large) ........................................................................ 406-407
pumped storage (large) ....................................................................... 408-409
small plants ................................................................................. 410-411
steam-electric (large) ....................................................................... 402-403
Hydro-electric generating plant statistics ....................................................... 406-407
Identification ....................................................................................... 101
Important changes during year .................................................................... 108-109
Income
statement of, by departments ................................................................. 114-117
statement of, for the year (see also revenues) ............................................... 114-117
deductions, miscellaneous amortization ........................................................... 340
deductions, other income deduction ............................................................... 340
deductions, other interest charges ............................................................... 340
Incorporation information ............................................................................ 101
Index 2FERC FORM NO. 1 (ED. 12-95)
20170505-8016 FERC PDF (Unofficial) 04/07/2017
INDEX (continued)
Schedule Page No.
Interest
charges, paid on long-term debt, advances, etc ............................................... 256-257
Investments
nonutility property .............................................................................. 221
subsidiary companies ......................................................................... 224-225
Investment tax credits, accumulated deferred ..................................................... 266-267
Law, excerpts applicable to this report form .......................................................... iv
List of schedules, this report form .................................................................. 2-4
Long-term debt ................................................................................... 256-257
Losses-Extraordinary property ........................................................................ 230
Materials and supplies ............................................................................... 227
Miscellaneous general expenses ....................................................................... 335
Notes
to balance sheet ............................................................................. 122-123
to statement of changes in financial position ................................................ 122-123
to statement of income ....................................................................... 122-123
to statement of retained earnings ............................................................ 122-123
Nonutility property .................................................................................. 221
Nuclear fuel materials ........................................................................... 202-203
Nuclear generating plant, statistics ............................................................. 402-403
Officers and officers' salaries ...................................................................... 104
Operating
expenses-electric ............................................................................ 320-323
expenses-electric (summary) ...................................................................... 323
Other
paid-in capital .................................................................................. 253
donations received from stockholders ............................................................. 253
gains on resale or cancellation of reacquired
capital stock .................................................................................... 253
miscellaneous paid-in capital .................................................................... 253
reduction in par or stated value of capital stock ................................................ 253
regulatory assets ................................................................................ 232
regulatory liabilities ........................................................................... 278
Peaks, monthly, and output ........................................................................... 401
Plant, Common utility
accumulated provision for depreciation ........................................................... 356
acquisition adjustments .......................................................................... 356
allocated to utility departments ................................................................. 356
completed construction not classified ............................................................ 356
construction work in progress .................................................................... 356
expenses ......................................................................................... 356
held for future use .............................................................................. 356
in service ....................................................................................... 356
leased to others ................................................................................. 356
Plant data ...................................................................................336-337
401-429
Index 3FERC FORM NO. 1 (ED. 12-95)
20170505-8016 FERC PDF (Unofficial) 04/07/2017
INDEX (continued)
Schedule Page No.
Plant - electric
accumulated provision for depreciation ........................................................... 219
construction work in progress .................................................................... 216
held for future use .............................................................................. 214
in service ................................................................................... 204-207
leased to others ................................................................................. 213
Plant - utility and accumulated provisions for depreciation
amortization and depletion (summary) ............................................................. 201
Pollution control facilities, accumulated deferred
income taxes ..................................................................................... 234
Power Exchanges .................................................................................. 326-327
Premium and discount on long-term debt ............................................................... 256
Premium on capital stock ............................................................................. 251
Prepaid taxes .................................................................................... 262-263
Property - losses, extraordinary ..................................................................... 230
Pumped storage generating plant statistics ....................................................... 408-409
Purchased power (including power exchanges) ...................................................... 326-327
Reacquired capital stock ............................................................................. 250
Reacquired long-term debt ........................................................................ 256-257
Receivers' certificates .......................................................................... 256-257
Reconciliation of reported net income with taxable income
from Federal income taxes ...................................................................... 261
Regulatory commission expenses deferred .............................................................. 233
Regulatory commission expenses for year .......................................................... 350-351
Research, development and demonstration activities ............................................... 352-353
Retained Earnings
amortization reserve Federal ..................................................................... 119
appropriated ................................................................................. 118-119
statement of, for the year ................................................................... 118-119
unappropriated ............................................................................... 118-119
Revenues - electric operating .................................................................... 300-301
Salaries and wages
directors fees ................................................................................... 105
distribution of .............................................................................. 354-355
officers' ........................................................................................ 104
Sales of electricity by rate schedules ............................................................... 304
Sales - for resale ............................................................................... 310-311
Salvage - nuclear fuel ........................................................................... 202-203
Schedules, this report form .......................................................................... 2-4
Securities
exchange registration ........................................................................ 250-251
Statement of Cash Flows .......................................................................... 120-121
Statement of income for the year ................................................................. 114-117
Statement of retained earnings for the year ...................................................... 118-119
Steam-electric generating plant statistics ....................................................... 402-403
Substations .......................................................................................... 426
Supplies - materials and ............................................................................. 227
Index 4FERC FORM NO. 1 (ED. 12-90)
20170505-8016 FERC PDF (Unofficial) 04/07/2017
INDEX (continued)
Schedule Page No.
Taxes
accrued and prepaid ......................................................................... 262-263
charged during year ......................................................................... 262-263
on income, deferred and accumulated ............................................................. 234
272-277
reconciliation of net income with taxable income for ............................................ 261
Transformers, line - electric ....................................................................... 429
Transmission
lines added during year ..................................................................... 424-425
lines statistics ............................................................................ 422-423
of electricity for others ................................................................... 328-330
of electricity by others ........................................................................ 332
Unamortized
debt discount ............................................................................... 256-257
debt expense ................................................................................ 256-257
premium on debt ............................................................................. 256-257
Unrecovered Plant and Regulatory Study Costs ........................................................ 230
Index 5FERC FORM NO. 1 (ED. 12-90)
20170505-8016 FERC PDF (Unofficial) 04/07/2017
Document Content(s)
Form120161200191.PDF..................................................1-242
20170505-8016 FERC PDF (Unofficial) 04/07/2017
Recommended